")
Back to Journals » Cancer Management and Research » Volume 9
Mesenchymal phenotype of circulating tumor cells is associated with distant metastasis in breast cancer patients
Authors Zhang SR, Wu TC, Peng XG, Liu J, Liu F, Wu SY, Liu SY, Dong Y, Xie SJ , Ma SL
Received 23 August 2017
Accepted for publication 26 October 2017
Published 23 November 2017 Volume 2017:9 Pages 691—700
DOI https://doi.org/10.2147/CMAR.S149801
Checked for plagiarism Yes
Review by Single anonymous peer review
Peer reviewer comments 4
Editor who approved publication: Professor Harikrishna Nakshatri
Shirong Zhang,1,* Tiecheng Wu,2,* Xinguo Peng,3 Jian Liu,4 Fang Liu,5 Shiyang Wu,5 Suyan Liu,5 Yan Dong,5 Shujun Xie,1 Shenglin Ma6
1Translational Medicine Research Center, Hangzhou First People’s Hospital, Nanjing Medical University, Hangzhou, China; 2Department of Oncology, PKUCare Luzhong Hospital, Zibo, China; 3Department of Laboratory, Binzhou Medical University Hospital, Binzhou, China; 4Department of Breast Surgery, Hangzhou First People’s Hospital, Nanjing Medical University, Hangzhou, China; 5SurExam Bio-Tech Co., Guangzhou, China; 6Department of Oncology, Hangzhou First People’s Hospital, Nanjing Medical University, Hangzhou, China
*These authors contributed equally to this work
Abstract: In this study, we investigated the relationship between the epithelial–mesenchymal transition phenotype of circulating tumor cells (CTCs) and distant metastasis in breast cancer patients. We analyzed the expression of epithelial (epithelial cell adhesion molecule, cytokeratin [CK]8, CK18 and CK19) and mesenchymal (vimentin and TWIST1) markers in CTCs from a large cohort of Chinese breast cancer patients (N=1083) using Canpatrol™ CTC assays. We identified CTCs in 84.9% (920/1083) of the breast cancer patients enrolled in this study. Among these 920 patients, 547 showed epithelial CTCs, 793 showed biphenotypic CTCs and 516 showed mesenchymal CTCs. Receiver operating characteristic (ROC) curves demonstrated circulation of both biphenotypic and mesenchymal CTCs (area under ROC curve value: 0.728; sensitivity: 68.7% and specificity: 71.6%) in patients was associated with distant metastasis. These findings demonstrate that the epithelial–mesenchymal transition phenotype of CTCs is a potential biomarker predictive of distant metastasis in breast cancer.
Keywords: breast cancer, circulating tumor cells, epithelial–mesenchymal transition, distant metastasis, prediction
Introduction
Breast cancer is a heterogeneous disease1–4 with 10 different subtypes based on gene copy number and expression analyses.4 Breast cancer is also classified according to immunohistochemical expression of estrogen receptor (ER), progesterone receptor (PR) and HER2 into five subtypes, that is, luminal A, luminal B, HER2-positive, basal-like and claudin-low.3 In general, luminal subtypes metastasize to the bone, whereas HER2-positive tumors preferentially metastasize to the liver; the basal-like and claudin-low subtypes aggressively spread to the brain and lungs.5 Since the metastatic disease accounts for nearly 90% of breast cancer deaths, new biomarkers that accurately predict metastasis are important to improve disease management.6
Epithelial–mesenchymal transition (EMT) is a critical process for cancer progression that involves downregulation of epithelial markers such as epithelial cell adhesion molecule (EpCAM) and cytokeratins (CKs) and upregulation of mesenchymal markers such as vimentin and TWIST1 in tumor cells.7,8 Patient tissue samples and cell lines demonstrate distinct EMT features characteristic of the different subtypes of breast cancer. The highly invasive claudin-low tumors are enriched in mesenchymal and stem cell-like features9 and show absence or low expression of epithelial markers.10,11 The basal-like tumors exhibit both epithelial and mesenchymal features,10,12 which correlate with their metastatic character.12 On the contrary, the luminal and HER2-positive subtypes are poorly invasive9 and show high expression of epithelial markers and absence or low expression of mesenchymal markers.10 In some cases, luminal and HER2-positive subtypes are associated with increased invasiveness when they undergo EMT changes.13–15 Willipinski-Stapelfeldt et al demonstrated that EMT changes in primary tumors were associated with the aggressive behavior of breast cancer cells.16 These studies suggested a mechanistic link between EMT (loss of epithelial markers and gain of mesenchymal markers) and tumor progression.
Many studies have demonstrated EMT in subpopulations of circulating tumor cells (CTCs) in breast cancer.17–24 CTCs from patients with lobular type cancers (typically ER+/PR+) are predominantly epithelial, whereas those from the triple-negative, basal-like, claudin-low and HER2-positive subtypes are predominantly mesenchymal.24 The mesenchymal CTCs are associated with poor prognosis,22 metastasis and resistance to chemotherapy.24 These studies suggest the potential prognostic value of CTCs in breast cancer. However, there are several limitations in these studies, such as: lack of definitive markers to identify subpopulations of CTCs with EMT phenotype, lack of clinical validation of CTC detection technology, and limited sample size. Therefore, comprehensive analysis of CTC subpopulations with a set of definitive EMT markers and a clinically feasible CTC detection technique is necessary in a large cohort of breast cancer patients.
The Canpatrol™ CTC assay (SurExam, Guangzhou, China) is a filter-based method that uses a cocktail of epithelial (EpCAM and CK8/18/19) and mesenchymal (vimentin and TWIST1) markers to classify CTCs into epithelial, biphenotypic (both epithelial and mesenchymal) and mesenchymal subtypes in a broad range of carcinomas including breast cancer.25 However, CTCs in breast cancer have not been analyzed with the Canpatrol CTC assay. Therefore, we characterized the EMT phenotype in breast cancer cell lines and CTCs isolated from peripheral blood samples of a large cohort of Chinese breast cancer patients with the Canpatrol CTC technique.
Patients and methods
Patient enrollment and blood collection
This study was approved by the ethics committees of Hangzhou First People’s Hospital, PKUCare Luzhong Hospital, and Binzhou Medical University Hospital. Female patients, aged between 18 and 70 years, who were pathologically diagnosed with breast cancer without any history of other malignant tumors or inflammation diseases were recruited for this study. We collected 5 mL of peripheral blood from each patient in EDTA tubes by venipuncture and stored the sample at 4°C until cell isolation, which was performed within 4 h. Blood samples were collected before surgery or other treatments. Alternatively, blood samples were collected during the chemotherapy treatment intervals for patients who had not been treated with radical surgery. Peripheral blood samples were also collected from female patients (age range: 19–70 years) who were pathologically diagnosed with benign breast diseases such as cyclomastopathy and galactoma, but did not include breast inflammation diseases, malignant tumor history or inflammation diseases. Peripheral blood samples from healthy volunteers were used for spiking assays. All the subjects were recruited from December 2014 to March 2016, and written informed consent was obtained from all the subjects before their enrollment.
Cell lines and cell culture
We obtained MCF-7 and MDA-MB-453 cell lines from the American Type Culture Collection (Manassas, VA, USA) for this study. The MCF-7 cell line is derived from a pleural effusion of a patient with breast adenocarcinoma and retains several characteristics of differentiated mammary epithelium.26 The MDA-MB-453 cell line is derived from an effusion of a patient with metastatic carcinoma of the breast including the nodes, brain as well as pleural and pericardial cavities.27 Both MCF-7 and MDA-MB-453 cell lines were cultured in Roswell Park Memorial Institute 1640 medium (Thermo Fisher Scientific, Waltham, MA, USA) with 10% fetal bovine serum (Thermo Fisher Scientific) and 1% penicillin– streptomycin (Thermo Fisher Scientific) at 37°C and 5% CO2. Sub-cultivation of the cell lines was performed using 0.25% trypsin (Sigma-Aldrich Co., St Louis, MO, USA) and 5 mM EDTA (Sigma-Aldrich Co.). Cells in logarithmic growth phase or at 80% confluence were harvested with trypsin and used for experiments.
Isolation and classification of CTCs
CTCs were isolated by the Canpatrol CTC assay (SurExam) and classified as previously described.25 Peripheral blood samples were treated with erythrocyte lysis buffer within 4 h after venopunction and filtered with an 8 μm diameter pore-calibrated membrane (EMD Millipore, Billerica, MA, USA) to enrich the CTCs. Then, the CTCs were subjected to RNA in situ hybridization with a combination of epithelial (EpCAM and CK8/18/19) and mesenchymal (vimentin and TWIST1) markers. Finally, the samples were stained with 4′,6-diamidino-2-phenylindole (Sigma-Aldrich Co.) and analyzed with an automated imaging fluorescent microscope (Carl Zeiss Meditec AG, Jena, Germany). Then, the CTCs from each patient were classified based on the identification of the markers.
Statistical analysis
Statistical analysis was performed with SPSS 17.0 software package (SPSS Inc., Chicago, IL, USA). Spearman’s rank correlation analysis was used to assess the correlation between two variables. The Mann–Whitney U or Kruskal–Wallis tests were used to analyze non-normally distributed data. Receiver operating characteristic (ROC) curves and the area under the curve (AUC) were used to evaluate the diagnostic and predictive power of different subsets of CTCs. The Youden index was used to select optimal cutoff values that represented the threshold value when sensitivity + specificity–1 was maximal. Binary logistic regression analysis was used to establish the diagnostic or predictive models for different CTC populations. All statistical analyses were two-sided, and P<0.05 was designated as statistically significant.
Results
Expression of epithelial and mesenchymal markers in breast cancer cell lines and leukocytes from healthy blood volunteers
We evaluated the EMT status of breast cancer cell lines in vitro by adding 100 MCF-7 or MDA-MB-453 cells to each blood sample (5 mL) from the healthy volunteers. We spiked each cell line thrice for analyzing each epithelial or mesenchymal marker. EpCAM, CK8/18/19, vimentin and TWIST1 were expressed in both MCF-7 and MDA-MB-453 cells and absent in leukocytes (Figure 1). CD45 was expressed in leukocytes and absent in breast tumor cell lines (Figure 1). These results demonstrated that a combination of EpCAM, CK8/18/19, vimentin and TWIST1 as well as the leukocyte marker CD45 distinguished breast tumor cells from leukocytes and could be used to characterize circulating breast tumor cells.
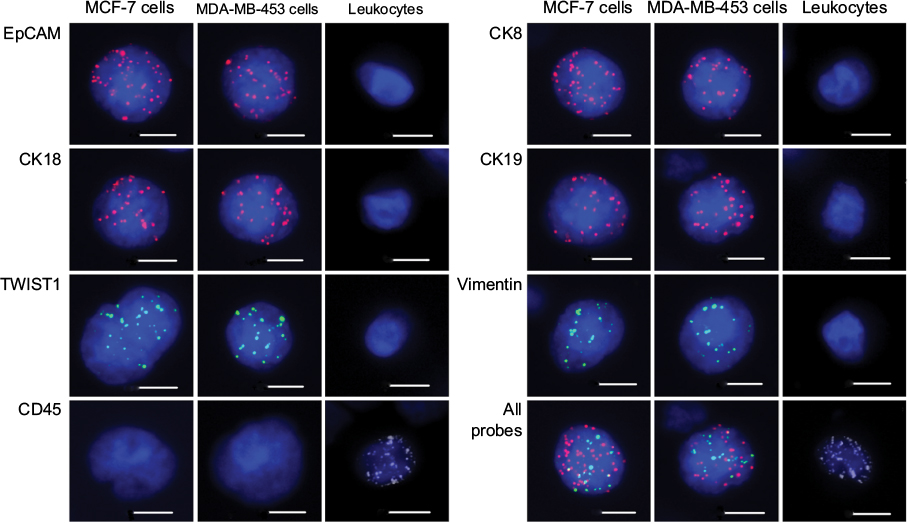 | Figure 1 Expression of epithelial and mesenchymal markers in MCF-7 cells, MDA-MB-453 cells and leukocytes. Notes: Representative images show expression of EpCAM, CK18, TWIST1, CD45, CK8, CK19, vimentin and a combination of all probes in MCF-7 and MDA-MB-453 breast cancer cells as well as control leukocytes by RNA in situ hybridization assay. The nuclei were stained with DAPI (blue). EpCAM, CK18, CK8 and CK19 are epithelial markers, whereas vimentin and TWIST1 are mesenchymal markers. CD45 is a leukocyte marker. Scale bars =10 µm. Abbreviations: CK, cytokeratin; DAPI, 4′,6-diamidino-2-phenylindole; EpCAM, epithelial cell adhesion molecule. |
Distinguishing the EMT phenotype of CTCs from benign breast disease and breast cancer patients
EMT phenotype changes in CTCs were analyzed in blood samples isolated from 26 benign breast disease patients and 67 breast cancer patients. Distant metastasis was determined by clinical analysis, radiography and histology based on TNM staging system. Among the 67 patients with breast cancer, 46 patients showed no distant metastasis and 21 patients showed distant metastasis. Moreover, 73 of 93 blood samples were characterized as CTC positive (≥1 CTC/5 mL blood) by the Canpatrol CTC assay with EMT markers. The CTC-positive rate in patients with benign breast disease, non-distant metastatic breast cancer patients (M0) and distant metastatic breast cancer patients (M1) was 46.2% (12/26), 87.0% (40/46) and 100% (21/21), respectively (P<0.001; Figure 2A). Furthermore, total number of CTCs in benign breast disease patients (0.81) was lower than in M0 and M1 breast cancer patients (7.78 in M0 and 7.76 in M1; P<0.001 compared to benign disease patients; Figure 2B). The total numbers of CTCs in the M0 and M1 breast cancer patients were similar (P>0.05; Figure 2B).
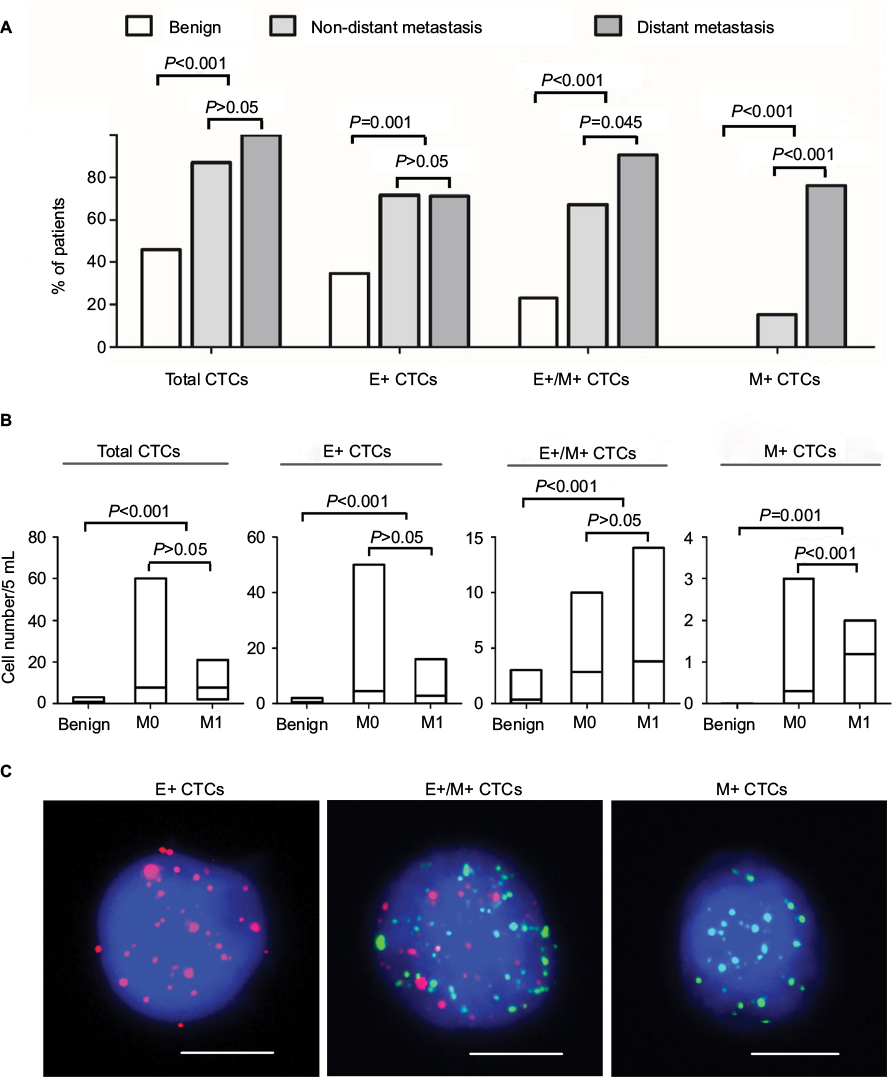 | Figure 2 Analysis of CTCs in blood samples from patients with benign breast disease and breast cancer with or without distant metastasis. Notes: (A) Bar graphs represent percentage of breast cancer patients with or without distant metastasis and benign breast disease that show total, E+, E+/M+ and M+ CTCs. (B) The bar graphs show number of total, E+, E+/M+ and M+ CTCs in benign breast disease patients and breast cancer patients with or without distant metastasis. M0 denotes non-distant metastasis, whereas M1 denotes distant metastasis. The lines inside the bars denote the mean values. (C) Representative fluorescence images show RNA in situ hybridization of E+, E+/M+ and M+ CTCs. Scale bars =10 µm. Abbreviations: CTC, circulating tumor cells; E+ CTCs, exclusively epithelial CTCs; E+/M+ CTCs, biphenotypic epithelial/mesenchymal CTCs; M+ CTCs, exclusively mesenchymal CTCs. |
Based on the EMT markers, the CTCs from breast cancer patients were classified into three subpopulations: epithelial (E+), biphenotypic (E+/M+) and mesenchymal (M+), as shown in Figure 2C. These three CTC subpopulations were predominant in breast cancer patients (M0: 71.7%, 67.4% and 15.2%, respectively; M1: 71.4%, 90.5% and 76.2%, respectively) and rare in benign breast disease (34.6%, 23.1% and 0%, respectively; P<0.05 in all three subpopulations; Figure 2A). Furthermore, E+/M+ and M+ CTCs were more common in M1 than in M0 breast cancer patients (P=0.045 and P<0.001, respectively; Figure 2A). The mean numbers of E+, E+/M+ and M+ CTCs were 4.63, 2.85 and 0.30 in M0 and 2.76, 3.81 and 1.19 in M1 breast cancer patients, respectively (Figure 2B). These numbers were higher than in patients with benign breast disease (0.46, 0.35 and 0; P<0.05 in all cases; Figure 2B). Moreover, M+ CTC numbers were higher in M1 than in M0 breast cancer patients (P<0.001; Figure 2B).
We then performed ROC curve analyses to evaluate the diagnostic and predictive potential of the CTC populations. Total CTCs displayed the highest AUC (0.886; 95% CI: 0.821–0.951; P<0.001) compared to E+ (AUC: 0.751), E+/M+ (AUC: 0.808) and M+ (AUC: 0.672) CTCs in discriminating breast cancer and benign breast disease patients (Figure 3A). Moreover, at the optimal cutoff value of 3 for total CTC numbers, the sensitivity and specificity were 76.1% and 92.3%, respectively (Figure 3A). This indicated that patients with malignant breast cancer showed total CTC number ≥3 cells/5 mL blood.
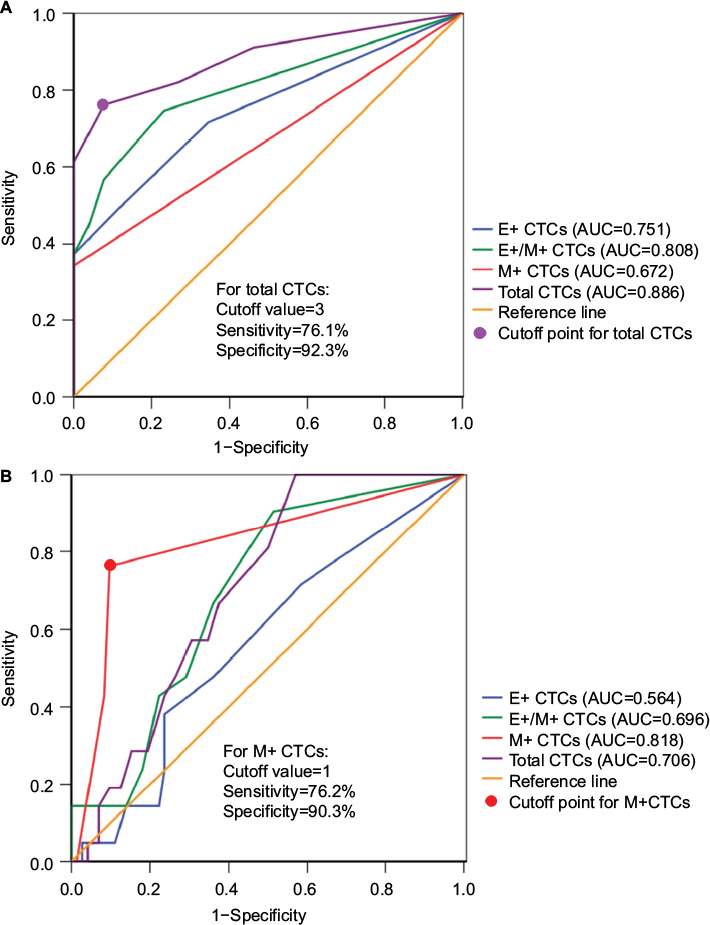 | Figure 3 ROC curve analyses of CTC subsets in patients with benign breast disease and breast cancer. Notes: (A) ROC curves for total, E+, E+/M+ and M+ CTCs are shown to discriminate breast cancer patients from benign breast disease patients. As shown in the figure, total CTCs show the highest AUC value. (B) ROC curves for total, E+, E+/M+ and M+ CTCs to discriminate distant from non-distant metastasis (benign breast disease and breast cancer without distant metastasis) are shown. The M+ CTCs showed the highest AUC value. Abbreviations: AUC, area under the curve; CTCs, circulating tumor cells; ROC, receiver operating characteristic; E+ CTCs, exclusively epithelial CTCs; E+/M+ CTCs, biphenotypic epithelial/mesenchymal CTCs; M+ CTCs, exclusively mesenchymal CTCs. |
Next, we analyzed the predictive potential of CTC numbers in distinguishing breast cancer with distant metastasis from breast cancer without distant metastasis and benign breast disease. As shown in Figure 3B, the M+ CTCs showed the highest AUC value of 0.818 (95% CI: 0.703–0.933; P<0.001) compared to total (AUC: 0.706), E+/M+ (AUC: 0.696) and E+ (AUC: 0.564) CTCs. The M+ CTCs showed a sensitivity of 76.2% and specificity of 90.3% at the cutoff value of 1 (Figure 3B). This suggested that breast cancer patients with distant metastasis are characterized by high M+ CTC numbers.
Phenotypic characterization of CTCs in a large breast cancer patient cohort
We characterized CTCs in a large cohort of breast cancer patients. Among the 1083 breast cancer patients enrolled in the study, 364 (33.6%) showed distant metastasis. We detected CTCs in 920 out of 1083 patients (84.9% with ≥1 CTC in 5 mL blood; Table 1). The total number of CTCs ranged from 0 to 139 (median: 4; mean±SD: 8.33±12.35; Table 1). E+, E+/M+ and M+ CTCs were detected in 50.5% (547/1083), 73.2% (793/1083) and 47.6% (516/1083) of the breast cancer patients, respectively (Table 1). The E+, E+/M+ and M+ CTC numbers ranged 0–55 (median: 1; mean±SD: 1.66±3.60), 0–91 (median: 2; mean±SD: 5.11±8.76) and 0–29 (median: 0; mean±SD: 1.56±3.09), respectively (Table 1).
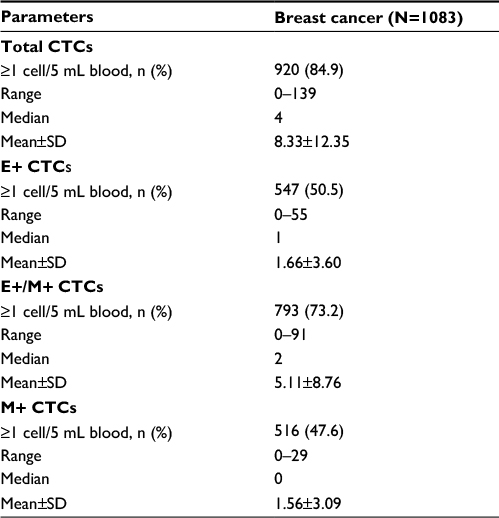 | Table 1 Characterization of CTCs in a large cohort of Chinese breast cancer patients Abbreviations: CTCs, circulating tumor cells; E+ CTCs, exclusively epithelial CTCs; E+/M+ CTCs, biphenotypic epithelial/mesenchymal CTCs; M+ CTCs, exclusively mesenchymal CTCs. |
Relationship of CTC phenotype with metastatic status of breast cancer
Next, we evaluated the relationship between CTC numbers and metastatic status of breast cancer. The incidence of CTCs was associated with distant metastasis in M0 (82.5% CTC+) and M1 (89.8% CTC+) breast cancer patients (P=0.001; Figure 4A). Moreover, we observed the correlation between CTC numbers and distant metastasis, with the mean number of CTCs being 6.24 and 12.44 in M0 and M1 breast cancer patients, respectively (P<0.001; Figure 4B).
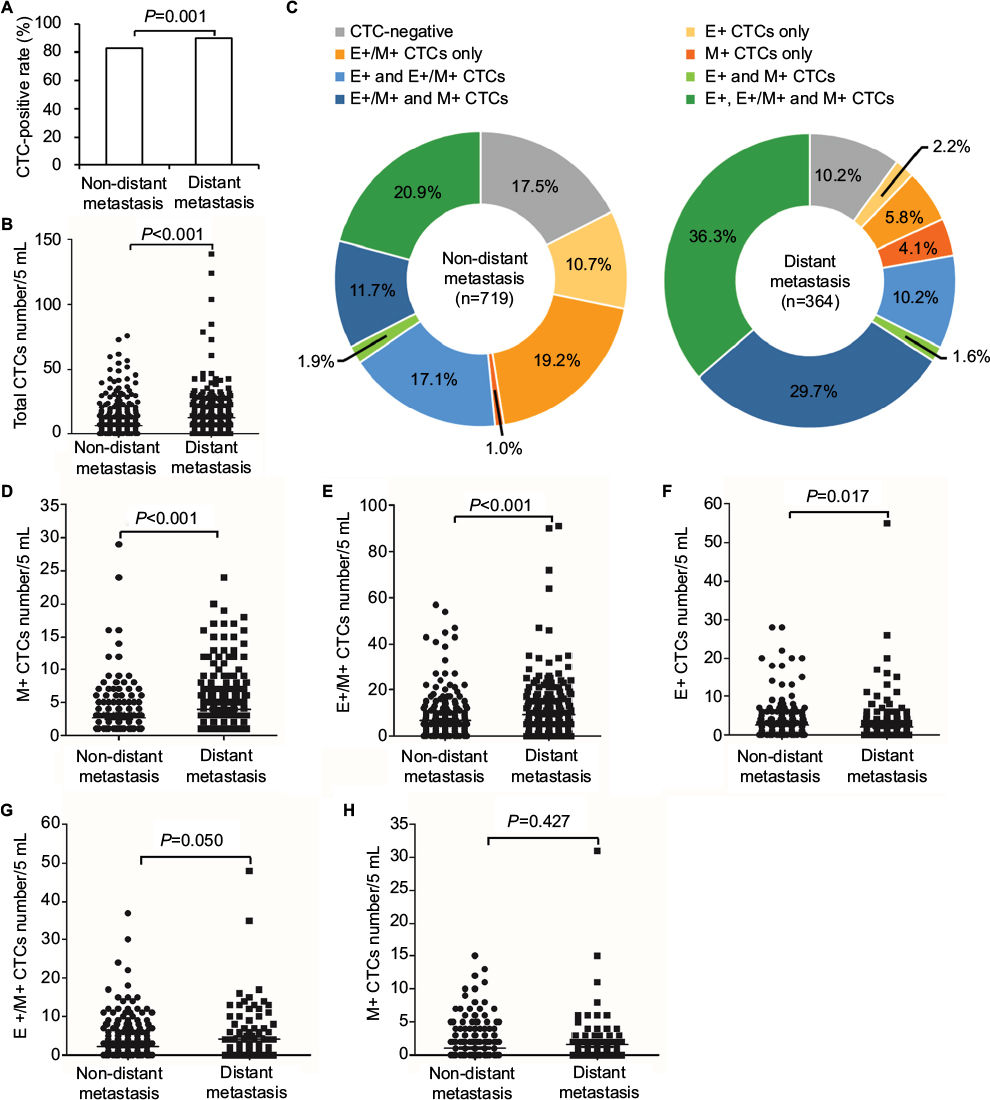 | Figure 4 Relationship of CTC populations with metastatic status of breast cancer. Notes: (A) Bar graph shows the incidence of CTCs (percentage of patients who were CTC positive) in non-distant and distant metastatic breast cancer patients. (B) Dot plot shows total CTC numbers in non-distant and distant metastatic breast cancer patients. Each dot represents a single patient. (C) Pie charts show the percentage of different CTC populations in non-distant (n=719) and distant (n=364) metastasis patients. (D–F) Dot plots show (D) M+, (E) E+/M+ and (F) E+ CTC numbers in non-distant and distant metastatic breast cancer patients with M+ CTCs. (G and H) Dot plots show (G) E+/M+ and (H) E+ CTC numbers in non-distant and distant metastatic breast cancer patients without M+ CTCs. Abbreviations: CTCs, circulating tumor cells; E+ CTCs, exclusively epithelial CTCs; E+/M+ CTCs, biphenotypic epithelial/mesenchymal CTCs; M+ CTCs, exclusively mesenchymal CTCs. |
As shown in Figure 4C, the distribution of three CTC subpopulations in breast cancer patients varied with metastatic status. Among the 719 M0 breast cancer patients, E+, E+/M+ and M+ CTCs were detected in 10.7%, 19.2% and 1.0% patients, respectively. Moreover, 17.1% patients showed both E+ and E+/M+ CTCs, 1.9% showed both E+ and M+ CTCs, 20.9% showed E+/M+ and M+ CTCs and 20.9% showed all three CTC subpopulations (Figure 4C). Among the 364 M1 patients, 2.2% patients showed E+ CTCs only, 5.8% showed E+/M+ CTCs only, 4.1% showed M+ CTCs only, 10.2% showed both E+ and E+/M+ CTCs, 1.6% showed both E+ and M+ CTCs, 29.7% showed both E+/M+ and M+ CTCs and 36.3% showed all three CTC subpopulations (Figure 4C). The M+ CTCs were observed in 35.5% of M0 breast cancer patients and 71.7% of M1 breast cancer patients. These results demonstrate that M1 patients showed increased numbers of M+ CTCs compared to M0 patients.
In the patients with M+ CTCs, the mean number of M+ CTCs was 2.61 in M0 and 3.92 in M1 patients (P<0.001; Figure 4D), whereas the mean number of E+/M+ CTCs was 6.65 in M0 and 9.20 in M1 patients (P<0.001; Figure 4E). Moreover, in the M+ CTC-positive patients, the mean numbers of E+ CTCs were 2.49 and 1.97 in M0 and M1 patients, respectively (P=0.017; Figure 4F).
In patients without M+ CTCs, we observed statistically insignificant, but a trend toward an, association between E+/M+ CTC numbers and distant metastasis with a mean value of 2.19 and 4.16 in M0 and M1 patients, respectively (P=0.050; Figure 4G). Moreover, the mean number of E+ CTCs in patients without M+ CTCs was 1.04 and 1.60 in M0 and M1 patients, respectively (P=0.427; Figure 4H).
These data demonstrate that E+/M+ and M+ CTC numbers distinguish M0 and M1 breast cancer patients, thus establishing a correlation with distant metastasis.
Phenotypic characterization of CTCs for prediction of distant metastasis
Finally, we evaluated if CTCs predicted distant metastasis. Among the three CTC subpopulations, E+/M+ and M+ CTCs distinguished distant metastasis from non-distant metastasis with AUC of 0.656 (95% CI: 0.621–0.691; P<0.001) for E+/M+ CTCs (Figure 5A) and 0.709 (95% CI: 0.675–0.742; P<0.001) for M+ CTCs (Figure 5B). At the cutoff value of 3 for E+/M+ CTCs, the sensitivity and specificity were 62.9% and 64.8%, respectively, whereas for M+ CTCs, the sensitivity and specificity were 71.7% and 64.5%, respectively, at a cutoff of 1. This suggested that when the numbers of E+/M+ and M+ CTCs were ≥3 cells/5 mL blood and ≥1 cell/5 mL blood, respectively, this reflected disease progression. However, E+ CTC numbers were similar for both M0 and M1 breast cancer patients.
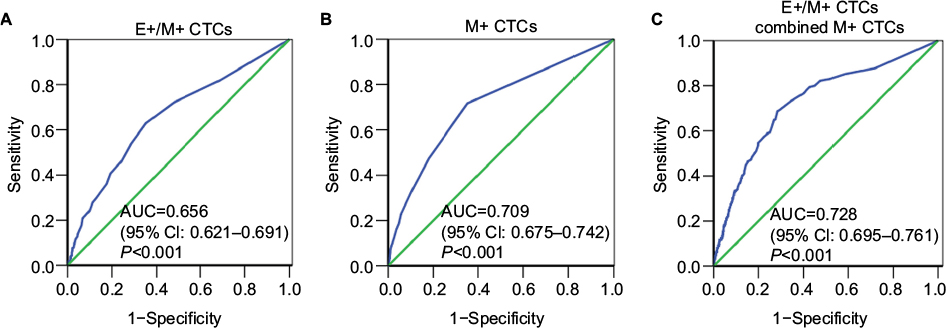 | Figure 5 ROC curve analysis of different CTC subsets in a large cohort of breast cancer patients. Notes: (A–C) ROC curves for (A) E+/M+, (B) M+ and (C) E+/M+ plus M+ CTCs in the large cohort of breast cancer patients are shown. The AUC values show the ability of these CTCs to predict distant metastasis in breast cancer patients. Abbreviations: AUC, area under the curve; CTCs, circulating tumor cells; ROC, receiver operating characteristic; E+ CTCs, exclusively epithelial CTCs; E+/M+ CTCs, biphenotypic epithelial/mesenchymal CTCs; M+ CTCs, exclusively mesenchymal CTCs. |
We then tested if the combination of E+/M+ CTCs and M+ CTCs predicted distant metastasis more accurately. The combination of E+/M+ and M+ CTCs yielded an AUC value of 0.728 (95% CI: 0.695–0.761; P<0.001; Figure 5C) and at an optimal cutoff value of 8.3235 showed sensitivity and specificity values of 68.7% and 71.6%, respectively. This suggested that breast cancer patients with distant metastasis showed both E+/M+ and M+ CTCs.
Discussion
Although many studies have assessed the clinical relevance of the EMT phenotype of CTC subpopulations in breast cancer,17–24 a systematic large cohort study based on definitive EMT markers with clinically feasible CTC detection technique is lacking. In this study, we performed Canpatrol CTC assay with four epithelial markers, EpCAM and CK8/18/19, as well as two mesenchymal markers, vimentin and TWIST1, to classify CTCs in breast cancer patients. We studied the distribution and clinical value of CTCs with varying EMT phenotypes in small-scale and large-scale breast cancer samples.
Breast cancer cell lines have been differentiated based on the differential expression patterns of epithelial and mesenchymal markers.9–12 The breast cancer cell lines that represent luminal and HER2-positive subtypes are poorly invasive and are characterized by absence or low expression of mesenchymal markers and high expression of epithelial markers.9,10 Contrary to these reports,9,10 we observed the expression of both epithelial and mesenchymal markers in luminal subtype, MCF-7 cell line, and HER2-positive subtype, MDA-MB-453 cell line, in this study. This suggested that EMT changes occur even in the luminal and HER2-positive subtypes of breast cancer cell lines. Also, this suggested that poorly invasive cells increase their mesenchymal characteristic and progress into highly invasive phenotypes.13–15 However, further studies are necessary to understand similar epithelial plus mesenchymal phenotypes in MCF-7 and MDA-MB-453 cell lines, which belong to different subtypes of breast cancer. Yet, our results demonstrate that Canpatrol CTC assay can differentiate between different breast cancer subtypes based on CTC characterization and classification. This assay needs to be applied to other breast cancer cell lines representing the different breast cancer subtypes to ascertain if CTCs from different breast cancer subtypes can be successfully recognized.
In our preliminary small-scale analysis of patient blood samples, we observed higher CTC incidence in benign breast disease (46.2%), which was inconsistent with previous reports.28 The discrepancy could be due to differences in samples and assay techniques. Nevertheless, the incidence and number of CTCs were lower in benign breast disease than in breast cancer. This is consistent with a previous finding that CTCs are rare in patients with nonmalignant diseases.29 We also showed three distinct CTC subpopulations in patients, namely, E+, E+/M+ and M+ CTCs. Each of these subpopulations was distinctly distributed in the benign breast disease as well as in M0 and M1 breast cancer patients. These results suggest an association between CTC numbers and subpopulations with disease severity. Furthermore, total CTC numbers displayed the highest AUC of 0.886 compared to the three CTC subpopulations in the diagnosis of breast cancer with a sensitivity of 76.1% and specificity of 92.3%. The sensitivity and specificity percentages were comparable to those previously reported for lung cancer and lung benign disease.30 We also found that M+ CTCs exhibited the highest AUC of 0.818 in predicting distant metastasis compared to the total and other CTC subpopulations with a sensitivity of 76.2% and specificity of 90.3%.
To assess the true diagnostic and predictive power of EMT phenotypic hallmarks of CTCs in breast cancer diagnosis and distant metastasis prediction, we analyzed a large cohort of 1083 Chinese breast cancer patients. We detected CTCs in 84.9% of patients (≥1 CTC/5 mL blood). This detection rate was higher than those detected by CellSearch system and epithelial marker enrichment assays and comparable to independent detection by epithelial markers.31,32 We observed CTCs expressing predominantly epithelial phenotype in the early stages of EMT, both epithelial and mesenchymal phenotypes at the intermediate stage of EMT and predominantly mesenchymal phenotype in the late stage of EMT.33 The detection rates of E+, E+/M+ and M+ CTCs were 50.5%, 73.2% and 47.6%, respectively, which suggested that most patients were in the intermediate stage of EMT and undergoing EMT. These results also indicate that EMT may be conducive to CTC generation and their survival in circulation.
We also observed the correlation between total CTC numbers and distant metastasis, suggesting that CTCs in circulation probably represent a surrogate marker for tumor self-seeding potential such as metastatic cascade, tumor dissemination and progression.34 We also found that a combination of high M+ and E+/M+ CTCs or high E+/M+ CTCs without M+ CTCs correlated with distant metastasis. These data were consistent with previous studies,21,24 suggesting that CTCs displaying a mesenchymal phenotype have immense potential as a predictive factor of distant metastasis of breast cancer. However, E+ CTCs were associated with early stage of disease. These data highlight the importance of phenotypic change of CTCs during the EMT process in tumor progression.
Furthermore, the numbers of E+/M+ and M+ CTCs could discriminate between M0 and M1 subtypes of breast cancer patients. Notably, E+/M+ CTCs in combination with M+ CTCs displayed better prediction of distant metastasis in breast cancer patients with an AUC-ROC value of 0.728, sensitivity of 68.7% and specificity of 71.6%. To the best of our knowledge, this is the first report to evaluate the predictive power of CTC subpopulations in distant metastasis of breast cancer. Our results suggest that E+/M+ CTCs in combination with M+ CTCs predict tumor progression and distant metastasis.
The strength of our study is that it represents one of the largest phenotyping analyses of CTCs by EMT markers in breast cancer patients. We analyzed a large sample size with multiple definitive EMT markers and clinically feasible CTC detection assay. Nevertheless, there are a few limitations to this study. First, our data only included distant metastatic status of breast cancer and did not analyze other clinical parameters such as molecular subtypes and hormone receptor status. Therefore, we did not investigate the correlation of CTCs with other clinical parameters of breast cancer. Moreover, due to the lack of follow-up and serial detection of CTCs, we were unable to assess the prognostic significance of distinct EMT phenotype CTCs in breast cancer. Thus, further analysis of the clinical relevance of CTCs is warranted.
Conclusion
In conclusion, we demonstrated three distinct CTC subpopulations (E+, E+/M+ and M+) using Canpatrol CTC assays in blood samples from 1083 Chinese breast cancer patients. We further demonstrated that high numbers of circulating M+ and E+/M+ CTCs in patients were associated with distant metastasis, whereas high numbers of circulating E+ CTCs were associated with early-stage breast cancer. This suggests the combination of E+/M+ and M+ CTCs is predictive of distant metastasis in breast cancer patients. Future studies are necessary to investigate the prognostic value of CTCs in breast cancer therapy.
Acknowledgments
This work was supported by the National Natural Science Foundation of China (number 81602671), Zhejiang Provincial Natural Science Foundation of China (number LY15H160010), and Zhejiang Provincial Medicine and Health Science Foundation of China (number WKJ-2J-1532).
Disclosure
The authors report no conflicts of interest in this work.
References
Perou CM, Sørlie T, Eisen MB, et al. Molecular portraits of human breast tumours. Nature. 2000;406(6797):747–752. | ||
Sørlie T, Perou CM, Tibshirani R, et al. Gene expression patterns of breast carcinomas distinguish tumor subclasses with clinical implications. Proc Natl Acad Sci USA. 2001;98(19):10869–10874. | ||
Holliday DL, Speirs V. Choosing the right cell line for breast cancer research. Breast Cancer Res. 2011;13(4):215. | ||
Curtis C, Shah SP, Chin SF, et al; for the METABRIC Group. The genomic and transcriptomic architecture of 2,000 breast tumours reveals novel subgroups. Nature. 2012;486(7403):346–352. | ||
Harrell JC, Prat A, Parker JS, et al. Genomic analysis identifies unique signatures predictive of brain, lung, and liver relapse. Breast Cancer Res Treat. 2012;132(2):523–535. | ||
Gupta GP, Massagué J. Cancer metastasis: building a framework. Cell. 2006;127(4):679–695. | ||
Thiery JP. Epithelial-mesenchymal transitions in tumour progression. Nat Rev Cancer. 2002;2(6):442–454. | ||
Kalluri R. EMT: when epithelial cells decide to become mesenchymal-like cells. J Clin Invest. 2009;119(6):1417–1419. | ||
Neve RM, Chin K, Fridlyand J, et al. A collection of breast cancer cell lines for the study of functionally distinct cancer subtypes. Cancer Cell. 2006;10(6):515–527. | ||
Blick T, Widodo E, Hugo H, et al. Epithelial mesenchymal transition traits in human breast cancer cell lines. Clin Exp Metastasis. 2008;25(6):629–642. | ||
Prat A, Parker JS, Karginova O, et al. Phenotypic and molecular characterization of the claudin-low intrinsic subtype of breast cancer. Breast Cancer Res. 2010;12(5):R68. | ||
Sarrió D, Rodriguez-Pinilla SM, Hardisson D, Cano A, Moreno-Bueno G, Palacios J. Epithelial-mesenchymal transition in breast cancer relates to the basal-like phenotype. Cancer Res. 2008;68(4):989–997. | ||
Thompson EW, Paik S, Brünner N, et al. Association of increased basement membrane invasiveness with absence of estrogen receptor and expression of vimentin in human breast cancer cell lines. J Cell Physiol. 1992;150(3):534–544. | ||
Planas-Silva MD, Waltz PK. Estrogen promotes reversible epithelial-to-mesenchymal-like transition and collective motility in MCF-7 breast cancer cells. J Steroid Biochem Mol Biol. 2007;104(1):11–21. | ||
Li C-W, Xia W, Huo L, et al. Epithelial–mesenchymal transition induced by TNF-α requires NF-κB–mediated transcriptional upregulation of Twist1. Cancer Res. 2012;72(5):1290–1300. | ||
Willipinski-Stapelfeldt B, Riethdorf S, Assmann V, et al. Changes in cytoskeletal protein composition indicative of an epithelial-mesenchymal transition in human micrometastatic and primary breast carcinoma cells. Clin Cancer Res. 2005;11(22):8006–8014. | ||
Armstrong AJ, Marengo MS, Oltean S, et al. Circulating tumor cells from patients with advanced prostate and breast cancer display both epithelial and mesenchymal markers. Mol Cancer Res. 2011;9(8):997–1007. | ||
Aktas B, Tewes M, Fehm T, Hauch S, Kimmig R, Kasimir-Bauer S. Stem cell and epithelial-mesenchymal transition markers are frequently overexpressed in circulating tumor cells of metastatic breast cancer patients. Breast Cancer Res. 2009;11(4):R46. | ||
Barrière G, Riouallon A, Renaudie J, Tartary M, Rigaud M. Mesenchymal and stemness circulating tumor cells in early breast cancer diagnosis. BMC Cancer. 2012;12(1):114. | ||
Kasimir-Bauer S, Hoffmann O, Wallwiener D, Kimmig R, Fehm T. Expression of stem cell and epithelial-mesenchymal transition markers in primary breast cancer patients with circulating tumor cells. Breast Cancer Res. 2012;14(1):R15. | ||
Kallergi G, Papadaki MA, Politaki E, Mavroudis D, Georgoulias V, Agelaki S. Epithelial to mesenchymal transition markers expressed in circulating tumour cells of early and metastatic breast cancer patients. Breast Cancer Res. 2011;13(3):R59. | ||
Gradilone A, Raimondi C, Nicolazzo C, et al. Circulating tumour cells lacking cytokeratin in breast cancer: the importance of being mesenchymal. J Cell Mol Med. 2011;15(5):1066–1070. | ||
Mego M, Mani SA, Lee BN, et al. Expression of epithelial–mesenchymal transition-inducing transcription factors in primary breast cancer: the effect of neoadjuvant therapy. Int J Cancer. 2012;130(4):808–816. | ||
Yu M, Bardia A, Wittner BS, et al. Circulating breast tumor cells exhibit dynamic changes in epithelial and mesenchymal composition. Science. 2013;339(6119):580–584. | ||
Wu S, Liu S, Liu Z, et al. Classification of circulating tumor cells by epithelial-mesenchymal transition markers. PLoS One. 2015;10(4): e0123976. | ||
Soule HD, Vazquez J, Long A, Albert S, Brennan M. A Human Cell Line From a Pleural Effusion Derived From a Breast Carcinoma2. J Natl Cancer Inst. 1973;51(5):1409–1416. | ||
Cailleau R, Olivé M, Cruciger QV. Long-term human breast carcinoma cell lines of metastatic origin: Preliminary characterization. In Vitro. 1978; 14(11):911–915. | ||
Franken B, de Groot MR, Mastboom WJ, et al. Circulating tumor cells, disease recurrence and survival in newly diagnosed breast cancer. Breast Cancer Res. 2012;14(5):R133. | ||
Allard WJ, Matera J, Miller MC, et al. Tumor cells circulate in the peripheral blood of all major carcinomas but not in healthy subjects or patients with nonmalignant diseases. Clin Cancer Res. 2004;10(20):6897–6904. | ||
Chen X, Zhou F, Li X, et al. Folate receptor–positive circulating tumor cell detected by LT-PCR–based method as a diagnostic biomarker for non–small-cell lung cancer. J Thorac Oncol. 2015;10(8):1163–1171. | ||
Königsberg R, Obermayr E, Bises G, et al. Detection of EpCAM positive and negative circulating tumor cells in metastatic breast cancer patients. Acta Oncol. 2011;50(5):700–710. | ||
Harouaka RA, Zhou MD, Yeh YT, et al. Flexible micro spring array device for high-throughput enrichment of viable circulating tumor cells. Clin Chem. 2014;60(2):323–333. | ||
Pham PV, editor. Breast circulating tumour cells and breast cancer stem cells. In: Breast Cancer Stem Cells Ther Resistance. Cham, Switzerland: Springer; 2015:97–107. | ||
Kim M-Y, Oskarsson T, Acharyya S, et al. Tumor self-seeding by circulating cancer cells. Cell. 2009;139(7):1315–1326. |
 © 2017 The Author(s). This work is published and licensed by Dove Medical Press Limited. The full terms of this license are available at https://www.dovepress.com/terms.php and incorporate the Creative Commons Attribution - Non Commercial (unported, v3.0) License.
By accessing the work you hereby accept the Terms. Non-commercial uses of the work are permitted without any further permission from Dove Medical Press Limited, provided the work is properly attributed. For permission for commercial use of this work, please see paragraphs 4.2 and 5 of our Terms.
© 2017 The Author(s). This work is published and licensed by Dove Medical Press Limited. The full terms of this license are available at https://www.dovepress.com/terms.php and incorporate the Creative Commons Attribution - Non Commercial (unported, v3.0) License.
By accessing the work you hereby accept the Terms. Non-commercial uses of the work are permitted without any further permission from Dove Medical Press Limited, provided the work is properly attributed. For permission for commercial use of this work, please see paragraphs 4.2 and 5 of our Terms.