")
Back to Journals » Journal of Asthma and Allergy » Volume 13
Medical Costs and Productivity Loss Due to Mild, Moderate, and Severe Asthma in the United States
Authors Song HJ , Blake KV , Wilson DL , Winterstein AG , Park H
Received 18 July 2020
Accepted for publication 15 September 2020
Published 29 October 2020 Volume 2020:13 Pages 545—555
DOI https://doi.org/10.2147/JAA.S272681
Checked for plagiarism Yes
Review by Single anonymous peer review
Peer reviewer comments 2
Editor who approved publication: Dr Amrita Dosanjh
Hyun Jin Song,1 Kathryn V Blake,2 Debbie L Wilson,1 Almut G Winterstein,1,3 Haesuk Park1,3
1Department of Pharmaceutical Outcomes and Policy, College of Pharmacy, University of Florida, Gainesville, FL, USA; 2Center for Pharmacogenomics and Translational Research, Nemours Children’s Specialty Care, Jacksonville, FL, USA; 3Center for Drug Evaluation and Safety, University of Florida, Gainsville, FL, USA
Correspondence: Haesuk Park
Department of Pharmaceutical Outcomes and Policy, College of Pharmacy, University of Florida, 1225 Center Drive, Gainesville, FL 32601, USA
Tel +1 352 273 6261
Fax +1 352 273 6270
Email [email protected]
Background: Little is known about economic and productivity loss by severity of asthma. We investigate health-care utilization, direct medical costs, and indirect costs due to productivity loss from asthma by severity.
Methods: We conducted a cross-sectional analysis of the Medical Expenditure Panel Survey database (2010– 2017) of patients with asthma aged ≥ 12 years and categorized them into mild, moderate, and severe asthma groups based on symptom control medications. Study outcomes included health-care utilization, direct medical costs, and indirect costs of asthma-related absenteeism. We used zero-inflated Poisson regression models to estimate incremental health-care utilization and generalized linear models to estimate incremental annual direct medical costs compared to patients without asthma.
Results: An estimated 139 million persons had an asthma diagnosis. Of patients with asthma, 77.1%, 22.2%, and 0.7% had mild, moderate, and severe asthma, respectively. Compared to patients without asthma, patients with asthma had incremental mean differences of 4.16 outpatient visits, 0.18 emergency department visits, and 0.07 hospitalizations per year. Annual direct medical costs were significantly associated with asthma severity ($3305 in mild, $7250 in moderate, and $9175 in severe asthma) (P < 0.05). Patients with mild, moderate, and severe asthma reported 0.76, 2.31, and 7.19 missed work or school days, resulting in $106, $321, and $1000 indirect costs per person per year, respectively.
Conclusion: Asthma-related direct and indirect costs are significantly associated with asthma severity, with severe asthma medical costs being about three times higher than mild. Controlling asthma symptoms is important to reduce the economic and social burden of asthma.
Keywords: asthma, health care utilization, medical cost, productivity loss, severity
Introduction
Asthma is the most common inflammatory disease of the lungs in the United States (US). It is characterized by respiratory symptoms including wheezing, shortness of breath, chest tightness, and cough that vary over time and by intensity. More than 25 million individuals (7.7% of the population), including 7.7% of adults aged ≥18 years and 9.9% of children aged 12–17 years, have asthma according to the Centers for Disease Control and Prevention (CDC).1 Asthma accounts for 9.8 million outpatient visits, 1.8 million emergency department (ED) visits, and 188,968 inpatient visits annually.1 In addition, a recent study reported that in children aged 18 years or younger, children with asthma have the largest proportion of missed school days.2 In 2013, approximately 13.8 million missed school days were reported for children,3 and 14.2 million missed work days for adults in 2008 due to asthma.4 More importantly, patients with severe asthma, which is often characterized by poor symptom control and more frequent exacerbations, consume significant health-care resources that incur high medical costs5–7 and result in lost work productivity.7
Several studies have assessed the burden of asthma using US nationally representative data including either only pediatric,8,9 only adults,9–11 or both.12–14 A recent study estimated that the annual economic burden of asthma for all ages using 2008–2013 Medical Expenditure Panel Survey (MEPS) data was more than $81.9 billion, including $50.3 billion in direct medical costs, $29 billion in asthma-related mortality, and $3 billion in absenteeism.15 However, none of the previous studies assessed the current burden of asthma in the general US population by severity of asthma, although asthma severity is the major driver of the clinical and economic burden of asthma. Thus, we aimed to assess the most recent estimates of direct medical costs including health-care utilization resulting from asthma care and indirect costs due to the productivity loss from asthma categorized by severity and age group from 2010 to 2017 in the US.
Methods
Data Source
We conducted a cross-sectional study using the 2010–2017 MEPS database. MEPS is based on a nationally representative sample of the civilian noninstitutionalized population of the US established for each calendar year by the Agency for Healthcare Research and Quality and the National Center for Health Statistics.16 It includes information on health-care use, medical expenditures, and demographic characteristics for each year of the National Health Interview Survey and provides nationally representative estimates for the US population using population weights. During 2010–2017, the MEPS’ annual samples ranged from 31,880 to 38,974 persons.
Definition of Asthma by Severity
We included all persons aged ≥12 years of each year from 2010 to 2017 and divided them into patients with asthma and patients without asthma . We used the International Classification of Diseases, Ninth and Tenth Revision, Clinical Modification (ICD-9-CM and ICD-10-CM) diagnosis codes 493 and J45 from the medical condition files to identify patients with asthma for each year from 2010 to 2017. We categorized asthma patients into three groups (mild, moderate, and severe asthma) according to the five management steps (step 1 to 5) of the 2010–2017 Global Initiatives for Asthma (GINA) guidelines for adults and adolescents (≥12 years),17 which was also used in previous studies to define asthma severity.6,18 We included asthma patients aged ≥12 years because the asthma medications (eg, tiotropium and omalizumab) that we used for the severe asthma category according to the GINA guidelines are only recommended for adults and adolescents aged ≥12 years.17 The GINA guidelines categorize steps 1 and 2 as mild, step 3 as moderate, and steps 4 and 5 as severe asthma, but we had to categorize steps 3 and 4 as moderate asthma and step 5 as severe asthma due to lack of information about dose of inhaled corticosteroid/long-acting beta-agonist combinations (ICS/LABA) in MEPS. ICS/LABA are recommended for steps 3 (low dose) and 4 (medium to high dose) with different doses. Thus, in our analyses, mild asthma was defined as patients prescribed inhaled corticosteroid (ICS) or not prescribed any medications (Step 1 and 2 of GINA). Moderate asthma was defined as prescribed ICS/LABA (step 3 and 4 of GINA). Severe asthma was defined as prescribed ICS/LABA and add-on omalizumab, mepolizumab, tiotropium, or low dose oral corticosteroid (OCS) (step 5 of GINA). Low dose OCS was defined as a prednisolone equivalent of ≤7.5 mg per day for ≥2 weeks using the strength of OCS and days’ supply or quantity of prescribed OCS.12,17 We established a control group of persons who did not have asthma diagnosis codes during the calendar year (ie, persons in all cohorts of each year excluding patients with asthma). National estimates for the sample sizes in each group (no asthma, total asthma, and mild, moderate, and severe asthma) were produced by applying MEPS survey weights.
Health-Care Utilization and Direct Medical Costs
Health-care utilization was measured as the mean number of visits made within a year during the study period. Medical services consisted of ambulatory care, ED, inpatient hospitalizations, prescribed medicines, and other medical expenses. Medical costs per person per year (PPPY) were calculated using the total amount of costs from all payers including public and private insurances, and out-of-pocket costs. Annual health-care utilization and direct medical costs PPPY were estimated for patients with asthma compared to patients without asthma. Outcomes were also assessed across the three severity groups (mild, moderate, and severe) and across four age groups (12–17, 18–34, 35–64, and ≥65 years).
Productivity Loss and Indirect Costs
We calculated missed work or school days PPPY to estimate absenteeism and indirect costs. We used missed school days for children aged 12–17 years and missed work days for adults aged ≥18 years. The 2017 MEPS data did not report missed school days, so we used 2010–2016 data only to calculate the number of asthma patients aged 12–17 years, and we used 2010–2017 data to calculate the number of asthma patients aged ≥18 years. Indirect medical costs per person by absenteeism were calculated using the number of missed work or school days and the mean daily wage. For adults aged ≥18 years, indirect costs PPPY were calculated by multiplying the missed work days by the mean daily wage of patients with asthma. The mean daily wage of asthma patients aged ≥18 years was estimated using an hourly wage and work hour per week of patients with asthma as reported in the MEPS data.15 For children aged 12–17 years, the indirect costs PPPY were estimated by multiplying the missed school days by the mean daily wage of caregivers, which was assumed to be the same in the MEPS data as in the general population because we assume that one parent cannot work due to their child’s asthma.19 Annual per-person indirect costs of asthma and of mild, moderate, or severe asthma during 2010–2017 were calculated by multiplying the number of missed work or school days by the mean daily wage for patients with asthma or persons with all occupations, and total indirect costs of asthma patients per year were calculated by multiplying the indirect costs PPPY by the number of the annual national estimate of asthma patients who reported missed work or school days.
Statistical Analysis
We compared baseline characteristics between patients with and without asthma including mild, moderate, and severe asthma using chi-square tests and analysis of variance (ANOVA). Means (standard error [SE] or 95% confidence interval [CI]) for continuous variables and frequencies for categorical variables were calculated and pooled person weights were used to obtain precise national annual estimates. To evaluate medical care utilization, a zero-inflated Poisson regression model was used that included a logit model for predicting excess zeros and a Poisson count model. To estimate medical costs, we used a generalized linear model with a gamma distribution and log link function, which is most commonly used in cost studies because it has the advantage of addressing distributions with zeroes or right-skewed tails.20–22 Covariates included age, sex, race, ethnicity, region, marital status, household income, insurance, smoking, and Charlson Comorbidity Index (CCI) using the full year consolidated data file. CCI score was calculated using ICD-9-CM and ICD-10-CM codes.23,24 Differences in medical service utilization and costs for asthma patients by their severity were compared with non-asthma patients. Medical expenditure and wages were adjusted to 2017 US dollar using a 3% inflation rate. Statistical significance was defined as a 2-sided P < 0.05. All statistical analyses were performed using SAS version 9.4 (SAS Institute Inc., Cary, NC) and STATA version 13 (Stata Corp., College Station, TX).
Results
Our sample included 183,537 people, representing a population of about 2 billion non-institutionalized US civilians during 2010–2017, of which 7.5% of patients had asthma. Of the 13,732 patients with asthma, 77.1% (n = 10,586), 22.2% (n = 3048), and 0.7% (n = 98) were classified as having mild, moderate, and severe asthma, representative of about 105 million, 33 million, and 1 million, respectively (Table 1). The mean age (SE) increased with severity level: 43.2 (0.4) in mild asthma, 51.4 (0.7) in moderate asthma, and 59.6 (1.8) in severe asthma. Across asthma groups, patients with severe asthma were more likely to be female (75.5%), white (76.0%), to live in the Southern region (46.9%), and to have private insurance (64.3%), while those with mild asthma were more likely to be Hispanic (22.7%) and smokers (21.1%). The household income level was not significantly different among asthma severity groups. Mean CCI scores (SE) among patients with mild, moderate, and severe asthma were 0.60 (0.02), 0.79 (0.03), and 1.23 (0.27), respectively.
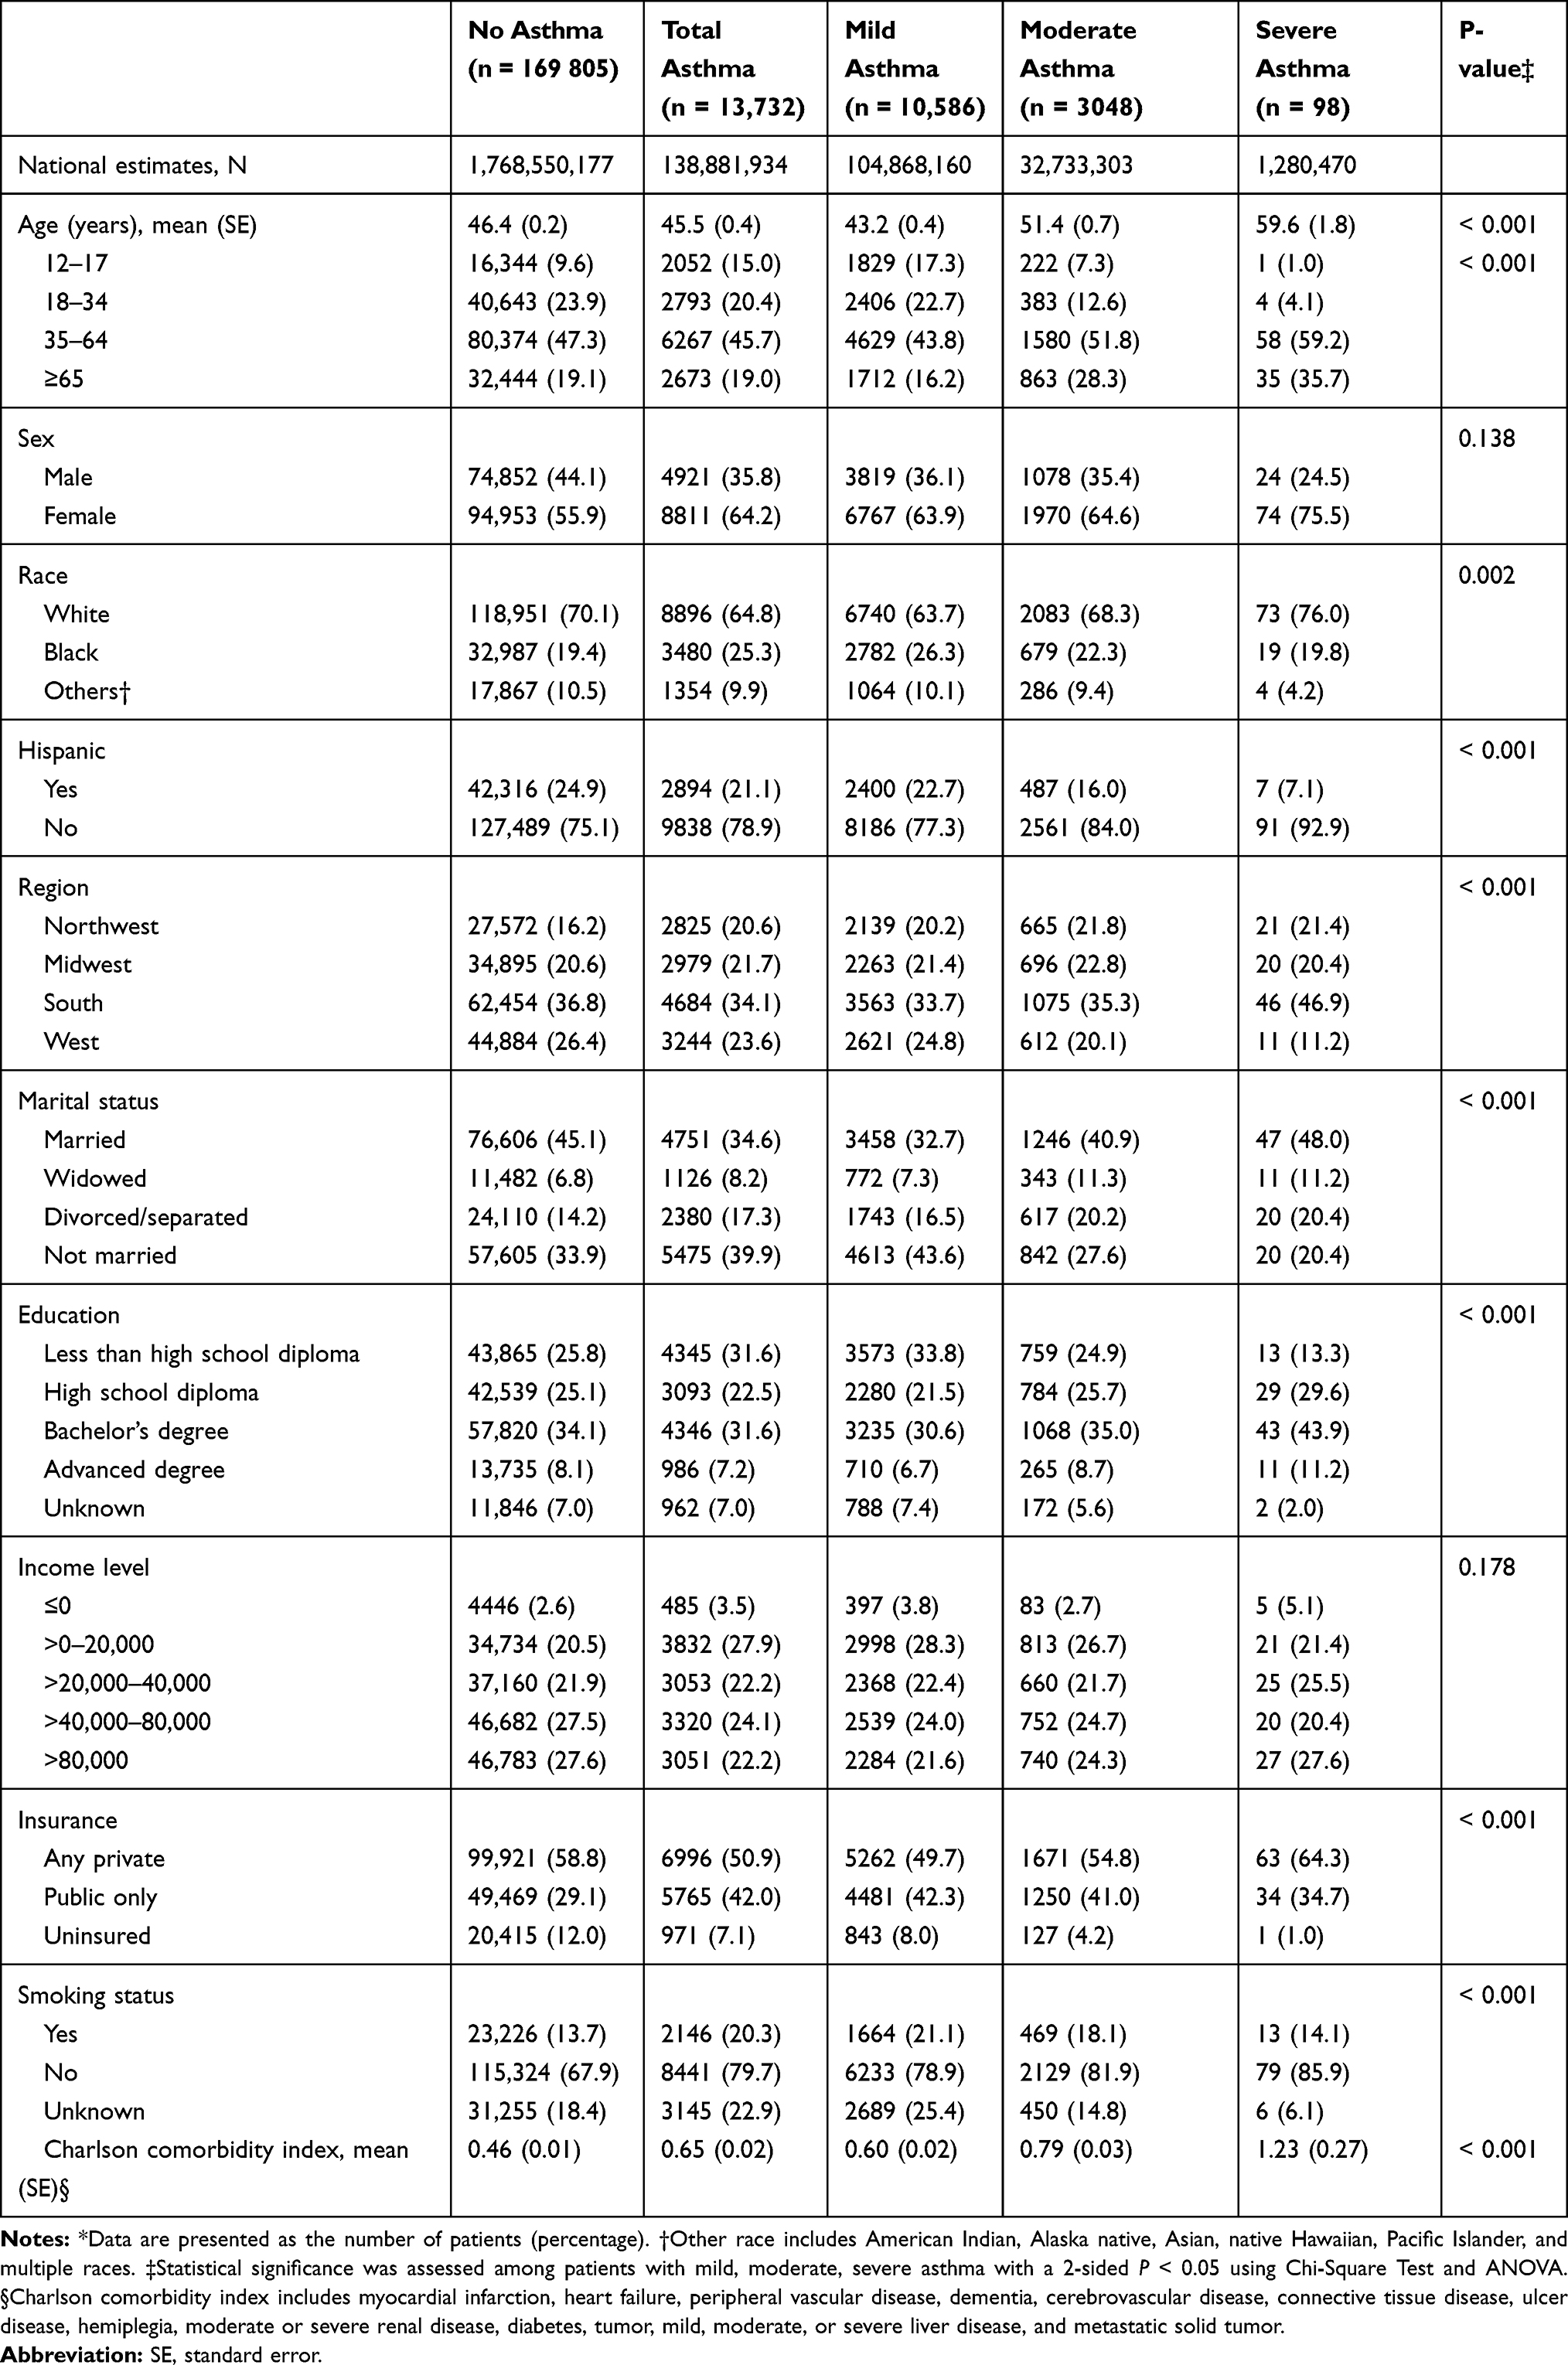 |
Table 1 Baseline Characteristics of Asthma Patients by Severity, 2010–2017* |
Health-Care Utilization
Supplementary Table 1 shows the unadjusted mean numbers of medical service utilization. Compared to patients without asthma, patients with asthma had incremental means of 4.16 additional outpatient visits, 0.18 ED visits, and 0.07 hospitalizations.
Those with severe asthma tended to have higher rates of hospitalizations, ED visits, and outpatient visits compared to patients with mild asthma. After adjusting for socioeconomic and clinical covariates, the outpatient visit rates PPPY among mild, moderate, and severe asthma patients were significantly higher compared to patients without asthma: 2.53 (95% CI 2.43, 2.62) in mild, 3.67 (95% CI 3.52, 3.83) in moderate, and 6.72 (95% CI 6.08, 7.35) in severe asthma (P < 0.05 for each comparison) (Table 2). The adjusted additional number of ED visits PPPY compared to patients with no asthma were 0.13, 0.17, and 0.28 in the mild, moderate, and severe asthma groups, respectively (P < 0.05). Hospitalizations also increased as the asthma severity increased, although sample size constraints of the severe asthma group resulted in wide confidence intervals and statistically insignificant results. Compared to patients with mild asthma, patients with severe asthma spent 5.55 additional days in the hospital (95% CI 3.85, 7.25).
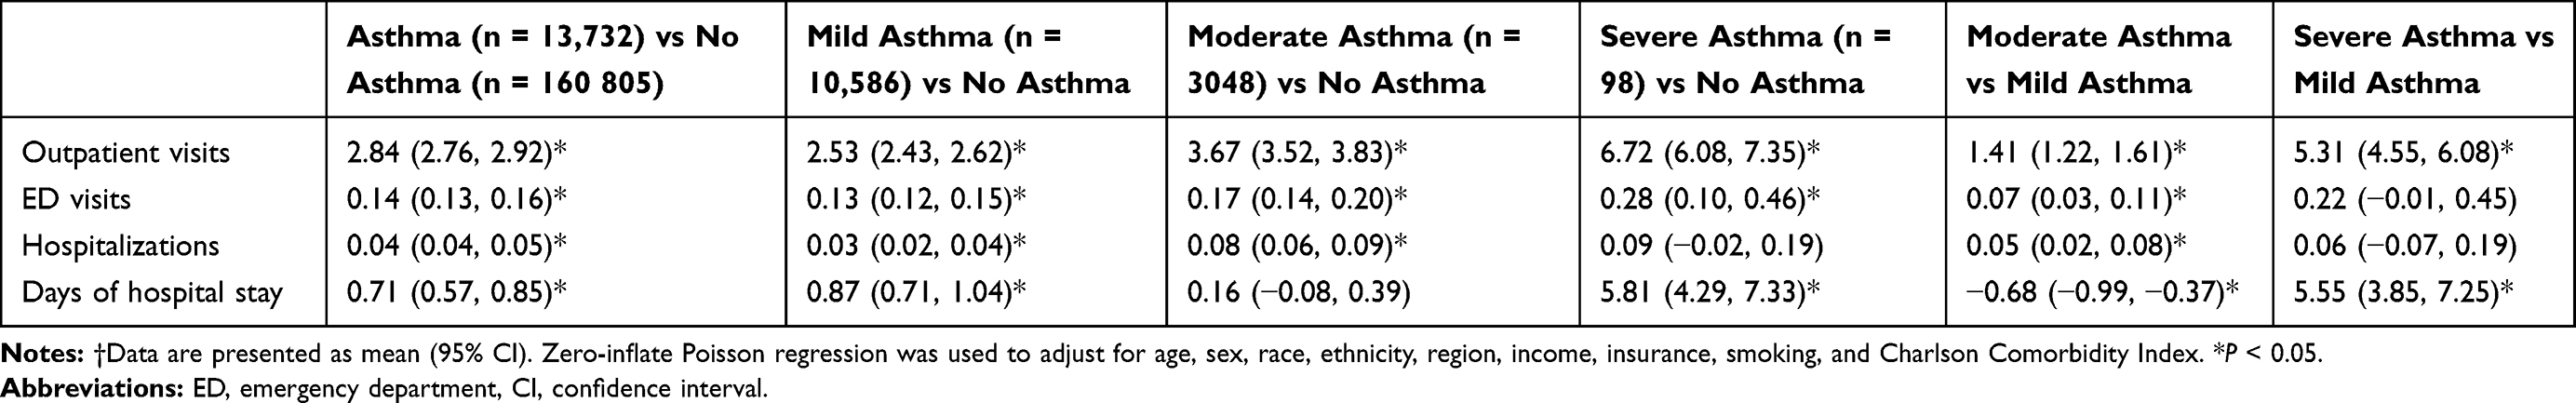 |
Table 2 Adjusted Incremental Health-Care Utilization Rates per Person per Year by Severity of Asthma, 2010–2017† |
When stratified by age group, the number of outpatient visits, ED visits, and hospitalizations increased as age increased, while outpatient and ED visits of patients aged ≥65 years were slightly lower than those of patients aged 35–64 years (Supplementary Figure 1).
Direct Medical Costs
The direct medical costs of asthma were $4333 PPPY and $75 billion total greater for all patients with asthma than for those without (Table 3, Supplementary Table 2). Of the direct medical costs PPPY for those with asthma that exceeded the costs of those without asthma, 84.0% were prescription drug ($2975 PPPY) and outpatient visit costs ($946 PPPY) (Table 3).
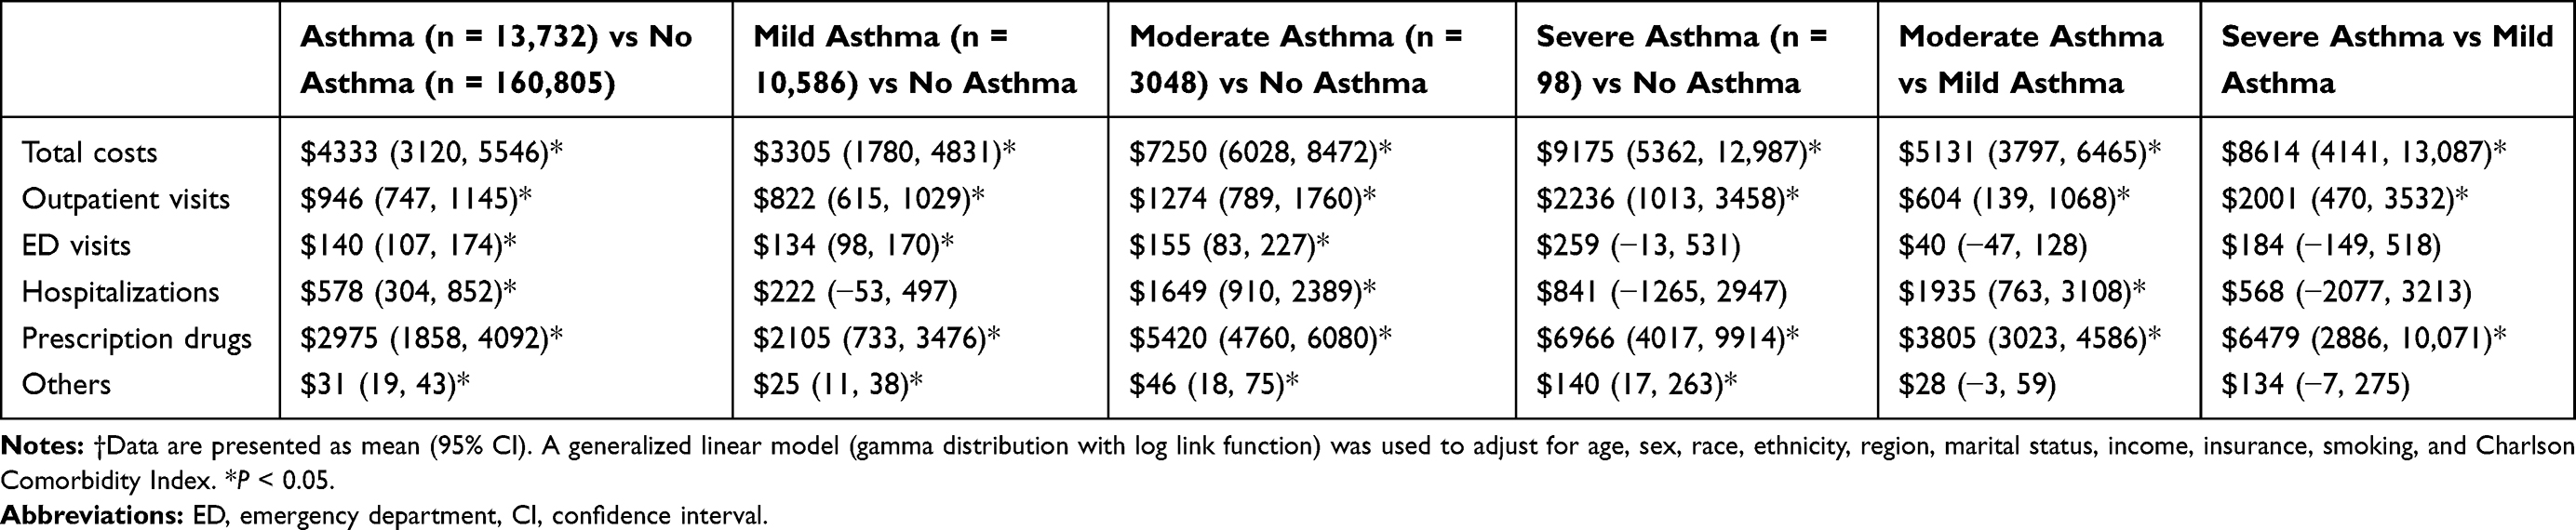 |
Table 3 Adjusted Incremental Direct Medical Costs per Person per Year by Severity of Asthma, 2010–2017† |
Compared to patients without asthma, total direct medical costs increased as the severity of asthma increased, and most of the direct medical costs of mild (88.5%), moderate (78.3%), and severe asthma (88.1%) were outpatient and prescription drug costs (Figure 1). Adjusted additional mean direct costs PPPY of mild, moderate, and severe asthma when compared to patients without asthma were $3305, $7250, and $9175, respectively (P < 0.05) (Table 3). Costs of outpatient visits (moderate vs mild, $604; severe vs mild, $2001) and prescription drugs PPPY (moderate vs mild, $3805; severe vs mild, $6479) increased significantly as severity increased. Costs of ED visits (moderate vs mild, $40; severe vs mild, $184) and hospitalizations (moderate vs mild, $1935; severe vs mild, $568) increased by severity, but these differences were not statistically significant except for hospitalization costs between moderate and mild asthma.
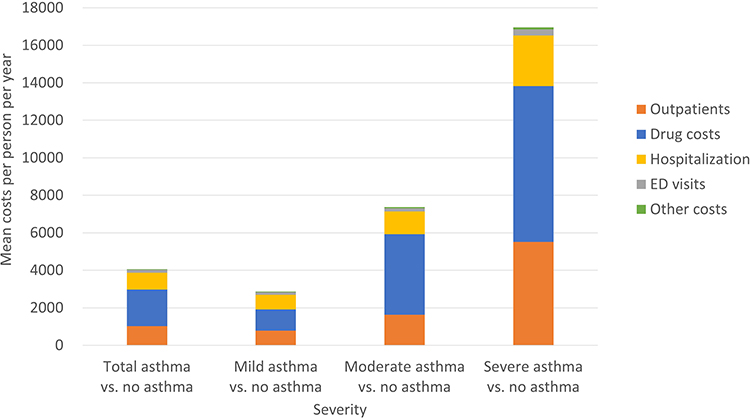 |
Figure 1 Unadjusted incremental direct medical costs per person per year by severity of asthma, 2010–2017. |
Asthma costs PPPY (asthma vs no asthma) stratified by age groups also increased as the groups’ ages increased. However, total cost for asthma patients extrapolated to the entire US population were lower for patients aged ≥65 years than those aged 35–64 years ($20 billion vs $43 billion) because of a decreasing prevalence of asthma in older patients (4 vs 8 million patients) (Figure 2).
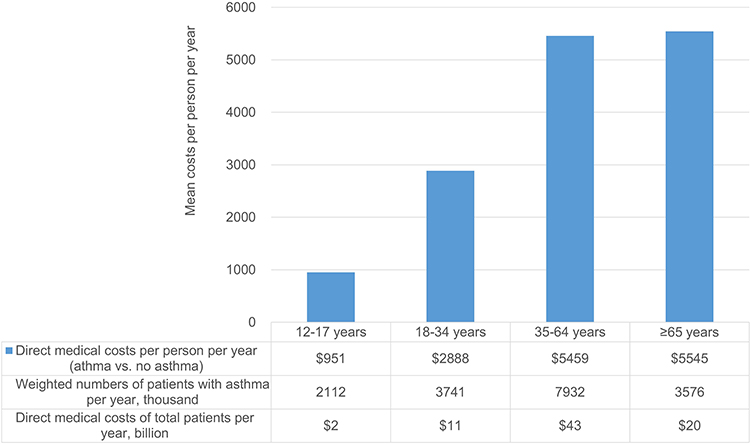 |
Figure 2 Unadjusted incremental direct medical costs per person per year by age group, 2010–2017. |
Productivity Loss and Indirect Costs
Table 4 shows the estimates of missed work or school days due to asthma relative to the non-asthma group. Of 13,732 patients with asthma, 58% (n = 7974) reported missed work or school days. Among 11 million children and adults (aged ≥12 years), 12 million missed work or school days annually occurred. On average, a person with asthma missed 1.13 additional work or school days, including 1.27 missed work days and 0.87 missed school days, compared to a person without asthma. Additional missed work or school days PPPY attributable to mild, moderate, and severe asthma when compared to persons without asthma were 0.76, 2.31, 7.19, respectively.
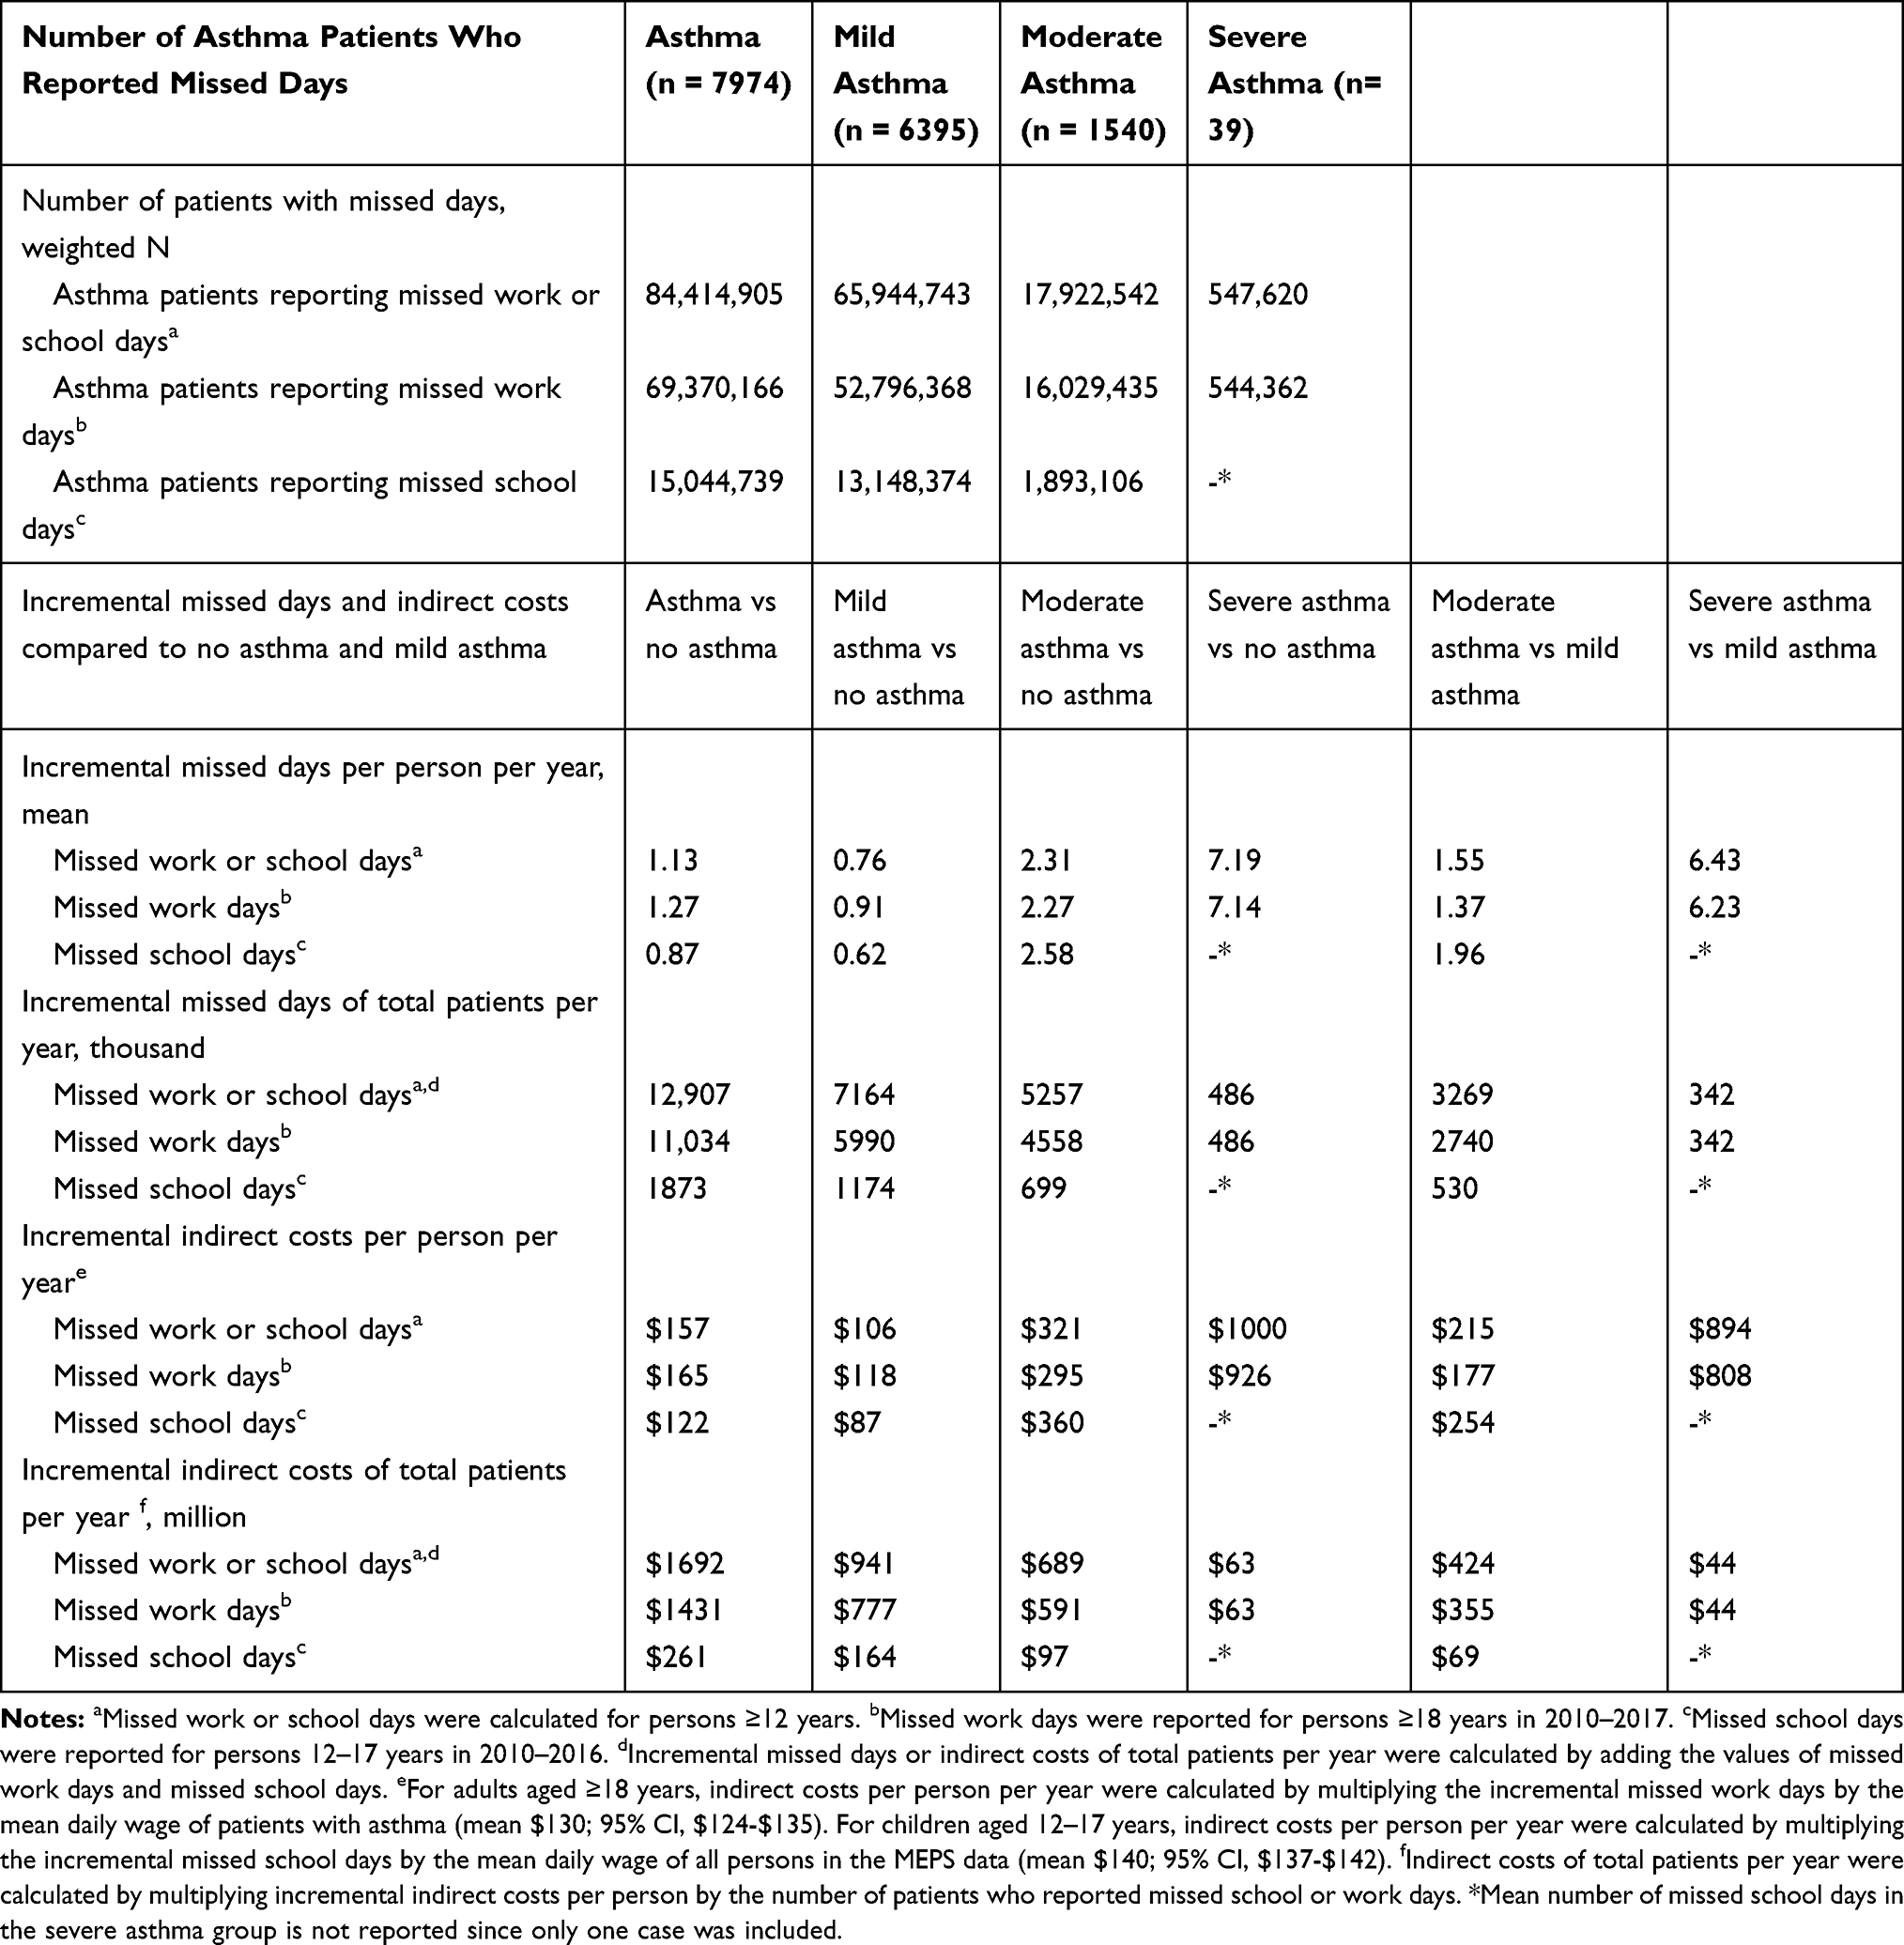 |
Table 4 Absenteeism and Indirect Costs by Severity of Asthma, 2010–2017 |
The indirect costs of asthma were estimated to be $1692 million ($157 per person) associated with missed school or work days. Indirect costs PPPY incurred by patients with mild, moderate, and severe asthma versus costs incurred by patients with no asthma amounted to an additional $106, $321, and $1000, respectively. Nationally 7 million, 5 million, and 0.5 million work or school days were lost owing to mild, moderate, and severe asthma when compared to persons with no asthma, resulting in a total loss of $941 million, $689 million, and $63 million, respectively. Incremental missed work or school days in patients with moderate and severe asthma compared to those in mild asthma patients were 3 million and 0.3 million, resulted in $424 and $44 million indirect total cost loss.
Supplementary Figure 2 shows the unadjusted productivity loss of patients with asthma by age group compared to persons with no asthma. Missed work or school days PPPY of those aged 35–64 years were the highest at 1.62 additional days attributable to asthma, followed by those among patients aged 12–17 years (0.87 days). Additional total indirect costs of patients aged 35–64 years and 18–34 years were high as 1065 million and 290 million, respectively.
Discussion
To our best knowledge, this is the first study to estimate the direct and indirect costs of asthma attributed specifically to the mild, moderate, and severe presentations of the disease using the most recent MEPS data, a nationally representative sample of the noninstitutionalized civilian US population.
Consistent with previous reports, direct medical costs of patients with asthma were higher than those of patients without asthma.10,12,14,15 On the basis of the 2010–2017 pooled sample, the direct medical cost attributable to asthma was about $4300 PPPY, which is comparable with the incremental direct costs from asthma ($3266 PPPY) in a previous study considering they used the 2008–2013 MEPS sample.15 The proportion of expenditures for prescription drugs and outpatient visits among the sum of adjusted direct costs for each item in our study was higher than in previous studies (84.0% vs 52.3–75.6%), which may be due to the rising cost of asthma medications.7,10,12,15 The average price of 16 leading asthma inhalers from a representative sample of prescription fills in US pharmacies has steadily climbed about 35% from $280 per inhaler in 2013 to more than $380 per inhaler in 2018 according to GoodRx analyses.25
Unlike most of the previous studies investigating the burden of asthma, this study focused on the variation in cost imposed by asthma severity. Asthma is widely recognized as a disease with significant health-care burden, but little has been done to investigate how cost burden can vary depending on the severity of the disease. Our study suggests that patients with moderate and severe asthma had 2.2 and 2.8 times higher direct medical costs compared to those with mild asthma. Although there are different health-care systems in different countries, a recent Japanese study showed similar results with 2 times higher annual medical expenses for patients with severe asthma, compared to those with mild to moderate asthma. The authors suggested that the high medical costs in severe asthma may be caused by increased non-allergic comorbidities for severe asthma as well as requiring more hospitalization and asthma drug treatment than mild and moderate asthma.26 Our results provide granular national estimates of medical expenditure of three levels of asthma severity based on utilization of control medications using the GlNA guidelines, unlike former studies in the US that estimated direct medical expenditures of severe asthma using self-classification8 or patients who experienced ≥2 exacerbations.5
We also sought to estimate direct costs of asthma for more refined age strata, since previous studies have only reported comparisons of annual costs between adults and children (≥18 vs <18 years, adult costs were 2.2 times higher than children’s)15 or based on incremental increases of age (costs increased by 1.01–1.02 as age increased 1 year).5,13 We found that direct costs PPPY among patients aged ≥65, 35–64, and 18–34 years were 5.8, 5.7, and 3.0 times higher, respectively, than those aged 12–17 years. Although asthma patients aged ≥35 years were more likely to have severe asthma than those aged <35 years, the direct asthma costs still increased as age increased after controlling for the severity in our regression analysis.
We also found that asthma patients' missed work or school almost 13 million per year ($2 billion of total indirect costs loss) in the U.S.10,15 When we stratified this by the severity of asthma, the missed work or school days PPPY of moderate and severe asthma were 1.5-fold and 2.9-fold greater compared to patients with mild asthma, resulting in 3.0 and 9.4 times higher incremental indirect costs PPPY for moderate and severe asthma, respectively, than for persons with mild asthma. Our results also found that missed work or school days in the group aged 35–64 were the highest. As a result, the indirect costs of patients aged 35–64 years were about $1 billion. In addition, asthma patients aged 35–64 years had per-person direct medical costs as high as those aged ≥65 years ($5459 vs $5545), resulting in total direct medical costs in patients aged 35–64 years being about 22 times higher than that in those aged 12–17 years ($43 billion vs $2 billion). Asthma is widely recognized as a disease with significant health-care implications in the young population (aged <18 years).8,9 It is also worthy to note that asthma also has serious health-care implications in adults aged 35–64 years.
This study quantified direct medical costs and indirect costs by severity of asthma and age groups in a nationally representative sample of 2 billion individuals in the US. Estimating medical costs and productivity loss of asthma can add to understanding of the size, severity, and impact of the disease and help public health decision-making to improve the management of asthma and to prevent disease progression, resulting in reducing its disease burden.27–29
This study needs to be interpreted considering some limitations. First, we classified asthma severity into three groups (mild, moderate, and severe) instead of by the five treatment steps in the GINA guidelines due to the lack of the dose information of asthma control medications, especially ICS/LABA. Because it is not possible to determine the actual prescribed dose or number of puffs of ICS/LABA in MEPS as the prescribed strength unit is recorded as a canister, we combined steps 3 and 4 from the GINA guideline to form a moderate severity group. Second, the severe asthma group had only a small sample size resulting in limited ability to draw formal inferences in some of our regression analyses. Furthermore, there was insufficient sample size to classify severe asthma by age group. However, the percentage of severe asthma among total asthma patients was similar to previous studies using claims databases (0.7% vs 0.6–1.1%)12,17 and is representative of about 1 million patients nationally. Though not always statistically significant, point estimates suggested a consistent trend of increasing direct and indirect cost PPPY with increasing severity of asthma. Third, productivity loss cannot be generalized due to missing data on absenteeism. Missed work or school days relied on patients’ self-report survey and patient decisions to omit this information may not be random. Fourth, indirect costs might be overestimated because we used the mean daily wage of persons who reported wage information, while total indirect costs might be underestimated because we used the number of patients who reported missed school or work days.
Conclusions
Asthma continues to be a disease with significant burden in the US, and economic burden and productivity loss is significantly associated with asthma severity. Our findings suggest that direct and indirect costs increased as the severity of asthma increased, with nearly triple the medical cost for patients with severe asthma than for patients with mild asthma in these nationally representative estimates for the US population. Efforts that focus on asthma control and that prevent the shifting of patients to a more severe disease category from a milder presentation of the disease will reduce asthma’s overall economic and social burden, especially in those with severe asthma.
Abbreviations
ANOVA, analysis of variance; CCI, Charlson Comorbidity Index; CDC, Centers for Disease Control and Prevention; CI, confidence interval; ED, emergency department; GINA, Global Initiatives for Asthma; ICS, inhaled corticosteroid; ICS/LABA, inhaled corticosteroid/long-acting beta-agonist combinations; MEPS, Medical Expenditure Panel Survey; OCS, oral corticosteroid; PPPY, per person per year; SE, standard error; US, United States.
Ethics and Consent Statement
Medical Expenditure Panel Survey (MEPS) data are available to the public online (https://meps.ahrq.gov/data_stats/download_data_files.jsp), and the study used fully deidentified data. Therefore, Institutional Review Board approval was not required and consent for publication was not applicable for this work.
Author Contributions
All authors contributed to data analysis or interpretation, drafting or revising the article, have agreed on the journal to which the article will be submitted, gave final approval of the version to be published, and agree to be accountable for all aspects of the work.
Funding
Research reported in this publication was supported by the National Institute on Heart, Lung, and Blood of the National Institutes of Health under award number R01HL136945.
Disclosure
Dr Almut G. Winterstein reports grants from NIH, during the conduct of the study; grants from Merck & Co, outside the submitted work. The authors declare that they have no other potential conflicts of interest for this work.
References
1. Centers for Disease Control and Prevention (CDC). Most recent National asthma data. 2018. Available from: https://www.cdc.gov/asthma/most_recent_national_asthma_data.htm.
2. Zahran HS, Bailey CM, Damon SA, Garbe PL, Breysse PN. Vital signs: asthma in children – united States, 2001–2016. Morbidity Mortality Weekly Rep. 2018;67(5):149–155. doi:10.15585/mmwr.mm6705e1
3. Centers for Disease Control and Prevention (CDC). Asthma-related missed school days among children aged 5–17 years; 2013. Available from: https://www.cdc.gov/asthma/asthma_stats/missing_days.htm.
4. Centers for Disease Control and Prevention (CDC). Asthma facts: CDC’s National asthma control program grantees, 2013. Available from: https://www.cdc.gov/asthma/pdfs/asthma_facts_program_grantees.pdf.
5. Chastek B, Korrer S, Nagar SP, et al. Economic burden of illness among patients with severe asthma in a managed care setting. J Manag Care Spec Pharm. 2016;22(7):848–861. doi:10.18553/jmcp.2016.22.7.848
6. Lee YJ, Kwon SH, Hong SH, et al. Health care utilization and direct costs in mild, moderate, and severe adult asthma: a descriptive study using the 2014 South Korean Health Insurance database. Clin Ther. 2017;39(3):527–536. doi:10.1016/j.clinthera.2017.01.025
7. Cisternas MG, Blanc PD, Yen IH, et al. A comprehensive study of the direct and indirect costs of adult asthma. J Allergy Clin Immunol. 2003;111(6):1212–1218. doi:10.1067/mai.2003.1449
8. Miller GF, Coffield E, Leroy Z, Wallin R. Prevalence and costs of five chronic conditions in children. J Sch Nurs. 2016;32(5):357–364. doi:10.1177/1059840516641190
9. Sullivan P, Ghushchyan VG, Navaratnam P, et al. School absence and productivity outcomes associated with childhood asthma in the USA. J Asthma. 2018;55(2):161–168. doi:10.1080/02770903.2017.1313273
10. Sullivan PW, Ghushchyan VH, Slejko JF, et al. The burden of adult asthma in the United States: evidence from the Medical Expenditure Panel Survey. J Allergy Clin Immunol. 2011;127(2):363–369. doi:10.1016/j.jaci.2010.10.042
11. Wu CH, Erickson SR. The association between asthma and absenteeism among working adults in the United States: results from the 2008 Medical Expenditure Panel Survey. J Asthma. 2012;49(7):757–764. doi:10.3109/02770903.2012.709292
12. Barnett SB, Nurmagambetov TA. Costs of asthma in the United States: 2002–2007. J Allergy Clin Immunol. 2011;127(1):145–152. doi:10.1016/j.jaci.2010.10.020
13. Rappaport H, Bonthapally V. The direct expenditures and indirect costs associated with treating asthma in the United States. J Aller Ther. 2012;3(2):118. doi:10.4172/2155-6121.1000118
14. Kamble S, Bharmal M. Incremental direct expenditure of treating asthma in the United States. J Asthma. 2009;46(1):73–80. doi:10.1080/02770900802503107
15. Nurmagambetov T, Kuwahara R, Garbe P. The Economic Burden of Asthma in the United States, 2008–2013. Ann Am Thorac Soc. 2018;15(3):348–356. doi:10.1513/AnnalsATS.201703-259OC
16. Agency for Healthcare Research and Quality (AHRQ). Medical Expenditure Panel Survey (MEPS). Available from: https://meps.ahrq.gov/mepsweb/. Accessed March 24, 2020.
17. Global Initiative for Asthma (GINA). Global strategy for asthma management and prevention. 2010. Available from: https://ginasthma.org/archived-reports/.
18. Kang HR, Song HJ, Nam JH, et al. Risk factors of asthma exacerbation based on asthma severity: a nationwide population-based observational study in South Korea. BMJ Open. 2018;8(3):e020825. doi:10.1136/bmjopen-2017-020825
19. Gupte-Singh K, Singh RR, Lawson KA. Economic burden of attention-deficit/hyperactivity disorder among pediatric patients in the United States. Value Health. 2017;20(4):602–609. doi:10.1016/j.jval.2017.01.007
20. Flórez-Tanus A, Parra D, Zakzuk J, et al. Health care costs and resource utilization for different asthma severity stages in Colombia: a claims data analysis. World Allergy Organ J. 2018;11(1):26. doi:10.1186/s40413-018-0205-4
21. Pagano E, Petrelli A, Picariello R, et al. Is the choice of the statistical model relevant in the cost estimation of patients with chronic diseases? An empirical approach by the Piedmont Diabetes Registry. BMC Health Serv Res. 2015;15(1):582. doi:10.1186/s12913-015-1241-1
22. Mihaylova B, Briggs A, O’Hagan A, Thompson SG. Review of statistical methods for analyzing healthcare resources and costs. Health Econ. 2011;20(8):897–916. doi:10.1002/hec.1653
23. Mukherjee B, Ou HT, Wang F, Erickson SR. A new comorbidity index: the health-related quality of life comorbidity index. J Clin Epidemiol. 2011;64(3):309–319. doi:10.1016/j.jclinepi.2010.01.025
24. Quan H, Sundararajan V, Halfon P, et al. Coding algorithms for defining comorbidities in ICD-9-CM and ICD-10 administrative data. Med Care. 2005;43(11):1130–1139. doi:10.1097/01.mlr.0000182534.19832.83
25. Marsh T Here’s why asthma inhalers are so expensive. 2018. Available from: https://www.goodrx.com/blog/heres-why-asthma-inhalers-are-so-expensive/.
26. Nagase H, Adachi M, Matsunaga K, et al. Prevalence, disease burden, and treatment reality of patients with severe, uncontrolled asthma in Japan. Allergol Int. 2020;69(1):53–60. doi:10.1016/j.alit.2019.06.003
27. Haddix AC, Teutsch SM, Corso PS. Prevention Effectiveness: A Guide to Decision Analysis and Economic Evaluation.
28. Gold MR, Siegel JE, Russell LB, Weinstein MC, editors. Cost Effectiveness in Health and Medicine. New York: Oxford University Press; 1996.
29. Schmitt J, Wüstenberg E, Küster D, et al. The moderating role of allergy immunotherapy in asthma progression: results of a population-based cohort study. Allergy. 2020;75(3):596–602. doi:10.1111/all.14020
 © 2020 The Author(s). This work is published and licensed by Dove Medical Press Limited. The full terms of this license are available at https://www.dovepress.com/terms.php and incorporate the Creative Commons Attribution - Non Commercial (unported, v3.0) License.
By accessing the work you hereby accept the Terms. Non-commercial uses of the work are permitted without any further permission from Dove Medical Press Limited, provided the work is properly attributed. For permission for commercial use of this work, please see paragraphs 4.2 and 5 of our Terms.
© 2020 The Author(s). This work is published and licensed by Dove Medical Press Limited. The full terms of this license are available at https://www.dovepress.com/terms.php and incorporate the Creative Commons Attribution - Non Commercial (unported, v3.0) License.
By accessing the work you hereby accept the Terms. Non-commercial uses of the work are permitted without any further permission from Dove Medical Press Limited, provided the work is properly attributed. For permission for commercial use of this work, please see paragraphs 4.2 and 5 of our Terms.