")
Back to Journals » Clinical Pharmacology: Advances and Applications » Volume 10
Mechanisms and the clinical relevance of complex drug–drug interactions
Authors Roberts AG, Gibbs ME
Received 14 May 2018
Accepted for publication 29 June 2018
Published 27 September 2018 Volume 2018:10 Pages 123—134
DOI https://doi.org/10.2147/CPAA.S146115
Checked for plagiarism Yes
Review by Single anonymous peer review
Peer reviewer comments 2
Editor who approved publication: Professor Arthur E. Frankel
Arthur G Roberts, Morgan E Gibbs
Pharmaceutical and Biomedical Sciences, University of Georgia, Athens, GA, USA
Abstract: As a result of an increasing aging population, the number of individuals taking multiple medications simultaneously has grown considerably. For these individuals, taking multiple medications has increased the risk of undesirable drug–drug interactions (DDIs), which can cause serious and debilitating adverse drug reactions (ADRs). A comprehensive understanding of DDIs is needed to combat these deleterious outcomes. This review provides a synopsis of the pharmacokinetic (PK) and pharmacodynamic (PD) mechanisms that underlie DDIs. PK-mediated DDIs affect all aspects of drug disposition: absorption, distribution, metabolism and excretion (ADME). In this review, the cells that play a major role in ADME and have been investigated for DDIs are discussed. Key examples of drug metabolizing enzymes and drug transporters that are involved in DDIs and found in these cells are described. The effect of inhibiting or inducing these proteins through DDIs on the PK parameters is also reviewed. Despite most DDI studies being focused on the PK effects, DDIs through PD can also lead to significant and harmful effects. Therefore, this review outlines specific examples and describes the additive, synergistic and antagonistic mechanisms of PD-mediated DDIs. The effects DDIs on the maximum PD response (Emax) and the drug dose or concentration (EDEC50) that lead to 50% of Emax are also examined. Significant gaps in our understanding of DDIs remain, so innovative and emerging approaches are critical for overcoming them.
Keywords: inhibition, induction, synergism, additive, antagonism, adverse drug reactions, ADRs
Introduction
The aging population in the USA is expected to rise in the foreseeable future and this group often deals with multiple health conditions.1,2 To treat these multiple health conditions, individuals within this group have been required to take two or more prescription drugs simultaneously. This has led to a significant increase in the number of Americans that need to take multiple medications.3 For those over 65 years old, nearly half take more than five drugs simultaneously.4 In many cases, these individuals take drugs that they do not need.4 Ultimately, taking multiple medications simultaneously increases an individual’s risk for undesirable drug–drug interactions (DDIs) that lead to serious and debilitating adverse drug reactions (ADRs).5–7
A comprehensive understanding of DDIs is critical for safer coadministration of drugs and reduced risk of ADRs. In this review, a synopsis of the pharmacokinetic (PK) and pharmacodynamic (PD) mechanisms that underlie DDIs is provided. In this work, the drug that causes the DDI will be called the “perpetrator” drug, while the drug of interest will be called the “victim” drug.8–10 In PK, DDIs touch all aspects of drug disposition: absorption, distribution, metabolism and excretion (ADME). This review will discuss the cells that play a role in each aspect of ADME and have been the focus of DDI investigations. DDIs through PK occur through drug metabolizing enzymes and drug transporters that are found within these cells. This work provides representative DDI examples with a few key proteins and examines their effect on PK parameters. Although most current investigations have focused on how PK is affected by DDIs, significant DDIs have also been noted with PD. DDIs through PD can occur through additive, synergistic and antagonistic mechanisms. Several illustrative examples of DDIs from each of these mechanisms is provided in this work. Their effect on the maximum PD response (Emax) and the drug dose or concentration at 50% of Emax (EDEC50) is discussed.
Pharmacokinetics (PK)
PK is what the body does to a drug and it includes ADME.11 Depending on the process of ADME that is affected, PK-mediated DDIs can lead to elevated free plasma concentrations of the “victim” drug that can cause undesirable ADRs and toxicity. They can also lead to depressed free plasma concentrations of the “victim” drug and reduced therapeutic efficacy. The major cells, drug-metabolizing enzymes and drug transporters that have been implicated in DDIs and are discussed in this work are shown in Figure 1. The effect of DDIs on the PK is described below and summarized with additional detail in Table 1.
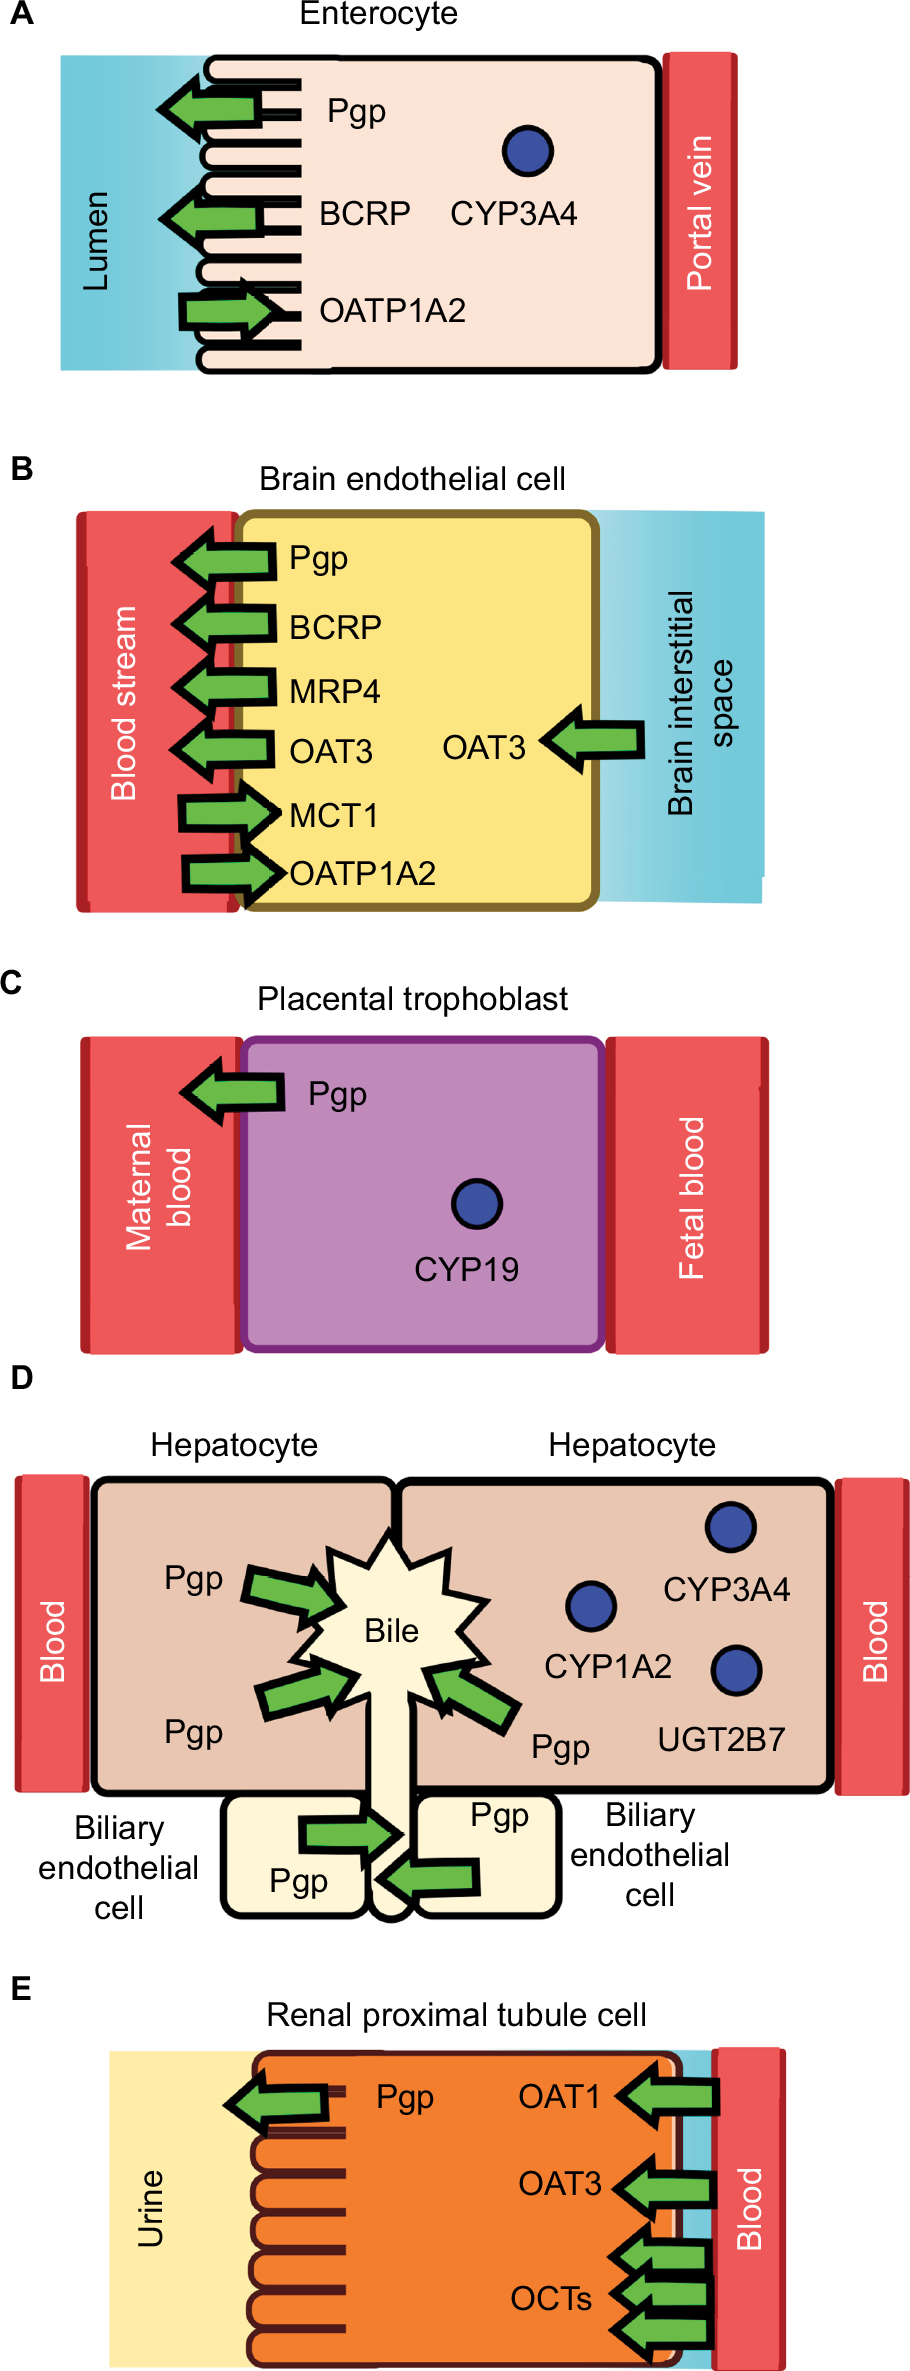 | Figure 1 Drug-metabolizing enzymes and drug transporters in (A) an enterocyte, (B) a brain endothelial cell, (C) a placental trophoblast, (D) hepatocyte and biliary endothelial cells, and (E) a renal proximal tubule cell. Notes: The drug metabolizing enzymes are shown as blue circles and the transporters are shown as arrows. The direction of the arrow reflects the direction of transport. Abbreviations: BCRP, breast cancer resistance protein; CYP1A2, CYP/CYP450 1A2; CYP3A4, CYP/CYP450 3A4; MCT1, monocarboxylate transporter 1; OAT1, organic anionic transporter 1; OAT3, organic anionic transporter 3; OATP1A2, organic anionic transporting polypeptide 1A2; OCTs, organic cationic transporters; MRP4, multidrug resistance protein 4; Pgp, P-glycoprotein. |
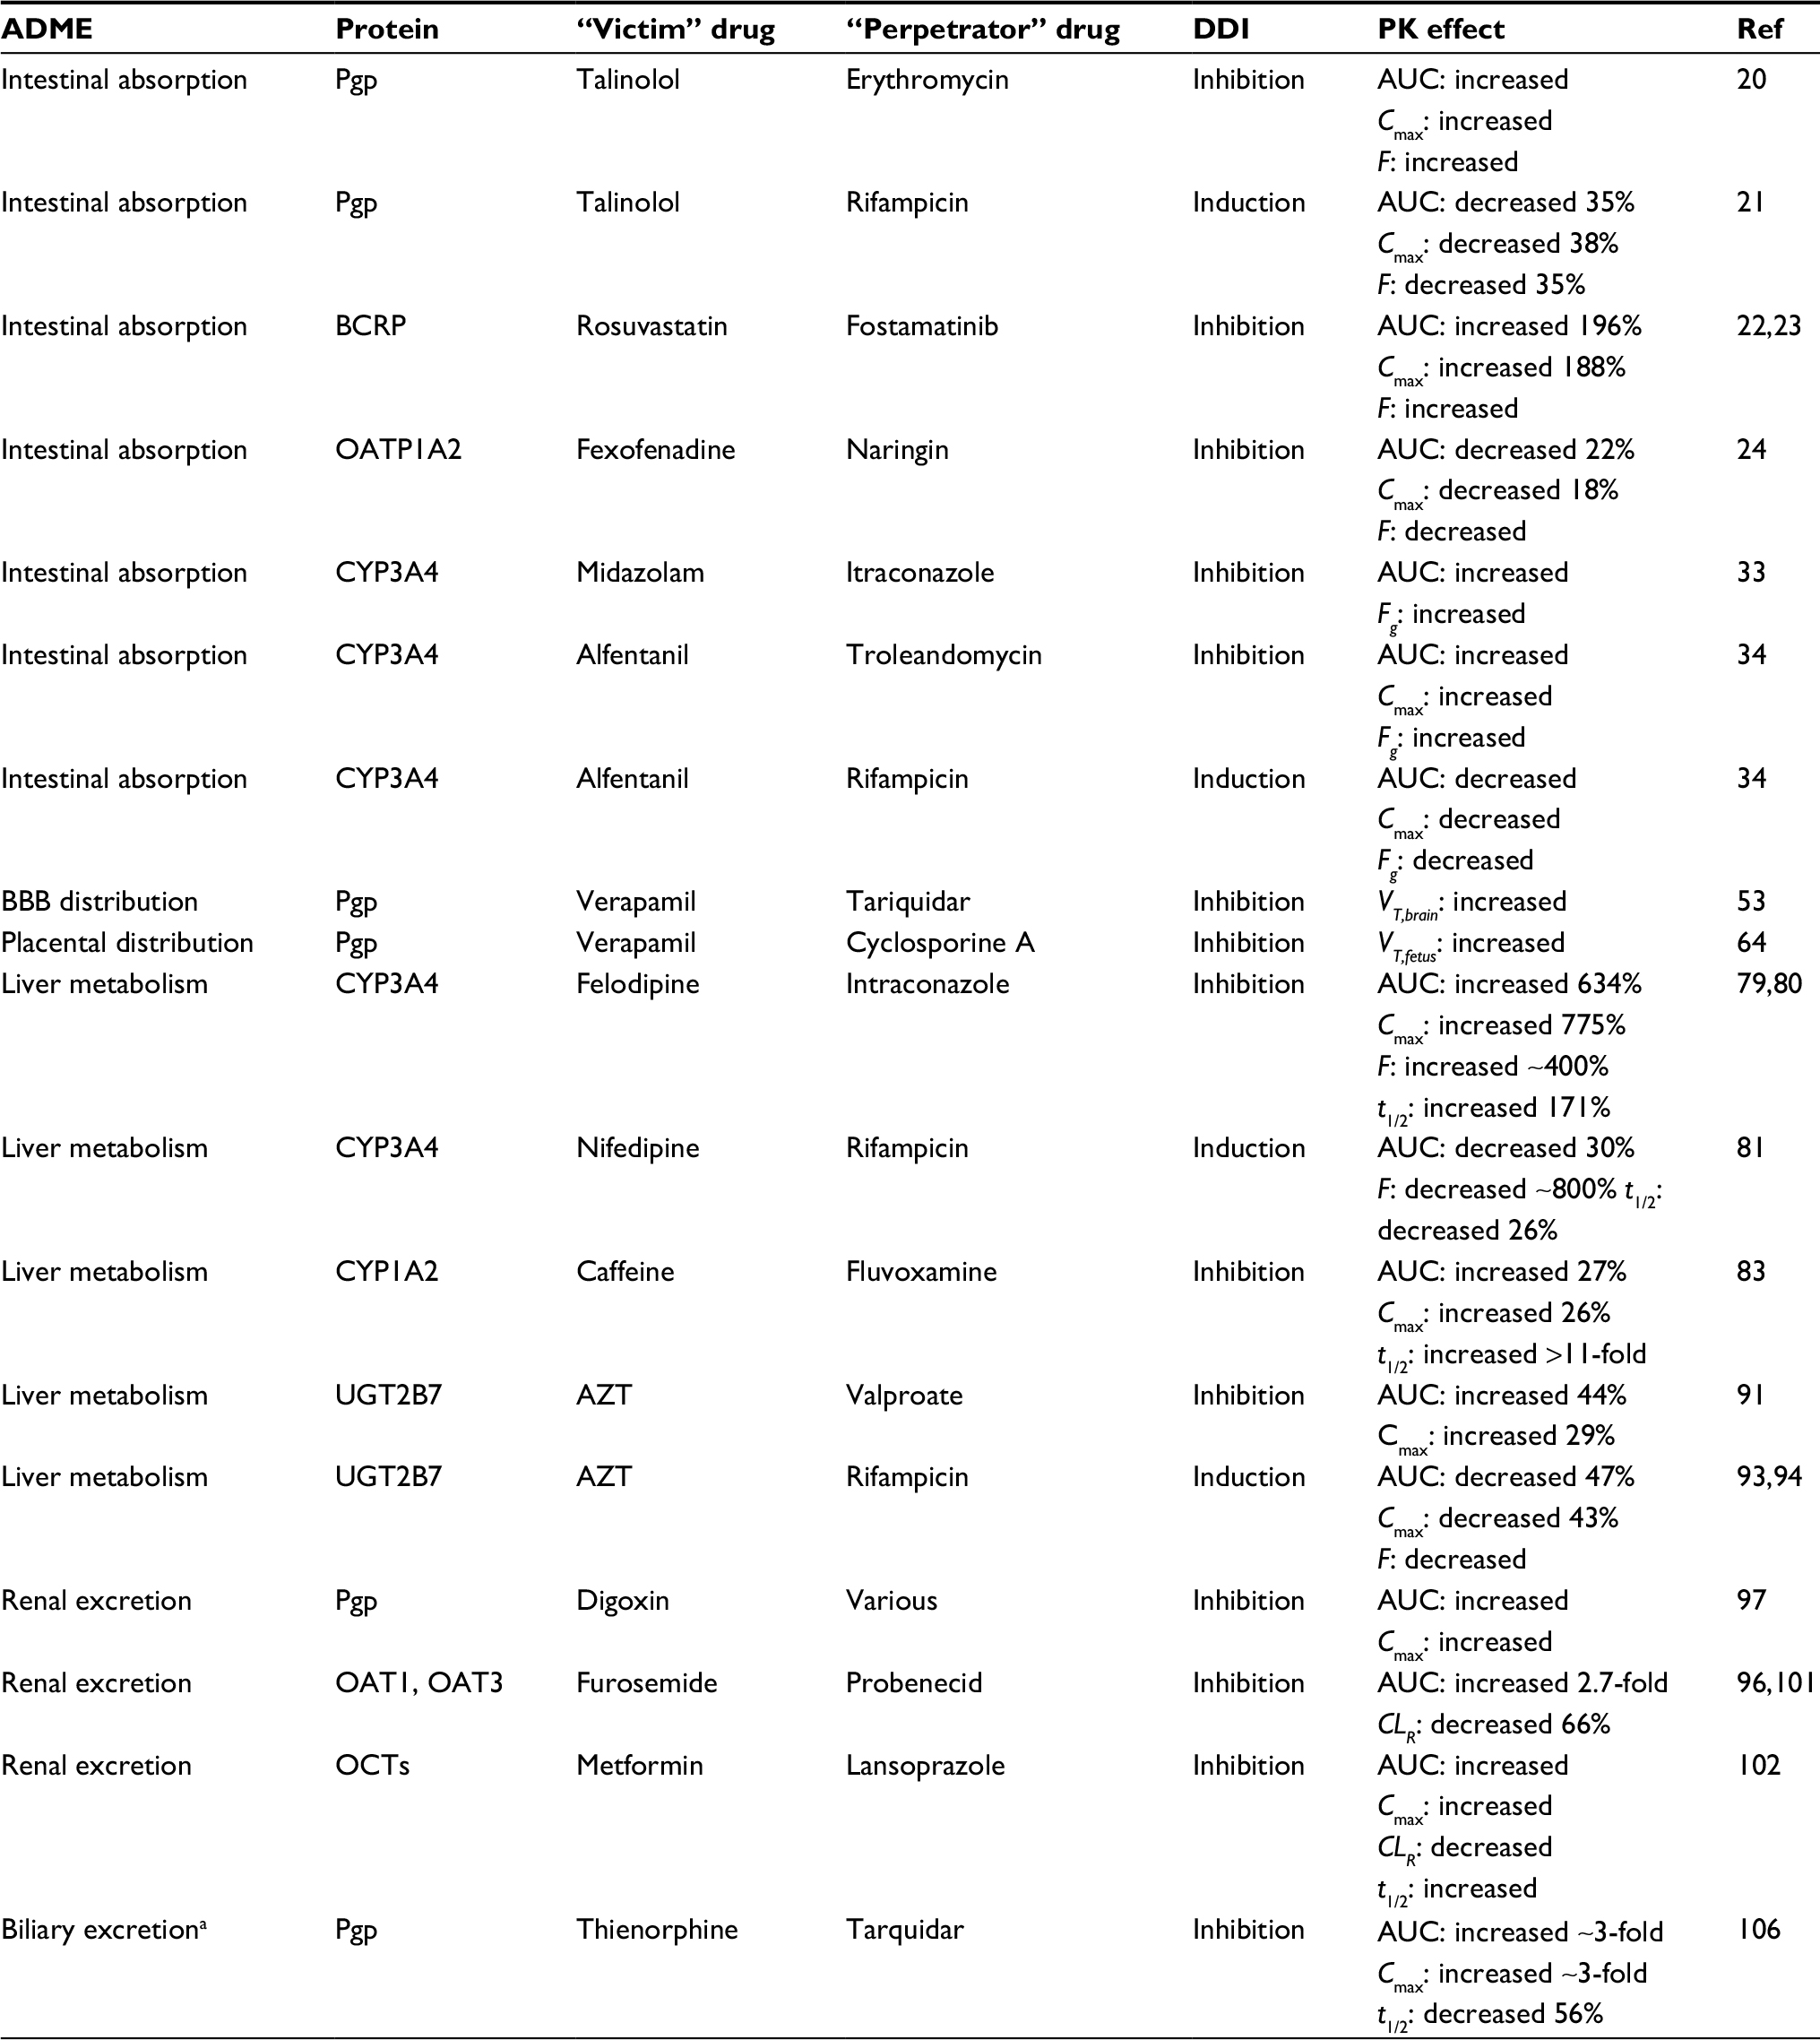 | Table 1 Pharmacokinetically mediated DDIs Notes: aData from Kong et al.106 The t1/2 of thienorphine is “paradoxically” increased due to interrupted enterohepatic circulation. Abbreviations: AUC, area under the curve; Cmax, maximum drug plasma concentration; CLR, renal clearance; DDI, drug–drug interactions; F, oral bioavailability; Fg, gut oral bioavailability; PK, pharmacokinetic; Ref, reference; t1/2, elimination half time; VT,brain, apparent brain volume distribution; VT,fetus, apparent fetal volume distribution. |
Absorption
Drug absorption can occur through both oral and extraoral routes such as through the skin.11 Because oral drug administration is the preferred route for administration,11 this review is focused on drug absorption through the gastrointestinal (GI) tract. The GI tract is composed of the mouth, esophagus, stomach, small intestines and the colon.11 Of these anatomical structures, most of the drug absorption occurs in the small intestines as a result of its relatively large surface area.11,12 The large surface area is due in large part to cells that contain microvilli called enterocytes that line the small intestine.11,12 Drug absorption in these cells is controlled by passive diffusion across the plasma membrane and the presence of drug metabolizing enzymes and drug transporters (Figure 1).11
Drug transporters
There are many drug transporters on the apical (lumen-side) and basal (blood-side) membrane surfaces of the enterocytes (Figure 1).13 Two highly expressed drug efflux transporters on the apical side of the enterocytes are Pgp and the BCRP.14 Pgp and BCRP are part of the ATP-Binding Cassette (ABC) transporter superfamily and function by effluxing drugs out from the cytosol to the intestinal lumen.15,16 Each of these transporters has distinct specificities with Pgp and BCRP being functional monomers and dimers, respectively.15,16 Also found on the apical side of enterocytes is the organic anionic transporting polypeptide 1A2 (OATP1A2), which is a drug influx transporter.17–19 In contrast to Pgp and BCRP, this transporter influxes a diverse range of ligands including fexofenadine and imatinib from the intestinal lumen to the cytosol of the enterocyte.17–19
Inhibition and induction of the transporters from DDIs within the enterocyte can lead to significant effects on drug absorption. In a randomized crossover clinical study, the Pgp inhibitor and antibiotic erythromycin was coadministered with the cardiovascular drug and Pgp substrate talinolol.20 Erythromycin inhibition of Pgp reduced the secretion of talinolol into the intestinal lumen and increased its oral bioavailability.20 In contrast, induction of Pgp by the antibiotic rifampicin in another clinic study with talinolol found that it decreased the oral bioavailability.21 Because BCRP is an efflux transporter like Pgp, one might expect the oral bioavailability of drugs to increase for substrates, when BCRP is inhibited. Indeed, inhibition of the BCRP by the tyrosine kinase inhibitor fostamatinib did increase the oral bioavailability of rosuvastatin in addition to doubling the peak serum concentration (Cmax) and area under the curve (AUC).22,23 In contrast to Pgp and BCRP, the influx transporter OATP1A2 moves drugs in the opposite direction in the enterocyte.17–19 Selective inhibition of the OATP1A2 by naringin from grapefruit juice leads to significant decreases in the AUC, Cmax and the oral bioavailability of the antihistamine fexofenadine.24
Intestinal cytochromes P450 (CYPs)
The smooth endoplasmic reticulum of enterocytes contains drug metabolizing monooxygenases, which are also found in high concentrations in the liver, called cytochromes P450 (CYPs).25 These enzymes are highly promiscuous and have several distinct isoforms.26 The enterocytes contain mostly the CYP3A (82%) subfamily enzymes with some the CYP2C9 (14%) isoform and minor concentrations of other CYPs.27,28
The expression level of CYP3A enzymes was found to vary across the small intestine with the highest levels in the duodenum.29,30 These enzymes are responsible for metabolism of a significant portion of commercially available drugs and have exhibited a significant amount of DDIs.31 However, determining specific DDIs with CYP3A enzymes is complicated by the fact that they are also present in the liver.27,28,32 However, a clinical study found that inhibition of intestinal CYP3A4 by the antifungal drug itraconazole and its metabolites increased the gut oral bioavailability (Fg) of the sedative midazolam.33 In another clinical study, inhibition of CYP3A4 by the macrolide antibiotic troleandomycin led to large increases in the AUC and increased gut oral bioavailability of the opioid drug alfentanil.34 The opposite effect occurred with the inducer rifampicin, which reduced both the AUC and the gut oral bioavailability.34
Distribution
Drug distribution involves the transfer of drugs from the systemic circulation to the rest of the body. All tissues in the body facilitate the distribution of drugs to varying degrees.35 Distribution can occur by passive diffusion and membrane protein-mediated transport.35 The membrane barriers that provide the largest roles in drug distribution are the blood–brain barrier (BBB), blood–testis barrier (BTB), blood–cerebrospinal fluid barrier (BCSFB) and the placental barrier.35 DDIs from drug distribution within these membrane barriers have been known to occur, when protein-mediated transport is inhibited or induced.11 These DDIs will result in changes in the apparent volume distribution (Vd).11 The most studied membrane barriers in terms of DDIs and distribution is the BBB followed by the placental barrier, so they both will be the focus of this review.
Blood–brain barrier
The BBB functions as a barrier for drugs into the brain and central nervous system (CNS) from the blood stream (Figure 1).36,37 The BBB is a complex structure that is composed of endothelial cells and pericytes that are surrounded by the end-feet of astrocytes.36,37 In addition, the endothelial cells that form the inner half of the BBB are held together by proteins that form tight junctions between the cells.36,37 These tight junctions prevent molecules from going between the cells. However, drugs can cross into the brain through the BBB by passive diffusion or through protein transporters located on the plasma membrane. The rate at which a drug passively diffuses across the BBB depends on its lipophilicity,38–41 its hydrogen bond donors and acceptor characteristics40,42 and its size.43 On the apical surface (lumenal or blood-side) are a variety of drug transporters that control the flow of drugs into the brain.44 On the apical plasma membrane, transport from the cytosol to the blood stream is mediated by BCRP, Pgp, the multidrug resistance protein 4 (MRP4) and the organic anionic transporter 3 (OAT3).44 Transport from the blood stream to the cytosol is controlled by the monocarboxylate transporter 1 (MCT1) and the organic anionic transporting peptide 1A2 (OATP1A2).44 On the opposite (basal) side of the endothelial side is the OAT3 transporter.44
The most studied BBB transporter is Pgp. The strongest evidence that Pgp is involved in drug transport across the BBB is from studies with Pgp knockout mice.45,46 Studies with the mouse mdr1a variant of Pgp showed large differences in drug distribution were observed between the brain and other tissues.45,46 On the other hand, there have been some question of the clinical relevance of Pgp-mediated DDIs at the BBB.47,48 In two positron emission tomography (PET) studies, there were large increases in verapamil concentration in the brain of rats and only modest changes in the human brain in the presence of the Pgp inhibitor cyclosporine A.49,50 These differences were attributed to differences in the transporter makeup between human and rodent BBB.47 In humans, the most convincing evidence of Pgp-mediated drug transport comes from PET studies with potent Pgp inhibitor tariquidar.48,51,52 This inhibitor was shown to increase brain penetration of verapamil, loperamide and a loperamide metabolite.48,51,52 In a group of healthy individuals, tariquidar increased the apparent brain volume distribution of the cardiovascular drug verapamil.53
Placental barrier
The placenta is a layer of tissue that separates the mother from the unborn child.54 Distribution of drugs across the placenta are regulated by phase I and phase II drug metabolizing enzymes and transporters within the syncytiotrophoblast.55 Unfortunately, our current understanding of DDIs with the placenta remains limited.140
The phase I drug metabolizing enzyme CYP/CYP450 19 (CYP19) (a.k.a. aromatase) has the highest level of mRNA expression in the placenta.55 The enzyme has substrates, inhibitors and CYP19 expression modulators that could potentially lead to DDIs.56 For example, the opioid drug methadone was found to be a substrate and mechanism-based inhibitor of CYP19.57 As a result, methadone has significant risk for DDIs with CYP19 substrates including the antidiabetic drug glyburide.58 In terms of CYP19 expression modulators, the drug betamethasone, which is commonly administered to pregnant women, was shown to down regulate mRNA expression of CYP19.59 The corticosteroid dexamethasone, which is often administered to pregnant women, was found to have the opposite effect and induce CYP19 expression.60
The placenta is also known to have a variety of drug transporters.140 Most DDI investigations with the placenta have been focused on Pgp.140 Pgp has been shown to play a protective role against drugs in wild type and Pgp knockout mice.61,62 A study done with pregnant nonhuman primates showed that Pgp activity increased with gestational age for the mother and within the placental barrier suggesting that it might be an important factor to consider during pregnancy.63
Most Pgp DDI investigations have focused on Pgp inhibition.140 In a perfused human placenta model, Pgp inhibition has increased drug penetration in the placenta including the anti-HIV drug lopinavir.140 In a PET study of a nonhuman primate, the Pgp inhibitor cyclosporine A and the cardiovascular drug [11C]-verapamil showed increased tissue distribution in the maternal brain and the fetal liver.64 There is some in vitro evidence that Pgp may behave differently in the placenta than other tissues. The Pgp inhibitors, quinidine and verapamil, had no effect on Pgp-mediated digoxin transport in an isolated perfused human placenta.65 However, verapamil did inhibit Pgp-mediated talinolol transport in the same in vitro system.66
Metabolism
Drug metabolizing enzymes can be found throughout the body including the brain,67 heart,68 lungs,69 intestines70 and even the skin.71 Metabolism in ADME typically refers to enzymatic biotransformations that occur in the liver.11 In the liver, drug metabolizing enzymes are expressed in the hepatocytes and the biliary epithelium (Figure 1).25,72 There are both phase I and phase II drug metabolizing enzymes in these cells.73 CYPs dominate the phase I drug metabolizing enzymes, while UDP glucuronosyl transferases (UGTs) and sulfotransferases (SULTs) dominate the phase II drug metabolizing enzymes.73 Unlike the intestines, the major CYP isoforms and subfamilies are evenly distributed throughout the liver and include CYP1A2, CYP2B6, CYP2C, CYP2D6, CYP2E1, CYP4F and CYP3A.29,32,74 The major UGT subfamilies found in the liver are UGT1A and UGT2B.75 The SULT1A1 is the major sulfotransferase isoform in the liver.76
Hepatic CYPs
While intestinal CYPs affect drug absorption, the hepatic CYPs affect drug elimination.11 DDIs from CYPs in the liver occur as a result of inhibiting or inducing expression of the CYPs.11 Inhibiting CYP will increase the Cmax, AUC and the elimination half-time (t1/2), while inducing it will have the opposite effect on those PK parameters.11 Many CYP DDI studies have focused on the CYP3A4 isoform.77,78 Deciphering specific DDIs from liver CYP3A4 is complicated by the fact that there is significant expression of CYP3A4 in the liver and intestines.27,28,32 There have been attempts to separate their individual effects.79 For example, in a PK study, the anti-fungal drug and CYP3A4 inhibitor itraconazole was coadministered with the cardiovascular drug felodipine.80 Itraconazole was found to increase the Cmax and the AUC of felodipine several fold.80 A later analysis suggested that intestinal and hepatic CYP3A4 caused similar increases in felodipine bioavailability.79,80 In another clinical study, the effects from intestinal and liver nifedipine metabolism by CYP3A4 after induction by rifampicin was examined.81 Rifampicin induction of CYP3A4 caused the AUC and the elimination t1/2 to decrease about 30%.81 Rifampicin primarily affected the intestinal extraction ratio revealing that most of the DDIs are due to intestinal CYP3A4 and not hepatic CYP3A4.81
Of the CYPs, the CYP1A2 isoform makes significant contributions to the liver, but only plays a minor role in the intestine.28,32 Therefore, clinically observed DDIs with this CYP will reflect liver metabolism and not biotransformations within the intestines. The serotonin reuptake inhibitor (SSRI) fluvoxamine is a specific inhibitor of CYP1A2.82 When fluvoxamine was coadministered with caffeine, there were significant increases to the Cmax and AUC of caffeine, and there was more than an 11-fold increase in the elimination t1/2 of the stimulant.83
UDP-glucuronosyltransferases (UGTs)
UGTs are a family of conjugating phase II enzymes that catalyzes the transfer of glucuronic acid to hydroxyl, carboxyl, or amine functional groups of drugs.84 UGTs in the liver are membrane anchored proteins that reside within the smooth endoplasmic reticulum in hepatocytes and biliary endothelial cells.85 Glucuronidation through the UGT2B7 isoform is the primary pathway for metabolism of antiretroviral drug azidothymidine (AZT) making it an ideal probe substrate for UGT DDIs.86–89 Both in vitro and in vivo investigations with AZT have noted significant DDIs with the drug.90 In an in vitro study, the anti-seizure drug valproate inhibited glucuronidation of AZT by Chinese hamster lung fibroblasts overexpressing UGT2B7.88 This in vitro result correlates well with a clinical study performed on HIV-infected individuals.91 They found a significant reduction in the AUC and Cmax of the glucuronidated product and an increase in the AUC and Cmax of the parent drug.91 UGTs in the liver can also be induced by rifampicin.92 In a couple of clinical studies with HIV-infected patients, rifampicin induction of the UGT1A1 isoform caused significant reduction in the AUC and Cmax of the AZT.93,94
Excretion
In this review, drug excretion is defined as the removal of drugs from the body, so that it is not confused with elimination, which includes biotransformation in the liver. More than two thirds of drug excretion occurs through the kidneys with most of the remaining excretion occurring through the liver via the bile.11 Only a minor amount of drugs are excreted through the sweat and the lungs, so it will not be discussed in this review.11
Renal excretion
Renal drug excretion is primarily mediated by drug transporters within renal tubular cells (RTCs) of the proximal convoluted tubule found in the nephron (Figure 1).95,96 The RTCs have a wide range of cationic and anionic drug transporters.95,96 In this section, a brief discussion of DDIs is provided of Pgp, organic anionic transporters (OATs) and organic cationic transporters (OCTs).
One of the most investigated drug transporters in the kidney is the Pgp transporter. It is found in the brush-border apical membrane of RTCs and effluxes drugs from the cytosol into the urine.95 Many DDI investigations have been performed with the cardiovascular drug digoxin due to its low therapeutic index, its propensity for DDIs with Pgp, and the fact that it is primarily excreted through the kidneys by Pgp.97 Drug transport is inhibited by a wide range of “perpetrator” drugs including the anti-cancer drug paclitaxel and cholesterol lowering statin drugs.97 Inhibition of digoxin transport by Pgp leads to significant increases in the AUC and the elimination t1/2 with corresponding decreases in the renal clearance (CLR).97 Unlike other Pgp substrates, administration of the Pgp inducer rifampicin did not affect the CLR or t1/2 of digoxin.98
The OAT transporter family of exchange transporters are responsible for transporting anionic drugs including diuretics, antivirals and antibiotics.99,100 The OAT 1–3 isoforms are located on the S2 segment of the proximal tubule on the basolateral membrane, while OAT4 and the urate/anion exchanger (URAT1) isoforms are located on the apical membrane.95,99 This transporter family is an exchange transporter that exchanges drugs for carboxylates.99 The OAT1 and OAT3 transporters are responsible for the transport of the diuretic furosemide.101 When furosemide transport by OAT1 and OAT3 are inhibited by probenecid, there is significant elevations in the AUC of furosemide and reduction in its CLR.96,101
Members of the OCT transporter family can transport cationic drugs such as the antihypertensive drug atenolol and the antiviral drug lamivudine.96 These transporters are located on the basolateral membranes of the RTCs.95 One of the most studied drugs within this transporter family is the antidiabetic drug metformin, which is a substrate for several isoforms of OCT transporters.102 The drug is advantageous for studying renal DDIs because it does not undergo significant hepatic metabolism.103 The proton pump and OCT inhibitor lansoprazole increased the AUC, increased the elimination t1/2 and reduced the CLR.102 Metformin PK parameters were similarly affected by DDIs with the histamine H2 receptor antagonist cimetidine and the drug pyrimethamine.96
Biliary excretion
Less than a third of drugs are excreted through the bile.11 Excretion in the liver occurs through transporters that are located within hepatocytes and biliary endothelial cells of the bile ducts.104 There is a diverse range of transporters in these cells including OATs and OCTs.104 The most studied transporter is Pgp, which is located on apical membrane of hepatocytes and endothelial cells of the bile duct.104 The opioid agonist thienorphine undergoes significant biliary excretion in rats.105 When Pgp inhibitor tarquidar was coadministered to rats, the Cmax and AUC of thienorphine increased, while the mean residence time (MRT) and the elimination t1/2 decreased.106 The “paradoxically” reduced MRT and elimination t1/2 of thienorphine was attributed to interrupted enterohepatic circulation through the bile ducts.106
Pharmacodynamics
PD defines what a drug does to the body that leads to a physiological response.11 Drugs can induce a PD response by interacting with protein receptors such as the case of agonists with the GABAA receptor.107 They may also interact with proteins in the second messenger system such as the case of tyrosine kinase inhibitors that target the protein kinase.108 PD can also occur with enzymes such as the nonsteroidal anti-inflammatory drugs (NSAIDs) and the platelet cyclooxygenase to inhibit platelet activation.109
PD DDIs occur when a coadministered drug alters the PD effect of another drug outside of their PK effects.110 Like PK DDIs, these DDIs occur when two or more drugs are coadministered to a patient.110 The drugs can antagonize or synergistically interact.110 DDIs can also occur with drugs that have similar modes of action such as lowering blood pressure.111 PD DDIs can have additive, synergistic or antagonistic effects on PD responses.110
The Emax and the EDEC50 can change in response to PD-mediated DDIs. A decrease in the EDEC50 leads to a “leftward” shift of the dose response curve and indicates synergism.110,112 No change in the EDEC50 of the dose response curve and an Emax that reflects the sum of individual PD responses indicates additivity.110,112 An increase in the EDEC50, which will lead to a “rightward” shift in the dose response curve, reveals competitive antagonism.110,112 Depending on the PD DDI mechanism, a decrease in the Emaxcan be due to noncompetitive or uncompetitive antagonism.110,112,113
Beyond analyses of dose response curves, there are analytical methods that can be used to quantitatively determine PD DDIs.110 DDIs can be graphically assessed using an isobologram with the drug doses at 50% of Emax plotted along the axes.110 Additive PD DDIs will typically appear as a diagonal straight line on these graphs, but can be nonlinear in cases where one of the drugs is a partial agonist.110,114 Synergistic and antagonistic DDIs from PD will have leftward and rightward curvature, respectively, with respect to a diagonal in these graphs.110 Competitive antagonists can also be assessed using Schild plots, which exploit the observed “rightward” shift of the dose response curves.110 They will lead to positive linear slopes in these graphs.110 Table 2 summarizes the PD-mediated DDIs for representative drugs and their effect on PD Parameters. Clinical examples of additive, synergistic and antagonistic PD DDIs are described below.
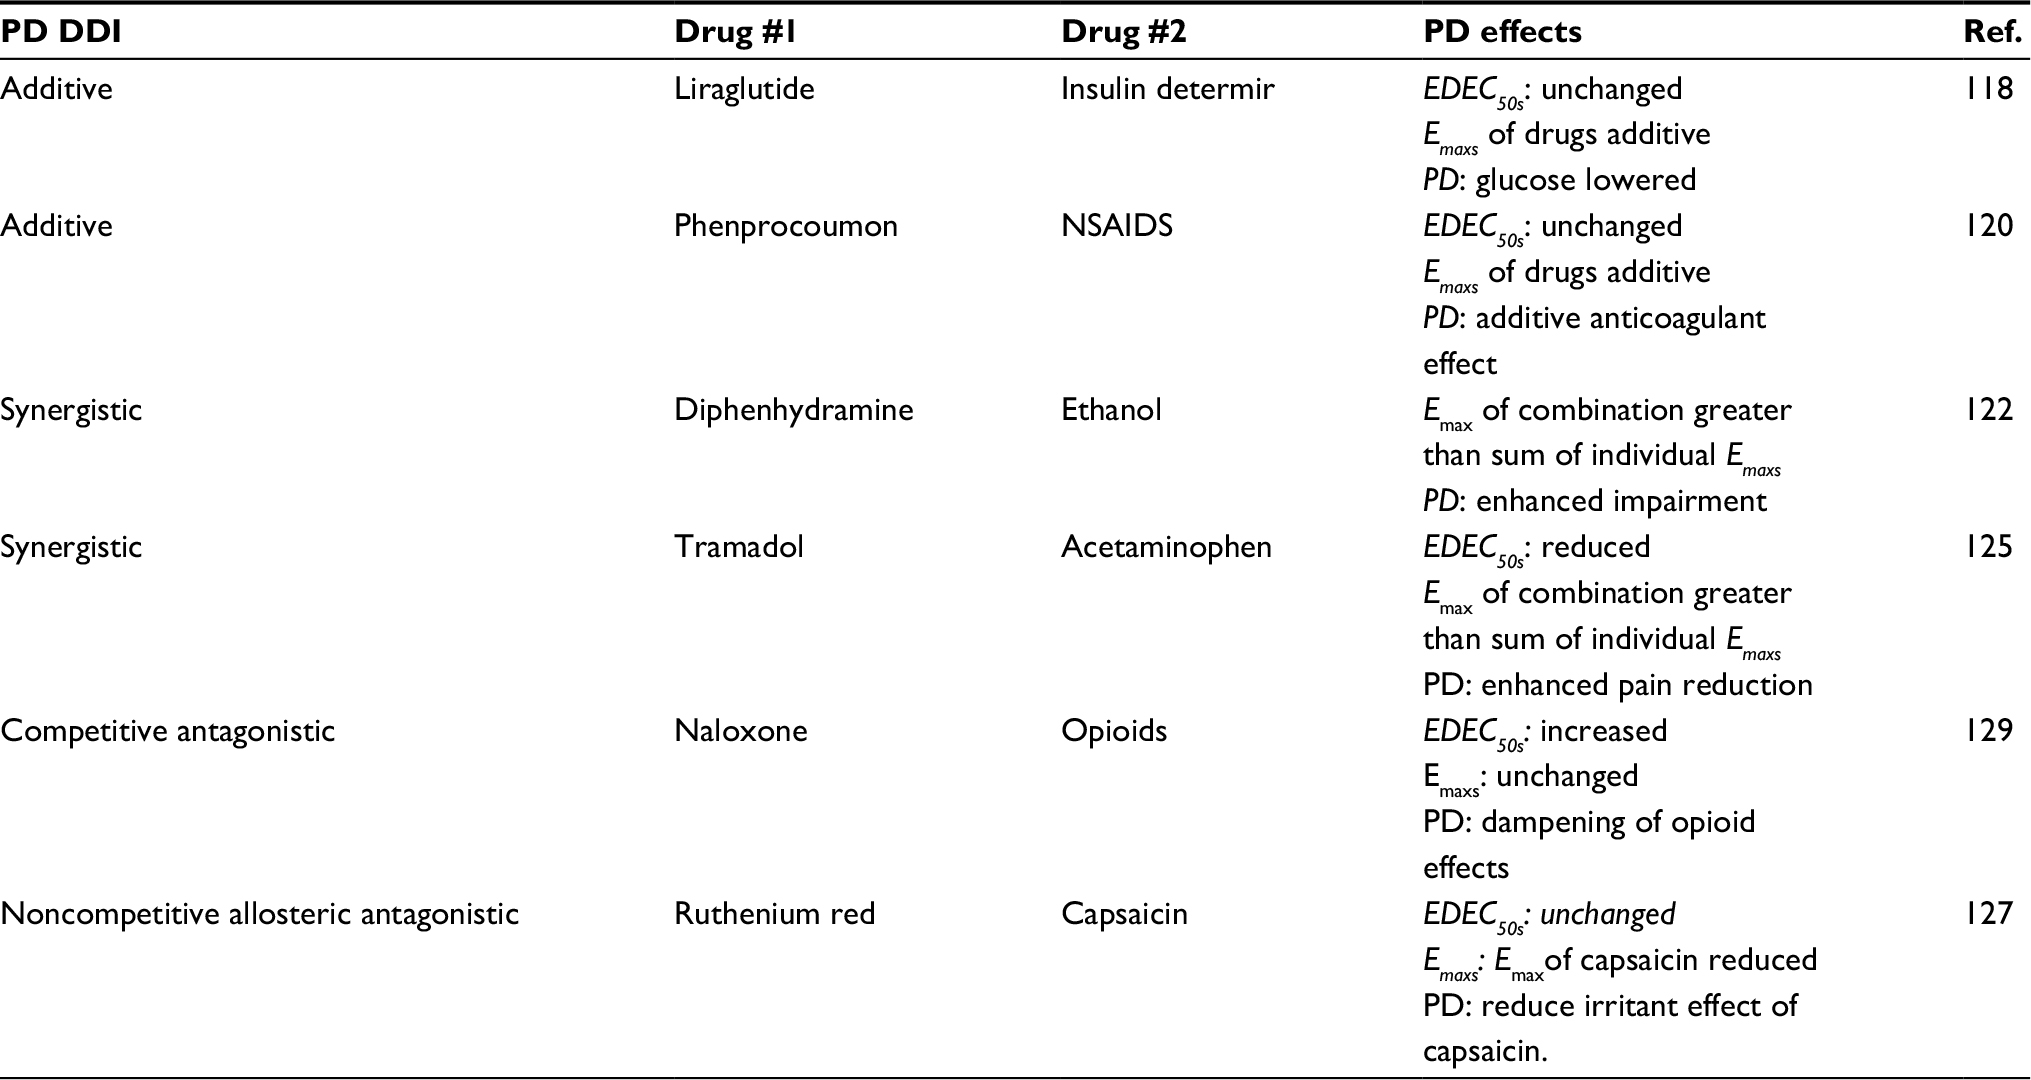 | Table 2 Pharmacodynamically mediated DDIs Abbreviations: DDI, drug -drug interactions; NSAIDs, nonsteroidal anti-inflammatory drugs; PD, pharmacodynamics; Ref, reference. |
Additive
An additive PD DDI is when the overall PD response is the sum of the individual PD responses from the individual drugs.115 This DDI is in contrast with a synergistic DDI where the overall PD response is greater than the sum of the individual PD responses.110 For example, liraglutide is a derivative metabolic hormone that acts as a long-acting glucagon-like peptide-1 receptor agonist that lowers glucose,116 while insulin detemir is a long acting insulin derivative that also functions to reduce blood glucose.117 When the drugs are coadministered, the glucose lowering effect of the two drugs is additive and equal to the sum of the individual PD responses.118 The drug interactions of phenprocoumon and nonsteroidal anti-inflammatory drugs (NSAIDs) is another example of an additive DDI.115 Phenprocoumon is a vitamin K antagonist that inhibits vitamin K oxide reductase and indirectly prevents the activation of several clotting factors.119 NSAIDs inhibit platelet cyclooxygenase, which prevents platelet activation.109 The net effect of taking these drugs together is that their anti-coagulant effects are additive leading to an increased risk of bleeding.120
Synergistic
When the two or more drugs are taken together and the resulting DDIs are synergistic, the resulting PD response can be greater than the sum of the individual PD responses.121 For example, the combination of diphenhydramine and ethanol leads to synergism in the PD response.122 Ethanol acts as a GABAA receptor agonist increasing chloride conductance on the post synaptic neuron.123 Diphenhydramine is a muscuranic acetylcholine receptor antagonist causing a reduction in positive charge of the neuron.124 This leads to a net increase in the negative charge across the neuron and increased mental impairment.122 Another example of PD synergism is with the drugs tramadol and acetaminophen.125 These drugs exhibited a greater reduction in pain and an enhanced antihyperalgesic effect than the drugs taken alone.125
Antagonistic
Drug antagonism occurs when a “perpetrator” drug dampens or inhibits the PD response of a “victim” drug. Antagonism can be competitive, noncompetitive and uncompetitive. As mentioned above, competitive antagonism occurs when a “perpetrator” drug increases the EDEC50, but has no effect on the Emax.126 In contrast, noncompetitive antagonism causes a reduction in the Emax, but has no significant effect on the EDEC50 (eg,127). Uncompetitive antagonism can have similar effects on Emax and EDEC50 as noncompetitive antagonism, but requires interaction by the “victim” drug first to the receptor.113
A good use of competitive antagonism is with the drug naloxone (Narcan®). Naloxone counteracts the effect of opioids, which are µ-opioid receptor agonists, by competing for the µ-opioid receptor.128 In rats, naloxone was more effective at blocking the effects of the µ-opioid receptor agonists methadone and fentanyl than the µ-opioid receptor agonists heroin and morphine.129 In a clinical study with opioid-dependent individuals, naloxone was found to counteract the PD response of the µ-opioid agonist buprenorphine.130 Noncompetitive PD antagonism can be allosteric in that it occurs at an alternate site than the “victim” drug or it can be irreversible. The interaction of ruthenium red with capsaicin is an example of noncompetitive allosteric antagonism.127 Ruthenium red was found to reduce contractile response induced by capsaicin in rat tissues.127 The antagonistic effect is likely due to competition between these molecules at different sites on the transient receptor potential (TRP) channels.131 The drug omeprazole (Prilosec®) is a noncompetitive irreversible antagonist by covalently modifying the H+,K+-ATPase in the stomach.132,133 The Alzheimer’s drug memantine is an example of an uncompetitive antagonist, which interacts with the N-methyl-d-aspartate (NMDA) receptor and is used in the treatment of Alzheimer’s disease.134,135 The uncompetitive antagonism of memantine differs from noncompetitive antagonists in that it requires activation of the NMDA receptor before memantine binding can occur.113
Conclusion and outlook
Understanding DDIs remains an ongoing challenge and significant gaps in our understanding remain. This review was focused on representative DDIs between two drugs. However, it is quite common for individuals, especially the elderly, to be taking considerably more drugs at a time.5,7 In this case, the DDIs may be very complex and exceedingly difficult to deconvolute. Several novel analytical approaches are emerging that will allow deconvolution of complex drug interactions from multiple drug targets simultaneously. An ensemble approach for multiple drug target deconvolution was recently used to decipher the interactions of inhibitors to multiple kinases.136 A random walk algorithm was developed to unravel the protein–protein interaction network that underlies PD-mediated DDIs.137 In silico methods have been developed to predict both PK and PD DDIs of arbitrary molecules.138,139 Ultimately, novel future approaches to investigate and deconvolute DDIs will lead to safer and more efficacious coadministration of drugs.
Acknowledgments
We would like to thank the National Cancer Institute for a NIH R01 grant (1R01CA204846-01A1) and National Institute of General Medical Sciences for an NIH R15 grant (1R15GM107913-01A1) for funding this work.
Disclosure
The authors report no conflicts of interest in this work.
References
Ortman JM, Velkoff VA, Hogan H. An Aging Nation: The Older Population in the United States. Suitland, MD: US Census Bureau; 2014. | ||
Salive ME. Multimorbidity in older adults. Epidemiol Rev. 2013;35:75–83. | ||
Gu Q, Dillon CF, Burt VL. Prescription drug use continues to increase: U.S. prescription drug data for 2007-2008. NCHS Data Brief. 2010;42:1–8. | ||
Rambhade S, Chakarborty A, Shrivastava A, Patil UK, Rambhade A. A survey on polypharmacy and use of inappropriate medications. Toxicol Int. 2012;19(1):68–73. | ||
Maher RL, Hanlon JT, Hajjar ER. Clinical consequences of polypharmacy in elderly. Expert Opin Drug Saf. 2014;13(1). | ||
Rodrigues MCS, de Oliveira C. Drug-drug interactions and adverse drug reactions in polypharmacy among older adults: an integrative review 1. Rev Lat Am Enfermagem. 2016;24. | ||
Shah BM, Hajjar ER. Polypharmacy, adverse drug reactions, and geriatric syndromes. Clin Geriatr Med. 2012;28(2):173–186. | ||
Ogilvie BW, Parkinson A. Drugs as victims and perpetrators and the pharmacokinetic concept of maximum exposure. Handb Metab Pathways Xenobiot. 2014:103–123. | ||
Polasek TM, Fpy L, Miners JO, Doogue MP. Perpetrators of pharmacokinetic drug–drug interactions arising from altered cytochrome P450 activity: a criteria-based assessment. Br J Clin Pharmacol. 2011;71(5):727–736. | ||
Prueksaritanont T, Chu X, Gibson C, et al. Drug–drug interaction studies: regulatory guidance and an industry perspective. AAPS J. 2013;15(3):629–645. | ||
Rowland M, Tozer TN. Clinical Pharmacokinetics and Pharmacodynamics: Concepts and Applications, 4th ed. Philadelphia, PA: Lippincott Williams & Wilkins; 2010. | ||
Helander HF, Fändriks L. Surface area of the digestive tract - revisited. Scand J Gastroenterol. 2014;49(6):681–689. | ||
Müller J, Keiser M, Drozdzik M, Oswald S. Expression, regulation and function of intestinal drug transporters: an update. Biol Chem. 2016;398(2):175–192. | ||
Vaessen SF, van Lipzig MM, Pieters RH, Krul CA, Wortelboer HM, van de Steeg E. Regional expression levels of drug transporters and metabolizing enzymes along the pig and human intestinal tract and comparison with Caco-2 cells. Drug Metab Dispos. 2017;45(4):353–360. | ||
Wilkens S. Structure and mechanism of ABC transporters. F1000Prime Rep. 2015;7:14. | ||
Ni Z, Bikadi Z, Rosenberg MF, Mao Q. Structure and function of the human breast cancer resistance protein (BCRP/ABCG2). Curr Drug Metab. 2010;11(7):603–617. | ||
Kalliokoski A, Niemi M. Impact of OATP transporters on pharmacokinetics. Br J Pharmacol. 2009;158(3):693–705. | ||
Obaidat A, Roth M, Hagenbuch B. The expression and function of organic anion transporting polypeptides in normal tissues and in cancer. Annu Rev Pharmacol Toxicol. 2012;52:135–151. | ||
Roth M, Obaidat A, Hagenbuch B. OATPs, OATs and OCTs: the organic anion and cation transporters of the SLCO and SLC22A gene superfamilies. Br J Pharmacol. 2012;165(5):1260–1287. | ||
Schwarz UI, Gramatté T, Krappweis J, Oertel R, Kirch W. P-glycoprotein inhibitor erythromycin increases oral bioavailability of talinolol in humans. Int J Clin Pharmacol Ther. 2000;38(4):161–167. | ||
Westphal K, Weinbrenner A, Zschiesche M, et al. Induction of P-glycoprotein by rifampin increases intestinal secretion of talinolol in human beings: A new type of drug/drug interaction. Clin Pharmacol Ther. 2000;68(4):345–355. | ||
Elsby R, Martin P, Surry D, Sharma P, Fenner K. Solitary inhibition of the breast cancer resistance protein efflux transporter results in a clinically significant drug-drug interaction with rosuvastatin by causing up to a 2-fold increase in statin exposure. Drug Metab Dispos. 2016;44(3):398–408. | ||
Martin P, Gillen M, Ritter J, et al. Effects of fostamatinib on the pharmacokinetics of oral contraceptive, warfarin, and the statins rosuvastatin and simvastatin: results from phase I clinical studies. Drugs in R&D. 2016;16(1):93–107. | ||
Bailey DG, Dresser GK, Leake BF, Kim RB. Naringin is a major and selective clinical inhibitor of organic anion-transporting polypeptide 1A2 (OATP1A2) in grapefruit juice. Clin Pharmacol Ther. 2007;81(4):495–502. | ||
Murray GI, Barnes TS, Sewell HF, Ewen SW, Melvin WT, Burke MD. The immunocytochemical localisation and distribution of cytochrome P-450 in normal human hepatic and extrahepatic tissues with a monoclonal antibody to human cytochrome P-450. Br J Clin Pharmacol. 1988;25(4):465–475. | ||
Ortiz de Montellano PR. Cytochrome P450: Structure, Mechanism, and Biochemistry. 4th ed: Switzerland: Springer International Publishing; 2015. | ||
Galetin A, Gertz M, Houston JB. Contribution of intestinal cytochrome P450-mediated metabolism to drug-drug inhibition and induction interactions. Drug Metab Pharmacokinet. 2010;25(1):28–47. | ||
Paine MF, Hart HL, Ludington SS, Haining RL, Rettie AE, Zeldin DC. The human intestinal cytochrome P450 “pie.” Drug Metab Dispos. 2006;34(5):880–886. | ||
Nakanishi Y, Matsushita A, Matsuno K, et al. Regional distribution of cytochrome P450 mRNA expression in the liver and small intestine of cynomolgus monkeys. Drug Metab Pharmacokinet. 2010;25(3):290–297. | ||
Thummel KE, Kunze KL, Shen DD. Enzyme-catalyzed processes of first-pass hepatic and intestinal drug extraction. Adv Drug Deliv Rev. 1997;27(2-3):99–127. | ||
Haddad A, Davis M, Lagman R. The pharmacological importance of cytochrome CYP3A4 in the palliation of symptoms: review and recommendations for avoiding adverse drug interactions. Support Care Cancer. 2007;15(3):251–257. | ||
Michaels S, Wang MZ. The revised human liver cytochrome P450 “Pie”: absolute protein quantification of CYP4F and CYP3A enzymes using targeted quantitative proteomics. Drug Metab Dispos. 2014;42(8):1241–1251. | ||
Templeton I, Peng C-C, Thummel K, Davis C, Kunze K, Isoherranen N. Accurate prediction of dose-dependent CYP3A4 inhibition by itraconazole and Its metabolites from in vitro inhibition data. Clin Pharmacol Ther. 2010;88(4):499–505. | ||
Kharasch Evan D, Alysa W, Christine H, Pamela S. Intravenous and oral alfentanil as in vivo probes for hepatic and first-pass cytochrome P450 3A activity: noninvasive assessment by use of pupillary miosis. Clin Pharmacol Ther. 2004;76(5):452–466. | ||
Grover A, Benet LZ. Effects of drug transporters on volume of distribution. AAPS J. 2009;11(2):250–261. | ||
Ballabh P, Braun A, Nedergaard M. The blood–brain barrier: an overview: structure, regulation, and clinical implications. Neurobiol Dis. 2004;16(1):1–13. | ||
Zhao Z, Nelson AR, Betsholtz C, Zlokovic BV. Establishment and dysfunction of the blood-brain barrier. Cell. 2015;163(5):1064–1078. | ||
Abbott NJ. Anatomy and physiology of the blood–brain barriers. In: Hammarlund-Udenaes M, de Lange E, Thorne RG, editors. Drug Delivery to the Brain: Physiological Concepts, Methodologies and Approaches. New York: Springer; 2014:3–21. | ||
Bradbury MWB. Physiology and Pharmacology of the Blood-Brain Barrier. Berlin, Heidelberg: Springer Science & Business Media; 2012. | ||
Pardridge WM. Transport of protein-bound hormones into tissues in vivo. Endocr Rev. 1981;2(1):103–123. | ||
Serlin Y, Shelef I, Knyazer B, Friedman A. Anatomy and physiology of the blood-brain barrier. Semin Cell Dev Biol. 2015;38:2–6. | ||
Chikhale EG, K-Y N, Burton PS, Borchardt RT. Hydrogen bonding potential as a determinant of the in vitro and in situ blood–brain barrier permeability of peptides. Pharm Res. 1994;11(3):412–419. | ||
Levin VA. Relationship of octanol/water partition coefficient and molecular weight to rat brain capillary permeability. J Med Chem. 1980;23(6):682–684. | ||
Urquhart BL, Kim RB. Blood−brain barrier transporters and response to CNS-active drugs. Eur J Clin Pharmacol. 2009;65(11):1063. | ||
Schinkel AH, Mayer U, Wagenaar E, et al. Normal viability and altered pharmacokinetics in mice lacking mdr1-type (drug-transporting) P-glycoproteins. Proc Natl Acad Sci U S A. 1997;94(8):4028–4033. | ||
Schinkel AH, Smit JJ, van Tellingen O, et al. Disruption of the mouse mdr1a P-glycoprotein gene leads to a deficiency in the blood-brain barrier and to increased sensitivity to drugs. Cell. 1994;77(4):491–502. | ||
Eyal S, Hsiao P, Unadkat JD. Drug interactions at the blood-brain barrier: fact or fantasy? Pharmacol Ther. 2009;123(1):80–104. | ||
Sugimoto H, Hirabayashi H, Amano N, Moriwaki T. Retrospective analysis of P-glycoprotein-mediated drug-drug interactions at the blood-brain barrier in humans. Drug Metab Dispos. 2013;41(4):683–688. | ||
Hsiao P, Sasongko L, Link JM, et al. Verapamil P-glycoprotein transport across the rat blood-brain barrier: cyclosporine, a concentration inhibition analysis, and comparison with human data. J Pharmacol Exp Ther. 2006;317(2):704–710. | ||
Sasongko L, Link JM, Muzi M, et al. Imaging P-glycoprotein transport activity at the human blood-brain barrier with positron emission tomography. Clin Pharmacol Ther. 2005;77(6):503–514. | ||
Bauer M, Karch R, Zeitlinger M, et al. Approaching complete inhibition of P-glycoprotein at the human blood–brain barrier: an (R)-[11C]verapamil PET study. J Cereb Blood Flow Metab. 2015;35(5):743–746. | ||
Cantore M, Benadiba M, Elsinga PH, et al. 11C- and 18F-labeled radioligands for P-Glycoprotein imaging by positron emission tomography. ChemMedChem. 2016;11(1):108–118. | ||
Bauer M, Zeitlinger M, Karch R, et al. P-glycoprotein mediated interaction between (R)-[11C]verapamil and tariquidar at the human blood-brain barrier studied with positron emission tomography, a comparison with rat data. Clin Pharmacol Ther. 2012;91(2):227–233. | ||
Griffiths SK, Campbell JP. Placental structure, function and drug transfer. Contin Educ Anaesth Crit Care Pain. 2015;15(2):84–89. | ||
Nishimura M, Yaguti H, Yoshitsugu H, Naito S, Satoh T. Tissue distribution of mRNA expression of human cytochrome P450 isoforms assessed by high-sensitivity real-time reverse transcription PCR. Yakugaku Zasshi. 2003;123(5):369–375. | ||
Hong Y, Cho M, Yuan Y-C, Chen S. Molecular basis for the interaction of four different classes of substrates and inhibitors with human aromatase. Biochem Pharmacol. 2008;75(5):1161–1169. | ||
Wj L, Bies R, Kamden LK, Desta Z, Flockhart DA. Methadone: a substrate and mechanism-based inhibitor of CYP19 (aromatase). Drug Metab Dispos. 2010;38(8):1308–1313. | ||
Zharikova OL, Fokina VM, Nanovskaya TN, et al. Identification of the major human hepatic and placental enzymes responsible for the biotransformation of glyburide. Biochem Pharmacol. 2009;78(12):1483–1490. | ||
Paakki P, Kirkinen P, Helin H-L, Pelkonen O, Raunio H, Pasanen M. Antepartum glucocorticoid therapy suppresses human placental xenobiotic and steroid metabolizing enzymes. Placenta. 2000;21(2):241–246. | ||
Berkovitz GD, Carter KM, Levine MA, Migeon CJ. Abnormal induction of aromatase activity by dexamethasone in fibroblasts from a patient with cortisol resistance. J Clin Endocrinol Metab. 1990;70(6):1608–1611. | ||
Lankas GR, Wise LD, Cartwright ME, Pippert T, Umbenhauer DR. Placental P-glycoprotein deficiency enhances susceptibility to chemically induced birth defects in mice. Reprod Toxicol. 1998;12(4):457–463. | ||
Smit JW, Huisman MT, van Tellingen O, Wiltshire HR, Schinkel AH. Absence or pharmacological blocking of placental P-glycoprotein profoundly increases fetal drug exposure. J Clin Invest. 1999;104(10):1441–1447. | ||
Chung F, Eyal S, Muzi M, et al. Positron emission tomography imaging of tissue P-glycoprotein activity during pregnancy in the non-human primate. Br J Pharmacol. 2010;159(2):394–404. | ||
Eyal S, Chung FS, Muzi M, et al. Simultaneous PET imaging of P-glycoprotein inhibition in multiple tissues in the pregnant non-human primate. J Nucl Med. 2009;50(5):798–806. | ||
Holcberg G, Sapir O, Tsadkin M, et al. Lack of interaction of digoxin and P-glycoprotein inhibitors, quinidine and verapamil in human placenta in vitro. Eur J Obstet Gynecol Reprod Biol. 2003;109:133–137. | ||
May K, Minarikova V, Linnemann K, et al. Role of the multidrug transporter proteins ABCB1 and ABCC2 in the diaplacental transport of talinolol in the term human placenta. Drug Metab Dispos. 2008;36(4):740–744. | ||
Miksys SL, Tyndale RF. Drug-metabolizing cytochrome P450s in the brain. J Psychiatry Neurosci. 2002;27(6):406–415. | ||
Chaudhary Ketul R, Nagarjun BS, Seubert John M. Cytochrome P450 enzymes and the heart. IUBMB Life. 2009;61(10):954–960. | ||
Olsson B, Bondesson E, Borgström L, et al. Pulmonary drug metabolism, clearance, and absorption. In: Smyth HDC, Hickey HJ, editors. Controlled Pulmonary Drug Delivery. Advances in Delivery Science and Technology. New York: Springer; 2011:21–50. | ||
Thummel KE. Gut instincts: CYP3A4 and intestinal drug metabolism. J Clin Invest. 2007;117(11):3173–3176. | ||
Svensson CK. Biotransformation of drugs in human skin. Drug Metab Dispos. 2009;37(2):247–253. | ||
Fatima L, Dominique W, Véronique B, et al. Phase I and Phase II drug-metabolizing enzymes are expressed and heterogeneously distributed in the biliary epithelium. Hepatology. 2003;30(6):1498–1506. | ||
Evans WE, Relling MV. Pharmacogenomics: translating functional genomics into rational therapeutics. Science. 1999;286(5439):487–491. | ||
Watkins PB, Murray SA, Thomas PE, Wrighton SA. Distribution of cytochromes P-450, cytochrome b5, and NADPH-cytochrome P-450 reductase in an entire human liver. Biochem Pharmacol. 1990;39(3):471–476. | ||
Achour B, Dantonio A, Niosi M, et al. Quantitative characterization of major hepatic UDP-glucuronosyltransferase enzymes in human liver microsomes: comparison of two proteomic methods and correlation with catalytic activity. Drug Metab Dispos. 2017;45(10):1102–1112. | ||
Gamage N, Barnett A, Hempel N, et al. Human sulfotransferases and their role in chemical metabolism. Toxicol Sci. 2006;90(1):5–22. | ||
Ogu CC, Maxa JL. Drug interactions due to cytochrome P450. Proc. 2000;13(4):421–423. | ||
Dresser GK, Spence JD, Bailey DG. Pharmacokinetic-pharmacodynamic consequences and clinical relevance of cytochrome P450 3A4 inhibition. Clin Pharmacokinet. 2000;38(1):41–57. | ||
Kato M, Chiba K, Hisaka A, et al. The intestinal first-pass metabolism of substrates of CYP3A4 and P-glycoprotein—quantitative analysis based on information from the literature. Drug Metab Pharmacokinet. 2003;18(6):365–372. | ||
Kirsi-maija J, Olkkola Klaus T, Neuvonen Pertti J. Itraconazole greatly increases plasma concentrations and effects of felodipine. Clin Pharmacol Ther. 1997;61(4):410–415. | ||
Holtbecker N, Fromm MF, Kroemer HK, Ohnhaus EE, Heidemann H. The nifedipine-rifampin interaction. Evidence for induction of gut wall metabolism. Drug Metab Dispos. 1996;24(10):1121–1123. | ||
Rasmussen BB, Nielsen TL, Brøsen K. Fluvoxamine is a potent inhibitor of the metabolism of caffeine in vitro. Pharmacol Toxicol. 1998;83(6):240–245. | ||
Culm-Merdek KE, von Moltke LL, Harmatz JS, Greenblatt DJ. Fluvoxamine impairs single-dose caffeine clearance without altering caffeine pharmacodynamics. Br J Clin Pharmacol. 2005;60(5):486–493. | ||
Oda S, Fukami T, Yokoi T, Nakajima M. A comprehensive review of UDP-glucuronosyltransferase and esterases for drug development. Drug Metab Pharmacokinet. 2015;30(1):30–51. | ||
Liu Y, Coughtrie MWH. Revisiting the latency of uridine diphosphate-glucuronosyltransferases (UGTs)—How does the endoplasmic reticulum membrane influence their function? Pharmaceutics. 2017;9(3):32. | ||
Barbier O, Turgeon D, Girard C, et al. 3′-azido-3′-deoxythimidine (AZT) is glucuronidated by human UDP-glucuronosyltransferase 2B7 (UGT2B7. Drug Metab Dispos. 2000;28(5):497–502. | ||
Court MH, Krishnaswamy S, Hao Q, et al. Evaluation of 3’-azido-3’-deoxythymidine, morphine, and codeine as probe substrates for UDP-glucuronosyltransferase 2B7 (UGT2B7) in human liver microsomes: specificity and influence of the UGT2B7*2 polymorphism. Drug Metab Dispos. 2003;31(9):1125–1133. | ||
Ethell BT, Anderson GD, Burchell B. The effect of valproic acid on drug and steroid glucuronidation by expressed human UDP-glucuronosyltransferases. Biochem Pharmacol. 2003;65(9):1441–1449. | ||
Veal GJ, Back DJ. Metabolism of zidovudine. Gen Pharmacol-Vasc S. 1995;26(7):1469–1475. | ||
Kiang TK, Ensom MH, Chang TK. UDP-glucuronosyltransferases and clinical drug-drug interactions. Pharmacol Ther. 2005;106(1):97–132. | ||
Lertora Juan JL, Rege Arvind B, Greenspan Debra L, et al. Pharmacokinetic interaction between zidovudine and valproic acid in patients infected with human immunodeficiency virus. Clin Pharmacol Ther. 1994;56(3):272–278. | ||
Chen J, Raymond K. Roles of rifampicin in drug-drug interactions: underlying molecular mechanisms involving the nuclear pregnane X receptor. Ann Clin Microbiol Antimicrob. 2006;5:3. | ||
Burger DM, Meenhorst PL, Koks CH, Beijnen JH. Pharmacokinetic interaction between rifampin and zidovudine. Antimicrob Agents Chemother. 1993;37(7):1426–1431. | ||
Gallicano KD, Sahai J, Shukla VK, et al. Induction of zidovudine glucuronidation and amination pathways by rifampicin in HIV-infected patients. Br J Clin Pharmacol. 1999;48(2):168–179. | ||
Launay-Vacher V, Izzedine H, Karie S, Hulot JS, Baumelou A, Deray G. Renal tubular drug transporters. Nephron Physiol. 2006;103(3):p97–p106. | ||
Yin J, Wang J. Renal drug transporters and their significance in drug–drug interactions. Acta Pharm Sin B. 2016;6(5):363–373. | ||
Ledwitch KV, Roberts AG. Cardiovascular ion channel inhibitor drug-drug interactions with P-glycoprotein. AAPS J. 2017;19(2):409–420. | ||
Greiner B, Eichelbaum M, Fritz P, et al. The role of intestinal P-glycoprotein in the interaction of digoxin and rifampin. J Clin Invest. 1999;104(2):147–153. | ||
Anzai N, Kanai Y, Endou H. Organic anion transporter family: current knowledge. J Pharmacol Sci. 2006;100(5):411–426. | ||
Burckhardt G. Drug transport by organic anion transporters (OATs). Pharmacol Ther. 2012;136(1):106–130. | ||
Burckhardt G, Burckhardt BC. In vitro and in vivo evidence of the importance of organic anion transporters (OATs) in drug therapy. Hdb Exp Pharmacol. 2011;(201):29–104. | ||
Ding Y, Jia Y, Song Y, et al. The effect of lansoprazole, an OCT inhibitor, on metformin pharmacokinetics in healthy subjects. Eur J Clin Pharmacol. 2014;70(2):141–146. | ||
Sirtori CR, Franceschini G, Galli-Kienle M, et al. Disposition of metformin (N,N-dimethylbiguanide) in man. Clin Pharmacol Ther. 1978;24(6):683–693. | ||
Faber KN, Müller M, Jansen PLM. Drug transport proteins in the liver. Adv Drug Deliv Rev. 2003;55(1):107–124. | ||
Deng J, Zhuang X, Shen G, Li H, Gong Z. Biliary excretion and enterohepatic circulation of thienorphine and its glucuronide conjugate in rats. Acta Pharm Sin B. 2012;2(2):174–180. | ||
Kong L-L, Shen G-L, Wang Z-Y, et al. Inhibition of P-glycoprotein and multidrug resistance-associated protein 2 regulates the hepatobiliary excretion and plasma exposure of thienorphine and its glucuronide conjugate. Front Pharmacol. 2016;7:242. | ||
Sigel E, Steinmann ME. Structure, function, and modulation of GABA(A) receptors. J Biol Chem. 2012;287(48):40224–40231. | ||
Hartmann JT, Haap M, Kopp HG, Lipp HP. Tyrosine kinase inhibitors – a review on pharmacology, metabolism and side effects. Curr Drug Metab. 2009;10(5):470–481. | ||
Schafer AI, Andrew S I. Effects of nonsteroidal antiinflammatory drugs on platelet function and systemic hemostasis. J Clin Pharmacol. 1995;35(3):209–219. | ||
Hinder M. Pharmacodynamic drug-drug interactions. In: Vogel HG, Maas J, Gebauer A, editors. Drug Discovery and Evaluation: Methods in Clinical Pharmacology. Berlin, Heidelberg: Springer; 2011:367–376. | ||
Mignat C, Unger T. ACE inhibitors. Drug interactions of clinical significance. Drug Saf. 1995;12(5):334–347. | ||
Zhao L, Au JL, Wientjes MG. Comparison of methods for evaluating drug-drug interaction. Front Biosci. 2010;2:241–249. | ||
Lipton SA. Failures and successes of NMDA receptor antagonists: molecular basis for the use of open-channel blockers like memantine in the treatment of acute and chronic neurologic insults. NeuroRx. 2004;1(1):101–110. | ||
Tallarida RJ. An overview of drug combination analysis with isobolograms. J Pharmacol Exp Ther. 2006;319(1):1–7. | ||
Cascorbi I. Drug interactions--principles, examples and clinical consequences. Dtsch Arztebl Int. 2012;109(33-34):546–556. | ||
Dharmalingam M, Sriram U, Baruah MP. Liraglutide: a review of its therapeutic use as a once daily GLP-1 analog for the management of type 2 diabetes mellitus. Indian J Endocrinol Metab. 2011;15(1):9–17. | ||
Keating GM. Insulin detemir: a review of its use in the management of diabetes mellitus. Drugs. 2012;72(17):2255–2287. | ||
Morrow L, Hompesch M, Guthrie H, Chang D, Chatterjee DJ. Co-administration of liraglutide with insulin detemir demonstrates additive pharmacodynamic effects with no pharmacokinetic interaction. Diabetes Obes Metab. 2011;13(1):75–80. | ||
Ansell J, Hirsh J, Hylek E, Jacobson A, Crowther M, Palareti G. Pharmacology and management of the vitamin K antagonists: American College of Chest Physicians Evidence-Based Clinical Practice Guidelines (8th Edition). Chest. 2008;133(6 Suppl):160S–198. | ||
Jobski K, Behr S, Garbe E. Drug interactions with phenprocoumon and the risk of serious haemorrhage: a nested case-control study in a large population-based German database. Eur J Clin Pharmacol. 2011;67(9):941–951. | ||
Tallarida RJ. Drug synergism: its detection and applications. J Pharmacol Exp Ther. 2001;298(3):865–872. | ||
Baugh R, Calvert RT. The effect of diphenhydramine alone and in combination with ethanol on histamine skin response and mental performance. Eur J Clin Pharmacol. 1977;12(3):201–204. | ||
Lobo IA, Harris RA. GABA(A) receptors and alcohol. Pharmacol Biochem Behav. 2008;90(1):90–94. | ||
Liu H, Farley JM. Effects of first and second generation antihistamines on muscarinic induced mucus gland cell ion transport. BMC Pharmacol. 2005;5:8. | ||
Filitz J, Ihmsen H, Günther W, et al. Supra-additive effects of tramadol and acetaminophen in a human pain model. Pain. 2008;136(3):262–270. | ||
Wyllie DJ, Chen PE. Taking the time to study competitive antagonism. Br J Pharmacol. 2007;150(5):541–551. | ||
Maggi CA, Bevan S, Walpole CS, Rang HP, Giuliani S. A comparison of capsazepine and ruthenium red as capsaicin antagonists in the rat isolated urinary bladder and vas deferens. Br J Pharmacol. 1993;108(3):801–805. | ||
Wermeling DP. Review of naloxone safety for opioid overdose: practical considerations for new technology and expanded public access. Ther Adv Drug Saf. 2015;6(1):20–31. | ||
Krimmer EC, Barry H. Measuring naloxone antagonism of discriminative opioid stimulus. Fed Proc. 1982;41(7):2319–2322. | ||
Preston KL, Bigelow GE, Liebson IA. Buprenorphine and naloxone alone and in combination in opioid-dependent humans. Psychopharmacology. 1988;94(4):484–490. | ||
Pingle SC, Matta JA, Ahern GP. Capsaicin receptor: TRPV1 a promiscuous TRP channel. Hdb Exp Pharmacol. 2007;(179):155–171. | ||
Massoomi F, Savage J, Destache CJ. Omeprazole: a comprehensive review. Pharmacotherapy. 1993;13(1):46–59. | ||
Shin JM, Sachs G. Pharmacology of proton pump inhibitors. Curr Gastroenterol Rep. 2008;10(6):528–534. | ||
Johnson JW, Kotermanski SE. Mechanism of action of memantine. Curr Opin Pharmacol. 2006;6(1):61–67. | ||
Thomas SJ, Grossberg GT. Memantine: a review of studies into its safety and efficacy in treating Alzheimer’s disease and other dementias. Clin Interv Aging. 2009;4:367–377. | ||
Gujral TS, Peshkin L, Kirschner MW. Exploiting polypharmacology for drug target deconvolution. Proc Natl Acad Sci U S A. 2014;111(13):5048–5053. | ||
Park K, Kim D, Ha S, Lee D. Predicting pharmacodynamic drug-drug interactions through signaling propagation interference on protein-protein interaction networks. PLoS One. 2015;10(10):e0140816. | ||
Luo H, Zhang P, Huang H, et al. DDI-CPI, a server that predicts drug-drug interactions through implementing the chemical-protein interactome. Nucleic Acids Res. 2014;42(Web Server issue):W46–W52. | ||
Takeda T, Hao M, Cheng T, Bryant SH, Wang Y. Predicting drug-drug interactions through drug structural similarities and interaction networks incorporating pharmacokinetics and pharmacodynamics knowledge. J Cheminform. 2017;9:16. | ||
Rubinchik-Stern M, Eyal S. Drug interactions at the human placenta: what is the evidence? Front Pharmacol. 2012;3:126. |
 © 2018 The Author(s). This work is published and licensed by Dove Medical Press Limited. The full terms of this license are available at https://www.dovepress.com/terms.php and incorporate the Creative Commons Attribution - Non Commercial (unported, v3.0) License.
By accessing the work you hereby accept the Terms. Non-commercial uses of the work are permitted without any further permission from Dove Medical Press Limited, provided the work is properly attributed. For permission for commercial use of this work, please see paragraphs 4.2 and 5 of our Terms.
© 2018 The Author(s). This work is published and licensed by Dove Medical Press Limited. The full terms of this license are available at https://www.dovepress.com/terms.php and incorporate the Creative Commons Attribution - Non Commercial (unported, v3.0) License.
By accessing the work you hereby accept the Terms. Non-commercial uses of the work are permitted without any further permission from Dove Medical Press Limited, provided the work is properly attributed. For permission for commercial use of this work, please see paragraphs 4.2 and 5 of our Terms.