")
Back to Journals » Clinical Epidemiology » Volume 11
Measuring prevalence and incidence of chronic conditions in claims and electronic health record databases
Authors Rassen JA, Bartels DB, Schneeweiss S , Patrick AR, Murk W
Received 24 July 2018
Accepted for publication 24 October 2018
Published 17 December 2018 Volume 2019:11 Pages 1—15
DOI https://doi.org/10.2147/CLEP.S181242
Checked for plagiarism Yes
Review by Single anonymous peer review
Peer reviewer comments 2
Editor who approved publication: Professor Henrik Sørensen
Jeremy A Rassen,1 Dorothee B Bartels,2 Sebastian Schneeweiss,1,3,4 Amanda R Patrick,1 William Murk1,5
1Aetion, Inc, New York, NY, USA; 2BI X GmbH, Ingelheim, Germany; 3Division of Pharmacoepidemiology and Pharmacoeconomics, Brigham and Women’s Hospital, Boston, MA, USA; 4Harvard Medical School, Boston, MA, USA; 5Jacobs School of Medicine, University at Buffalo, Buffalo, NY, USA
Background: Health care databases are natural sources for estimating prevalence and incidence of chronic conditions, but substantial variation in estimates limits their interpretability and utility. We evaluated the effects of design choices when estimating prevalence and incidence in claims and electronic health record databases.
Methods: Prevalence and incidence for five chronic diseases at increasing levels of expected frequencies, from cystic fibrosis to COPD, were estimated in the Clinical Practice Research Datalink (CPRD) and MarketScan databases from 2011 to 2014. Estimates were compared using different definitions of lookback time and contributed person-time.
Results: Variation in lookback time substantially affected estimates. In 2014, for CPRD, use of an all-time vs a 1-year lookback window resulted in 4.3–8.3 times higher prevalence (depending on disease), reducing incidence by 1.9–3.3 times. All-time lookback resulted in strong temporal trends. COPD prevalence between 2011 and 2014 in MarketScan increased by 25% with an all-time lookback but stayed relatively constant with a 1-year lookback. Varying observability did not substantially affect estimates.
Conclusion: This framework draws attention to the underrecognized potential for widely varying incidence and prevalence estimates, with implications for care planning and drug development. Though prevalence and incidence are seemingly straightforward concepts, careful consideration of methodology is required to obtain meaningful estimates from health care databases.
Keywords: epidemiology, epidemiologic methods, epidemiological monitoring, sentinel surveillance, pharmacoepidemiology, cross-sectional studies, secondary databases, prevalence, prevalence studies, incidence
Introduction
Epidemiologists encounter the concepts of prevalence and incidence from the very beginning of their training. Prevalence is defined as “the proportion of the population with the disease at the specified time”.1 Incidence over a period of time is defined as “the number of new cases of disease divided by the person-time over the period”.1 Though they are considered basic, they are critical to public health decision-makers, health plan administrators, treatment manufacturers, and clinicians, who need to have accurate information to effectively treat disease and manage population health.
Prevalence and incidence estimation depend on accurate measurement. To be measured properly, both accurate surveillance to find existing or new disease (the numerators) and accurate assessment of the number of patients in a population at a given point in time (the denominators) are required. Prevalence and incidence have traditionally been assessed through sampling strategies in surveys such as the National Health and Nutrition Examination Survey (NHANES).2 However, these sources of information are costly, are updated infrequently, and may not reflect the target population or changing dynamics of a population.
A natural source for prevalence and incidence of chronic conditions is the large-scale databases that are created as part of the operation of the health care system. These databases are frequently updated, often cover a broad population, and are readily available at a relatively low cost. However, these databases are not specifically created for research; rather, they reflect medical sociology and recording practices under economic constraints.3 The data are left and right censored, frequently lacking detailed records on who is and is not part of a population at a given time.
Despite these challenges, databases offer a unique opportunity to implement rapid measurements critical to treatment and public health.4,5 This paper describes approaches to measuring the prevalence and incidence of chronic disease in two distinct types of health care databases: administrative claims data and electronic health records (EHRs).4,5 We illustrate various approaches with examples of prevalence and incidence estimations for five chronic conditions, as measured in commercially available EHR and insurance claims databases.
Materials and methods
Sources of data
Administrative claims data are the longitudinal recording of transactions that facilitate payment to health care providers. The data record the deidentified patient identifiers, the beginning and end of the plan enrollment, hospital stays with associated diagnoses and procedures, outpatient visits with associated diagnoses and procedures, and pharmacy dispensing. These data can cover very large populations, such as all patients insured by UnitedHealth Group6 or all residents of Québec,7 but these data generally lack clinical details such as laboratory test results or patient-reported outcomes.
EHRs are the clinician-generated accounts of a patient’s health state and consequent treatment. EHRs are a mixture of structured information such as diagnoses, interventions, body mass index, blood pressure, or laboratory test results and unstructured notes. EHRs tend to record which drugs are prescribed, but not whether prescriptions were actually filled.8 Though these data are generally more clinically rich than claims, they often are inconsistently coded with substantial missing – and even informatively missing – data.9
Important to prevalence and incidence estimation, claims and EHR databases frequently differ in how chronic disease states are recorded. Administrative claims data are primarily used for payment, and the payment amounts tend to be associated with the disease state recorded on the claim. Thus, a chronic disease such as diabetes, will often be repeatedly recorded on many of the patient’s claims. EHR data, on the other hand, are more often used for physician and health system records; a chronic disease state such as diabetes will tend to be updated as the disease state changes, but not necessarily rerecorded on each visit. This difference in recording patterns indicates that algorithms for measuring prevalence and incidence in databases may perform differentially in claims and EHR sources.
Claims and EHR data are both left and right censored; that is, they generally start observation when a person enrolls in a health plan or is first treated within a given health system; they stop the recording process when a patient leaves the plan or system. In claims, plan enrollment generally defines who is in a population at a given point in time. In EHR data, it is more difficult to determine the population under care at a given time. These censoring issues can have substantial implications for estimating prevalence and incidence of chronic conditions.
Observable person-time in health care databases
“Observable” is defined as times when, if a patient were to have an event of interest, that event would be recorded in the database. Accounting for observable vs nonobservable person-time may affect estimation of both numerators and denominators. This is an issue that is different from the ability to measure conditions in health care databases; note that even with observable person-time, certain diseases may lend themselves more estimable than others.10
Observable person-time in claims databases (OC)
For claims databases, we discuss two possible definitions for OC:
- OC1: defined by enrollment;
- OC2: defined by enrollment, excluding structurally nonobservable time.
These options are illustrated in Figure 1A. Plan enrollment is generally a good proxy for observable person-time. If a patient is enrolled, then reimbursable health care encounters are expected to be recorded, save for occasions such as patients’ traveling or being treated out of network.
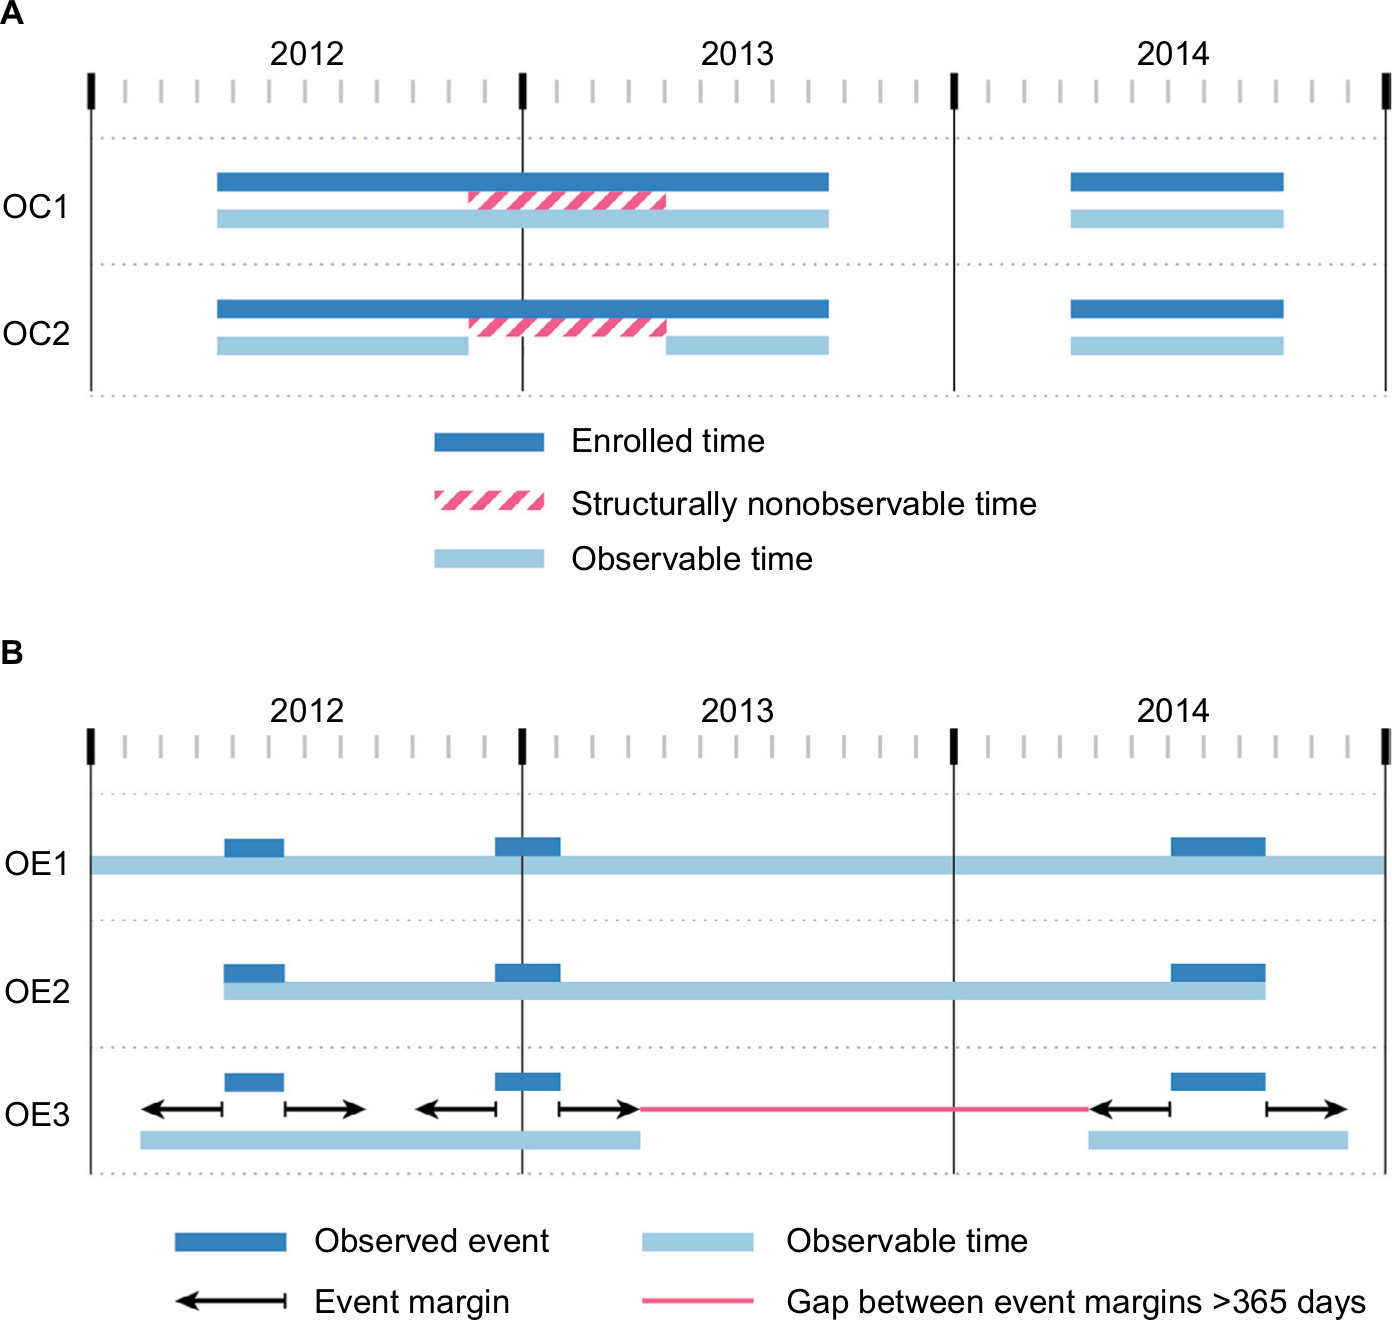 | Figure 1 Definitions of observable person-time, in claims data (A) or EHR data (B). Notes: As shown by a hypothetical patient in (A), claims data observability can be based on the entire time enrolled in a health plan (OC1) or enrolled time that excludes time known to be structurally nonobservable, eg, time during nursing home care (OC2). As shown for a different hypothetical patient in (B), EHR observability can be based on all calendar time, irrespective of event data, assuming that all patient encounters would be captured in that EHR system (OE1), time between the start of the first event and the end of the last event recorded in the EHR system (OE2), or time defined by a “buffer” around each encounter, excluding the time where there is a gap of a certain duration (eg, >365 days) between margins (OE3). Abbreviations: EHR, electronic health record; OC, observable person-time in claims databases; OE, observable person-time in EHR databases. |
There are cases where some patient-time is “structurally” nonobservable, and an investigator may wish to exclude such time. For example, in US claims data, patient-time spent in a hospital or nursing facility is only partially observable because generally only summary-level condition and treatment information is available.11 If the conditions of interest are measurable outside of the hospital, as diabetes is, then these nonobservable periods may not affect the numerator of either a prevalence or an incidence calculation. For other conditions, such as hospital-acquired infections, significant nonobservable person-time could substantially affect the numerator through “missing” cases and/or denominator due to underestimating the size of the population.
Observable person-time in EHR databases (OE)
Most EHRs do not have the same concept of enrollment, and as a result, patients’ presence or absence, or care in other settings, may not be known or recorded.12 An EHR that is associated with primary care may have excellent observability during the times that patients are seen for routine visits, but there may be poor observability of more severe conditions that are recorded by specialists. On the other hand, EHRs associated with tertiary care facilities may have detailed coding of conditions that occur in the in-hospital scenario but poor measurement of chronic illness.
With EHRs, one must make strong assumptions about observability for both prevalence and incidence calculations. Several possible approaches are illustrated in Figure 1B:
- OE1: Assume that all patients are observable at all times.
- OE2: Assume that patients are observable from the start of their first observed event until the end of their last observed event.
- OE3: Around each observed event, create a “time buffer”, ie, a certain duration of time (eg, 365 days) before and after the event. Then, exclude time that is outside these buffers. This would create the assumption that the patient was observable for the year prior to and after the event and will likely overestimate observable time.
Calculations and interpretations can be strongly affected by the selected option, and investigators need a thorough understanding of the underlying data generation process to make the most appropriate choice. With OE1, the denominator will stay fixed; thus, if prevalence is examined over time, prevalence can never decrease. With OE2, patients are strongly left censored but also strongly right censored: a patient who is event-free will stop contributing to the person-time denominator of an incidence rate calculation, which could bias the incidence estimation. OE3 offers a pragmatic balance between OE1 and OE2, but it may overestimate observability and thus inflate the denominator, which would – in turn – move the overall estimates lower.
Using time windows when working with longitudinal health care data
Considering prevalence as “the frequency of disease in a population at a given point in time”, we intuitively think of “dipping into” a population on a given day and reporting the amount of disease present. In claims and EHR data, we make measurements of encounters with the health care system that lead to recording of relevant information, which occur over periods in time.13 These, in turn, serve as proxies for the underlying point-in-time prevalence. Incidence, or “the rate at which new disease occurs in a population per unit time”, translates straightforwardly to measurement over a specific period in health care databases.
Periods of interest and lookback time to differentiate prevalence from incidence in longitudinal databases
The assessments of prevalence and incidence each require a specific time reference to be defined; this is called the “period of interest” (POI). The POI is the time at which prevalence is anchored and during which incidence is to be measured. A frequent period of interest is a year, such as, “in 2014, what was the prevalence of diabetes?”
Given that with health care data, we cannot “dip into” a population to estimate prevalence at a specific point in time (eg, January 1, 2014), we use a specific retrospective time period – here, called the “lookback time” – to surveil for existing disease.14,15 If the condition of interest, a chronic disease, is observed to occur during the lookback time, then we say there is prevalent disease. If the condition of interest is not observed to occur in the lookback time but does occur over the POI, then this case may be considered prevalent (if we want to include the POI in the prevalence period), or incident (if we do not).
The choice of the lookback time is an open question for the investigator.16,17 We see two main options that can be selected. Examples are given in Figure 2.
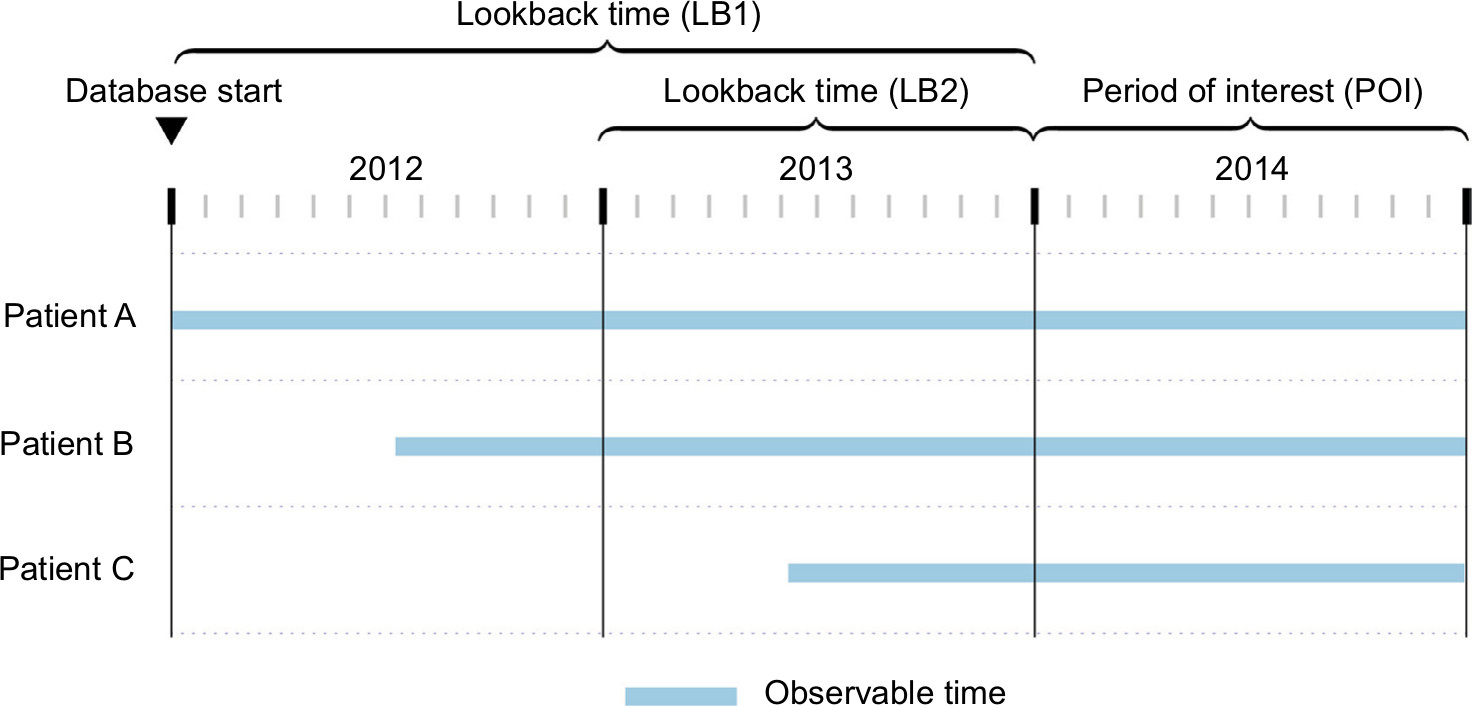 | Figure 2 The period of interest and the lookback time. Notes: Timeline showing 2012 through the end of 2014, with 2014 being the POI and two different LB times, LB1 (all time) and LB2 (1 year fixed time). The observable times of three different hypothetical patients are shown. Abbreviations: LB time, lookback; POI, period of interest. |
These are as follows:
- LB1: Lookback at all recorded time, subject to databases’ natural left censoring.
- LB2: Lookback for a fixed time period, such as 1 year.
Choosing between LB1 and LB2 can be difficult. LB1 will give the most sensitive estimate of prevalence, as it includes all possible patient data. LB2 minimizes variations in left-censoring and allows for greater uniformity in measurement. If the goal is to compare prevalence in subgroups or to make other contrasts, LB2 may be superior; it will remove a potential source of bias (differential left-censoring) in the comparison. For example, in Figure 2, patients A and B contribute differential observable time under LB1 but equal observable time under LB2. However, even with this fixed time period, there can still be patients with different amounts of observable time in the lookback, as seen in the case of patient C.
To further reduce bias due to differential left-censoring, it may be desirable to consider whether a sufficient amount of observable time in the lookback period is required; we refer to this as the “lookback observability requirement”. There are two main choices that can be considered:
- LO1: Any combination of observable and nonobservable lookback time is acceptable.
- LO2: All of the lookback time is required to be observable. Patients are excluded if they do not meet this requirement.
For example, in Figure 2, selecting LB2 as the lookback time, no patients would be excluded from analysis under LO1, but patient C would be excluded under LO2.
Conditions of interest are typically identified using case ascertainment algorithms based on the occurrence of diagnosis or procedure codes with varying degrees of sensitivity and specificity.18 The performance of an algorithm may affect the choice of lookback time. For example, when using codes with low sensitivity, longer lookback times may be required to identify cases, and consequently, prevalence/incidence estimates may be more likely to vary by the length of lookback time, as compared to using codes with high sensitivity.
Prevalence estimation
As a proportion, prevalence depends on well-defined numerator and denominator assessments. We follow the epidemiologic principle that the denominator population that gives rise to the disease should be the source of cases for the numerator. Conversely, if a patient cannot contribute to the numerator, then that patient should also not contribute to the denominator (or “prevalence pool”).1
The prevalence numerator
In database studies, the period of interest drives the numerator. If the period of interest is 2014, the numerator for prevalence (PN) could be as follows:
- PN1: The number of patients who have been observed to have the condition of interest on the first day of the POI (eg, January 1, 2014) or within the lookback time (similar to point prevalence19 for a chronic disease)
- PN2: The number of patients who have been observed to have the condition of interest either at any time in the POI (eg, January 1, 2014, through December 31, 2014) or within the lookback time. If the denominator definitions are the same, this is PN1 plus the number of additional cases observed during the remainder of the POI (similar to period prevalence20 for a chronic disease).
PN1 and PN2 under different choices of lookback time are illustrated in Figure 3.
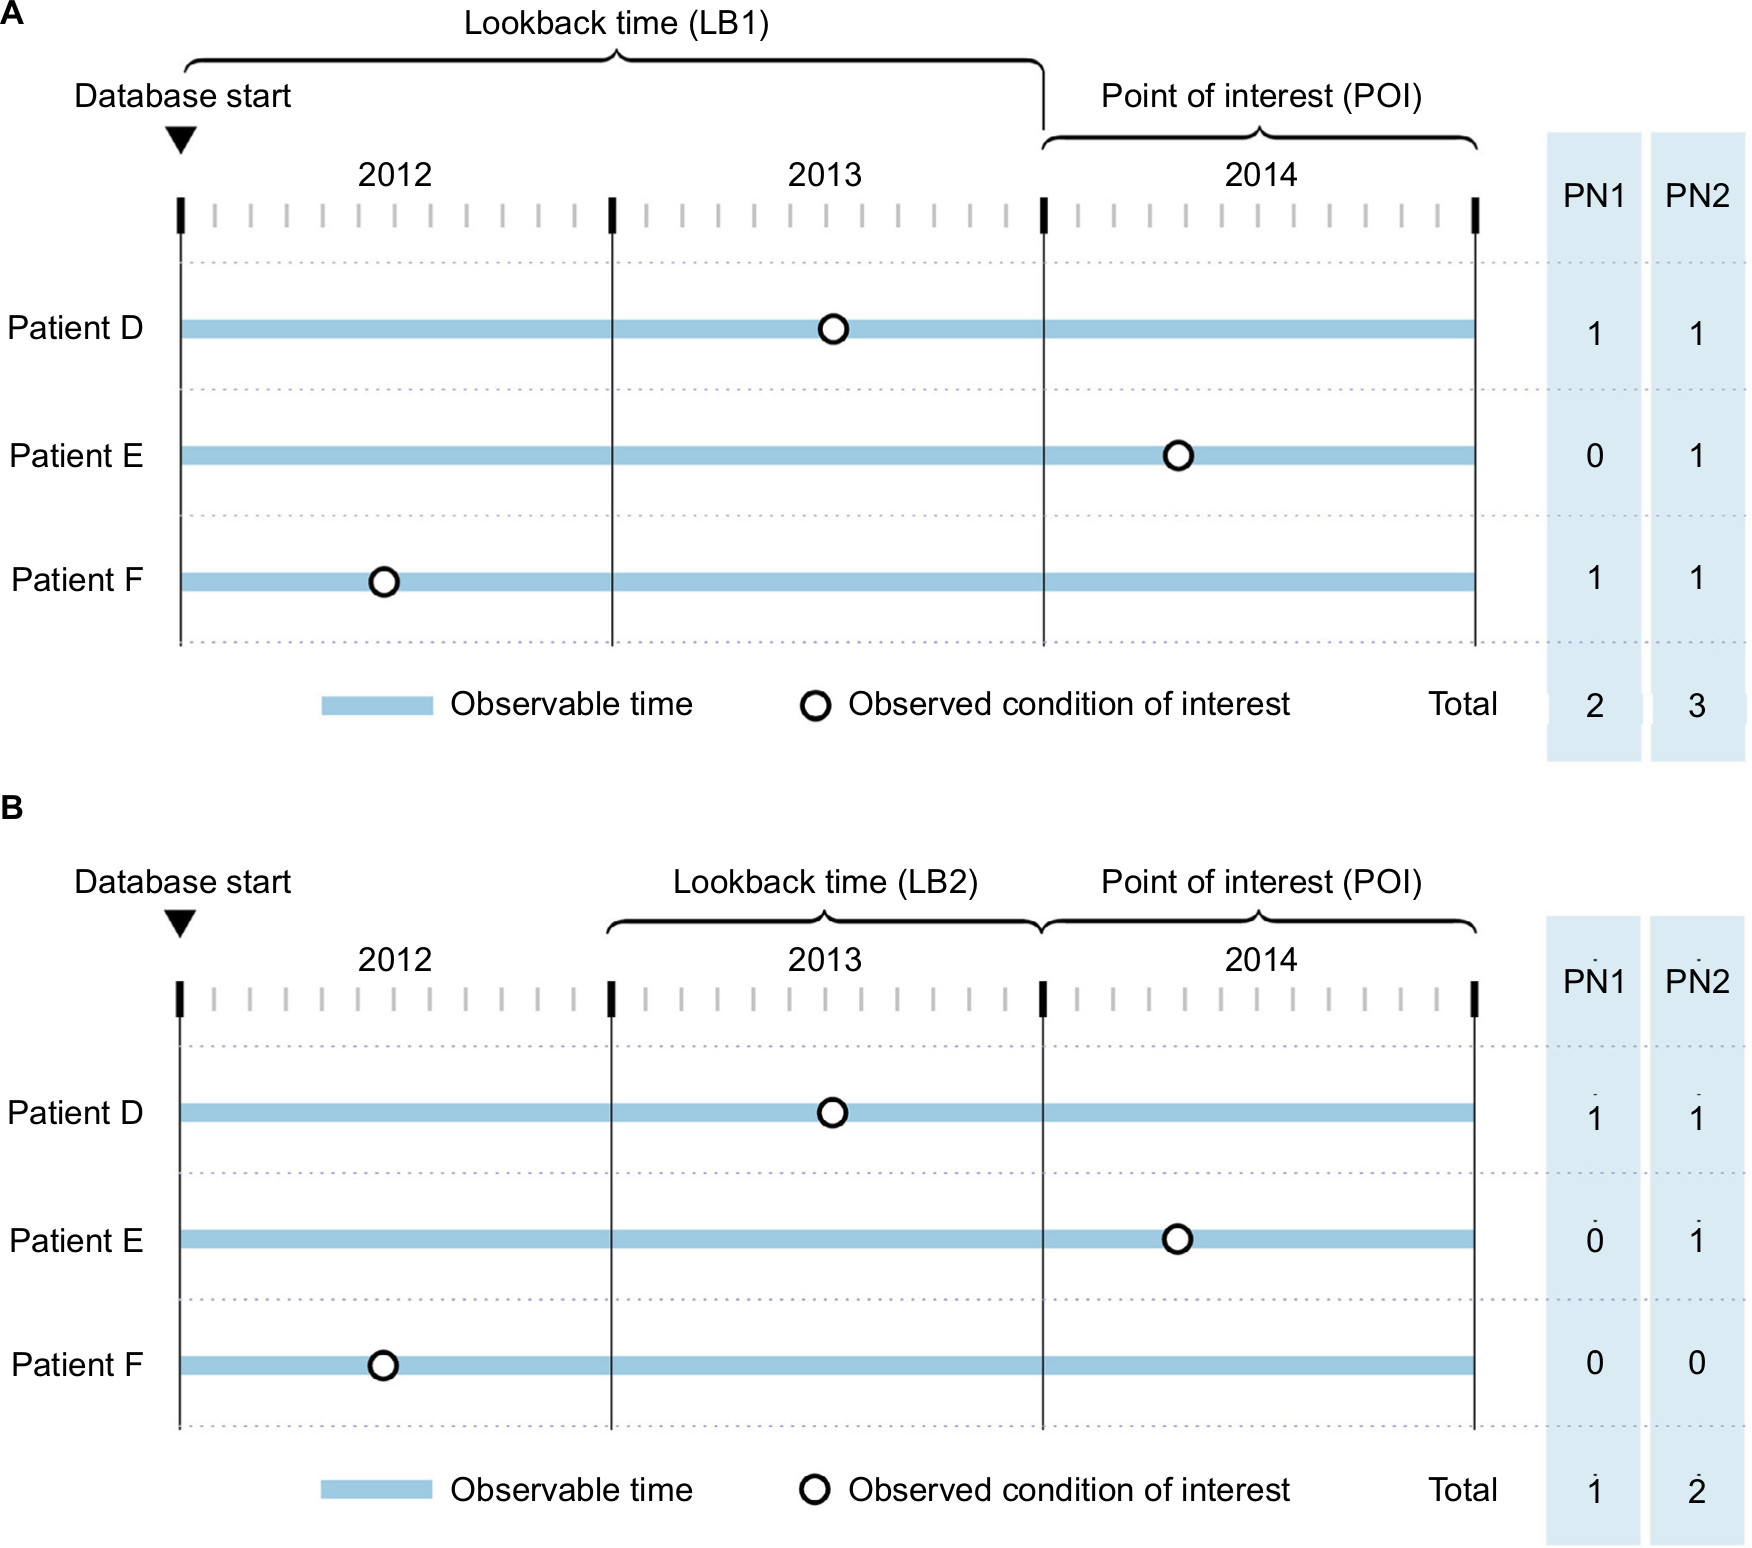 | Figure 3 The prevalence numerator. Notes: PN1 is the point PN, ie, the condition is present as of the first day of the period of interest; and PN2 is the period PN, ie, the condition is either present as of the first day of the POI, or is recorded for the first time during the POI. These are shown for three hypothetical patients. In (A), all time LB (LB1) is used to define the LB time. In (B), fixed-time LB (LB2) is used to define the LB time. The columns at the right indicate the numbers each patient contributes to the respective numerator value, as well as the total numerator values. Abbreviations: LB, lookback time; PN, prevalence numerator; POI, period of interest. |
The prevalence denominator
There are several reasonable formulations of the prevalence denominator (PD) in a database study. The following option are illustrated in Figure 4:
- PD1: The “Day 1” population is the number of patients in the population (ie, those who had an observable person-day) on Day 1 – the starting day – of the POI (eg, January 1, 2014).
- PD2: The “complete-period” population is the number of patients in the population who contribute all possible observable person-days in the POI (eg, between January 1, 2014, and December 31, 2014).
- PD3: The “any-time” population comprises any patient who contributes ≥1 day in the POI.
- PD4: The “sufficient-time” population comprises any patient who contributes sufficient time in the POI, defined as having at least “n” observable person-days in the POI; n≥2.
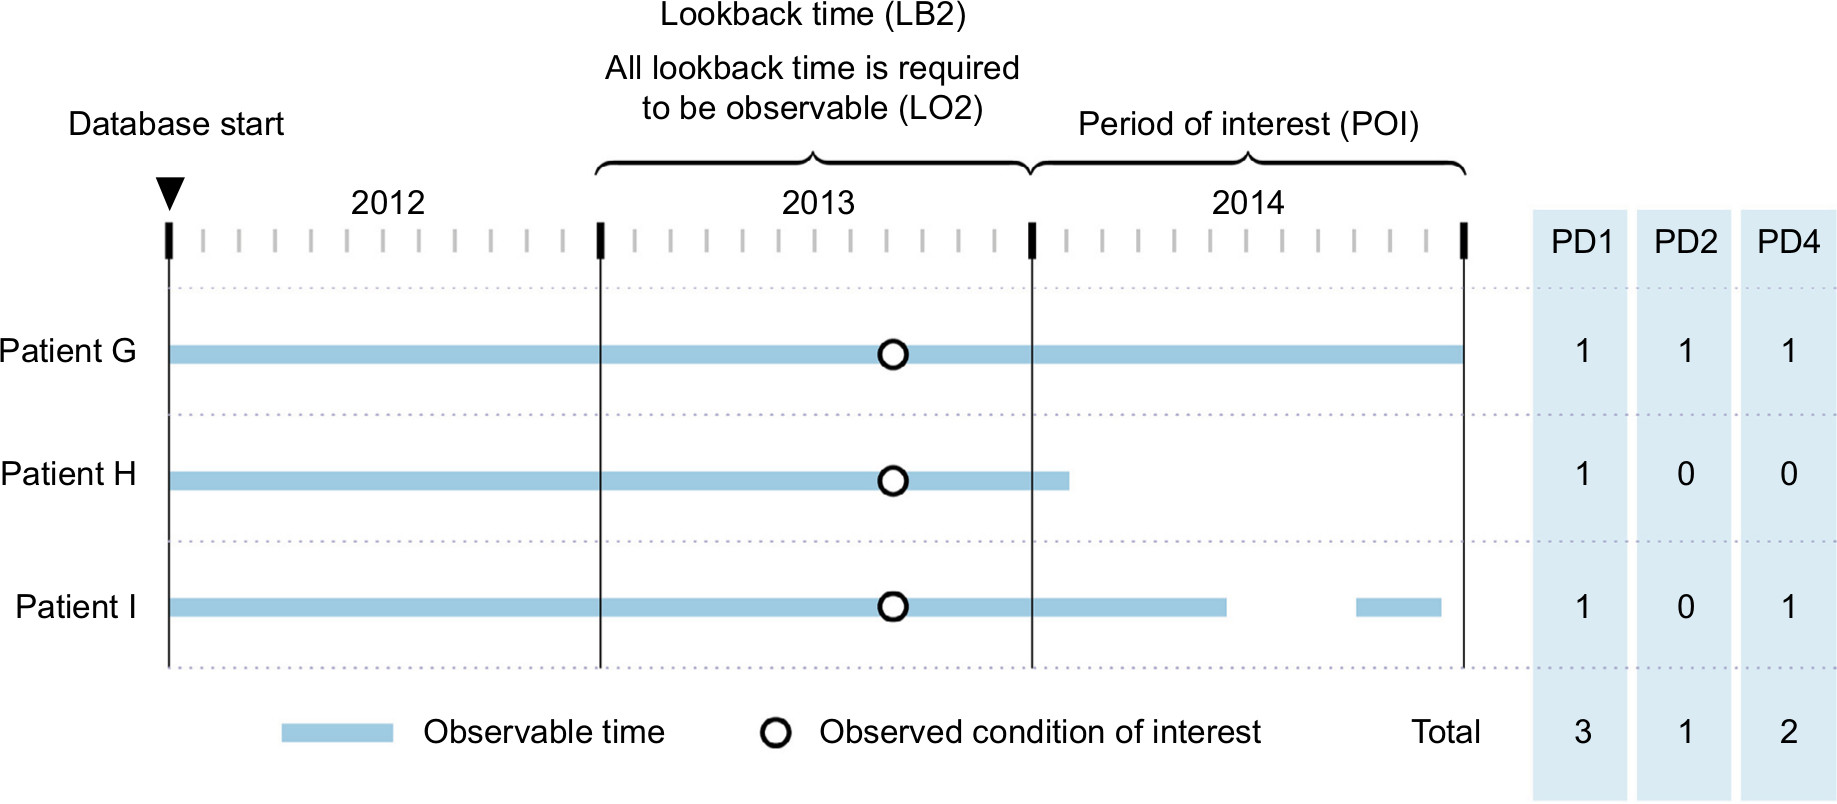 | Figure 4 The prevalence denominator results. Notes: Day 1 population (PD1), complete-period population (PD2), and sufficient-time population (PD4) are shown for three hypothetical patients. For PD4, assume that the requirement is defined as having at least n=90 observable person-days in the period of interest (POI). The columns at the right indicate the numbers each patient contributes to the respective denominator value, as well as the total denominator values. Abbreviations: LB, lookback time; LO, lookback observability; PD, prevalence denominator; POI, period of interest. |
In Figure 4, all three patients could potentially contribute to the numerator. Whether they do depends on the previously noted criteria plus whether they are part of the denominator. While these are possible options for defining the numerator, other options include whether a patient had a doctor’s visit over the course of the year in question and whether the patient received primary vs specialty care.
Table 1 illustrates several combinations of numerator and denominator.
 | Table 1 Combinations of prevalence numerator and denominator definitions Abbreviations: PD, prevalence denominator; PN, prevalence numerator. |
Incidence estimation
Cumulative incidence (incidence proportion) refers to the number of at-risk patients who newly develop a condition of interest during a specified time period, relative to the whole population that gives rise to the cases over the same time period. Incidence rate refers to the number of at-risk patients who develop a condition of interest, relative to the total amount of at-risk person-time.
The incidence numerator (IN)
The cumulative incidence and incidence rate use the same numerator (IN), which depends on the number of patients at risk for the incident disease in a population. The IN seems most reasonably defined as the number of patients “who did not have disease in the lookback time” who are then observed to develop disease over the POI.
The incidence denominator
Similar to prevalence, the incidence proportion denominator (IPD) can vary; however, if incidence and prevalence are reported together, they should both use the same definition of the denominator. Patients who had the condition of interest in the lookback time should not be included in the IPD, as they are not at risk for the newly onset disease. Thus, four options for the IPD parallel PD1–PD4, described earlier, and include at-risk members of the “Day 1” population (IPD1), the “complete-period” population (IPD2), the “any-time” population (IPD3), or the “sufficient-time” population (IPD4).
The incidence rate denominator (IRD) is less ambiguous, defined as the number of at-risk person-days over the POI. An at-risk person-day is an observable person-day on which the condition of interest has not yet been observed to occur in either the lookback time or the POI itself.
The incidence numerator as well as the incidence denominator options IPD1 and IRD are illustrated in Figure 5.
 | Figure 5 The incidence numerator and denominator. Notes: Five hypothetical patients are shown. The columns at right indicate the numbers each patient contributes to the respective numerator or denominator value, as well as the total values, assuming options IPD1 or IRD are used. Dashes (“–”) indicate that the patient was excluded from contributing to the respective value. Abbreviations: IN, incidence numerator; IPD, incidence proportion denominator; IRD, incidence rate denominator. |
A range of study design choices are summarized in Table 2.
 | Table 2 Summary of the discussed design choices for prevalence and incidence studies Abbreviations: EHR, electronic health records; IN, incidence numerator; IPD, incidence proportion denominator; IRD, incidence rate denominator; LB, lookback time; LO, lookback observability; N/A, not applicable; OC, observable person-time in claims database; OE, observable person-time in EHR databases; PD, prevalence denominator; PN, prevalence numerator; POI, period of interest. |
Examples
We examined the prevalence and incidence of five chronic diseases at varying levels of expected prevalence in two databases. From lowest to highest expected prevalence, the diseases were cystic fibrosis (CF), schizophrenia, inflammatory bowel disease (IBD), psoriasis, and COPD. These conditions were chosen due to their wide variation in expected prevalence, from 0.01% for CF up to 1.9% for COPD.21,22 Table 3 provides the expected prevalence and incidence estimates for all selected diseases based on published literature; generally speaking, these are national figures for the USA and the UK, and while they are not gold standards per se, they are intended to give the reader a reference point for expected prevalence.
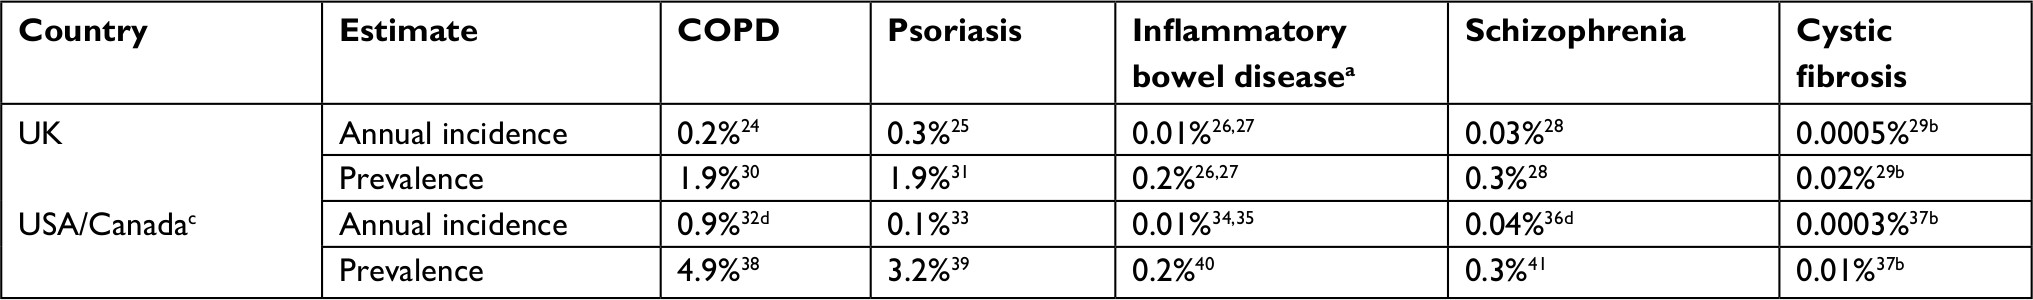 | Table 3 Published prevalence and incidence estimates for the selected diseases Notes: Annual cumulative incidence and prevalence were obtained from the indicated studies. Cumulative incidence was estimated from incidence rates when cumulative incidence was not directly reported. aEstimates pertain to ulcerative colitis. bApproximated based on the reported patient number (assuming complete population coverage by the respective registries) and the UK42 or US43 total populations in 2014 or 2011, respectively. cCOPD incidence in the USA was not available; instead, results from a Canadian study are reported for this estimate. dEstimated in patients aged 15–29 years. |
First, we used the Clinical Practice Research Datalink (CPRD), an EHR-type database with data drawn mainly from general practices in the UK. We used data released in January 2016, which included 16.9 million patients with coverage as far back as 1987.8 Patients in the CPRD tend to be followed for a long period of time – longitudinal records may be available for ≥10 years – and patients are broadly representative of the UK general population in terms of age, sex, and ethnicity.8 Second, we examined IBM Truven MarketScan, an administrative claims database of commercially insured and Medicare patients in the USA; the company notes that this is a nationally representative data sample of Americans with employer-provided health insurance.23 We used data available from January 1, 2008, to March 31, 2016, covering 149.7 million patients with a median enrolled time of approximately 3 years. Measurement of each condition was done simply and indicated as true/false by the presence or absence of appropriate codes in patients’ records. In general, these definitions were expected to yield sensitive though possibly not specific measures of diseases, which would – in turn – yield measures of prevalence and incidence at the upper end of possibility. Full details on the measurements of conditions are provided in Tables S1 and S2.
To assess the influence of some of the possible study design choices, the estimation of prevalence and incidence was carried out over four design cases. The first three cases varied the population by lookback time (1 year, 2 years, and all time) while fixing the denominator definition to the “Day 1” population (PD1), while the fourth case used an all-time lookback time but changed the denominator definition to the “complete-period” (PD2) population. Prevalence was estimated as point prevalence (prevalence at the beginning of the period), while incidence was estimated as cumulative incidence. Table 4 provides further details on the design choices. Estimates were made in each of the 4 years (2011 through 2014). The median amount of available lookback time for these years is described in Table S3.
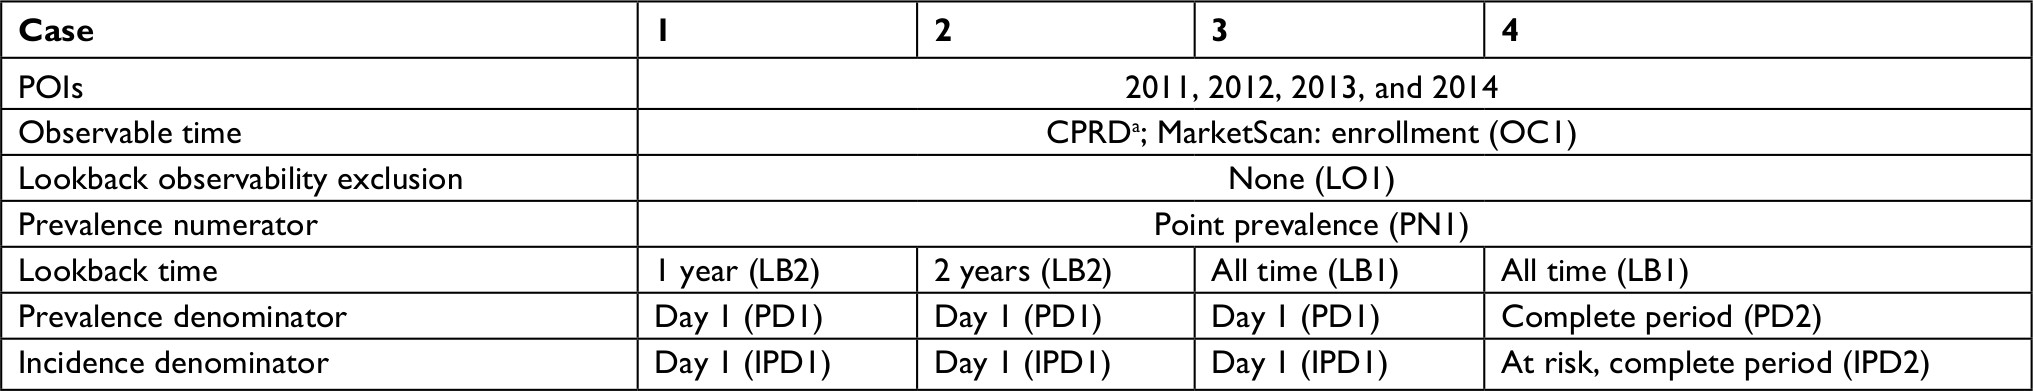 | Table 4 Case definitions Notes: aIn CPRD, patients were defined as observable between the latest of the up-to-standard date or the current registration date and the earliest of the last collection date, transferred out date, or date of death, during times when they were also considered “Acceptable”. No exclusions based on structurally nonobservable time were performed. Abbreviations: CPRD, Clinical Practice Research Datalink; IPD, incidence proportion denominator; LB, lookback time; LO, lookback observability; OC, observable person-time in claims database; PD, prevalence denominator; PN, prevalence numerator; POI, period of interest. |
Description of the CPRD database
The CPRD is derived from the EHR of >600 primary care practices from the UK. In the current study, approximately 16.9 million patients were available for analysis, with records spanning from November 21, 1987, through December 31, 2016. Records were primarily drawn from the Patient, Practice, Clinical, and Referral tables. Patients were defined as observable between the latest of the up-to-standard date or the current registration date and the earliest of the last collection date, transferred out date, or date of death, during times when they were also considered “Acceptable”.
Description of the IBM Truven MarketScan database
The IBM Truven MarketScan databases are comprised of two main components: the MarketScan Commercial Claims and Encounters (CCAE) database and the Medicare Supplemental and Coordination of Benefits (MDCR) database. Patients represented in the databases are active employees, dependants, Consolidated Omnibus Budget Reconciliation Act (COBRA) recipients, or Medicare-eligible retirees with Medicare-supplemental plans, and the data are drawn from employers, health plans, and public organizations in the USA. In the current study, approximately 149.7 million patients were available for analysis, with records spanning from January 1, 2008, to March 31, 2016. Records were primarily drawn from CCAE and MDCR Enrollment Detail, Inpatient Admissions, Inpatient Services, and Outpatient Services tables. Patients were defined as observable between the periods of enrollment start and end dates available in the database.
Ethics approval and informed consent
This study was approved by the institutional review board of the Brigham and Women’s Hospital and valid data use agreements were in place. The CPRD Independent Scientific Advisory Committee (ISAC) provided approval for the use of the CPRD data set (protocol 17_029R2). The protocol was submitted to the journal for peer review.
Results
Effects of the choice of lookback time
The amount of lookback time substantially affected the prevalence and incidence in both CPRD and MarketScan, as shown in Figures 6 and 7. For example, in 2014, the use of an all-time lookback (Case 3) compared to a 1-year lookback (Case 1) resulted in a 4.3–8.3 times higher prevalence of disease in CPRD, and a 1.8–2.4 times higher prevalence in MarketScan (depending on the disease). Since longer lookback periods create more opportunity for prevalent cases, they resulted in fewer cases being classified as incident. Thus, the use of an all-time lookback compared to a 1-year lookback resulted in incidence estimates that were reduced by a factor of 1.9–3.3 in CPRD and 1.2–1.5 in MarketScan. Similar patterns were seen across other calendar periods.
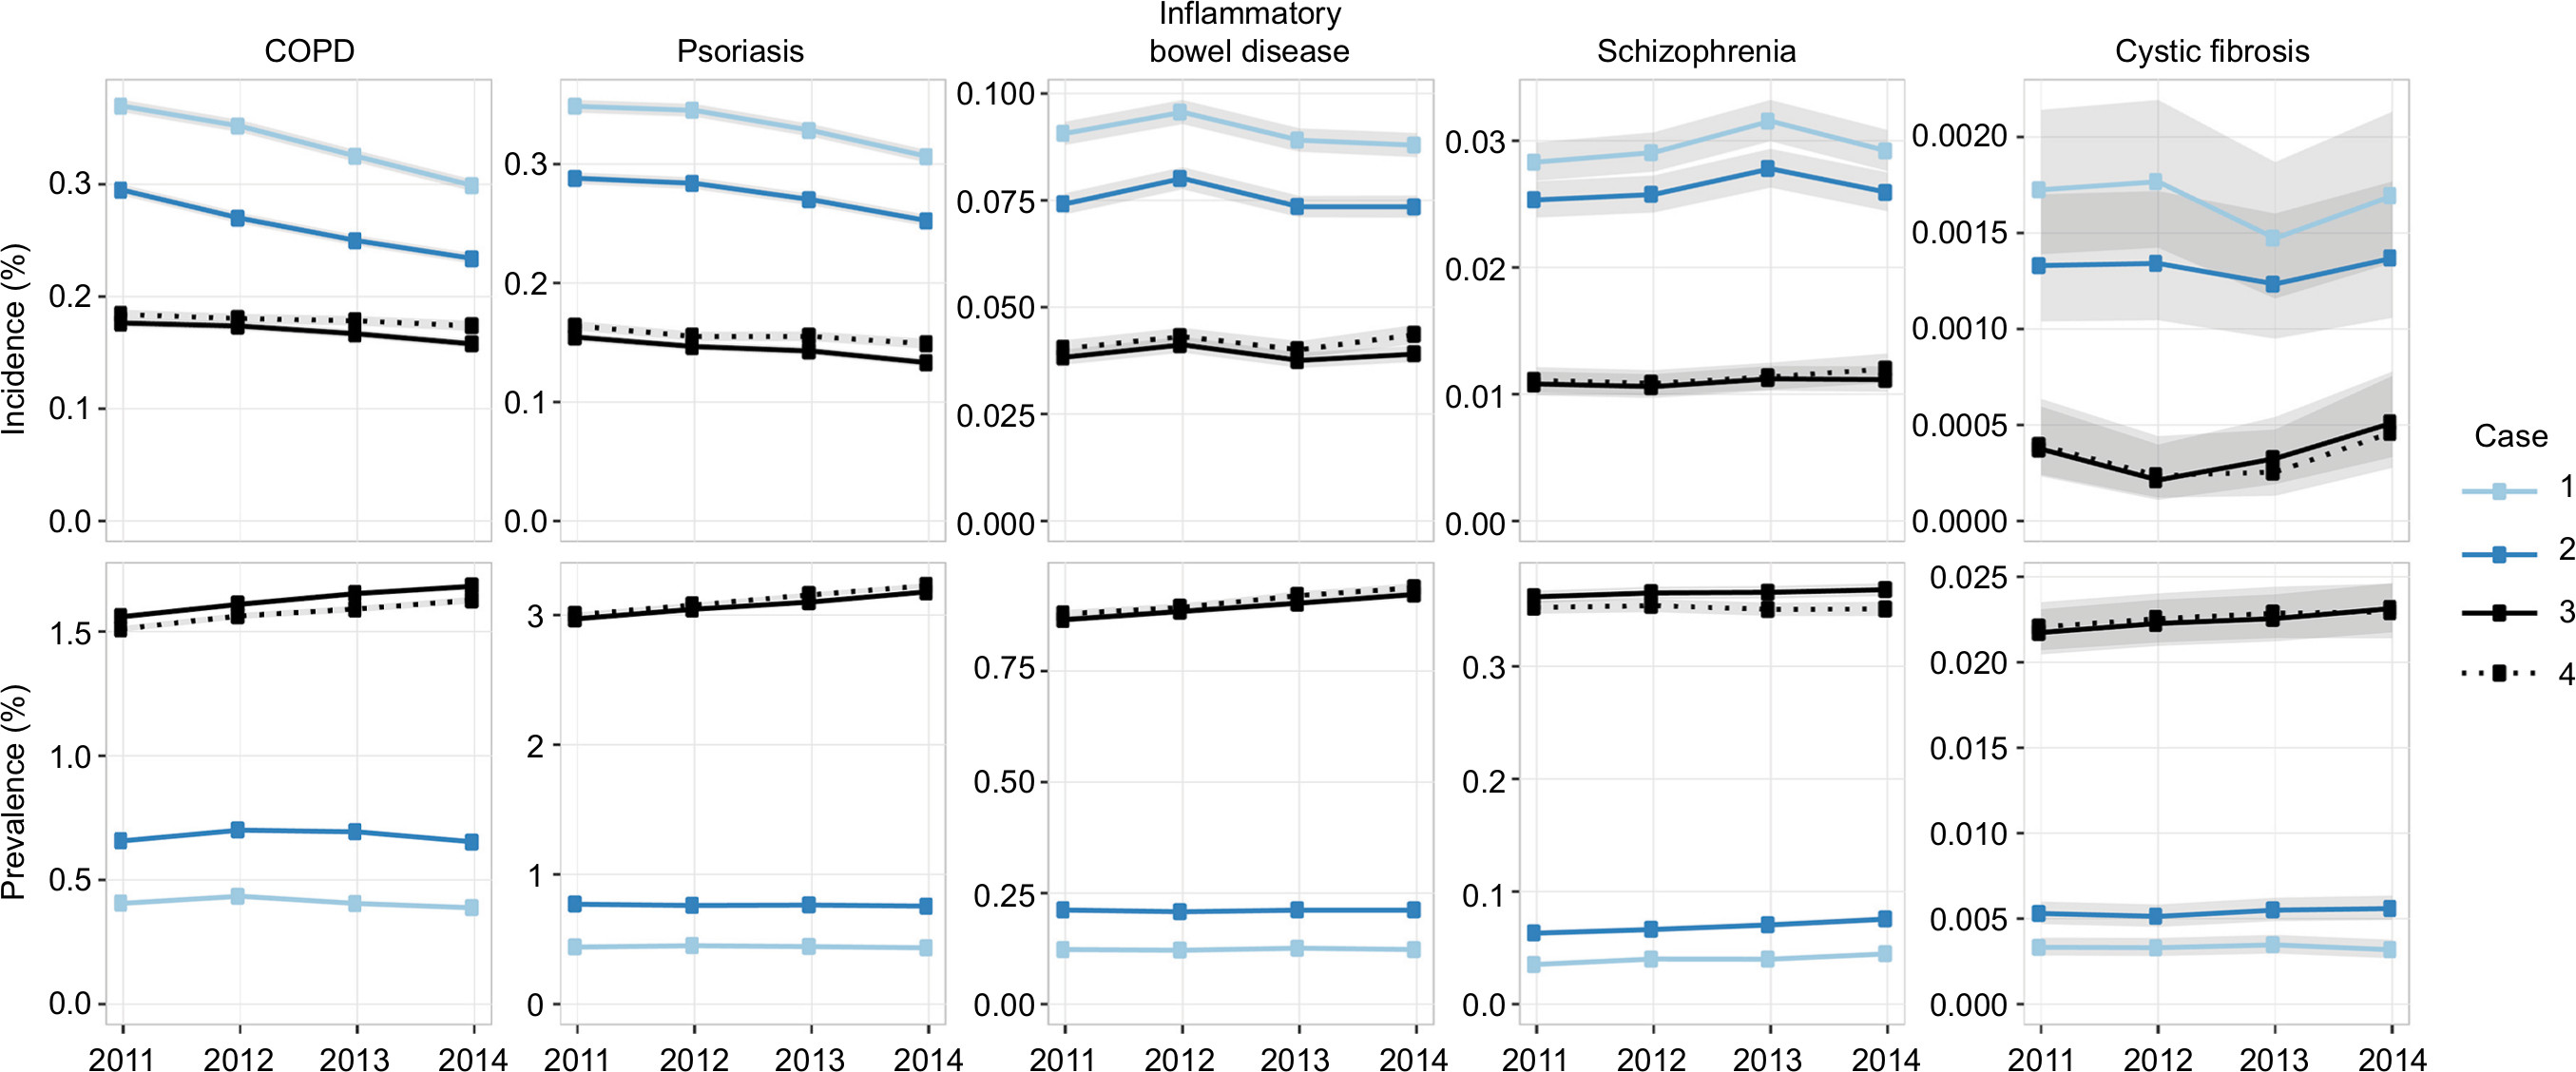 | Figure 6 Incidence and parameter estimates, by case examples, in CPRD. Notes: Cumulative incidence (“incidence”) and point prevalence (“prevalence”) estimates are shown for each of the four cases, across multiple diseases. Case 1: 1-year lookback; Day 1 population. Case 2: 2-year lookback; Day 1 population. Case 3: all-time lookback; Day 1 population. Case 4: all-time lookback; complete-time population. Shaded regions indicate 95% confidence intervals. Tabular estimates are provided in Table S4. Abbreviation: CRPD, Clinical Practice Research Datalink. |
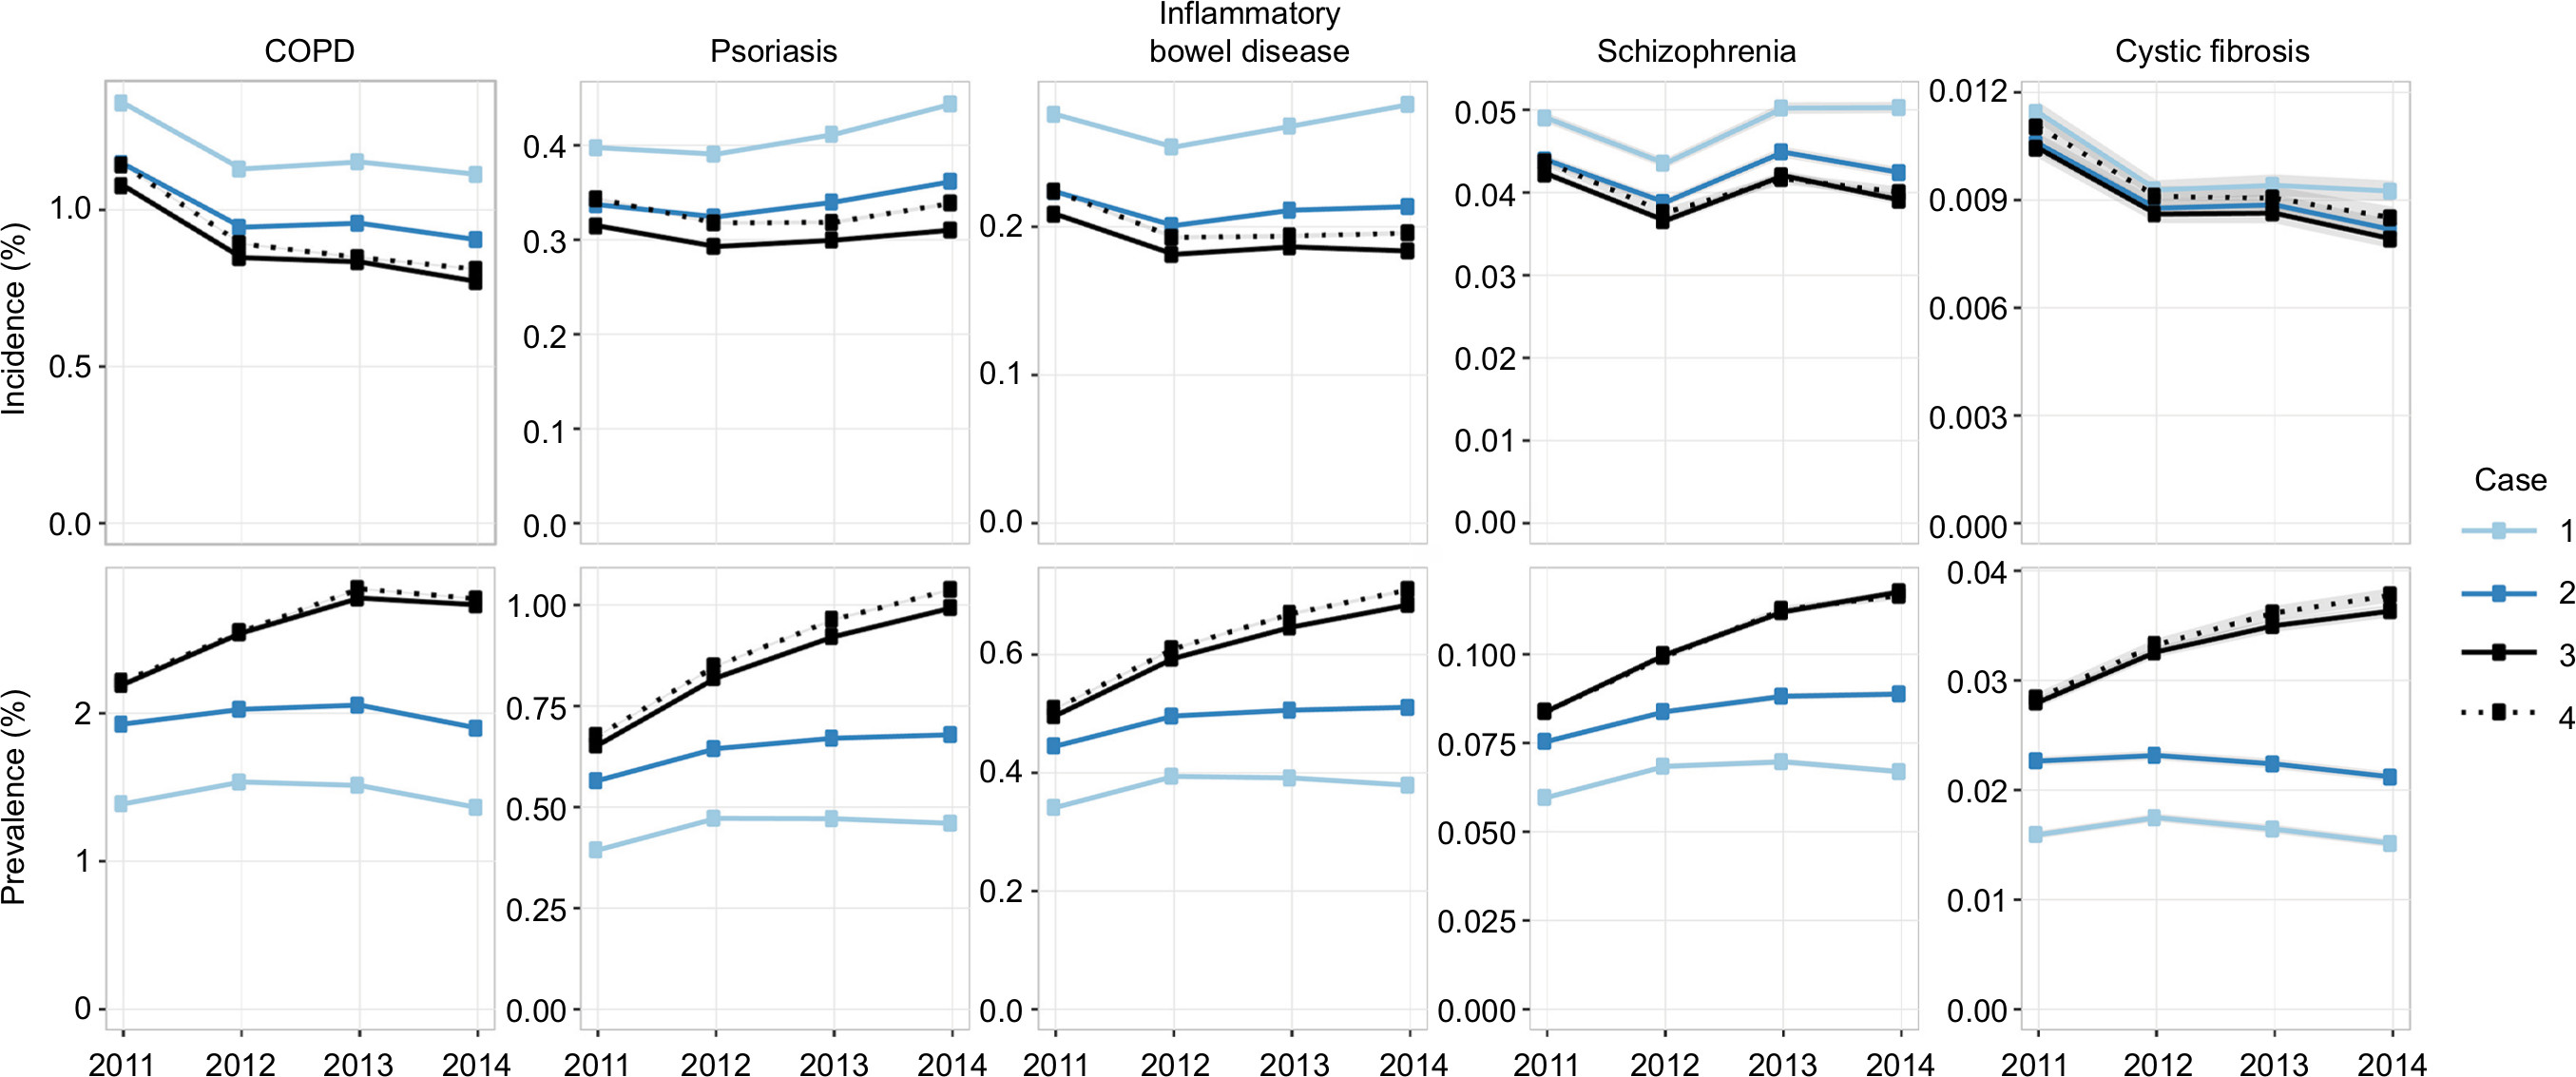 | Figure 7 Incidence and parameter estimates, by case examples, in MarketScan. Notes: Cumulative incidence (“incidence”) and point prevalence (“prevalence”) estimates are shown for each of the four cases, across multiple diseases. Case 1: 1-year lookback; Day 1 population. Case 2: 2-year lookback; Day 1 population. Case 3: all-time lookback; Day 1 population. Case 4: all-time lookback; complete-time population. Shaded regions indicate 95% confidence intervals. Tabular estimates are provided in Table S5. |
No consistent pattern emerged regarding which choice of lookback time gave results that were most consistent with the magnitudes of published estimates (Table 3). Half of the 20 prevalence/incidence analyses by disease shown in Figures 6 and 7 corresponded to published values that fell within the estimate ranges spanned by the choice of lookback time of at least 1 year. For this half, in 2014, three analyses were most consistent with the published results when a 1-year lookback was used; three were most consistent with a 2-year lookback; and four were most consistent with an all-time lookback. For the other half, variation in lookback time alone likely could not have accounted for discrepancies with published estimates, but three were closest to published estimates when a 1-year lookback was used, and seven were most consistent when an all-time lookback was used.
The choice of lookback time also influenced temporal trends in prevalence estimates. In both CPRD and MarketScan, prevalence estimates were relatively constant between 2011 and 2014 when using a 1-year lookback (Case 1), but these increased year over year when using an all-time lookback (Case 3). For example, in MarketScan, the year 2014 – compared to 2011 – had a 1.3–1.5 times higher prevalence when using an all-time lookback, but a 0.95–1.2 times higher prevalence when using a 1-year lookback (depending on the disease). This pattern was less pronounced but still evident in CPRD. The effect of lookback time on temporal trends in incidence estimates was less clear, as it varied across diseases and databases; however, in some cases, the use of an all-time lookback revealed incidence estimates that were relatively more constant across time, compared to the results obtained using a 1-year lookback.
Effects of the choice of the population denominator
Broadly speaking, the selection of the denominator did not affect prevalence or incidence estimates. This can be seen by comparing Case 3 (Day 1 population; those observable on at least the first day of the year) against Case 4 (the complete-period population; those observable on all days of the year) in Figures 6 and 7. However, the denominator definition did affect the population that was being considered, as the complete-period population had substantial reductions in size compared to the Day 1 population (Figures S1 and S2). For example, in 2014, the complete-period population, compared to the Day 1 population, had a relative loss of approximately 0.8 million patients and approximately 7.5 million patients in CPRD and MarketScan, respectively.
Discussion
We have demonstrated and discussed a range of design choices for estimating prevalence and incidence of chronic conditions in administrative claims and EHR databases. Based on the design choices made, we observed relative increases in estimates of prevalence of up to eight times and consequent relative decreases in estimates of incidence of up to three times. Particularly, in our claims data examples, we also saw substantive time trends in places where we expected prevalence/incidence estimates to be essentially unchanging over time. These observations underscore the importance of thoughtful design and execution of even “simple” studies estimating these core public health parameters.
Much of this variation was driven by assumptions regarding observable person-time. Since observable person-time is critical to determine both the numerator and the denominator for prevalence estimation and is equally critical for capturing incident events, it is not surprising that changes in assumptions lead to substantial changes in prevalence/incidence estimation. However, the effects of these assumptions are perhaps less appreciated than the effects of the measurement of the disease itself (eg, case definition), which is a more recognized concept.
A particularly important aspect of observability is the amount of lookback time used to search for prevalent disease-related medical encounters. Overall, we found that fixed (1-year or 2-year) lookback periods provide estimates that are more stable over time, because each year is more likely to have similar amounts of historical data available. In contrast, when using an all-time lookback, the amount of historical data available (and thus, probability of capturing an observation of disease) is likely to grow over time. However, fixed lookback periods can give significantly lower prevalence and higher incidence estimates than an all-time lookback. The correct choice of lookback requires an understanding of how observations for a particular chronic disease tend to be captured in a given data set. If a subject with disease is likely to have a recorded observation in a given year, then shorter lookback times are likely sufficient; if not, then longer lookback times may be required.
This study was limited by the fact that the expected values shown in Table 3 may not have been directly comparable with the observed results due to variations in population characteristics (eg, age), case definitions, years considered, and other factors. In some cases, insufficient methodological detail in the original study may have resulted in an inability to determine possible causes of estimate discrepancies. Thus, determining the “best” choice of lookback time by comparing observations with published estimates may not have been possible. Another limitation is that CPRD may provide relatively more complete data capture than other EHR datasets, and thus our assumptions regarding observability may not be generalizable to other EHR datasets, especially in the US.
This paper considers prevalence and cumulative incidence of chronic disease, defined loosely as diseases that persist for long periods of time after diagnosis. Measuring the prevalence of acute disease could follow the principles outlined herein, but it would additionally require knowledge of the typical duration of the illness. Further, while the prevalence and incidence estimates in this paper correspond to the populations represented in the underlying databases, we note that a more general measure of these values could be obtained by techniques such as standardization or adjustment.
Conclusion
Seemingly simple and important epidemiologic measures such as disease prevalence and incidence show substantial sensitivity to design and measurement choices that investigators make explicitly or implicitly. It is feared that most investigators make implicit assumptions based on intuition and may underappreciate the direct relationship between the data-generating mechanism and estimation validity. This conceptualization described here and the accompanying examples help draw attention to an underrecognized problem with substantial implications for planning health care resources, identifying medical need, and prioritizing medical product development. Transparency in the exact definitions of these measures will help more thoughtful design with increased standardization and accurate interpretation.
Acknowledgments
We would like to thank Abby Case, Pattra Mattox, and Christina Raabe for their excellent assistance with this study. An earlier version of this article was presented as a poster at the 34th International Conference on Pharmacoepidemiology and Therapeutic Risk Management (ICPE) in Prague, Czech Republic, August 22–26, 2018. This study was partially supported by Boehringer Ingelheim.
Author contributions
Jeremy A Rassen designed the study and led the writing and editing of all sections of the text, figures, and tables. Dorothee B Bartels directed the choice of disease areas, designed the study’s analytic strategy, led implementation, and contributed to the writing of all sections of the text. Sebastian Schneeweiss advised on the study’s analytic strategy and contributed to the writing of all sections of the text. Amanda Patrick advised on the study parameters and analytic strategy and contributed to the writing of all sections of the text. William Murk advised on design and implementation, created the figures and tables, and contributed to the writing and editing of all sections of the text. All authors contributed to data analysis, drafting and revising the article, gave final approval of the version to be published, and agree to be accountable for all aspects of the work.
Disclosure
Jeremy A Rassen is an employee of and has an ownership interest in Aetion, Inc, a technology company that provides analytic software and services to the health care industry. Dorothee B Bartels is an employee of Boehringer Ingelheim, which is a customer of Aetion, Inc. Sebastian Schneeweiss is a consultant to World Health Information Science Consultants (WHISCON), LLC, and to Aetion, Inc, in which he also owns equity. He is the principal investigator of investigator-initiated grants to the Brigham and Women’s Hospital from Bayer, Genentech, and Boehringer Ingelheim. Amanda R Patrick is an employee of and has ownership in Aetion, Inc. At the time of writing, William Murk was an employee of and had ownership in Aetion, Inc, in which he has an ownership interest. The authors report no other conflicts of interest in this work.
References
Rothman KJ, Greenland S1, Lash TL. Modern Epidemiology. Philadelphia: Wolters Kluwer Health/Lippincott Williams & Wilkins; 2008. | ||
Kweon S, Kim Y, Jang MJ, et al. Data resource profile: the Korea National Health and Nutrition Examination Survey (KNHANES). Int J Epidemiol. 2014;43(1):69–77. | ||
Schneeweiss S, Avorn J. A review of uses of health care utilization databases for epidemiologic research on therapeutics. J Clin Epidemiol. 2005;58(4):323–337. | ||
Franklin JM, Schneeweiss S. When and How Can Real World Data Analyses Substitute for Randomized Controlled Trials? Clin Pharmacol Ther. 2017;102(6):924–933. | ||
Lin KJ, Schneeweiss S. Considerations for the analysis of longitudinal electronic health records linked to claims data to study the effectiveness and safety of drugs. Clin Pharmacol Ther. 2016;100(2):147–159. | ||
Stergachis A, Saunders KW, Davis RL et al. Examples of Automated Databases. In: Strom BL and Kimmel SE, editors. Textbook of Pharmacoepidemiology. Chichester: John Wiley & Sons; 2006: 173–214. | ||
Tamblyn R, Lavoie G, Petrella L, Monette J. The use of prescription claims databases in pharmacoepidemiological research: the accuracy and comprehensiveness of the prescription claims database in Québec. J Clin Epidemiol. 1995;48(8):999–1009. | ||
Herrett E, Gallagher AM, Bhaskaran K, et al. Data Resource Profile: Clinical Practice Research Datalink (CPRD). Int J Epidemiol. 2015;44(3):827–836. | ||
Schneeweiss S, Rassen JA, Glynn RJ, et al. Supplementing claims data with outpatient laboratory test results to improve confounding adjustment in effectiveness studies of lipid-lowering treatments. BMC Med Res Methodol. 2012;12(1):180. | ||
Carnahan RM. Mini-Sentinel’s systematic reviews of validated methods for identifying health outcomes using administrative data: summary of findings and suggestions for future research. Pharmacoepidem Drug Safe. 2012;21:90–99. | ||
Suissa S. Immeasurable time bias in observational studies of drug effects on mortality. Am J Epidemiol. 2008;168(3):329–335. | ||
Lin KJ, Glynn RJ, Singer DE, Murphy SN, Lii J, Schneeweiss S. Out-of-system Care and Recording of Patient Characteristics Critical for Comparative Effectiveness Research. Epidemiology. 2018;29(3):356–363. | ||
Schneeweiss S. Automated data-adaptive analytics for big healthcare data to study causal treatment effects. Clin Epidemiol. 2018;10:771–788. | ||
Roberts AW1, Dusetzina SB, Farley JF. Revisiting the washout period in the incident user study design: why 6–12 months may not be sufficient. J Comp Eff Res. 2015;4(1):27–35. | ||
Nakasian SS, Rassen J, Franklin JM. Effects of expanding the look-back period to all available data in the assessment of covariates. Pharmacoepidem Drug Safe. 2017;19(8):858–10. | ||
Roberts AW, Dusetzina SB, Farley JF. Revisiting the washout period in the incident user study design: why 6–12 months may not be sufficient. J Comp Eff Res. 2015;4(1):27–35. | ||
Chen G, Lix L, Tu K, et al; Hypertension Outcome and Surveillance Team. Influence of Using Different Databases and “Look Back” Intervals to Define Comorbidity Profiles for Patients with Newly Diagnosed Hypertension: Implications for Health Services Researchers. PLoS One. 2016;11(9):e0162074. | ||
Herman RA, Gilchrist B, Link BK, Carnahan R. A systematic review of validated methods for identifying lymphoma using administrative data. Pharmacoepidem Drug Safe. 2012;21:203–212. | ||
Porta MS, Greenland S, Hernâan M, dos Santos Silva I, Last JM. A Dictionary of Epidemiology. Oxford; New York: Oxford University Press; 2008. | ||
Porta MS, Greenland S, Hernâan M, dos Santos Silva I, Last JM. A Dictionary of Epidemiology. Oxford; New York: Oxford University Press; 2008. | ||
Farrell PM. The prevalence of cystic fibrosis in the European Union. J Cyst Fibros. 2008;7(5):450–453. | ||
Adeloye D, Chua S, Lee C, et al; Global Health Epidemiology Reference Group (GHERG). Global and regional estimates of COPD prevalence: Systematic review and meta-analysis. J Glob Health. 2015;5(2):020415. | ||
The Truven Health MarketScan Databases for Life Sciences Researchers. 2017:1–24. Available from: https://truvenhealth.com/Portals/0/Assets/2017-MarketScan-Databases-Life-Sciences-Researchers-WP.pdf. Accessed July 25, 2018. | ||
Chronic Obstructive Pulmonary Disease (COPD) Statistics [homepage on the Internet]. British Lung Association. Available from: https://statistics.blf.org.uk/copd. Accessed October 30, 2018. | ||
Khalid JM, Globe G, Fox KM, Chau D, Maguire A, Chiou CF. Treatment and referral patterns for psoriasis in United Kingdom primary care: a retrospective cohort study. BMC Dermatol. 2013;13(1):9. | ||
Burisch J, Jess T, Martinato M, Lakatos PL; ECCO -EpiCom. The burden of inflammatory bowel disease in Europe. J Crohns Colitis. 2013;7(4):322–337. | ||
Rubin GP, Hungin AP, Kelly PJ, Ling J. Inflammatory bowel disease: epidemiology and management in an English general practice population. Aliment Pharmacol Ther. 2000;14(12):1553–1559. | ||
Kirkbride JB, Errazuriz A, Croudace TJ, et al. Incidence of Schizophrenia and Other Psychoses in England, 1950–2009: a Systematic Review and Meta-Analyses. PLoS One. 2012;7(3):e31660. | ||
Annual Data Report 2016. UK Cystic Fibrosis Registry; 2017:1–60. Available from: https://www.cysticfibrosis.org.uk/~/media/documents/the-work-we-do/uk-cf-registry/2016-registry-annual-data-report.ashx?la=en. Accessed July 25, 2018. | ||
Ramsay G. Quality and Outcomes Framework – Prevalence, Achievements and Exceptions Report. 2016:1–43. Available from: https://files.digital.nhs.uk/publicationimport/pub22xxx/pub22266/qof-1516-rep-v2.pdf. Accessed June 01, 2018. | ||
Seminara NM, Abuabara K, Shin DB, et al. Validity of The Health Improvement Network (THIN) for the study of psoriasis. Br J Dermatol. 2011;164(3):602–609. | ||
Gershon AS, Wang C, Wilton AS, Raut R, To T. Trends in chronic obstructive pulmonary disease prevalence, incidence, and mortality in Ontario, Canada, 1996 to 2007: a population-based study. Arch Intern Med. 2010;170(6):560–565. | ||
Icen M, Crowson CS, McEvoy MT, Dann FJ, Gabriel SE, Maradit Kremers H. Trends in incidence of adult-onset psoriasis over three decades: a population-based study. J Am Acad Dermatol. 2009;60(3):394–401. | ||
The Facts About Inflammatory Bowel Diseases. Crohn’s & Colitis Foundation of America; 2014:1–24. Available from: http://www.crohnscolitisfoundation.org/assets/pdfs/updatedibdfactbook.pdf. Accessed July 25, 2018. | ||
Shivashankar R, Tremaine WJ, Harmsen WS, Loftus EV Jr. Incidence and Prevalence of Crohn’s Disease and Ulcerative Colitis in Olmsted County, Minnesota From 1970 Through 2010. Clin Gastroenterol Hepatol. 2017;15(6):857–863. | ||
Bresnahan MA, Brown AS, Schaefer CA, Begg MD, Wyatt RJ, Susser ES. Incidence and cumulative risk of treated schizophrenia in the prenatal determinants of schizophrenia study. Schizophr Bull. 2000;26(2):297–308. | ||
Cystic Fibrosis Foundation. Annual Data Report; 2016. Available from: https://www.cff.org/Research/Researcher-Resources/Patient-Registry/2016-Patient-Registry-Annual-Data-Report.pdf. Accessed July 25, 2018. | ||
American Lung Association. Estimated Prevalence and Incidence of Lung Disease. 2014:1–65. Available from: http://www.lung.org/assets/documents/research/estimated-prevalence.pdf. Accessed June 01, 2018. | ||
Rachakonda TD, Schupp CW, Armstrong AW, et al. Psoriasis prevalence among adults in the United States. J Am Acad Dermatol. 2014;70(3):512–516. | ||
Kappelman MD, Rifas-Shiman SL, Kleinman K, et al. The prevalence and geographic distribution of Crohn’s disease and ulcerative colitis in the United States. Clin Gastroenterol Hepatol. 2007;5(12):1424–1429. | ||
Desai PR, Lawson KA, Barner JC, Rascati KL. Estimating the direct and indirect costs for community-dwelling patients with schizophrenia. J Pharm Health Serv Res. 2013;4(4):187–194. | ||
UK Population Estimates [homepage on the Internet]. Office of National Statistics; 1851 to 2014. Available from: https://www.ons.gov.uk/peoplepopulationandcommunity/populationandmigration/populationestimates/adhocs/004356ukpopulationestimates1851to2014. Accessed October 30, 2018. | ||
National Population Totals [homepage on the Internet]: US Census Bureau; 2010–2016. Available from: https://www.census.gov/data/tables/2016/demo/popest/nation-total.html. Accessed October 30, 2018. |
 © 2018 The Author(s). This work is published and licensed by Dove Medical Press Limited. The full terms of this license are available at https://www.dovepress.com/terms.php and incorporate the Creative Commons Attribution - Non Commercial (unported, v3.0) License.
By accessing the work you hereby accept the Terms. Non-commercial uses of the work are permitted without any further permission from Dove Medical Press Limited, provided the work is properly attributed. For permission for commercial use of this work, please see paragraphs 4.2 and 5 of our Terms.
© 2018 The Author(s). This work is published and licensed by Dove Medical Press Limited. The full terms of this license are available at https://www.dovepress.com/terms.php and incorporate the Creative Commons Attribution - Non Commercial (unported, v3.0) License.
By accessing the work you hereby accept the Terms. Non-commercial uses of the work are permitted without any further permission from Dove Medical Press Limited, provided the work is properly attributed. For permission for commercial use of this work, please see paragraphs 4.2 and 5 of our Terms.