")
Back to Journals » International Journal of Chronic Obstructive Pulmonary Disease » Volume 12
Measures of bronchodilator response of FEV1, FVC and SVC in a Swedish general population sample aged 50–64 years, the SCAPIS Pilot Study
Authors Torén K , Bake B, Olin A-C, Engström G, Blomberg A, Vikgren J, Hedner J , Brandberg J, Persson HL , Sköld CM, Rosengren A, Bergström G, Janson C
Received 10 November 2016
Accepted for publication 6 January 2017
Published 22 March 2017 Volume 2017:12 Pages 973—980
DOI https://doi.org/10.2147/COPD.S127336
Checked for plagiarism Yes
Review by Single anonymous peer review
Peer reviewer comments 2
Editor who approved publication: Dr Richard Russell
K Torén,1 B Bake,1 A-C Olin,1 G Engström,2 A Blomberg,3 J Vikgren,4 J Hedner,5 J Brandberg,4 HL Persson,6,7 CM Sköld,8 A Rosengren,9 G Bergström,9 C Janson10
1Section of Occupational and Environmental Medicine, Institute of Medicine, Sahlgrenska Academy, University of Gothenburg, Gothenburg, 2Department of Clinical Science, Lund University, Malmö, 3Division of Medicine/Respiratory Medicine, Department of Public Health and Clinical Medicine, Umeå University, Umeå, 4Department of Radiology, Institute of Clinical Sciences, 5Department of Internal Medicine/Lung Medicine, Institute of Medicine, Sahlgrenska Academy, University of Gothenburg, Gothenburg, 6Department of Respiratory Medicine, 7Department of Medicine and Health Sciences, Linköping University, Linköping, 8Respiratory Medicine Unit, Department of Medicine Solna, Centre for Molecular Medicine, Karolinska Institutet, Stockholm, 9Department of Molecular and Clinical Medicine, Institute of Medicine, Sahlgrenska Academy, University of Gothenburg, Gothenburg, 10Department of Medical Sciences, Clinical Physiology and Lung, Allergy and Sleep Research, Uppsala University, Uppsala, Sweden
Background: Data are lacking from general population studies on how to define changes in lung function after bronchodilation. This study aimed to analyze different measures of bronchodilator response of forced expiratory volume in 1 second (FEV1), forced vital capacity (FVC) and slow vital capacity (SVC).
Materials and methods: Data were derived from the Swedish Cardiopulmonary Bioimage Study (SCAPIS) Pilot study. This analysis comprised 1,050 participants aged 50–64 years from the general population. Participants were investigated using a questionnaire, and FEV1, FVC and SVC were recorded before and 15 minutes after inhalation of 400 µg of salbutamol. A bronchodilator response was defined as the relative change from baseline value expressed as the difference in units of percent predicted normal. Predictors of bronchodilator responses were assessed using multiple linear regression models. Airway obstruction was defined as FEV1/FVC ratio below lower limit of normal (LLN) before bronchodilation, and COPD was defined as an FEV1/FVC ratio below LLN after bronchodilation. Physician-diagnosed asthma was defined as an affirmative answer to “Have you ever had asthma diagnosed by a physician?”. Asymptomatic never-smokers were defined as those not reporting physician-diagnosed asthma, physician-diagnosed COPD or emphysema, current wheeze or chronic bronchitis and being a lifelong never-smoker.
Results: Among all subjects, the greatest bronchodilator responses (FEV1, FVC and SVC) were found in subjects with asthma or COPD. The upper 95th percentile of bronchodilator responses in asymptomatic never-smokers was 8.7% for FEV1, 4.2% for FVC and 5.0% for SVC. The bronchodilator responses were similar between men and women. In a multiple linear regression model comprising all asymptomatic never-smokers, the bronchodilator response of FEV1 was significantly associated with airway obstruction and height.
Conclusion: When the bronchodilator response in asymptomatic never-smokers is reported as the difference in units of predicted normal, significant reversibility of FEV1, FVC and SVC to bronchodilators is ~9%, 4% and 5%, respectively.
Keywords: spirometry, reversibility, COPD, epidemiology
A Letter to the Editor has been received and published for this article
Introduction
Measurement of the bronchodilator response of forced expiratory volume in 1 second (FEV1) is an important method in clinical respiratory medicine. This measurement is used to predict the response to bronchodilator treatment and is part of the diagnosis of COPD and asthma. The bronchodilator response of forced vital capacity (FVC) has less clinical use than the bronchodilator response of FEV1 but may add important clinical physiological information.1
Normality for a majority of lung function outcomes is based on their distribution in healthy subpopulations. Therefore, the normal range will comprise 95% of a normal healthy population. However, the normal range of the bronchodilator response has often been based on data from selected populations of patients with asthma or COPD.2–4
Bronchodilator response can be expressed as the relative change from baseline value expressed as a percentage or as the difference in percent predicted (after bronchodilation - before bronchodilation) expressed as a percentage.5 Lorber et al6 first focused on the bronchodilator response in the general population. Based on a healthy subpopulation, they proposed a relative change from baseline in FEV1 of 7.7% as a significant bronchodilator response. They also noted that a low baseline FEV1 was predictive for the bronchodilator response. Similar results have been published from Canada and Finland.7,8 The Burden of Obstructive Lung Disease (BOLD) study showed that the upper 95th percentile for the relative change from baseline was 12.5% for FEV1 for 3,922 healthy non-smokers.9 In the BOLD study, the upper 95th percentile for the difference expressed as a percentage of the predictive values was 10.1% for FEV1, and the BOLD group recommends that the threshold should be expressed as 10% change (percentage) of predicted.10
In clinical practice, patients sometimes show an isolated increase in FVC upon bronchodilation. A proposed mechanism for this finding is that deep inhalations reduce the caliber of the airways.2,11 Among patients with COPD, vital capacity (VC) responders have a greater degree of airway obstruction, but a similar degree of emphysema, compared with FEV1 responders.1 For FVC, the evidence from general population-based studies is weaker, and the results are less consistent.6,12 The BOLD study showed that the upper 95th percentile was 11.2% for a relative change from baseline of FVC in healthy non-smokers.9 The upper 95th percentile for the difference expressed in predictive values was 9.6% for FVC. In the BOLD study, the positive predictors of bronchodilator response for FVC were age, male sex, diagnosed asthma, use of asthma drugs and ever smoking.10 When an FVC procedure is performed, higher dynamic compression may result in airway collapse and air trapping.13 This phenomenon is considered to be most pronounced in subjects with airflow obstruction but can be overcome by performing SVC maneuvers. To the best of our knowledge, no studies have investigated the bronchodilator response for SVC in the general population. A small study on 33 patients showed that the bronchodilator response was greater for FVC than for SVC.13
A large general population-based study (Swedish Cardiopulmonary Bioimage Study [SCAPIS]) has been initiated in Sweden with the overall aim of extensively phenotyping a cohort of 30,000 individuals aged 50–64 years and using the acquired information to improve risk stratification and to optimize conditions to characterize the mechanisms behind COPD and different cardiovascular diseases.14 The field phase of the SCAPIS is ongoing, and the plan is to complete the field study in 2019. During the planning of the SCAPIS, a small pilot study called the SCAPIS Pilot Study was conducted, and the present study is based on the pilot study. The main study, SCAPIS, and the SCAPIS Pilot have similar protocols, but one important difference is that the SCAPIS Pilot protocol comprises dynamic spirometry before and after bronchodilation. The main study (SCAPIS) comprises only dynamic spirometry after bronchodilation.
This study aimed to analyze and compare different measures of bronchodilator responses of FEV1, FVC and SVC in the general population aged 50–64 years.
Materials and methods
This analysis is performed using the SCAPIS Pilot.14,15 The study population comprises a general population sample comprising subjects aged 50–64 years. Of the 2,243 invited participants, 1,111 participated in the field study. All participants in the SCAPIS Pilot completed a respiratory questionnaire, including items of respiratory symptoms, physician-diagnosed asthma and smoking habits.15
Dynamic spirometry was performed using a nose clamp and with the subject in the sitting position. The spirometry included FEV1, FVC and SVC, using a Jaeger Master Screen PFT (Hoechberg, Germany).16 SVC was measured before FVC and FEV1. There were at least three and a maximum of eight attempts, stopping when two reproducible measurements were obtained. The spirometry was performed before and 15 minutes after bronchodilation. The bronchodilation was inhalation of 400 μg of salbutamol. Predicted values of FEV1 and FVC were assessed using recently published Swedish reference equations, and predicted values of SVC were based on Swedish reference material with reference equations for SVC.17,18
Definitions
Airway obstruction before bronchodilation (AOPREDIL) was defined as an FEV1/FVC ratio below the lower limit of normal (LLN) before bronchodilation.
COPD was defined as an FEV1/FVC ratio below LLN after bronchodilation.2,19
We used three measures of bronchodilator response, ie, the difference between the results after bronchodilation minus the baseline results before bronchodilation for each of FEV1, FVC and SVC.2 Thus, the bronchodilator response is expressed in the three following ways:
- In absolute terms, the baseline values were measured (ΔFEV1, ΔFVC and ΔSVC) and expressed in mL.
- As a percentage on the baseline values (%ΔFEV1, %ΔFVC and %ΔSVC).
- In units of percent predicted normal, ie, percent predicted normal after bronchodilation minus percent predicted normal before bronchodilation (%ΔFEV1p, %ΔFVCp and %ΔSVCp). With this measure, an increase in FEV1p from 70% predicted to 77% predicted will result in a %ΔFEV1p of 7%.
Body mass index (BMI) was defined as measured weight/height2 (kg/m2).
The following questionnaire-based definitions were used:
Physician-diagnosed asthma was defined as an affirmative answer to “Have you ever had asthma diagnosed by a physician?”.20
Physician-diagnosed COPD or emphysema was defined as an affirmative answer to “Have you ever had COPD or emphysema diagnosed by a physician?”.21
Chronic bronchitis was defined as an affirmative answer to “Have you had longstanding cough with phlegm? and If so, did any period last at least three months? and If so have you had such periods at least two years in a row?”.22
Current wheeze was defined as an affirmative answer to “Have you had wheezing or whistling in your chest during the last 12 months?”
Diabetes was defined as an affirmative answer to “Have you ever been told by a physician or another health professional that you have diabetes?”.23
Current use of respiratory medications was based on reported use of drugs for asthma or COPD (inhalers and tablets).
Smoking habits were defined as current smoking, former smoking or never-smoking. Never-smoking was defined as an affirmative answer to “I have never smoked”. Former smoking was defined as an affirmative answer to “I have stopped smoking”. Current smoking was defined as affirmative answers to “I smoke regularly” or “I smoke sometimes” and those who have stopped smoking in the last year.
Asymptomatic never-smokers were defined as those not reporting physician-diagnosed asthma, physician-diagnosed COPD or emphysema, current wheeze or chronic bronchitis and being a lifelong never-smoker.
The study was approved by the Umeå ethical board (Dnr 2010-228-31M), and all participants provided written informed consent for this study.
Statistics
All calculations were performed using SAS version 9.2 (SAS Institute, Cary, NC, USA). Categorical variables were compared using the χ2-test to identify significant associations. A P-value <0.05 was considered significant. The distribution of the bronchodilator response was determined in all subjects, as well as among subjects with COPD, physician-diagnosed asthma and asymptomatic never-smokers. The upper limit of normality was defined as the upper 95th percentile, and 95% confidence limits were calculated using a distribution-free method based on order statistics.24 Correlation coefficients, rs (Spearman), were analyzed for pre-bronchodilatory values of FEV1 and different measures of the bronchodilator response for FEV1 and FVC, and significance levels were tested.25 Bronchodilator responses were finally assessed as mean values, median values or a cutoff limit over the 95th percentile.
Predictors for bronchodilator response of FEV1, FVC and SVC were examined using multiple linear regression models. Initially, an a priori model comprising age, sex, height, weight, smoking variables, physician-diagnosed asthma and AOPREDIL was applied.
Results
In the clinical investigations, 61 subjects were excluded due to incomplete information about smoking habits or spirometry. The final study population hence comprised 1,050 participants, and baseline characteristics including sex, anthropometry, smoking and lung function are shown in Table 1.
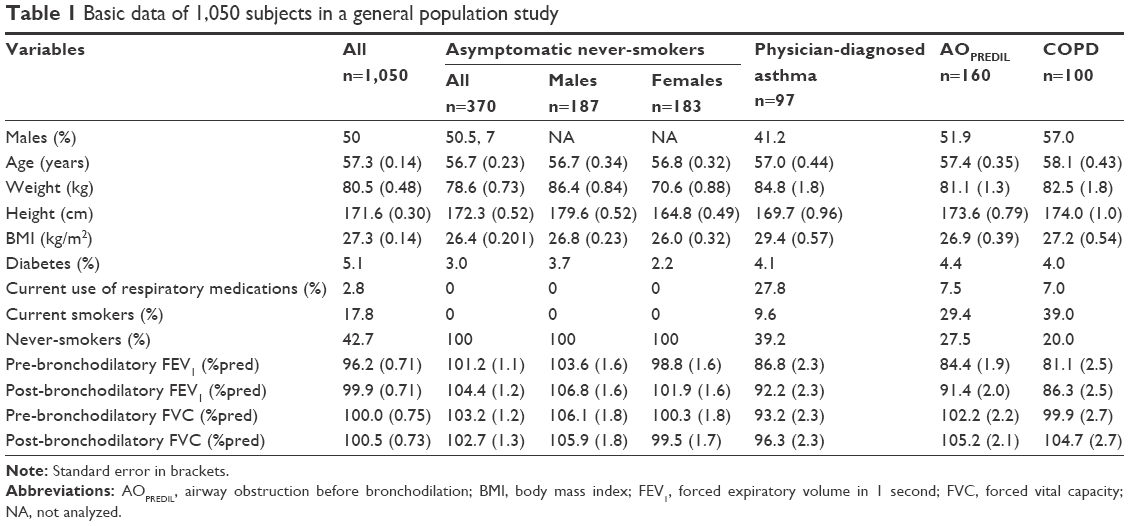 | Table 1 Basic data of 1,050 subjects in a general population study |
The mean values of bronchodilator responses for FEV1, FVC and SVC are shown in Table 2. Among all subjects, the mean ΔFEV1 was 118 mL (median 100 mL), ranging from −470 mL to 1.7 L. The mean ΔFVC was 23 mL (median 0 mL) ranging from −980 to 910 mL. The mean ΔSVC was 6 mL (median 0 mL) ranging from −3.1 to 2.9 L. The highest bronchodilator responses (FEV1, FVC and SVC) were observed in subjects with physician-diagnosed asthma or COPD.
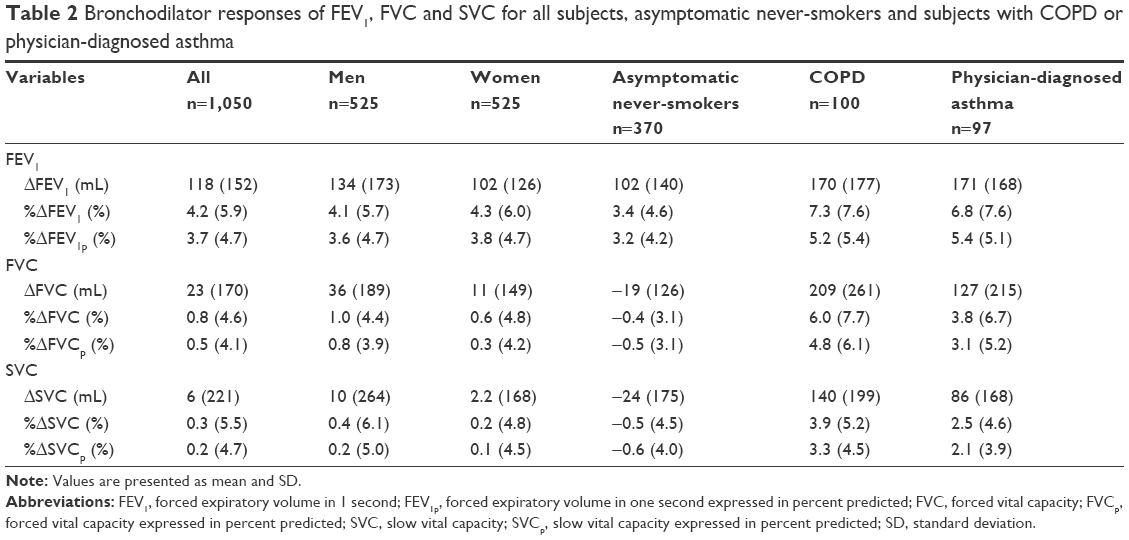 | Table 2 Bronchodilator responses of FEV1, FVC and SVC for all subjects, asymptomatic never-smokers and subjects with COPD or physician-diagnosed asthma |
There was a significant correlation between pre-bronchodilatory FEV1 and %ΔFEV1 (rs=−0.22) and a weaker, but significant, correlation between pre-bronchodilatory FEV1 and %ΔFEV1p (rs=−0.11) (Table 3). However, the correlation between pre-bronchodilatory FEV1 and %ΔFEV1 was stronger compared with that between pre-bronchodilatory FEV1 and %ΔFEV1p, and this difference was significant (P<0.05). The correlation between pre-bronchodilatory FEV1 and the absolute change, ΔFEV1, was lower and not significant (Table 3).
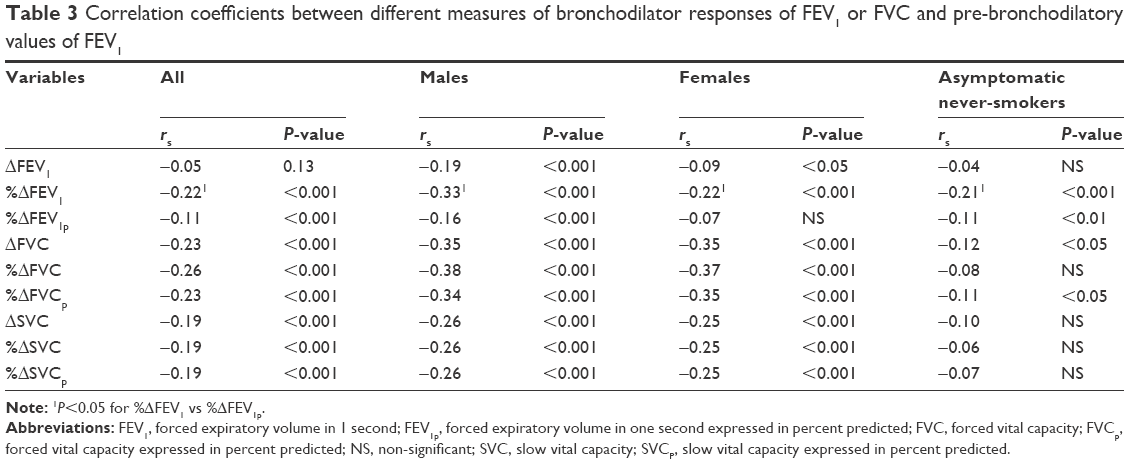 | Table 3 Correlation coefficients between different measures of bronchodilator responses of FEV1 or FVC and pre-bronchodilatory values of FEV1 |
In Table 4, bronchodilator responses are expressed as the upper 95th percentiles for FEV1, FVC and SVC, respectively. When the bronchodilator responses were examined in asymptomatic never-smokers, the upper 95th percentiles of %ΔFEV1 were 10.1% (95% confidence interval [95% CI] 8.5–11.8), for %ΔFVC 4.5% (95% CI 3.9–6.3) and for %ΔSVC 5.6% (95% CI 4.3–8.2). When the upper 95th percentiles of the bronchodilator responses were outlined in units of percent of predicted normal, the responses were of the same magnitudes. The bronchodilator responses were similar between men and women.
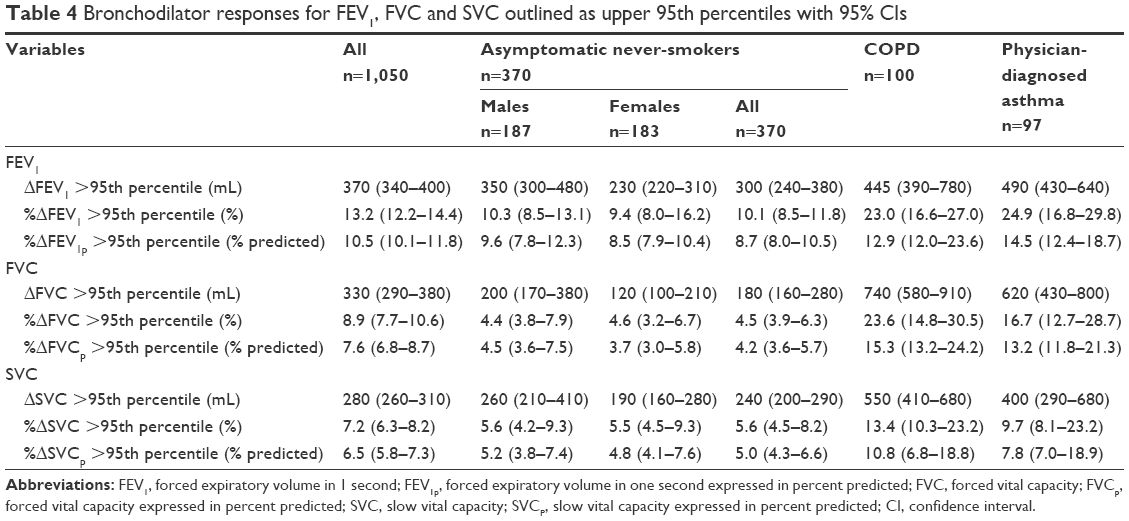 | Table 4 Bronchodilator responses for FEV1, FVC and SVC outlined as upper 95th percentiles with 95% CIs |
In multiple linear regression models comprising all subjects (n=1,050) (Table 5), %ΔFEV1 was negatively associated with height and positively associated with weight, physician-diagnosed asthma and airway obstruction. The predictors for the bronchodilator responses of FVC or SVC were slightly different, but airway obstruction was related also to the bronchodilator response of both FVC and SVC.
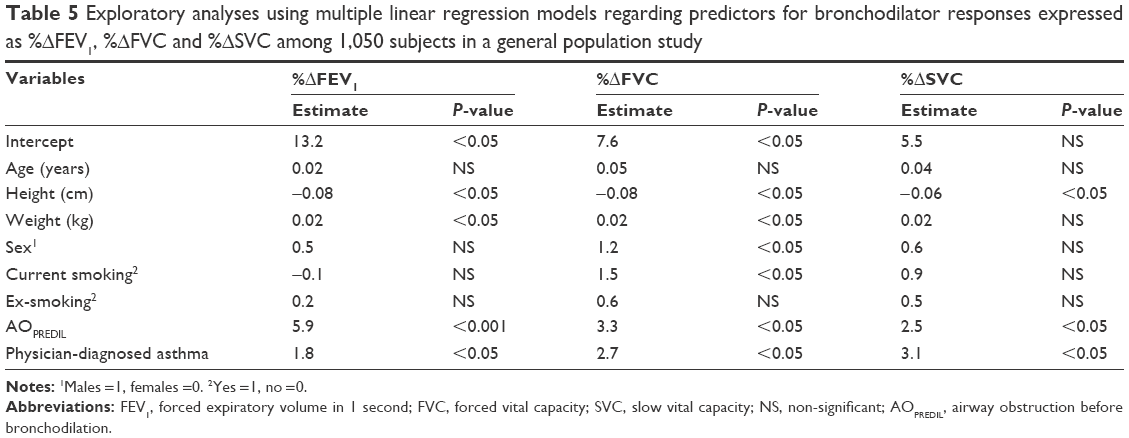 | Table 5 Exploratory analyses using multiple linear regression models regarding predictors for bronchodilator responses expressed as %ΔFEV1, %ΔFVC and %ΔSVC among 1,050 subjects in a general population study |
In multiple linear regression models comprising all asymptomatic never-smokers (n=370) (Table 6), bronchodilator responses of FEV1, expressed as %ΔFEV1, were significantly associated only with airway obstruction. When reversibility of FEV1 was expressed as %ΔFEV1p, the significant associations with airway obstruction remained.
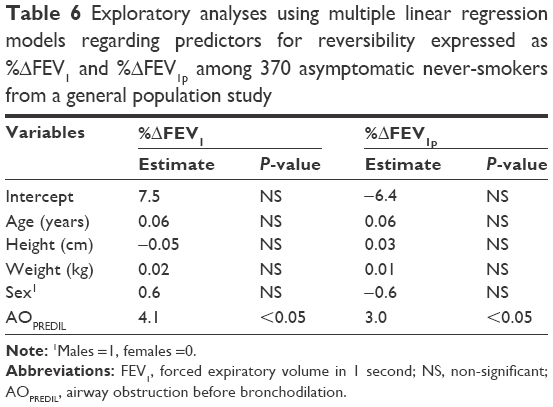 | Table 6 Exploratory analyses using multiple linear regression models regarding predictors for reversibility expressed as %ΔFEV1 and %ΔFEV1p among 370 asymptomatic never-smokers from a general population study |
Discussion
The main results of this study were that bronchodilator reversibility expressed as the difference between predicted values (percentage predicted) in a population-based cohort aged 50–64 years was 8.7% for FEV1, 4.2% for FVC and 5.0% for SVC. The results regarding FEV1 are consistent with the findings in BOLD, but our results regarding FVC indicate a lower bronchodilator response for FVC.9 For SVC, our results are novel.
In our regression models including the total population, the factors that were significantly associated with flow responding (%ΔFEV1) in the total population were airway obstruction, height, weight and physician-diagnosed asthma. We did not observe any significant effects of smoking or sex. Unsurprisingly, airway obstruction defined as the ratio of FEV1/FVC below LLN before bronchodilation was associated with bronchodilator response of FEV1. It reflects the strong relation to low pre-bronchodilatory FEV1. We also tested regression models without including airway obstruction before bronchodilation with similar results, ie, resulting in significant associations with height, weight and physician-diagnosed asthma. In regression models, VC responding (%ΔFVC) was associated with airway obstruction before bronchodilation, as well as physician-diagnosed asthma. Current smokers had increased bronchodilator response of FVC but no association with bronchodilator response of FEV1 or SVC.
When the bronchodilator response values for FEV1 and FVC were outlined as the upper 95th percentiles in asymptomatic never-smokers, they were similar to those shown in the BOLD study.9 Our study suggests a 95th percentile threshold of 10.1% for relative change from baseline in FEV1 and a threshold of 8.7% for reversibility of FEV1 assessed as change in predicted values. The BOLD study reported 12.5% and 10.1%, respectively. It should be noted that we used 400 μg of salbutamol as recommended by GOLD, in contrast to the BOLD study, in which 200 μg of salbutamol was employed.9,19 The bronchodilator response for FVC assessed as change in predicted values was lower in our study, 4.2%, compared to the BOLD results, 9.6%.
There is still controversy whether the bronchodilator response should be expressed as a relative change from the baseline value or as a change in percentages of the predicted value. However, a low baseline FEV1 increases the probability of a subsequent improvement, especially if it is expressed as a relative change.7,26 Therefore, the bronchodilator response has been recommended to be reported as a change expressed as percent predicted.5 However, the joint American Thoracic Society-European Respiratory Society (ATS-ERS) guidelines suggested the use of a 12 percentage point change of the baseline values and >200 mL.2 The ATS-ERS-suggested recommendations were based on studies of short-term variation in patients and were not based on general population data. We believe that our results support the recommendations by Quanjer et al,5 ie, expressing the difference in units of percent predicted normal. There are two reasons: first, because we found that pre-bronchodilatory FEV1 was significantly more correlated with %ΔFEV1 than with %ΔFEV1p. Second, in our regression models of asymptomatic never-smokers, the importance of airway obstruction decreased when expressing bronchodilator reversibility as the difference of percent predicted and the influence of sex disappeared (Table 6).
The BOLD study also discussed this and reported that the percentage change in FEV1, assessed as the predicted value, was the most stable estimate.9 The authors concluded that a 10% increase in predicted FEV1 was required to determine a significant bronchodilator response.9 Our data suggest a threshold of 8.7% relative to predicted FEV1 based on inhalation of 400 μg of salbutamol.
Bronchodilator response is often used to separate between asthma and COPD, but in most studies, the separation is not clear-cut.27 In this study, the asthma definition is based on self-report, and for the age span in our study, the items about physician-diagnosed asthma are misclassified in relation to COPD.28,29 This makes it difficult to draw any firm conclusions about differentiation between asthma and COPD, but still, our results indicate that the bronchodilator response seems to be similar among subjects with COPD and asthma.
We conclude that a 5% increase relative to predicted FVC is the limit for determining a significant bronchodilator response of FVC. We also outlined 95th percentiles for women and men, but there was no obvious difference with regard to sex. The cutoff limits for the bronchodilator response of SVC were slightly higher, with a 10.8% increase relative to predicted baseline.
Limitations of this study are the small sample and the narrow age interval of 50–64 years. Another limitation is the low response rate, 50%, which may introduce non-response bias in relation to smoking habits and male sex.30 However, this has mainly been observed in younger subjects. Therefore, we consider that our results are valid despite the low response rate. Another limitation is the lack of assessment of reproducibility, which has not been investigated in our study.
Conclusion
We conclude that bronchodilator responses preferably should be assessed in units of predicted normal values, ie, the difference between the predicted normal value after bronchodilation minus the corresponding value before bronchodilation. Accordingly, bronchodilator responses of FEV1 =9%, FVC =4% and SVC =6% are suggested to be significant.
Acknowledgments
The main funding body of The Swedish Cardiopulmonary Bioimage Study (SCAPIS) was the Swedish Heart and Lung Foundation. The study was also funded by the Knut and Alice Wallenberg Foundation, the Swedish Research Council (VR), VINNOVA and the Swedish Council for Working Life, Health, and Welfare (FORTE). In addition, there was support from the Sahlgrenska University Hospital, strategic grants from ALF/LUA in Western Sweden and from the Sahlgrenska Academy at University of Gothenburg.
Disclosure
The authors report no conflicts of interest in this work.
References
Walker PP, Calverley PMA. The volumetric response to bronchodilators in stable chronic obstructive pulmonary disease. COPD. 2008;5(3):147–152. | ||
Pellegrino R, Viegi G, Brusasco V, et al. ATS/ERS Task Force: standardization of lung function testing. Interpretative strategies for lung function tests. Eur Respir J. 2005;26:948–968. | ||
Calverley PMA, Albert P, Walker PP. Bronchodilator reversibility in chronic obstructive pulmonary disease: use and limitations. Lancet Respir Med. 2013;1(7):564–573. | ||
Ward H, Cooper BC, Miller MR. Improved criterion for assessing lung function reversibility. Chest. 2015;148(8):877–886. | ||
Quanjer PH, Tammeling GJ, Cotes JE, et al. Lung volumes and forced ventilatory flows. Report Working party standardization of lung function tests, European Community for Steel and Coal. Official statement of the European Respiratory Society. Eur Respir J. 1993;6(suppl):16. | ||
Lorber DB, Kaltenborn W, Burrows B. Responses to isoproterenol in a general population sample. Am Rev Respir Dis. 1978;118(5):855–861. | ||
Dales RE, Spitzer WO, Touisignant P, Schechter M, Suissa S. Clinical interpretation of airway response to a bronchodilator. Epidemiologic considerations. Am Rev Respir Dis. 1988;138(2):317–320. | ||
Kainu A, Lindqvist A, Sarna S, et al. FEV1 response to bronchodilatation in an adult urban population. Chest. 2008;134:387–393. | ||
Tan WC, Vollmer W, Lamprecht B, et al. Worldwide pattern of bronchodilator responsiveness: results from the burden of obstructive lung disease study. Thorax. 2012;67:718–726. | ||
Tan WC, Bourbeau J, Hernandez P, et al. Bronchodilator response and reported respiratory symptoms in an adult population. PLoS One. 2013;8:e58932. | ||
Cerveri I, Pellegrino R, Dore R, et al. Mechanisms for isolated volume response to a bronchodilator in patients with COPD. J Appl Physiol. 2000;88(6):1989–1995. | ||
Kainu A, Lindqvist A, Sarna S, Lundbäck B, Sovijärvi A. Responses of FEV6, FVC, and FET to inhaled bronchodilator in the adult general population. Respir Res. 2009;10:71. | ||
Gove RI, Shepherd J, Burge PS. Variability and reversibility of the slow and forced vital capacity in chronic airflow obstruction. Br J Dis Chest. 1987;81(2):182–185. | ||
Bergström G, Berglund G, Blomberg A, et al. The Swedish CArdioPulmonary BioImage Study (SCAPIS): objectives and design. J Int Med. 2015;278(6):645–659. | ||
Torén K, Olin A-C, Lindberg A, et al. Vital capacity and COPD: the Swedish CArdioPulmonary BioImage Study (SCAPIS). Int J Chron Obstruct Pulmon Dis. 2016;11:927–923. | ||
Miller MR, Hankinson J, Brusasco V, et al. Standardisation of spirometry. Eur Respir J. 2005;26(2):319–338. | ||
Brisman J, Kim J-L, Olin A-C, Torén K, Bake B. Spirometric reference equations in adults. Clin Physiol Funct Imag. 2016;92(7):914–921. | ||
Backman H, Lindberg A, Odén A, et al. Reference values for spirometry – report from the obstructive lung disease in Northern Sweden studies. Eur Clin Respir J. 2015;2:26375. | ||
Global Initiative for Chronic Obstructive Lung Disease. Available from: http://goldcopd.org/global-strategy-diagnosis-management-prevention-copd-2016. Accessed December 30, 2016. | ||
Torén K, Palmqvist M, Löwhagen O, Balder B, Tunsäter A. Accuracy of self-reported year of asthma-onset. J Clin Epidemiol. 2006;59:90–93. | ||
Murgia N, Brisman J, Claesson A, Muzi G, Olin AC, Torén K. Validity of a questionnaire-based diagnosis of chronic obstructive pulmonary disease in a general population study. BMC Pulm Med. 2014;14:49. | ||
Holm M, Torén K, Andersson E. Incidence of chronic bronchitis: a prospective study in a large general population. Int J Tuberc Lung Dis. 2014;18(7):870–875. | ||
Oksanen T, Kivimäki M, Pentti J, Virtanen M, Klaukka T, Vahtera J. Self-report as an indicator of incident disease. Ann Epidemiol. 2010;20(7):547–554. | ||
Hahn GJ, Meeker WQ. Statistical Intervals: A Guide for Practitioners. New York, NY: Wiley; 1991. | ||
Diedenhofen B, Musch J. cocor: A comprehensive solution for the statistical comparison of correlations. PLoS One. 2015;10(6):e0131499. | ||
Eliasson O, Degraff AC Jr. The use of criteria for reversibility and obstruction to define patient groups for bronchodilatator trials. Am Rev Respir Dis. 1985;132:858–864. | ||
Chhabra SK. Acute bronchodilator response has limited value in differentiating bronchial asthma from COPD. J Asthma. 2005;42(5):367–372. | ||
Dodge R, Cline MG, Burrows B. Comparisons of asthma, emphysema, and chronic bronchitis diagnoses in a general population sample. Am Rev Respir Dis. 1986;133(6):981–986. | ||
Torén K, Brisman J, Järvholm B. Asthma and asthma-like symptoms in adults assessed by questionnaires. Chest. 1993;104(2):600–608. | ||
Rönmark EP, Ekerljung L, Lötvall J, Torén K, Rönmark E, Lundbäck B. Large scale questionnaire survey on respiratory health in west Sweden: effects of late-response and non-response. Respir Med. 2009;103:1807–1815. |
 © 2017 The Author(s). This work is published and licensed by Dove Medical Press Limited. The full terms of this license are available at https://www.dovepress.com/terms.php and incorporate the Creative Commons Attribution - Non Commercial (unported, v3.0) License.
By accessing the work you hereby accept the Terms. Non-commercial uses of the work are permitted without any further permission from Dove Medical Press Limited, provided the work is properly attributed. For permission for commercial use of this work, please see paragraphs 4.2 and 5 of our Terms.
© 2017 The Author(s). This work is published and licensed by Dove Medical Press Limited. The full terms of this license are available at https://www.dovepress.com/terms.php and incorporate the Creative Commons Attribution - Non Commercial (unported, v3.0) License.
By accessing the work you hereby accept the Terms. Non-commercial uses of the work are permitted without any further permission from Dove Medical Press Limited, provided the work is properly attributed. For permission for commercial use of this work, please see paragraphs 4.2 and 5 of our Terms.