")
Back to Journals » International Journal of General Medicine » Volume 16
MARCKS is a New Prognostic Biomarker in Hepatocellular Carcinoma
Authors Lu H, Zhao R, Qin Q, Tang L, Ma G, He B, Liang J, Wei L, Wang X, Bie Q, Wang X , Zhang B
Received 22 February 2023
Accepted for publication 17 April 2023
Published 1 May 2023 Volume 2023:16 Pages 1603—1619
DOI https://doi.org/10.2147/IJGM.S408651
Checked for plagiarism Yes
Review by Single anonymous peer review
Peer reviewer comments 2
Editor who approved publication: Dr Scott Fraser
Haoran Lu,1,* Rou Zhao,2,* Qianqian Qin,3 Liyong Tang,1 Guodong Ma,1 Baoyu He,2 Jing Liang,2 Li Wei,2 Xutong Wang,2 Qingli Bie,2 Xuning Wang,4 Bin Zhang2,5
1Department of Hepatobiliary Surgery, Affiliated Hospital of Jining Medical University, Jining Medical University, Jining, Shandong, People’s Republic of China; 2Department of Laboratory Medicine, Affiliated Hospital of Jining Medical University, Jining Medical University, Jining, Shandong, People’s Republic of China; 3Department of Reproductive Medicine, Affiliated Hospital of Jining Medical University, Jining Medical University, Jining, Shandong, People’s Republic of China; 4Department of General Surgery, The Air Force Hospital of Northern Theater PLA, Liaoning, People’s Republic of China; 5Institute of Forensic Medicine and Laboratory Medicine, Jining Medical University, Jining, Shandong, People’s Republic of China
*These authors contributed equally to this work
Correspondence: Bin Zhang, Department of Laboratory Medicine, Affiliated Hospital of Jining Medical University, Jining Medical University, Jining, People’s Republic of China, Tel +86 186 0647 3594, Fax +86 537 2213030, Email [email protected]
Background: Hepatocellular carcinoma (HCC) is one of the most common type of cancers, but there is still a lack of known biomarkers for the effective diagnosis or prognosis of HCC. Myristoylated alanine-rich C-kinase substrate (MARCKS) is a substrate of protein kinase C, which was located in the cell plasma membrane. The purpose of our study was to evaluate the role of MARCKS in HCC.
Methods: The role of MARCKS in HCC was explored by bioinformatics and experiment.
Results: We demonstrated that MARCKS expression was significantly elevated in HCC datasets of TCGA. MARCKS was up-regulated in tumor sample in HCC. Functional enrichment indicated that MARCKS-related differentially expressed genes (DEGs) were mainly enriched in cell junction tissue, response to growth factors and cell population proliferation. Tumor and ECM-receptor interactions related pathways were enriched by the KEGG. MARCKS expression in HCC patients was higher in females, younger individuals, and those at worse clinical stages. Cox regression analysis showed that MARCKS expression was a risk factor for overall survival and disease-specific survival of patients.
Conclusion: MARCKS was up-regulated in HCC, may play a crucial role in HCCs, and has prognostic value for clinical outcomes.
Keywords: myristoylated alanine-rich C-kinase substrate, HCC, TCGA, prognostic value
Introduction
Hepatocellular carcinoma (HCC) is the most common type of liver cancer, accounting for approximately 90% of all primary liver cancers.1,2 The morbidity and mortality of HCC are on the rise worldwide, and it is the fourth leading cause of cancer-related death around the world.3,4 Since HCC patients are usually in the advanced stage when first diagnosed and their tumors develop rapidly, only 5–15% of patients are eligible for surgical treatment. Despite advances toward early diagnosis and multidisciplinary treatment of cancer, the long-term prognosis of HCC patients remains poor. Therefore, it is necessary to identify new molecular markers for the early diagnosis of HCC. Currently, commonly used marker genes known marker genes for diagnosis of HCC include AFP,5 AFP-L36 and Des-γ-carboxy prothrombin.7 In addition, novel markers including ring finger related genes,8 PSME4,9 CCT7,10 LINC01234,11 PPP1R26,12 and miR-10b-5p13 in exosomes have also been demonstrated for diagnosis of HCC.
Myristoylated alanine-rich C-kinase substrate (MARCKS) is a member of a ubiquitous, highly conserved membrane-associated protein family. Wu et al discovered MARCKS served as a substrate for calcium/phospholipid-dependent phosphorylation of PKC in 1982 and first described it as the “87k protein” in the nerve endings of the rat cerebral cortex.14 MARCKS is involved in the structural regulation of the actin cytoskeleton, cell motility, adhesion, etc.15 MARCKS was up-regulated several cancers, such as ovarian,16 breast17 and lung cancer.18 Recent findings suggested that phospho-MARCKS is a novel NF-kB activator that promotes smoke-mediated lung cancer progression.18 MARCKS promotes drug resistance in multiple myeloma and pancreatic cancer cells.19,20 However, MARCKS has also been shown to inhibit tumor development. Eustace et al demonstrated that MARCKS ED peptide therapeutics may overcome traditional GBM resistance mechanisms. MARCKS is overexpressed in HCC,21 and MARCKS on tumor-associated fibroblasts (TAMs) is related to poor HCC prognosis and immune cell infiltration.22 This suggests that MARCKS expression may play a role in HCC tumorigenesis. However, the potential role and underlying mechanism of MARCKS expression in HCC remain unclear.
In this study, we explored that MARCKS expression was in HCC tissues than in adjacent normal tissues by analyzing data from HCC patients in TCGA and validated the results in our samples. Gene Ontology (GO) and Kyoto Encyclopedia of Genes and Genomes (KEGG) analyses showed the possible mechanism of MARCKS expression in the occurrence and development of HCC. We also analyzed the correlation between MARCKS expression and clinicopathological characteristics of HCC. Finally, the diagnostic and prognostic value of MARCKS expression in HCC were determined.
Materials and Methods
Data Collection
MARCKS mRNA expression and clinical data from 374 LIHC and 50 normal control samples were obtained from TCGA-LIHC and cBioportal for Cancer Genomics.23,24
Human Hepatocellular Carcinoma Clinical Specimens and Ethics Statement
Primary hepatocellular carcinoma cancer tissues and pairs of adjacent non-cancerous tissues (ie, tissues more than 1 cm from the original site) were collected from hepatocellular carcinoma patients undergoing surgery in the Affiliated Hospital of Jining Medical University. We obtained 8 matched patient tissue specimens. All cancer tissue samples were confirmed by histopathology to have hepatocellular carcinoma. Figure S1 showed a representative pathological picture of liver cancer. Figure S2 showed the immunohistochemistry of MARCKS from Human Protein Atlas. The study complies with the principles outlined in the Declaration of Helsinki and was conducted in accordance with approved guidelines. Before collecting tissue samples, written informed consent was obtained from each participant. All samples were obtained in accordance with the regulations and approval of the Medical Ethics Committee of Affiliated Hospital of Jining Medical University (Ethical approval number: 2022C217).
RNA Extraction and Real-Time RT-PCR (mRNA)
RNA isolater (Vazyme Biotech co., Ltd.) was used to extract total RNA from cells and tissues. Real-time RT-PCR was employed to determine the expression of MARCKS. The cDNAs were synthesized according to the manufacturer’s instructions (Vazyme Biotech co., Ltd.). Real-time quantitative RT-PCR (qRT-PCR) was conducted with the ChamQ Universal SYBR qPCR Master Mix (Vazyme Biotech co., Ltd). β-actin was used as an internal control. The primers were as following: β-actin (Forward- GACCTGTACGCCAACACAGT; Reverse- CTCAGGAGGAGCA ATGATCT), MARCKS (Forward- CCAACCCGAGGCTCTTTGTT; Reverse- CACGTGGCCAT TCTCCTGTC).
Differentially Expressed Genes of MARCKS
The 347 patients were divided into high and low MARCKS expression groups according to their median MARCKS values. The R package “DESeq2” was applied to calculate the differentially expressed genes between the two groups (FC >1.5, P value <0.05).25 The “pheatmap” and “EnhancedVolcano” R packages were used to draw heatmaps and volcano maps of differentially expressed genes, respectively.
Functional Annotation of MARCKS-Associated Differentially Expressed Genes in HCC
The DEGs were functionally annotated in the Metascape database (count >3, enrichment factor >1.5, adjusted P < 0.01).26 DEG gene set enrichment analysis (GSEA)27 was performed by the R package “cluster Profiler”28 The reference gene set was a selected gene set of the MSigDB collection, with a total of 796 clusters (FDR <0.25, P < 0.05). STRING29 was used to analyse DEGs to obtain a protein–protein interaction (PPI) network, which is visualized using Cytoscape30 (v3.7.1).
Association of MARCKS and Immune Cell Infiltration in HCC
The R package “GSVA”31 was used to analyse the infiltration and enrichment of 24 common immune cells and calculate the Spearman coefficient to evaluate the relationship between MARCKS expression and immune cell infiltration. The Wilcoxon rank sum test was used to compare the level of immune cell infiltration in the high MARCKS expression group and the low MARCKS expression group.
Analysis of the Correlation Between MARCKS Expression and Clinicopathological Characteristics of HCC Patients
Association of clinicopathological features with MARCKS expression was analyzed by the Wilcoxon rank-sum test and the Pearson chi-square test. Correlation between MARCKS expression and the clinicopathological features was analyzed by Logistic regression.
Clinical Significance of MARCKS Expression in HCC
ROC was used to analyze the predictive value of MARCKS for the diagnosis of HCC. Prognostic analysis was performed by using univariate Kaplan–Meier (K-M) analysis and multivariate Cox regression analysis. Random forest regression was analyzed by the R package “randomForest”.32 Line graphs and calibration graphs was created by R packages “rms”.33 The R package “forestplot” was used to analyze the clinicopathological subgroups.34 p < 0.05 was considered to be significant.
Results
Expression Profiles of MARCKS in Different Cancers and MARCKS Related Differentially Expressed Genes in Hepatocellular Carcinomas
We detected the expression of MARCKS in tumours and adjacent normal tissues in TCGA. As shown in Figure 1A, MARCKS was significantly overexpressed in 31 cancers, indicating that MARCKS is generally highly expressed in tumour tissues. More specifically, the expression of MARCKS in hepatocellular carcinoma was significantly higher than that in adjacent normal tissues (P < 0.001, Figure 1B). The overexpression of MARCKS was also verified in HCC patient tissues (Figure 1C).
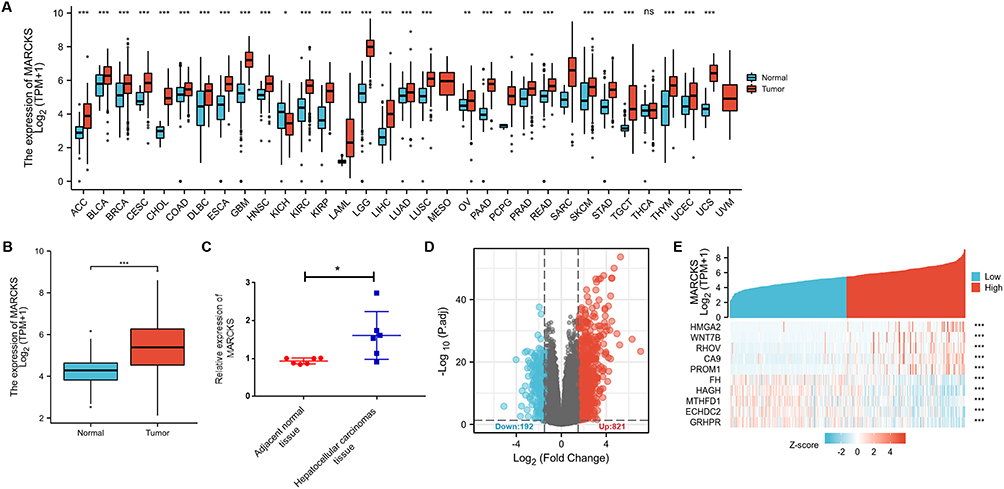 |
Figure 1 Differential mRNA expression profiles in hepatocellular carcinomas (HCCs) patients stratified by MARCKS levels. (A) The expression of MARCKS in different tumor types and pericancerous tissues was compared based on TCGA database. (B) The expression of MARCKS in hepatocellular carcinoma was higher than that in pericancerous tissues. (C) qPCR was used to detect the expression of MARCKS in 8 groups of HCCs and adjacent normal tissues. The high- and low- MARCKS DEGs expression groups were shown by volcano plots (D). The represented DEGs are presented with heatmaps (E). ns, P ≥ 0.05; *P < 0.05; **P < 0.01; ***P < 0.001. |
According to the median MARCKS expression in HCC, 374 patients were divided into two groups, high- and low-MARCKS expression groups. We calculated differences in mRNA expression between the two groups. A total of 1013 mRNAs were identified (821 upregulated and 192 downregulated with HCC, Figure 1C) as DEGs (differentially expressed genes). The represented DEGs are presented with heatmaps (Figure 1D). The represented DEGs are presented with heatmaps (Figure 1E).
Functional Annotation of MARCKS-Associated DEGs in Hepatocellular Carcinomas
“Metascape” was used to explore the functions of MARCKS-related DEGs in HCC patients. As shown in Figure 2A–C, we found that DEGs were enriched in several hepatocellular carcinoma-related functions, including cell junction organization (GO: 0034330, P < 0.001, enrichment factor = 2.5, FDR = 0.037), response to growth factor (GO: 0070848, P < 0.001, enrichment factor = 2.3, FDR = 0.141), and cell population proliferation (GO: 0008285, P < 0.001, enrichment factor = 2.2, FDR = 0.266). In addition, GSEA showed that MARCKS-associated DEGs were significantly enriched in tumour-related pathways (Figures 2D–K), such as the PI3K-AKT signalling pathway (P.adjusted = 0.040, FDR = 0.031), Hippo-Merlin signalling pathway (P.adjusted = 0.040, FDR = 0.031), and WNT signalling pathway in HCC patients (P.adjusted = 0.040, FDR = 0.031), MARCKS-associated DEGs were also enriched in the extracellular matrix and T cell receptor signalling pathways.
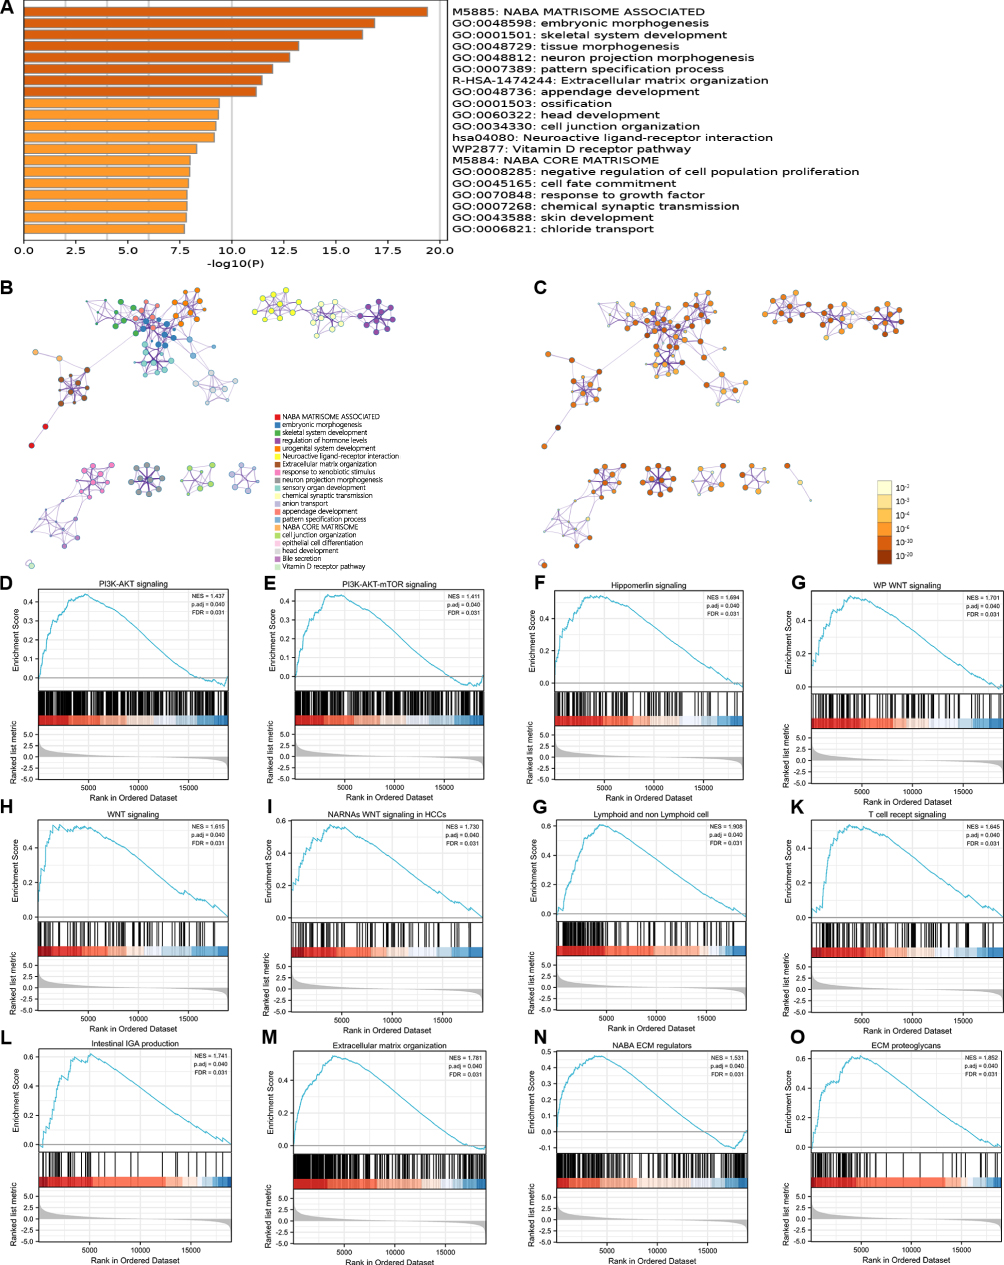 |
Figure 2 Functional annotation of differentially expressed genes (DEGs) in hepatocellular carcinomas (HCCs) patients with distinct MARCKS levels. (A) Enrichment pathway of MARCKS-related DEGs in Metascape. (B) Representative terms were present in a network layout, such as NABA MATRISOME ASSOCIATED, embryonic morphogenesis. (C) The same enrichment network presents nodes colored by the P-value. (D–O) Enrichment analysis of representative gene sets of MARCKS-related DEGs. |
Correlation Between MARCKS Expression and Immune Cell Infiltration in Hepatocellular Carcinomas
Association between MARCKS and the infiltration of 24 immune cell types in HCC was analyzed. The results are displayed in Figure 3A. Infiltration of Th2 cells (R = 0.474, P < 0.001), Tfh cells (R = 0.473, P < 0.001), T helper cells (R2 = 0.419, P < 0.001), macrophages (R2 = 0.412, P < 0.001), Th1 cells (R2 = 0.371, P < 0.001), T cells (R2 = 0.331, P < 0.001), IDCs (R2 = 0.329, P < 0.001), NK CD56+ cells (R2 = 0.327, P < 0.001), B cells (R2 = 0.277, P < 0.001), TEM cells (R2 = 0.261, P < 0.001) and aDCs (R2 = 0.235, P < 0.001) were positively correlated with MARCKS expression. However, Th17 cells (R2 = −0.292, P < 0.001) were negatively correlated with MARCKS expression. Furthermore, we evaluated the infiltration levels of the 12 most relevant immune cells – Th2 cells (Figure 3B), Tfh cells (Figure 3C), T helper cells (Figure 3D), macrophages (Figure 3E), Th1 cells (Figure 3F), T cells (Figure 3G), IDCs (Figure 3H), NK CD56+ cells (Figure 3I), B cells (Figure 3J), TEM cells (Figure 3K), ADCs (Figure 3L) and Th17 cells (Figure 3M) in the two MARCKS expression groups with HCC, and the results are consistent with Figure 3A.
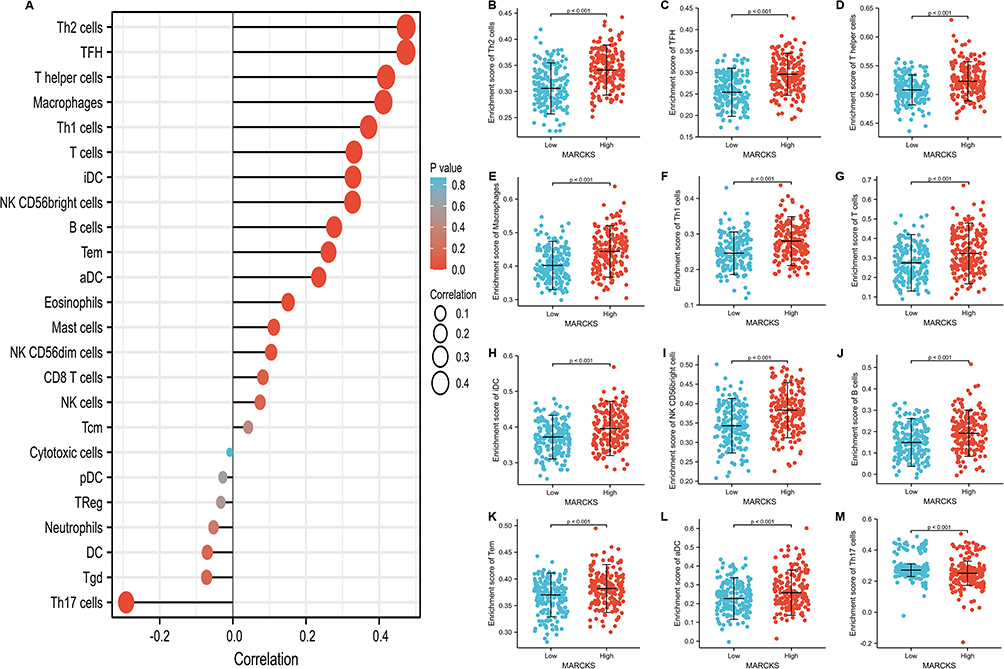 |
Figure 3 Correlation of immune cell infiltration and MARCKS expression in hepatocellular carcinomas (HCC) patients. (A) Spearman analysis was used to explore the correlation between the infiltration level of 24 immune cells and the expression of MARCKS. Compare the Th2 (B), TFH (C), T helper (D), macrophages (E), Th1 (F), T (G), iDC (H), NK CD56+ (I), B (J), Tem (K), aDC (L) and Th17 (M) cells infiltration levels between the high and low MARCKS expression groups. |
Association of MARCKS Expression and Clinicopathological Characteristics in Hepatocellular Carcinomas
We explored the clinicopathological factors of HCC patients in the different MARCKS expression groups. Compared with the low-MARCKS group, the high-MARCKS group had a high proportion, high AFP level, and were young, at advanced pathologic stages, advanced histologic grade and more severe T stages. However, there were no significant differences between the two groups in terms of race, sex, clinical N and M stage distribution, or residual tumours (Table 1).
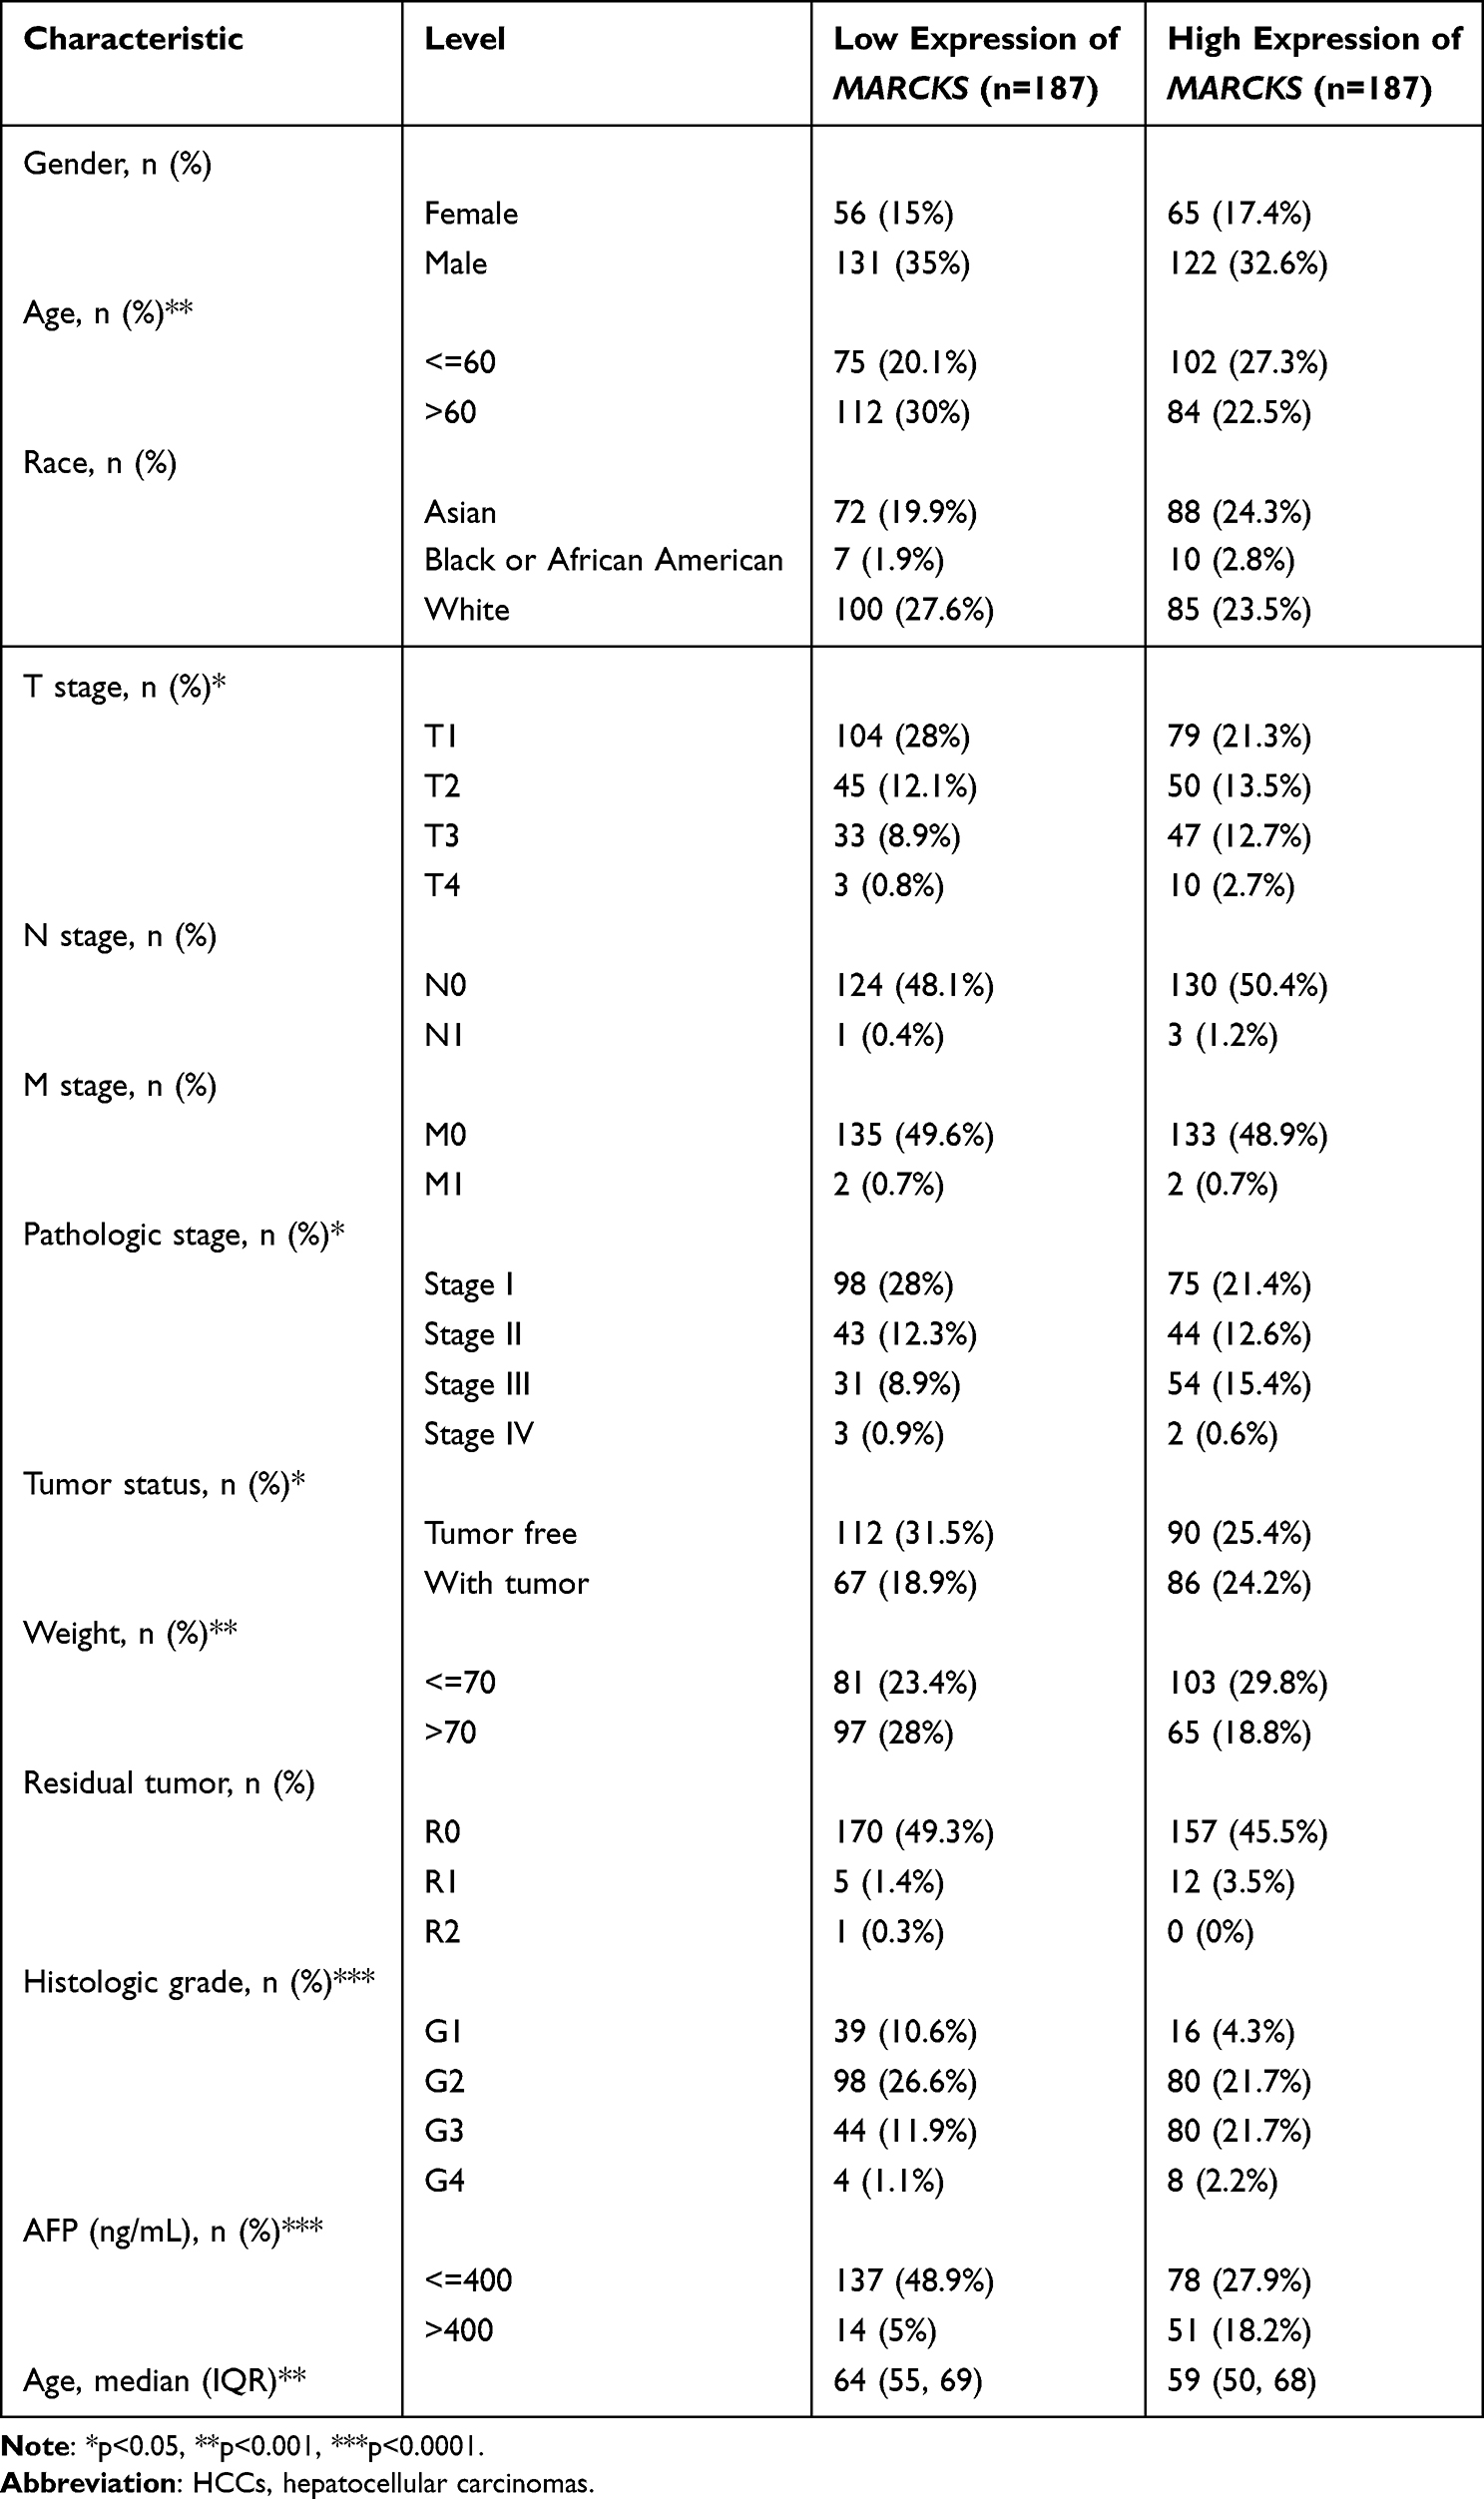 |
Table 1 Clinicopathological Characteristics of HCCs Patients with Differential MARCKS Expression |
In addition, we analysed MARCKS expression in HCC patients with different clinicopathological characteristics. MARCKS was highly expressed in patients with body weights less than 70 kg (Figure 4A) and ages less than 60 years (Figure 4B), as well as in patients with AFP abnormalities (Figure 4C), tumor status (Figure 4D), and patients at pathological stages III and IV (Figure 4E), histologic stages G3 and G4 (Figure 4F), and T stages T3 and T4 (Figure 4G), and liver fibrosis (Figure 4H). We used Logistic regression model to analyze the correlation between MARCKS expression and the clinicopathological characteristics. The results are provided in Table 2. The expression of MARCKS was significantly positively correlated with clinical stage (including T stage and tissue stage) and AFP concentration. It was negatively correlated with age and weight.
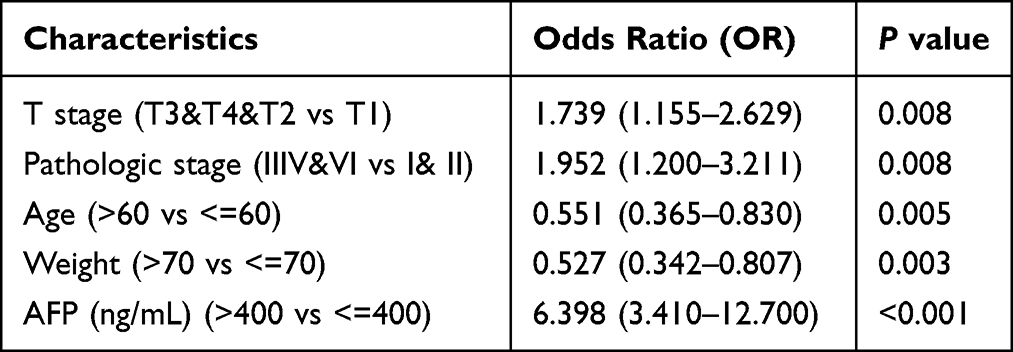 |
Table 2 Logistic Regression Analysis of Association Between Clinicopathological Characteristics and MARCKS Expression in HCCs Patients |
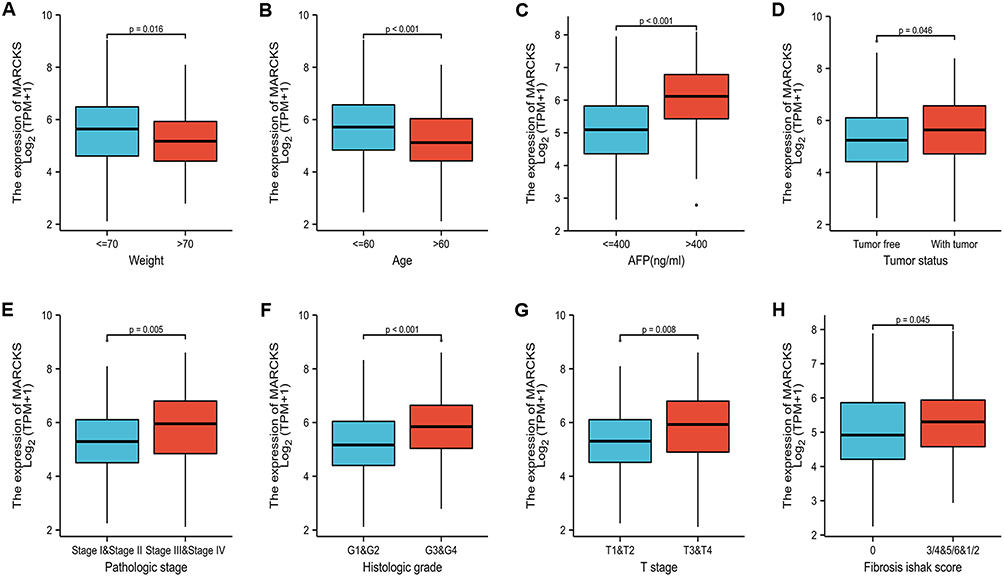 |
Figure 4 MARCKS expression is associated with clinicopathological characteristics in hepatocellular carcinoma (HCCs) patients. The Wilcoxon rank sum test was applied to analyze the association of MARCKS expression with weight (A), age (B), AFP level (C), tumor status (D), pathologic stage (E), Histologic grade (F), clinical T stage (G), and fibrosis ishak score (H). |
The Predictive Value of MARCKS in the Diagnosis and Prognosis of Hepatocellular Carcinoma
We used the ROC curve to evaluate the value of MARCKS expression for the diagnosis of HCC. The results showed that MARCKS has high sensitivity and specificity in the diagnosis of HCC (AUC = 0.807, Figure 5A). K-M analysis showed that patients with high MARCKS expression had lower survival probabilities (Figure 5B–D). The above analyses prove that MARCKS expression has potential as a diagnostic and prognostic indicator of HCC.
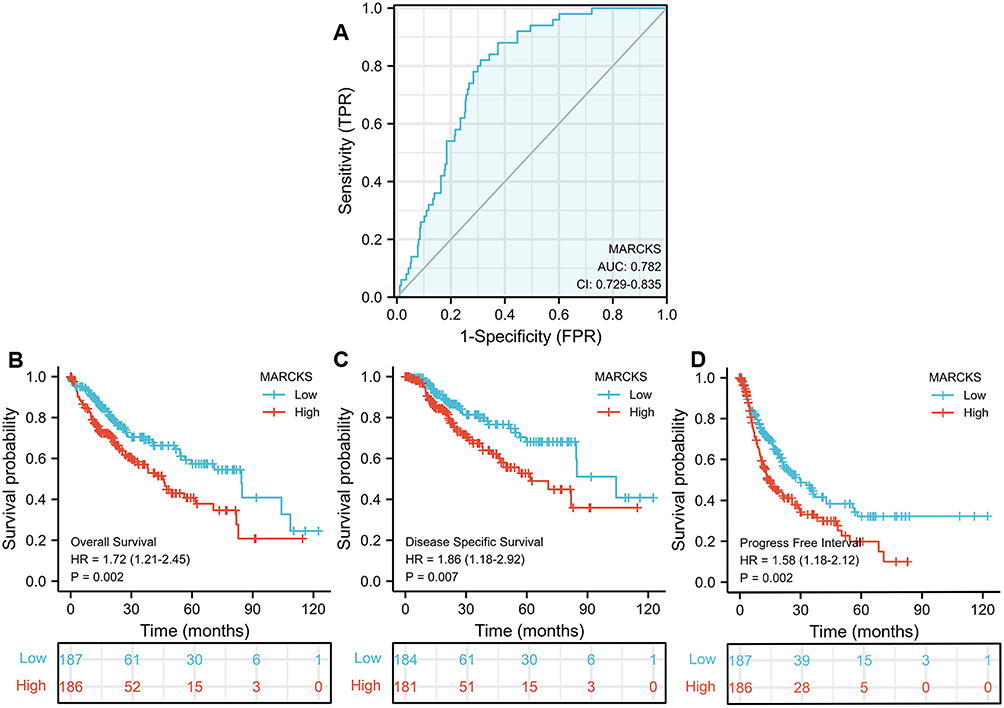 |
Figure 5 The predictive value of MARCKS in the diagnosis and clinical outcome of patients with hepatocellular carcinomas (HCCs). (A) ROC curve analysis evaluating the performance of MARCKS for HCCs diagnosis. Kaplan–Meier analysis compares the differences in overall survival (OS) (B), progression-free survival (PFS) (C), and disease-specific survival (DSS) (D) between the high and low MARCKS expression groups. |
The predictive value of MARCKS expression for clinical outcomes was evaluated by multivariate COX regression model. The results are shown in Table 3. MARCKS was an independent risk factor for overall survival (HR: 2.038, P < 0.01) and disease-specific survival (HR: 2.140, P < 0.05). More importantly, clinical stage, especially T stage, M stage and pathological stage, showed predictive advantages.
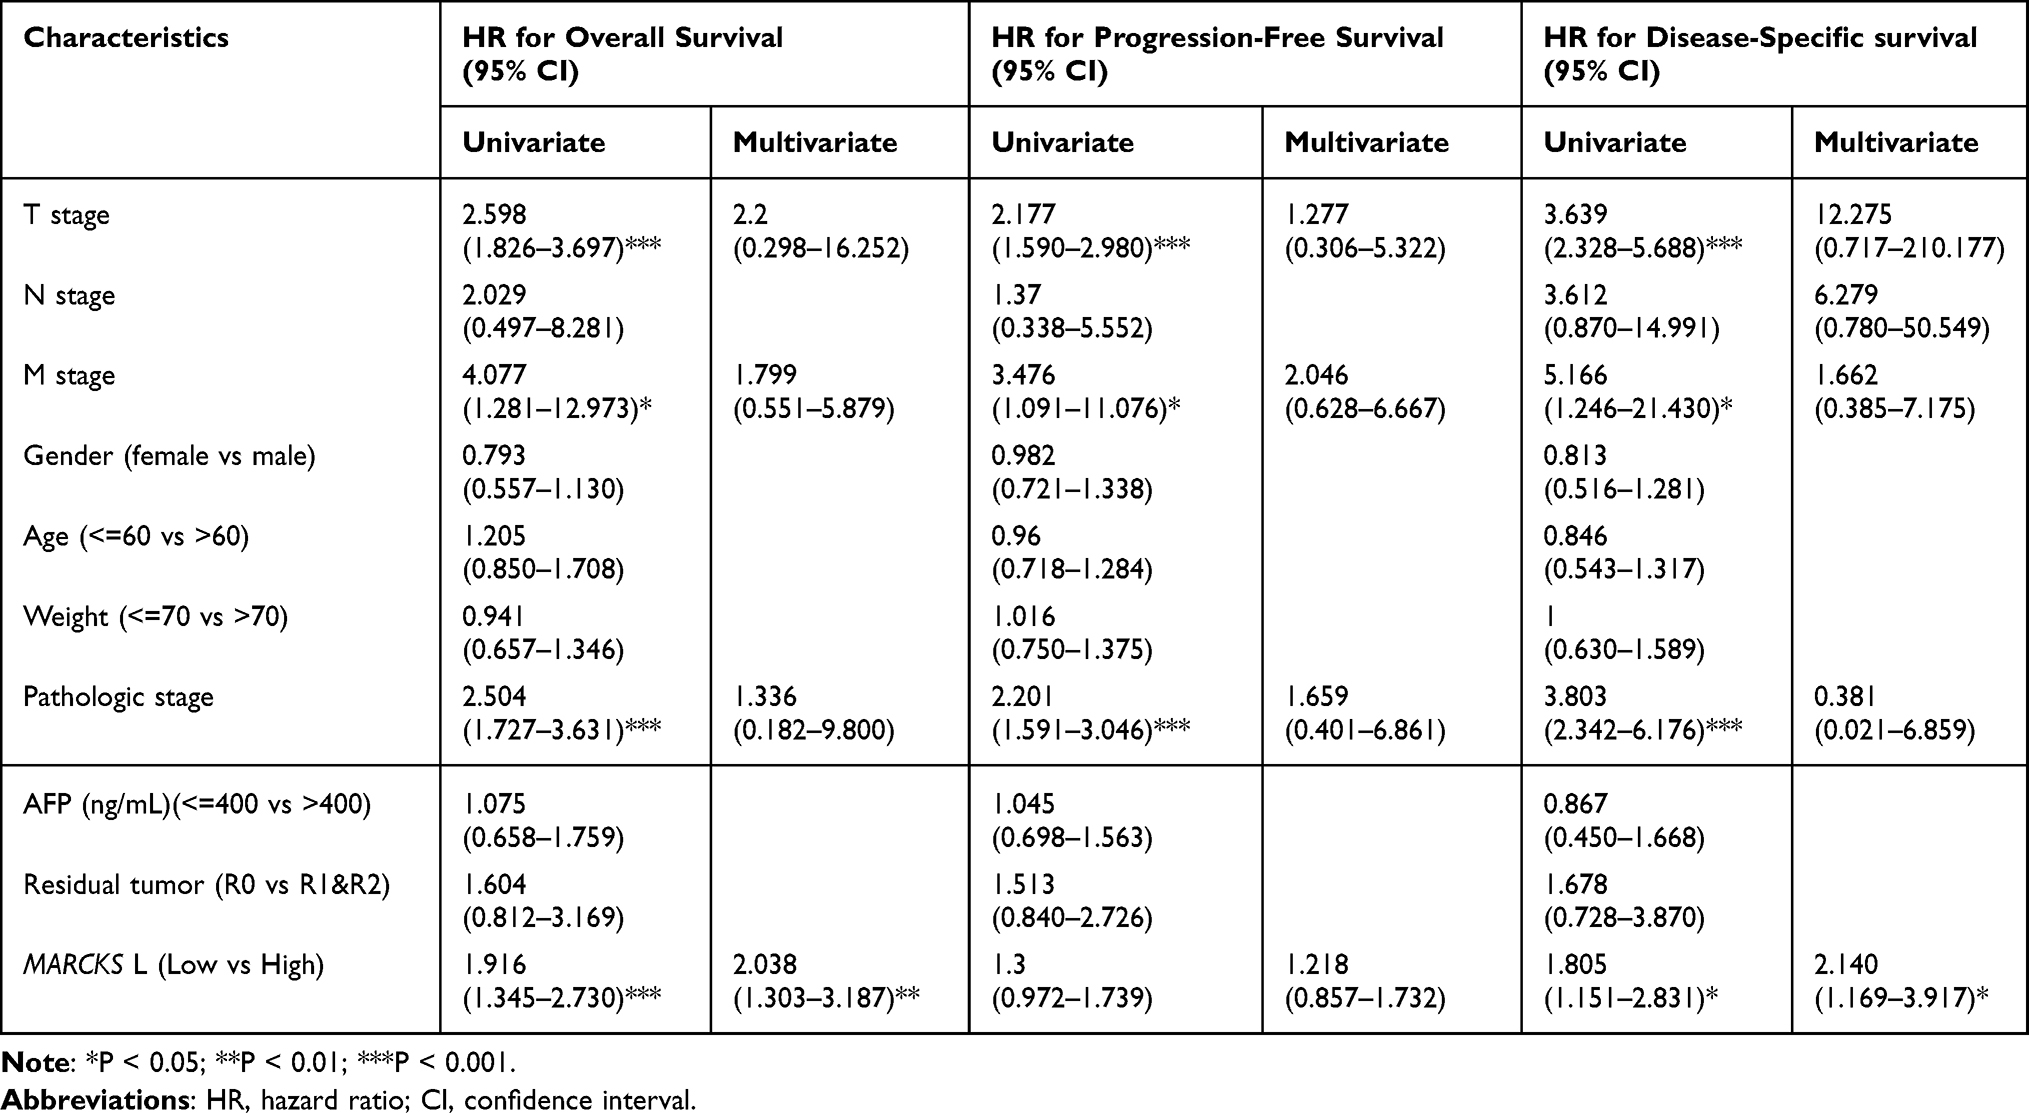 |
Table 3 Cox Regression Analysis for Clinical Outcomes in HCCs Patients |
Next, the statistically significant prognostic factors from the multivariate Cox regression analysis were applied to construct a prognostic nomogram. The calibration curves were drawn to test the validity of the nomogram. Stages of T and M and MARCKS expression were included in the overall survival prediction model nomogram with a C-index of 0.663 (Figure 6A). Clinical stages of T, M and MARCKS expression were incorporated into the progression-free prediction model of nomogram with a C-index of 0.632 (Figure 6C). Clinical stages T and M and MARCKS expression were used to construct a predictive nomogram of disease-specific survival with a C-index of 0.717 (Figure 6E). With the exception of the slightly underestimated prediction of 1-year overall survival, the calibration curves provided good prediction value for all three types of nomograms of clinical outcomes at 1, 3, and 5 years (Figure 6B, D and F).
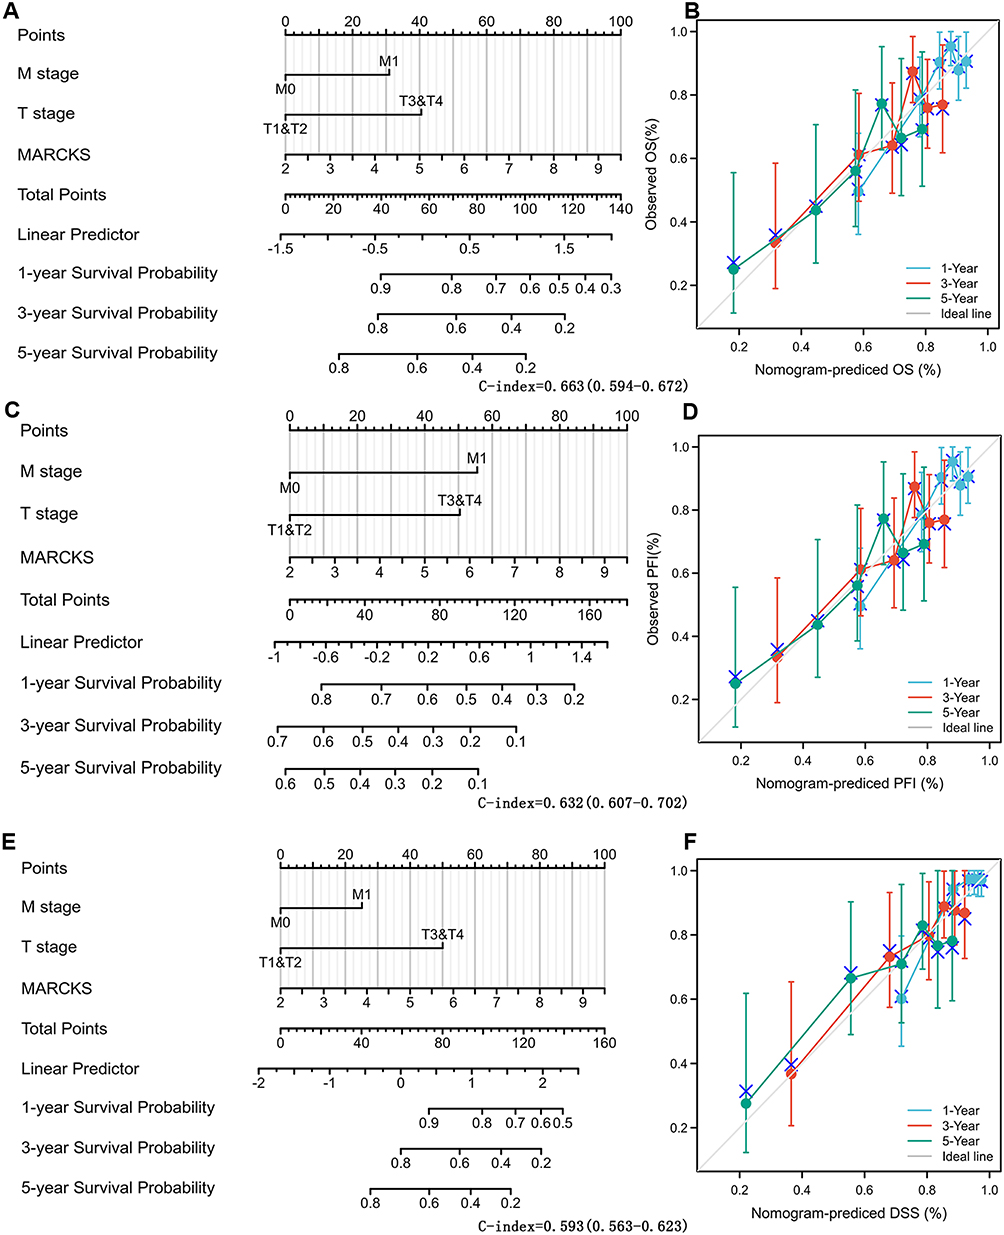 |
Figure 6 Construction and validation of nomograms based on MARCKS expression. A nomogram constructed based on the risk score model of MARCKS expression was established for 1, 3, and 5 years overall survival (A), progression-free survival (C), and disease-specific survival (E). The calibration chart verifies the efficiency of the nomogram for overall survival (B), progression-free survival (D), and disease-specific survival (F). |
Prognostic Performance of MARCKS in Hepatocellular Carcinomas Clinicopathological Subgroups
Cox regression analysis was performed in the clinicopathological subgroup (Table 4 and Figure 7). MARCKS was an important risk factor for overall survival in female patients (HR = 2.82, P = 0.001, Figure 7A), patients at clinical stages III–IV (HR = 2.25, P = 0.019) and clinical T stages T3 and T4 (HR = 2.15, P = 0.008), and patients that weighed less than 70 kg (HR = 2.25, P = 0.003). The same analysis was performed for the progression-free interval (Figure 7B) and disease-specific survival (Figure 7C). Kaplan–Meier analyses were conducted for clinical outcomes in six representative subgroups: females, ages, patients at clinical stages III–IV, patients at T stages T3 and T4, patients at N stage N0, and patients at M stage M0 (Figure 8). The above results show that the clinical performance of patients with high MARCKS expression is significantly worse.
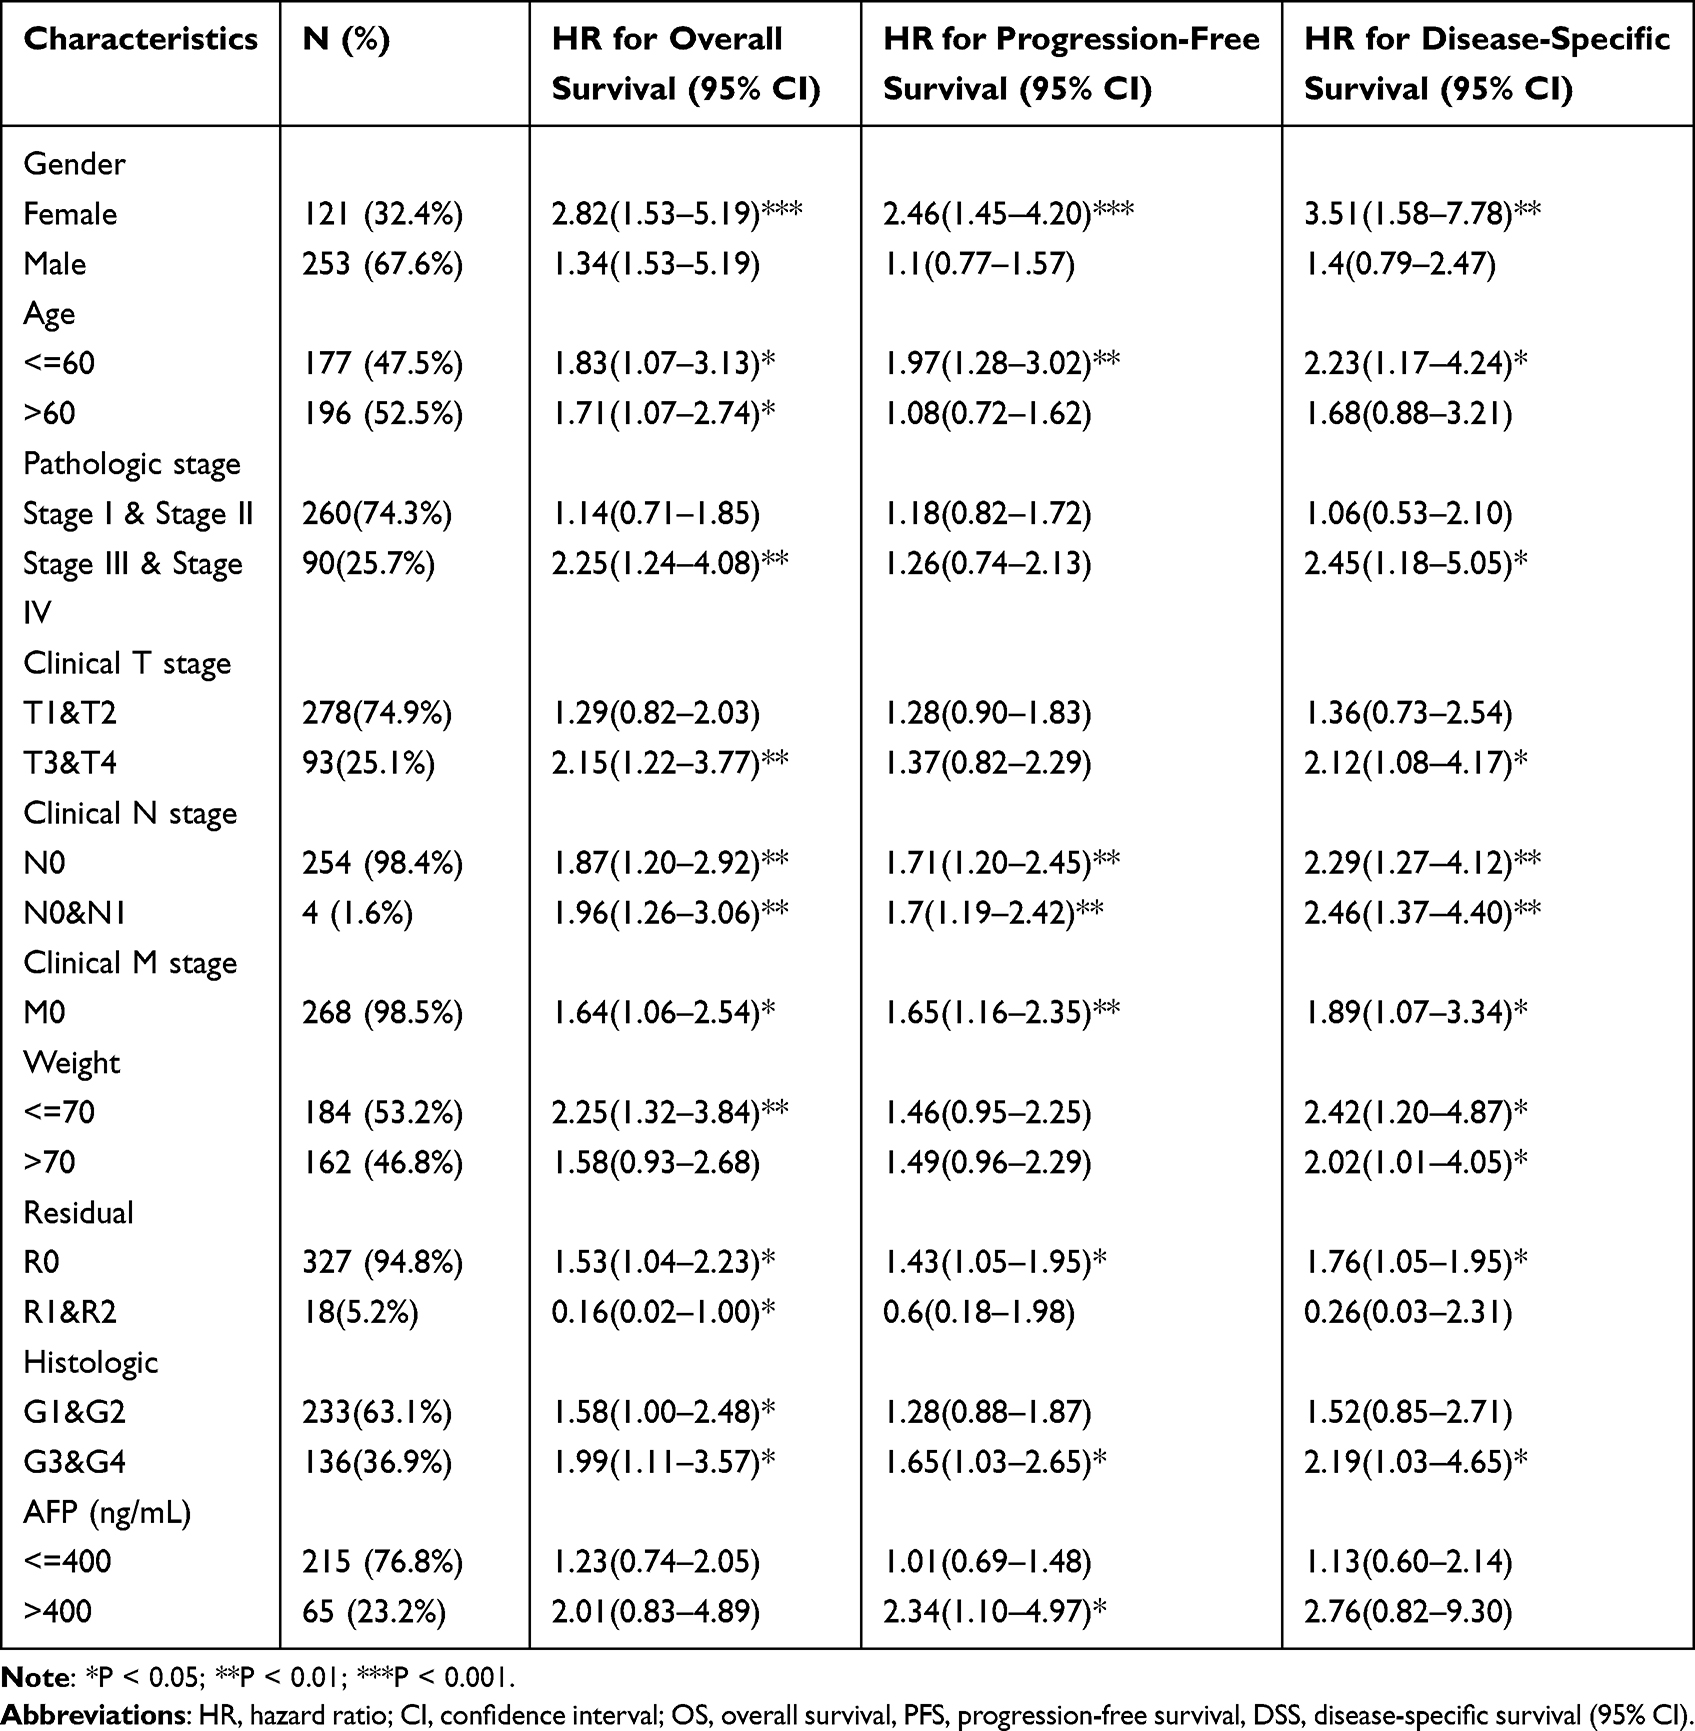 |
Table 4 Prognostic Performance of MARCKS on Clinical Outcomes (OS, PFS and DSS) in HCCs Patient Subgroups by Cox Regression Analysis |
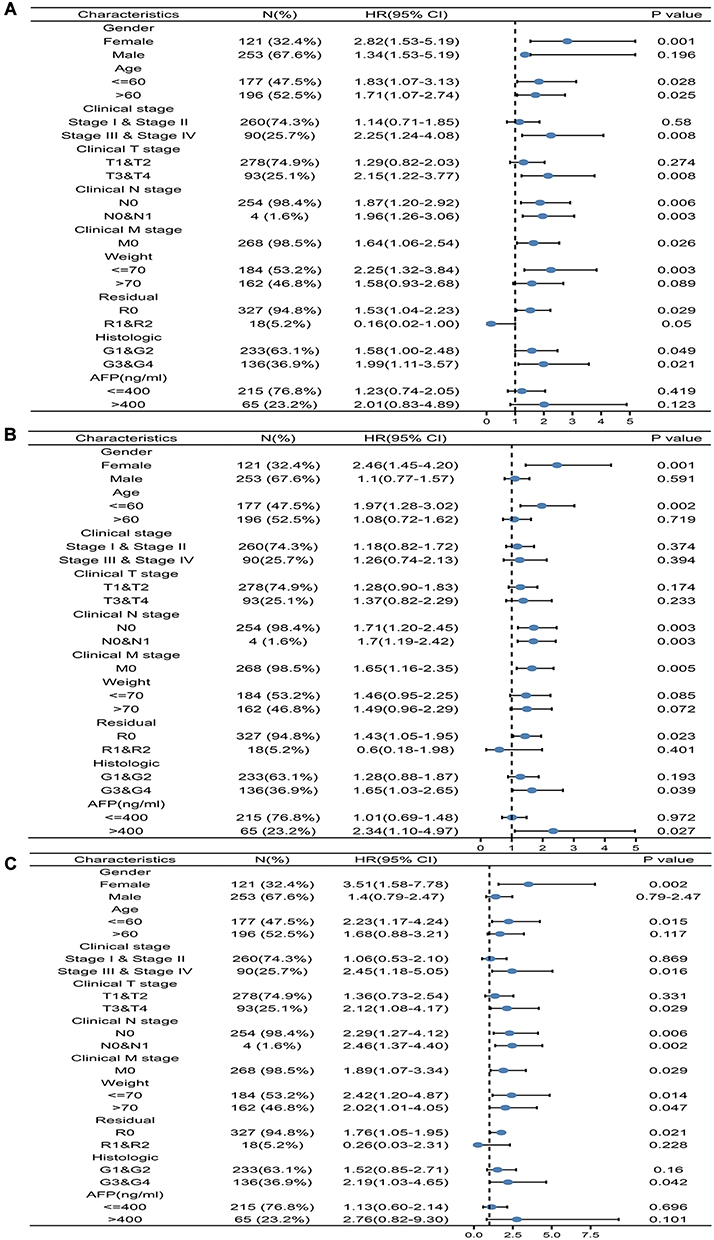 |
Figure 7 Prognostic performance of MARCKS on clinical outcomes in different HCCs patient subgroups. According to the clinicopathological characteristics of HCC patients, they are divided into different subgroups. Cox regression was used to evaluate the prognostic performance of MARCKS for each subgroup overall survival (A), progression-free survival (B) and disease-specific survival (C), and the results were expressed as a hazard ratio. The bar represents the 95% confidence interval of the hazard ratio, and the size of the diamond represents the significance of MARCKS performance. |
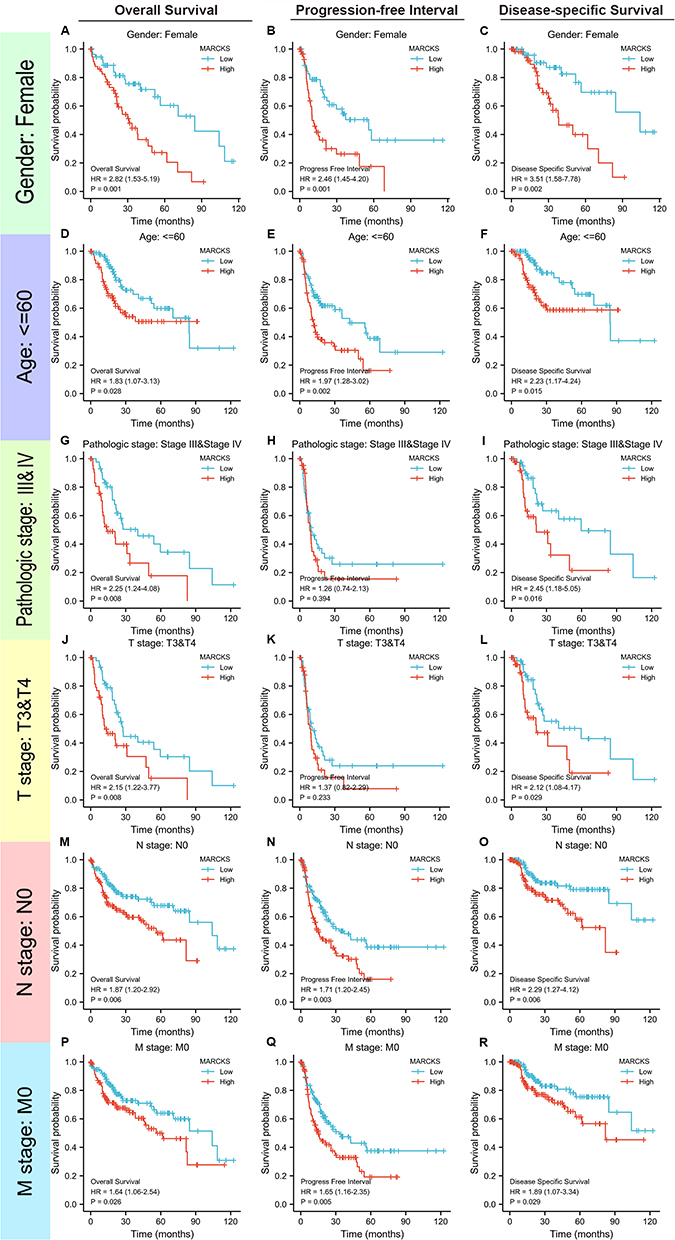 |
Figure 8 Distinct clinical outcomes based on MARCKS expression in hepatocellular carcinomas (HCCs) patient subgroups. Kaplan–Meier analysis showing the comparison of overall survival (A, D, G, J, M and P), progression-free survival (B, E, H, K, N and Q), and disease-specific survival (C, F, I, L, O and R) between high- and low-MARCKS expression groups in several HCCs patient subgroups, including male gender (A–C), age below 60 years (D–F), pathologic stage II–IV (G–I), T stages T1–T2 (J–L), N stage (M–O) and M stage (P–R). |
Discussion
We performed bioinformatics analyses that integrated HCC patient data in TCGA and grouping them based on MARCKS expression levels. According to the analysis of MARCKS expression and clinical correlations, MARCKS expression was significantly different in HCC and adjacent tissues, and the expression of MARCKS was significantly related to the sex, age and clinical stage of HCC patients. We also prove that MARCKS has potential as a prognostic and diagnostic indicator for HCC patients.
MARCKS is critical in a variety of solid cancers.35 In our study, we confirmed the expression of MARCKS in HCC was upregulated. High expression of MARCKS showed clinical significance and was associated with poor survival in HCC patients. These results suggested that MARCKS is a potential therapeutic target in HCC. Functional enrichment of MARCKS was directly related to many cellular biology processes, including cytoskeletal reorganization, cellular secretion, inflammatory responses, etc.22 Recent studies reveal that MARCKS is closely related to autophagy.36 In our functional annotation of MARCKS-associated DEGs, we found that extracellular matrix organization and cell junction organization were closely associated with MARCKS expression. However, more studies are needed to fully understand the mechanisms underlying MARCKS overexpression in HCC. Previous studies have shown that inhibition of MARCKS inactivates the P3K/AKT pathway,37 WNT5A can induce the activation of MARCKS,38 and phospho-MARCKS is a novel NF-kB activator.18 GSEA found that MARCKS is closely related to the Hippo-Merlin pathway, which has not been confirmed. Hippo-Merlin has been shown to be associated with poor prognosis in HCC,39 and our results confirmed that high expression of MARCKS leads to worse prognosis in HCC patients. The mechanism of MARCKS and Hippo-Merlin in poor prognosis of HCC requires further research.
The infiltration of immune cells is closely related to tumour development and prognosis.40 Our results found that MARCKS expression is positively correlated with the infiltration of Th2 and Tfh cells. Increasing evidence supports the association of Th2 cells with the tumour microenvironment, and Th2 cells have been proven to promote tumour growth.41–43 We hypothesize that MARCKS expression may mediate the development of liver cancer by promoting the Th2-type inflammatory response. However, MARCKS expression was negatively correlated with Th17 cells. The relative contribution of Th17 cells to tumorigenesis is usually associated with chronic inflammation. Although current evidence regarding the role of Th17 cells in cancer is conflicting, excessive inflammation of Th17 cells may lead to cancer. Therefore, the ability of MARCKS to regulate the tumour immune microenvironment requires further research.
At present, the classic markers for the diagnosis of HCC include AFP, AFP-L3, and DCP. AFP has low sensitivity (41–65%) and specificity (80–94%). The diagnostic specificity of DCP is better than that of AFP and AFP-L3, but it cannot be used for early HCC.44 Currently, there is a lack of HCC prognostic and diagnostic markers. Our results indicate that MARCKS expression can be used as a prognostic and diagnostic marker for HCC. The ROC curve for MARCKS expression discrimination of HCC diagnosis had an AUC of 0.782, strongly suggesting that MARCKS expression is a convincing biomarker for HCC diagnosis. High expression of MARCKS was associated with poor survival. In addition, we demonstrated that MARCKS expression is higher in female patients, younger patients, and patients with advanced histological stages, and worse clinical stage pathological features. Moreover, our results indicated that MARCKS having greater prognostic value in female patients, patients at clinical stages III–IV and clinical T stages T3 and T4, and patients that weighed less than 70 kg. Therefore, the upregulation and predictive performance of MARCKS expression suggests that it may represent a prognostic biomarker for HCC.
We revealed a potential mechanism of MARCKS on HCC tumorigenesis and illustrated its predictive value in HCC clinical outcomes, and our study still had several limitations. Further in vivo and in vitro experiments concentrating on mechanism of how MARCKS influences the HCC are needed.
Conclusion
Increased MARCKS expression in HCC might play a role in tumor development and exhibit prognostic value for clinical outcomes.
Abbreviations
AUC, area under the curve; KEGG, Kyoto Encyclopedia of Genes and Genomes; GO, Gene Ontology; ROC, receiver operating characteristic curve; RT-PCR, reverse transcription-polymerase chain reaction.
Data Sharing Statement
The data that support the findings of this study are available in TCGA dataset (https://portal.gdc.cancer.gov/). RNAseq data in level 3 HTSeq-FPKM format of LIHC (hepatocellular carcinoma) project were download from TCGA. To facilitate the use of the data we saved the file to the following website (https://pan.baidu.com/s/13519usqHRrEF3vdPPB24CQ?pwd=yj25). The process of data was described detailedly in manuscript.
Acknowledgments
The work was supported by the Laboratory Medicine Department of the Affiliated Hospital of Jining Medical University, and I would like to show great gratitude to them all.
Funding
This study was supported by grants from the National Natural Science Foundation of China (No.82173371, 81802446), project tsqn.201909192 supported by Tai Shan Young Scholar Foundation of Shandong Province, project ZR2019BH050, ZR2020YQ59, ZR202103020202 supported by Shandong Provincial Natural Science Foundation, project 202003031182, 202003031183, 202104010323 supported by the Project of Medicine Health and Technology Development Plan of Shandong Province, the Miaopu Research of the Affiliated Hospital of Jining Medical University (No. MP-ZD-2020-005).
Disclosure
The authors declare that the research was conducted in the absence of any commercial or financial relationships that could be construed as a potential conflict of interest.
References
1. Siegel RL, Miller KD, Fuchs HE, Jemal A. Cancer statistics, 2021. CA. 2021;71(1):7–33.
2. Wang S, Sun H, Xie Z, et al. Improved survival of patients with hepatocellular carcinoma and disparities by age, race, and socioeconomic status by decade, 1983–2012. Oncotarget. 2016;7(37):59820–59833. doi:10.18632/oncotarget.10930
3. Sung H, Ferlay J, Siegel RL, et al. Global cancer statistics 2020: GLOBOCAN estimates of incidence and mortality worldwide for 36 cancers in 185 countries. CA. 2021;71(3):209–249. doi:10.3322/caac.21660
4. Liu T, Long Q, Li L, et al. The NRF2-dependent transcriptional axis, XRCC5/hTERT drives tumor progression and 5-Fu insensitivity in hepatocellular carcinoma. Mol Ther Oncolytics. 2022;24:249–261. doi:10.1016/j.omto.2021.12.012
5. Chen T, Dai X, Dai J, et al. AFP promotes HCC progression by suppressing the HuR-mediated Fas/FADD apoptotic pathway. Cell Death Dis. 2020;11(10):822. doi:10.1038/s41419-020-03030-7
6. Qi F, Zhou A, Yan L, et al. The diagnostic value of PIVKA-II, AFP, AFP-L3, CEA, and their combinations in primary and metastatic hepatocellular carcinoma. J Clin Lab Anal. 2020;34(5):e23158. doi:10.1002/jcla.23158
7. Liu Z, Wu M, Lin D, Li N. Des-gamma-carboxyprothrombin is a favorable biomarker for the early diagnosis of alfa-fetoprotein-negative hepatitis B virus-related hepatocellular carcinoma. J Int Med Res. 2020;48(2):300060520902575. doi:10.1177/0300060520902575
8. Zhang C, Yang Y, Wang K, et al. The systematic analyses of RING finger gene signature for predicting the prognosis of patients with hepatocellular carcinoma. J Oncol. 2022;2022:2466006. doi:10.1155/2022/2466006
9. Ge S, Huang H, Huang W, et al. PSME4 activates mTOR signaling and promotes the malignant progression of hepatocellular carcinoma. Int J Gen Med. 2022;15:885–895. doi:10.2147/IJGM.S344360
10. Huang X, Wang H, Xu F, et al. Overexpression of chaperonin containing TCP1 subunit 7 has diagnostic and prognostic value for hepatocellular carcinoma. Aging. 2022;14(2):747–769. doi:10.18632/aging.203809
11. Chen M, Zhang C, Liu W, Du X, Liu X, Xing B. Long noncoding RNA LINC01234 promotes hepatocellular carcinoma progression through orchestrating aspartate metabolic reprogramming. Mol Ther. 2022;30(6):2354–2369. doi:10.1016/j.ymthe.2022.02.020
12. Yang Y, Ren P, Liu X, et al. PPP1R26 drives hepatocellular carcinoma progression by controlling glycolysis and epithelial-mesenchymal transition. J Exp Clin Cancer Res. 2022;41(1):101. doi:10.1186/s13046-022-02302-8
13. Wei XC, Liu LJ, Zhu F. Exosomes as potential diagnosis and treatment for liver cancer. World J Gastrointest Oncol. 2022;14(1):334–347. doi:10.4251/wjgo.v14.i1.334
14. Wu WC, Walaas SI, Nairn AC, Greengard P. Calcium/phospholipid regulates phosphorylation of a Mr “87k” substrate protein in brain synaptosomes. Proc Natl Acad Sci U S A. 1982;79(17):5249–5253. doi:10.1073/pnas.79.17.5249
15. Chen Z, Zhang W, Selmi C, et al. The myristoylated alanine-rich C-kinase substrates (MARCKS): a membrane-anchored mediator of the cell function. Autoimmun Rev. 2021;20(11):102942. doi:10.1016/j.autrev.2021.102942
16. Mitra A, Yoshida-Court K, Solley TN, et al. Extracellular vesicles derived from ascitic fluid enhance growth and migration of ovarian cancer cells. Sci Rep. 2021;11(1):9149. doi:10.1038/s41598-021-88163-1
17. Manai M, Abdeljaoued S, Goucha A, et al. MARCKS protein overexpression is associated with poor prognosis in male breast cancer. Cancer Biomark. 2019;26(4):513–522. doi:10.3233/CBM-190637
18. Liu J, Chen SJ, Hsu SW, et al. MARCKS cooperates with NKAP to activate NF-kB signaling in smoke-related lung cancer. Theranostics. 2021;11(9):4122–4136. doi:10.7150/thno.53558
19. Wu F, Chen W, Kang X, et al. A seven-nuclear receptor-based prognostic signature in breast cancer. Clin Transl Oncol. 2020;23:1292–1303. doi:10.1007/s12094-020-02517-1
20. Kim YE, Kim EK, Song MJ, Kim TY, Jang HH, Kang D. SILAC-based quantitative proteomic analysis of oxaliplatin-resistant pancreatic cancer cells. Cancers. 2021;13(4). doi:10.3390/cancers13040724
21. Naboulsi W, Megger DA, Bracht T, et al. Quantitative tissue proteomics analysis reveals versican as potential biomarker for early-stage hepatocellular carcinoma. J Proteome Res. 2016;15(1):38–47. doi:10.1021/acs.jproteome.5b00420
22. Ren X, Ju Y, Wang C, Wei R, Sun H, Zhang Q. MARCKS on tumor-associated macrophages is correlated with immune infiltrates and poor prognosis in hepatocellular carcinoma. Cancer Invest. 2021;39(9):756–768. doi:10.1080/07357907.2021.1950757
23. Ni W, Bian S, Zhu M, et al. Identification and Validation of Ubiquitin-Specific Proteases as a Novel Prognostic Signature for Hepatocellular Carcinoma. Front Oncol. 2021;11:629327. doi:10.3389/fonc.2021.629327
24. Tohme S, Yazdani HO, Rahman A, et al. The use of machine learning to create a risk score to predict survival in patients with hepatocellular carcinoma: a TCGA cohort analysis. Can J Gastroenterol Hepatol. 2021;2021:5212953. doi:10.1155/2021/5212953
25. Love MI, Huber W, Anders S. Moderated estimation of fold change and dispersion for RNA-seq data with DESeq2. Genome Biol. 2014;15(12):550. doi:10.1186/s13059-014-0550-8
26. Zhou Y, Zhou B, Pache L, et al. Metascape provides a biologist-oriented resource for the analysis of systems-level datasets. Nat Commun. 2019;10(1):1523. doi:10.1038/s41467-019-09234-6
27. Subramanian A, Tamayo P, Mootha VK, et al. Gene set enrichment analysis: a knowledge-based approach for interpreting genome-wide expression profiles. Proc Natl Acad Sci USA. 2005;102(43):15545–15550. doi:10.1073/pnas.0506580102
28. Yu G, Wang LG, Han Y, He QY. clusterProfiler: an R package for comparing biological themes among gene clusters. Omics. 2012;16(5):284–287. doi:10.1089/omi.2011.0118
29. Szklarczyk D, Gable AL, Lyon D, et al. STRING v11: protein-protein association networks with increased coverage, supporting functional discovery in genome-wide experimental datasets. Nucleic Acids Res. 2019;47(D1):D607–d613. doi:10.1093/nar/gky1131
30. Doncheva NT, Morris JH, Gorodkin J, Jensen LJ. Cytoscape stringapp: network analysis and visualization of proteomics data. J Proteome Res. 2019;18(2):623–632. doi:10.1021/acs.jproteome.8b00702
31. Zhou Q, Yan X, Liu W, et al. Three immune-associated subtypes of diffuse glioma differ in immune infiltration, immune checkpoint molecules, and prognosis. Front Oncol. 2020;10:586019. doi:10.3389/fonc.2020.586019
32. Hanko M, Grendár M, Snopko P, et al. Random forest-based prediction of outcome and mortality in patients with traumatic brain injury undergoing primary decompressive craniectomy. World Neurosurg. 2021;148:e450–e458. doi:10.1016/j.wneu.2021.01.002
33. Núñez E, Steyerberg EW, Núñez J. Estrategias para la elaboracio´n de modelos estadı´sticos de regresio´n [Regression modeling strategies]. Rev Esp Cardiol. 2011;64(6):501–507. Spanish. doi:10.1016/j.recesp.2011.01.019
34. Kim J, Kaufman JS, Bang H. Graphing ratio measures on forest plot. J Am Coll Cardiol. 2018;71(5):585–586. doi:10.1016/j.jacc.2017.10.098
35. Iyer DN, Faruq O, Zhang L, Rastgoo N, Liu A, Chang H. Pathophysiological roles of myristoylated alanine-rich C-kinase substrate (MARCKS) in hematological malignancies. Biomark Res. 2021;9(1):34. doi:10.1186/s40364-021-00286-9
36. Wang X, Zhang J, Zhou G. The CXCL11-CXCR3A axis influences the infiltration of CD274 and IDO1 in oral squamous cell carcinoma. J Oral Pathol Med. 2020;2020:1.
37. Beckmann L, Berg V, Dickhut C, et al. MARCKS affects cell motility and response to BTK inhibitors in CLL. Blood. 2021;138(7):544–556. doi:10.1182/blood.2020009165
38. Mohapatra P, Yadav V, Toftdahl M, Andersson T. WNT5A-induced activation of the protein kinase C substrate MARCKS is required for melanoma cell invasion. Cancers. 2020;12(2):346. doi:10.3390/cancers12020346
39. Castven D, Czauderna C, Becker D, et al. Acquired resistance to antiangiogenic therapies in hepatocellular carcinoma is mediated by yes-associated protein 1 activation and transient expansion of stem-like cancer cells. Hepatol Commun. 2021;6:1140–1156. doi:10.1002/hep4.1869
40. Chavez-Dominguez R, Perez-Medina M, Aguilar-Cazares D, et al. Old and new players of inflammation and their relationship with cancer development. Front Oncol. 2021;11:722999. doi:10.3389/fonc.2021.722999
41. Lin W, Zhang HL, Niu ZY, et al. The disease stage-associated imbalance of Th1/Th2 and Th17/Treg in uterine cervical cancer patients and their recovery with the reduction of tumor burden. BMC Womens Health. 2020;20(1):126. doi:10.1186/s12905-020-00972-0
42. Lenehan PJ, Cirella A, Uchida AM, et al. Type 2 immunity is maintained during cancer-associated adipose tissue wasting. Immunol Adv. 2021;1(1):ltab011. doi:10.1093/immadv/ltab011
43. Wang S, Ma H, Li X, et al. DNASE1L3 as an indicator of favorable survival in hepatocellular carcinoma patients following resection. Aging. 2020;12(2):1171–1185. doi:10.18632/aging.102675
44. Tayob N, Kanwal F, Alsarraj A, Hernaez R, El-Serag HB. The Performance of AFP, AFP-3, DCP as biomarkers for detection of Hepatocellular Carcinoma (HCC). A Phase 3 biomarker study in the United States. Clin Gastroenterol Hepatol. 2022;2020:1.
 © 2023 The Author(s). This work is published and licensed by Dove Medical Press Limited. The full terms of this license are available at https://www.dovepress.com/terms.php and incorporate the Creative Commons Attribution - Non Commercial (unported, v3.0) License.
By accessing the work you hereby accept the Terms. Non-commercial uses of the work are permitted without any further permission from Dove Medical Press Limited, provided the work is properly attributed. For permission for commercial use of this work, please see paragraphs 4.2 and 5 of our Terms.
© 2023 The Author(s). This work is published and licensed by Dove Medical Press Limited. The full terms of this license are available at https://www.dovepress.com/terms.php and incorporate the Creative Commons Attribution - Non Commercial (unported, v3.0) License.
By accessing the work you hereby accept the Terms. Non-commercial uses of the work are permitted without any further permission from Dove Medical Press Limited, provided the work is properly attributed. For permission for commercial use of this work, please see paragraphs 4.2 and 5 of our Terms.