")
Back to Journals » ClinicoEconomics and Outcomes Research » Volume 6
Management of sacroiliac joint disruption and degenerative sacroiliitis with nonoperative care is medical resource-intensive and costly in a United States commercial payer population
Authors Ackerman S, Polly Jr D, Knight T, Holt T, Cummings J
Received 7 September 2013
Accepted for publication 28 November 2013
Published 11 February 2014 Volume 2014:6 Pages 63—74
DOI https://doi.org/10.2147/CEOR.S54158
Checked for plagiarism Yes
Review by Single anonymous peer review
Peer reviewer comments 2
Stacey J Ackerman,1 David W Polly Jr,2 Tyler Knight,3 Tim Holt,4 John Cummings5
1Covance Market Access Services Inc, San Diego, CA, USA; 2University of Minnesota, Orthopaedic Surgery, Minneapolis, MN, USA; 3Covance Market Access Services Inc, Gaithersburg, MD, USA; 4Montgomery Spine Center, Orthopaedic Surgery, Montgomery, AL, USA; 5Community Health Network, Neurosurgery, Indianapolis, IN, USA
Introduction: Low back pain is common and originates in the sacroiliac (SI) joint in 15%–30% of cases. Traditional SI joint disruption/degenerative sacroiliitis treatments include nonoperative care or open SI joint fusion. To evaluate the usefulness of newly developed minimally-invasive technologies, the costs of traditional treatments must be better understood. We assessed the costs of nonoperative care for SI joint disruption to commercial payers in the United States (US).
Methods: A retrospective study of claim-level medical resource use and associated costs used the MarketScan® Commercial Claims and Encounters as well as Medicare Supplemental Databases of Truven Healthcare. Patients with a primary ICD-9-CM diagnosis code for SI joint disruption (720.2, 724.6, 739.4, 846.9, or 847.3), an initial date of diagnosis from January 1, 2005 to December 31, 2007 (index date), and continuous enrollment for ≥1 year before and 3 years after the index date were included. Claims attributable to SI joint disruption with a primary or secondary ICD-9-CM diagnosis code of 71x.xx, 72x.xx, 73x.xx, or 84x.xx were identified; the 3-year medical resource use-associated reimbursement and outpatient pain medication costs (measured in 2011 US dollars) were tabulated across practice settings. A subgroup analysis was performed among patients with lumbar spinal fusion.
Results: The mean 3-year direct, attributable medical costs were $16,196 (standard deviation [SD] $28,592) per privately-insured patient (N=78,533). Among patients with lumbar spinal fusion (N=434), attributable 3-year mean costs were $91,720 (SD $75,502) per patient compared to $15,776 (SD $27,542) per patient among patients without lumbar spinal fusion (N=78,099). Overall, inpatient hospitalizations (19.4%), hospital outpatient visits and procedures (14.0%), and outpatient pain medications (9.6%) accounted for the largest proportion of costs. The estimated 3-year insurance payments attributable to SI joint disruption were $1.6 billion per 100,000 commercial payer beneficiaries.
Conclusion: The economic burden of SI joint disruption among privately-insured patients in the US is substantial, highlighting the need for more cost-effective therapies.
Keywords: cost, epidural injection, lumbar spinal fusion surgery
Introduction
Low back pain is common, with 70%–85% of adults experiencing low back pain sometime during their lives.1–3 The prevalence of chronic low back pain in the US ranges from 10%–45%3–5 and has increased over the past few decades.5,6 The rising prevalence of chronic low back pain has led to increased costs including the direct costs of health care utilization and indirect costs of disability.2,5 Direct costs of low back pain in the US have been estimated between $12.2 billion and $90.6 billion based on a systematic review by Dagenais et al.7 Back pain is a major contributor to increases in private insurance spending. In a national analysis of US private health insurance spending, back pain was the ninth largest contributor to increases in private health insurance spending between 1987 and 2002, with newborn/maternity care and cancer leading the spending increases.8 Treated cases of back pain were the eighth most expensive medical condition, following cardiovascular disease, kidney problems, cancer, newborn/maternity care, heart disease, diabetes, and arthritis.8
The sacroiliac (SI) joint is the generator of low back pain in 15%–30% of cases.9,10 SI joint pain, described as SI joint disruption and/or degenerative sacroiliitis, has traditionally been treated with open SI joint arthrodesis surgery or nonoperative care. Nonoperative care, which primarily treats the symptoms of SI joint pain, includes pain management and physical therapy. Pain management may entail prescription and nonprescription medications, radiofrequency ablation, and SI joint (epidural) injections.11 Open SI joint arthrodesis surgery has been utilized when patients are refractory to nonoperative care. Unfortunately, open SI joint surgery is invasive, requiring bone harvesting and large incisions, and necessitates lengthy hospital stays and a long period of non-weight bearing.12–14
Minimally invasive surgery (MIS) addresses the gap in the continuum of care between continued nonoperative care and invasive open arthrodesis surgery. MIS has been shown to be safe and effective11,15,16 and is being used with increasing frequency in the US.16,17 MIS offers the promise of a shorter inpatient or outpatient procedure with quicker recovery time.11,15 Because little has been published about the economic implications of nonoperative care among privately-insured patients with SI joint disruption and degenerative sacroiliitis, it is difficult to assess whether newer MIS techniques offer a viable treatment alternative among privately-insured patients who have failed nonoperative therapy. To help inform this discussion, the objective of this study was to determine the health resource utilization and costs of nonoperative care for SI joint disruption and degenerative sacroiliitis to commercial payers.
Methods
This research was performed according to guidelines (GPP2) established to minimize conflict of interest in pharmacoeconomic studies.18,19 A multispecialty panel comprising clinicians and methodologists (the coauthors of this paper) provided the framework for the economic analysis and made all decisions about the data analysis and interpretation of the results. The sponsor, SI-BONE, Inc (San Jose, CA, USA), did not participate in the data analysis, interpretation of the results, or writing of the manuscript. SI-BONE, Inc, was provided a final version of the manuscript for informational purposes only. They did not provide comments or influence the content or writing of the manuscript.
Study design and data sources
In a retrospective economic analysis, medical resource use and associated costs to commercial payers for patients with SI joint disruption and/or degenerative sacroiliitis were assessed. Commercially insured patients in the MarketScan® Commercial Claims and Encounters (Commercial; Truven Health Analytics; Ann Arbor, MI, USA]) and Medicare Supplemental Databases (Truven Health Analytics) were included in the analysis. The MarketScan® databases provide access to medical and prescription drug claims for privately-insured individuals in the US, including individuals with Medicare supplemental coverage. The Commercial Database represents the inpatient and outpatient medical experience and outpatient prescription drug experience of several million individuals annually. These claims represent individuals covered by approximately 90 large employers and health plans. Insurance coverage is provided under a variety of fee-for-service and capitated health plans, including exclusive provider organizations, preferred provider organizations, point of service plans, indemnity plans, and health maintenance organizations. The Medicare Supplemental Database contains the health care experience of individuals with Medicare supplemental insurance paid for by employers. Both the Medicare-covered portion of payment (represented as coordination of benefits amount) and the employer-paid portion are included in this database. The MarketScan® databases provide detailed reimbursement, use, and outcomes data for health care services performed in both inpatient and outpatient settings. The medical claims are linked to outpatient prescription drug claims and person-level enrollment data through the use of unique enrollee identifiers. As no patient-identifying information was used in the analysis, institutional review board review or determination was not sought.
All claims in the MarketScan® database with an International Classification of Diseases, Ninth Revision, Clinical Modification (ICD-9-CM)20 code for SI joint disruption and/or degenerative sacroiliitis (ICD-9-CM diagnosis codes 720.2, 724.6, 739.4, 846.9, or 847.3) in the primary diagnosis field (Table 1) were selected. No attempt was made to exclude patients with a secondary diagnosis of inflammatory sacroiliitis (eg, ankylosing spondylitis, rheumatoid arthritis) because it has been the clinical experience of the authors that these patients still have substantial SI joint pain. For the base case analysis, ICD-9-CM code 721.3 (lumbosacral spondylosis) was not included but was included in the subsequent sensitivity analysis described below. Medical claims were used to identify a primary diagnosis of SI joint disruption and/or degenerative sacroiliitis. The index date was identified as the initial date of diagnosis of SI joint disruption and/or degenerative sacroiliitis between January 1, 2005 and December 31, 2007. Patients had to have continuous medical and pharmacy enrollment at least 1 year before and 3 years after the index date in order to allow 3 years of follow-up (based on available data). Within this defined population, claims with primary or secondary ICD-9-CM diagnosis codes of 71x.xx, 72x.xx, 73x.xx, or 84x.xx were defined as SI joint disruption and/or degenerative sacroiliitis and selected for this analysis.
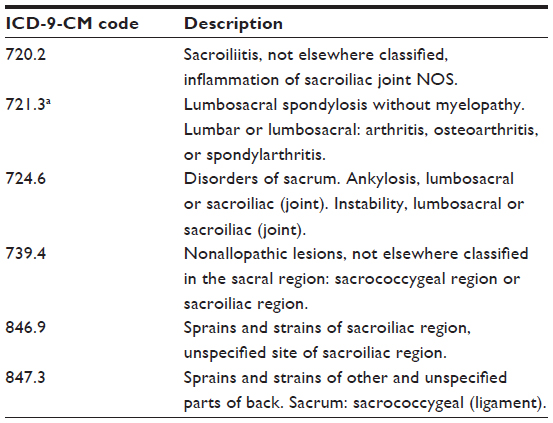 | Table 1 International classification of disease diagnosis codes used to identify degenerative sacroiliitis/sacroiliac joint disruption |
Three years of commercial payer costs data were analyzed from the initial diagnosis of SI joint disruption and/or degenerative sacroiliitis. Because data prior to 2005 were not examined, the first mention of a diagnosis of SI joint disruption and/or degenerative sacroiliitis in the study period was not necessarily the first diagnosis for the patient (ie, the SI joint disruption and/or degenerative sacroiliitis might or might not have been newly diagnosed). Three years of data were then extracted after the index date to investigate medical resource use and associated commercial payer costs (that is, insurance payments). Only patients with continuous enrollment for all 3 years were included in the analysis; this guaranteed that all patients in the analysis were alive for all 3 years, wherein they could have continued to be diagnosed and treated for SI joint disruption and/or degenerative sacroiliitis.
Due to the overlap of SI joint pathology and low back pain requiring spinal fusion, we conducted a subgroup analysis on SI joint disruption and/or degenerative sacroiliitis patients who underwent lumbar spinal fusion. Patients who underwent lumbar spinal fusion surgery were identified with ICD-9-CM procedure codes 81.05–81.08, 81.35–81.38, and 81.62–81.64 (Table 2). This subgroup of patients underwent a lumbar spinal fusion in either the year prior to the index diagnosis of SI joint disruption and/or degenerative sacroiliitis (including data from 2004 for patients with an index diagnosis in 2005) or in the subsequent 3 years. A period of 1 year prior to the index diagnosis was used to define this subgroup for several reasons. Specifically, patients who underwent lumbar spinal fusion within 1 year prior to receiving a diagnosis of SI joint disruption may represent either concomitant disease or potential misdiagnosis because this is a treatment for spinal, not SI joint, pathology. These patients subsequently received a primary diagnosis of SI joint disruption and were treated with nonoperative care. Of note, the period was limited to 1 year prior because it was not our intent to include patients with adjacent segment degeneration following spinal fusion. Based upon the clinical experience of the authors, it is common for there to be a delay in diagnosis of SI joint disruption and/or degenerative sacroiliitis. While it is unclear how often lumbar fusion is being performed on patients who really have SI pathology, it has been suggested that it is performed at least 5% of the time.9
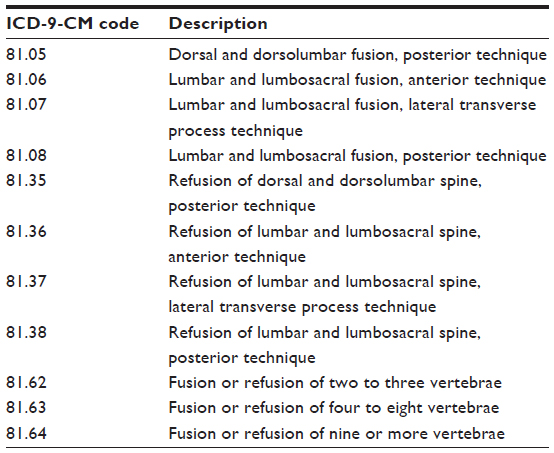 | Table 2 International classification of disease procedure codes used to identify patients who underwent lumbar spinal fusion surgerya |
Conversely, patients who underwent lumbar spinal fusion within 3 years after receiving a diagnosis of SI joint disruption may also represent concomitant disease or potential misdiagnosis. Whether misdiagnosis or multiple diagnoses, the lumbar spinal fusion subgroup analysis was conducted because lumbar spinal fusion patients with sacroiliac diagnoses may represent a group requiring greater medical resource utilization to treat than patients with the same diagnosis who have not had lumbar spinal fusion.
Construction of outcome variables
Outcomes were investigated in the 3-year period following the index date. SI joint disruption and/or degenerative sacroiliitis attributable costs were defined as claims with any of the following ICD-9-CM diagnosis codes in the primary or secondary diagnosis field: 71x.xx–73x.xx (disease of the musculoskeletal system and connective tissue, excluding 721.3) or 84x.xx (sprains and strains of joints and adjacent muscles). Medical resource use and associated reimbursement were identified and evaluated for each subsequent year following the initial SI joint disruption and/or degenerative sacroiliitis diagnosis. Medical resource use was identified using Current Procedural Terminology codes that describe surgical procedures, hospital inpatient, hospital outpatient, physician office, and emergency room visits as well as other diagnostic tests and procedures including, but not limited to, physical therapy, chiropractic manipulation, prolotherapy, therapeutic injection (SI joint), trigger point injection, epidural steroid injection/selective nerve root block, facet block, pelvic x-ray, and magnetic resonance imaging (MRI)/computed tomography (CT) exams. Outpatient pain medication costs were estimated as the costs of pharmacy claims for the following drug categories: salicylate analgesics/antipyretics, anti-inflammatory analgesics/antipyretics, opiate agonists, anti-depressants, benzodiazepines, anxiolytics, sedatives, and hypnotics.
Total 3-year cumulative reimbursement (not including patient or supplemental plan contribution) was identified for each of these settings and for each medical resource and was reported in 2011 US dollars (USD). Dollar amounts from 2009 and 2010 were converted to 2011 USD using the medical care component of the Consumer Price Index.21
Statistical analysis
Analyses were performed for all patients with a diagnosis of SI joint disruption and/or degenerative sacroiliitis and for two subgroups: those with and without lumbar spinal fusion surgery. Descriptive statistics were calculated from demographic characteristics and primary diagnoses at index date based on the initial index claim with a primary diagnosis of sacroiliitis, disorders of sacrum, SI subluxation, sprain/strain in SI region, or sprain/strain of sacrum. Direct medical resource utilization and commercial payer costs attributable to SI joint disruption were analyzed cumulatively over 3 years following initial diagnosis and across settings of care, including hospital inpatient, hospital outpatient, physician office, emergency department, and pharmacy costs. All statistical analyses were performed using SAS version 9.1.3 (SAS Institute Inc, Cary, NC, USA).
Results
Demographics and primary diagnoses of overall study sample and subgroups
In this commercial claims analysis, 78,533 patients were identified with SI joint disruption and/or degenerative sacroiliitis with continuous medical and pharmacy enrollment for at least 1 year before and 3 years after diagnosis (Table 3). Of these, 434 (0.6%) had lumbar spinal fusion surgery. The mean age of the overall population was 45.2 years (Table 4) and most (74.1%) patients were insured through a preferred provider organization/point-of-service provider, followed by a health maintenance organization. The most common primary diagnoses were sacroiliac subluxation (33.9%), sacroiliitis (25.7%), and disorders of the sacrum (25.0%). In the spinal fusion subgroup, the most common primary diagnoses were disorders of the sacrum (44.7%) and sacroiliitis (32.3% [Table 4]).
 | Table 3 Patient attrition |
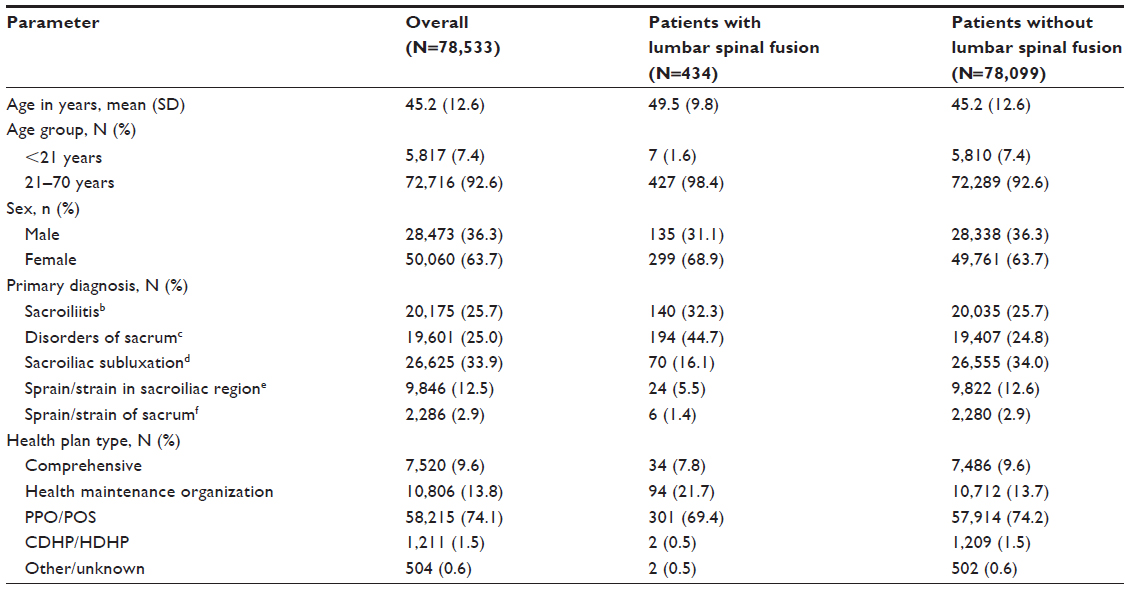 | Table 4 Demographics and primary diagnosis of patients with SI joint disruption and/or degenerative sacroiliitisa |
Medical resource utilization in overall study sample and subgroups
The cumulative medical resource use over 3 years is presented in Table 5. In the overall group, over half of all patients had hospital outpatient visits; of those patients, there was an average of 4.7 visits per patient. Among the 8.7% of patients with a hospitalization, there was an average of 1.4 hospital inpatient stays per patient over 3 years. Overall, patients had an average of 8.0 outpatient physician office visits during the 3-year period. Among the 16.8% of patients with an emergency room visit, there was an average of 4.6 emergency room visits per patient over 3 years. Over half of patients utilized physical therapy (with a mean of 17.1 claims per patient) and chiropractic manipulation (with a mean of 20.1 claims per patient) during the 3-year period. Prolotherapy, therapeutic injections, epidural steroid injections and selective nerve root blocks, acupuncture, and pelvic blocks were used less frequently. Nearly all patients (96.8%) utilized outpatient pain medications, with an average of 69.1 pain medication claims (prescriptions filled) per patient over the 3-year period.
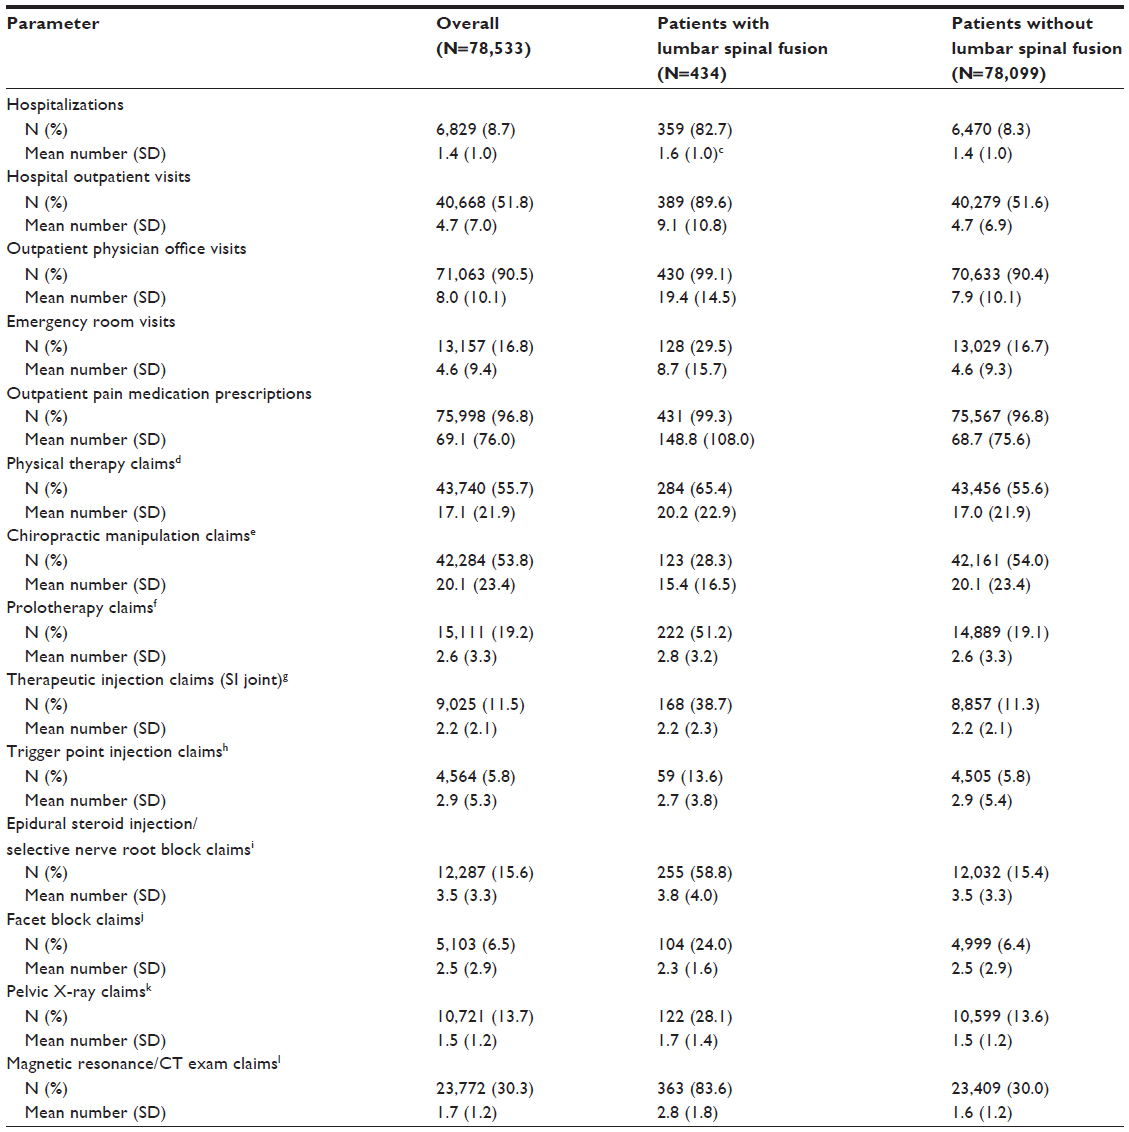 | Table 5 Three-year cumulative SI joint disruption and/or degenerative sacroiliitis-attributablea direct medical resource utilization per patient treated with nonoperative careb |
Compared to patients without lumbar spinal fusion, a greater percentage of patients with lumbar spinal fusion were hospitalized or received prolotherapy, therapeutic SI joint injections, epidural steroid injections/selective nerve root blocks, facet blocks, pelvic x-rays, and magnetic resonance/CT exams. However, the mean number of claims was similar among patients who utilized those medical resources. Patients with lumbar spinal fusion utilized hospital outpatient and emergency room visits at both a greater number and higher percentage than patients without lumbar spinal fusion. Patients with lumbar spinal fusion had more outpatient pain medication claims per patient (148.8 pharmacy claims) than patients without lumbar spinal fusion (68.7 pharmacy claims) over the 3-year period, totaling approximately four versus two outpatient pain medication claims per patient per month, respectively.
Cost of nonoperative care in overall study sample and subgroups (commercial payer reimbursement)
Nonoperative care is a resource-intense process that includes therapeutic interventions, medications, and physician’s office and clinic visits, in addition to hospitalizations. The average cumulative 3-year direct medical costs (in 2011 USD) attributable to SI joint disruption and/or degenerative sacroiliitis was $16,196 (standard deviation [SD] $28,592) per patient for all patients. In the overall group, 48% of costs are accounted for by the cost categories shown in Table 6 (hospitalizations, hospital outpatient visits, outpatient physician office visits, emergency room visits, and outpatient pain medications); the remaining costs primarily reflect physical therapy, chiropractic manipulation, prolotherapy, and diagnostic imaging. Inpatient hospitalizations accounted for 19.4% of the total 3-year costs, hospital outpatient costs accounted for 14.0%, and outpatient pain medications accounted for 9.6% (Table 6).
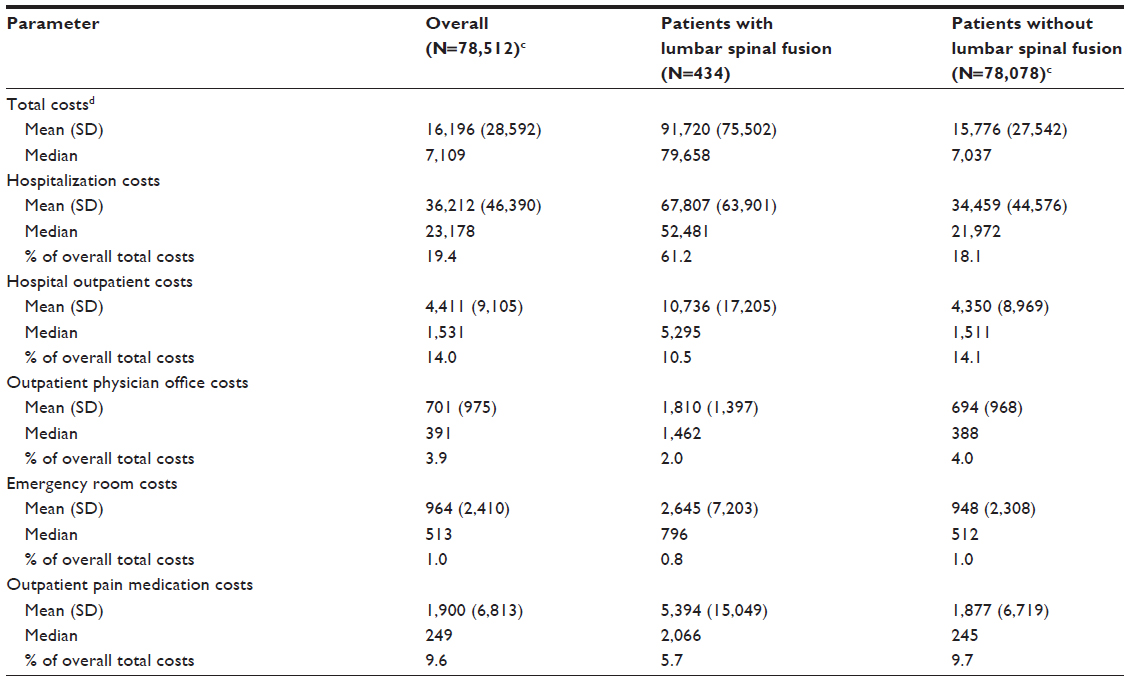 | Table 6 Three-year cumulative SI joint disruption and/or degenerative sacroiliitis-attributablea direct medical costs per patient treated with nonoperative care (2011 USD)b |
For patients with lumbar spinal fusion, average 3-year cumulative costs were higher ($91,720; SD $75,502) than for patients without lumbar spinal fusion ($15,776; SD $27,542). Among the lumbar spinal fusion group, approximately 80% of costs were accounted for by the cost categories shown in Table 6 (hospitalizations, hospital outpatient visits, outpatient physician office visits, emergency room visits, and outpatient pain medications). Hospitalizations accounted for over half of all costs for patients with lumbar spinal fusion (61.2% of total overall costs) compared to patients without lumbar spinal fusion (18.1% of total overall costs). Hospital outpatient costs represented 10.5% of total costs and outpatient pain medications represented 5.7% for patients with lumbar spinal fusion.
Cumulative costs, that is, commercial payer reimbursement, increased over the 3-year period for the overall group and subgroups (Figure 1). For all patients, the cumulative costs increased from $6,191 in year 1, to $11,132 in year 2, and $16,196 in year 3. Costs were similar for patients without lumbar spinal fusion ($6,025 in year 1, $10,861 in year 2, and $15,776 in year 3). For patients with lumbar spinal fusion, cumulative costs increased from $36,132 in year 1, to $59,909 in year 2, to $91,720 in year 3.
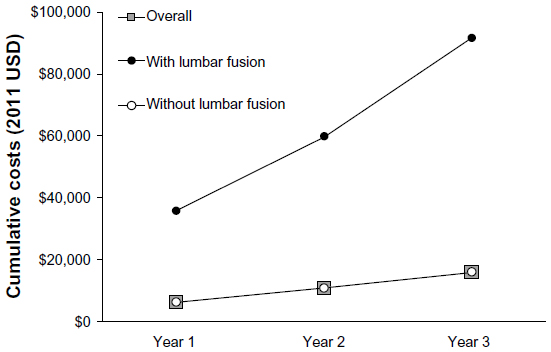 | Figure 1 Cumulative commercial payer costs of beneficiaries with SI joint disruption and/or degenerative sacroiliitis (2011 USD). |
Sensitivity analysis (inclusion of ICD-9-CM code 721.3)
Sacroiliac joint pain is misdiagnosed as low back pain/lumbar spondylosis an estimated 14.5%–22.5% of the time,9,10 suggesting substantial ambiguity and heterogeneity in the diagnosis of SI joint disruption. To capture such patients, ICD-9-CM code 721.3 (described as lumbosacral spondylosis without myelopathy.20 Lumbar or lumbosacral: arthritis, osteoarthritis, or spondylarthritis)21 was included in a sensitivity analysis.
In the original analysis excluding ICD-9-CM code 721.3, a total of 78,533 patients with SI joint disruption and/or degenerative sacroiliitis were identified in the database. With the inclusion of ICD-9-CM code 721.3, 128,354 patients with SI joint disruption and/or degenerative sacroiliitis were identified (49,821 patients with a primary diagnosis code of 721.3). Of these patients, 1,550 (1.2%) had lumbar spinal fusion surgery and 126,804 (98.8%) did not have lumbar spinal fusion (Table 7). With ICD-9-CM code 721.3 included, the mean 3-year cumulative costs of $22,436 per patient in the overall group and $21,520 per patient in the patients without lumbar spinal fusion group were higher than when ICD-9-CM code 721.3 was excluded ($16,196 per patient for the overall group and $15,776 per patient for the group without spinal fusion). The costs per patient for patients with lumbar spinal fusion increased slightly with inclusion of ICD-9-CM code 721.3, ($97,388 including 721.3 versus $91,720 excluding 721.3; Table 7). The distribution of costs across settings of care was similar to that of the original analysis.
 | Table 7 Sensitivity analysis of 3-year cumulative SI joint disruption and/or degenerative sacroiliitis-attributablea direct medical costs per patient treated with nonoperative care (2011 USD) including ICD-9-CM code 721.3b |
Discussion
This analysis evaluated the health care resource utilization and direct medical costs of nonoperative care of SI joint disruption and/or degenerative sacroiliitis to private payers to assess the economic burden of disease. The analysis found that mean 3-year cumulative costs for privately-insured patients with SI joint disruption and/or degenerative sacroiliitis were $16,196 per patient overall, $91,720 per patient among patients with lumbar spinal fusion, and $15,776 per patient among patients without lumbar spinal fusion. The year-over-year attributable costs for SI joint disruption increased $5,399 per year, on average, for the overall group. The largest proportion of 3-year cumulative costs in the overall population was due to costs of inpatient hospitalizations (19%), hospital outpatient visits (14%), and outpatient pain medications (10%). The results of the present study are similar to a systematic review of burden of chronic low back pain, where emergency room, inpatient, and outpatient hospital costs accounted for approximately 30% of costs (compared to 34% calculated here).7 As a point of reference, the attributable mean annual cost for SI joint disruption is similar to that for chronic low back pain,22 more than that for hypertension,23 and less than that for atherosclerosis24 and diabetes25 (Figure 2).
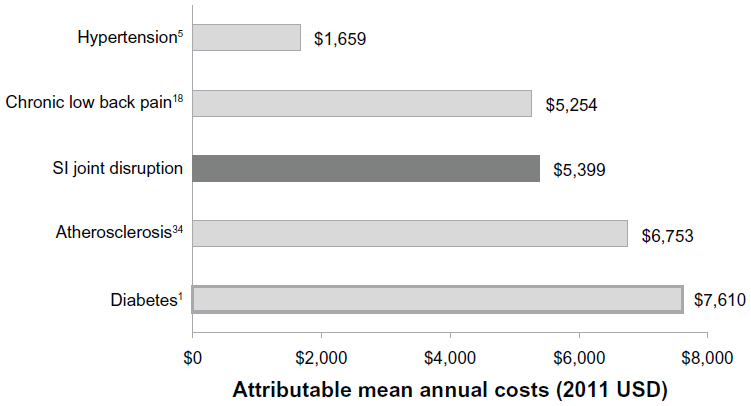 | Figure 2 Commercial payer attributable mean annual costs of SI joint disruption and/or degenerative sacroiliitis relative to other chronic conditions (2011 USD). |
This study demonstrates that costs associated with nonoperative care and management of privately-insured patients with SI joint pain steadily increased over a 3-year follow-up period. Over the 3-year period, the attributable cost (ie, insurance payments) is estimated to be $1.6 billion per 100,000 commercial payer beneficiaries diagnosed with SI joint disruption and/or degenerative sacroiliitis based on our overall cost of $16,196 per patient. If the ICD-9-CM code 721.3 is included in the calculation, the 3-year attributable cost would increase to $2.2 billion per 100,000 commercial payer beneficiaries diagnosed with SI joint disruption and/or degenerative sacroiliitis ($22,436 per patient). Of note, this analysis focused on the direct medical costs of SI joint disruption and/or degenerative sacroiliitis to the commercial payer, which does not include indirect costs, such as impact on productivity, lost wages, and caregiver support.
The prevalence of SI joint disruption and/or degenerative sacroiliitis is 0.9% among these commercial payer beneficiaries (359,630 cases out of 39,134,113 total patients in the database), similar to the rate of 0.7% found in a national sample of commercially managed health care plans.22 While only 25% of the patients with a primary diagnosis of SI joint disruption and/or degenerative sacroiliitis were continuously enrolled by the commercial payer for 3 years following diagnosis, this enrollment trend of 20%–25% annual turnover is commonly observed among commercial insurers,26–27 suggesting that our findings may be generalizable to those beneficiaries who were not continuously enrolled for 3 years. In contrast to a recent analysis performed in the Medicare population,28 the present study found that the younger, commercial payer population was hospitalized less frequently (8.7% of the commercial payer group over 3 years compared to 41.2% in the Medicare population over 5 years). In the 3 years analyzed, a lower percentage of commercial payer beneficiaries incurred hospital outpatient visits (51.8% versus 82.2%), emergency room visits (16.8% versus 33.8%), and magnetic resonance/CT exam claims (30.3% versus 48.9%) compared to Medicare beneficiaries over 5 years.28
Within this analysis, a subgroup of patients who underwent lumbar spinal fusion surgery (0.6% of patients) incurred a greater economic burden (over five-fold the per-patient 3-year cumulative costs [$91,720] compared to patients without lumbar spinal fusion surgery [$15,776]). The higher cost of the lumbar spinal fusion patients is a concern, given that the rate of lumbar spinal fusion surgery has increased three-fold from 1998 to 2008 while laminectomy increased only 11% during that time period.13 Within the same time period, total hospital charges for lumbar spinal fusions increased 3.3-fold in an all-payer database containing data from 20% of community hospitals in the US.29 Patients treated with lumbar spinal fusion are also more likely to develop subsequent SI joint degeneration and have poor outcomes, in addition to the higher costs associated with patients treated with lumbar spinal fusion surgery.30–32 Lumbar spinal fusion may also increase the potential future costs. Results from a prospective study showed that patients who received decompression and instrumented posterolateral lumbar/lumbosacral fusion more frequently developed degeneration of the SI joint (75.0%) compared to controls (38.2%).33 In the present analysis, only 0.6% of the commercial payer beneficiaries had lumbar spinal fusion surgery. This figure may be underestimated as we only looked 1 year prior to and 3 years following the SI joint disruption diagnosis; therefore, the window may be too narrow to have captured all such patients.
Sembrano et al previously suggested that lumbar spinal fusion is being performed at least 5% of the time on patients who really have SI pathology.9 In the present study in a commercial payer population, of the 434 patients in the lumbar spinal fusion subgroup, 17% underwent lumbar spinal fusion within 1 year prior to receiving a diagnosis of SI joint disruption and/or degenerative sacroiliitis, whereas the remaining 83% underwent lumbar spinal fusion following diagnosis of SI joint disease. In a similar analysis of the Medicare population, 7% underwent lumbar spinal fusion surgery within 1 year prior to receiving a diagnosis of SI joint disruption and/or degenerative sacroiliitis, whereas 93% of patients underwent lumbar spinal fusion within 5 years of receiving a diagnosis of SI joint disease.28 The proportion of patients who undergo lumbar spinal fusion within 1 year prior to receiving a diagnosis of SI joint disruption appears to be higher than previously suggested and may represent patients with concomitant disease, new SI joint disease, or misdiagnosis.
Limitations
There are several limitations to this commercial payer claims data analysis. First, SI joint dysfunction is often misdiagnosed or miscoded because there is no gold standard for SI joint pain diagnosis.34–37 The extremely complex nature of spine and SI joint diagnostic testing presents a conundrum that we have tried to address using the extensive clinical experience of the authors of the present study in addition to subgroup and sensitivity analyses. An algorithm to identify the patient cohort was developed with input from a multispecialty panel of clinicians and methodologists. While we acknowledge that the methodology is imperfect given that our study is based upon insurance claims that are dependent upon the coding entered by the treating clinician at the time of the encounter, the approach we have used is well-accepted in burden of disease research38 and allows policy makers to allocate resources based upon relative burden of disease. Economic burden of illness studies for cardiovascular disease39,40 and diabetes,24 as well as low back pain21,41,42 have also used a similar methodology.
The reliance on a coding system to identify patients with a clinical condition may lead to a lack of sensitivity and specificity in all retrospective claims analyses. Only patients with an ICD-9-CM code for SI joint disruption and/or degenerative sacroiliitis in the primary diagnosis position were selected in order to increase the specificity of the cohort identification. While this approach is less sensitive, it allowed us more certainty that the patient was seeking care for the SI joint, rather than another condition. Further, only claims with a primary or secondary ICD-9-CM spinal diagnosis code of 71x.xx, 72x.xx, 73x.xx, or 84x.xx were deemed attributable to SI joint disruption and/or degenerative sacroiliitis and selected for analysis in order to increase the specificity of the claims identification. No attempt was made to exclude patients with a secondary diagnosis of inflammatory sacroiliitis (eg, ankylosing spondylitis, rheumatoid arthritis) because it has been the clinical experience of the authors that these patients still have substantial SI joint pain. Next, it is possible that the costs associated with treatment of SI joint disruption may have been overestimated because it is not known for certain whether the medical resources reflected on such claims were incurred specifically for SI joint disruption. Nevertheless, an exploratory analysis using Medicare claims data demonstrated that 75% of physician office visit costs were from spinal claims with a relevant provider specialty, eg, orthopedic surgery or neurosurgery rather than primary care,28 which provides more confidence that most costs were SI joint-related and not due to other conditions. Finally, we performed a sensitivity analysis where we included ICD-9-CM code 721.3 (lumbosacral spondylosis) because of the potential ambiguity and heterogeneity in the assignment of this particular code. The sensitivity analysis showed that the population nearly doubled in size (from 78,533 to 128,354 patients) and increased the 3-year cumulative costs from $16,196 to $22,436 per patient overall with inclusion of ICD-9-CM code 721.3.
Conclusion
The economic burden of SI joint disruption and degenerative sacroiliitis among privately-insured patients in the US is substantial and highlights the need for more cost-effective therapies to treat this condition and reduce health care expenditures.
Acknowledgment
We thank Karen Spach, PhD, of Covance Market Access Services Inc, for her editorial contribution to this manuscript.
Disclosure
This research was performed according to guidelines (GPP2) established to minimize conflict of interest in pharmacoeconomic studies.18,19 A multispecialty panel comprising clinicians and methodologists (the coauthors) provided the framework for the economic analysis and completed the data analysis and interpretation of the results. This study was sponsored by SI-BONE, Inc. SI-BONE, Inc, did not participate in the data analysis, interpretation of the results, or writing of the manuscript. SI-BONE, Inc, was provided a final version of the manuscript for informational purposes only. It did not influence the content or writing of the manuscript. SJA and TK are consultants to SI-BONE, Inc, through their employment with Covance. DWP Jr has not received any financial support from SI-BONE, Inc. DWP Jr receives research support from the Department of Defense, Orthopaedic Research and Education Foundation, Minnesota Medical Foundation, and Chest Wall and Spine Deformity Foundation. TH and JC are paid teaching and clinical research consultants for SI-BONE, Inc. Portions of this work have been accepted as an abstract to the 14th Annual Conference of the International Society for the Advancement of Spine Surgery and will be presented as a poster. The authors report no other conflicts of interest in this work.
References
Frymoyer JW. Back pain and sciatica. N Engl J Med. 1988;318(5):291–300. | |
Cassidy JD, Carroll LJ, Côté P. The Saskatchewan health and back pain survey. The prevalence of low back pain and related disability in Saskatchewan adults. Spine (Phila Pa 1976). 1998;23(17):1860–1866; discussion 1867. | |
Manchikanti L, Singh V, Datta S, Cohen SP, Hirsch JA; American Society of Interventional Pain Physicians. Comprehensive review of epidemiology, scope, and impact of spinal pain. Pain Physician. 2009;12(4):E35–E70. | |
Deyo RA, Mirza SK, Martin BI. Back pain prevalence and visit rates: estimates from U.S. national surveys, 2002. Spine. November 1, 2006;31(23):2724–2727. | |
Freburger JK, Holmes GM, Agans RP, et al. The rising prevalence of chronic low back pain. Arch Intern Med. 2009;169(3):251–258. | |
Harkness EF, Macfarlane GJ, Silman AJ, McBeth J. Is musculoskeletal pain more common now than 40 years ago?: Two population-based cross-sectional studies. Rheumatology (Oxford). 2005;44(7):890–895. | |
Dagenais S, Caro J, Haldeman S. A systematic review of low back pain cost of illness studies in the United States and internationally. Spine J. 2008;8(1):8–20. | |
Thorpe KE, Florence CS, Howard DH, Joski P. The rising prevalence of treated disease: effects on private health insurance spending. Health Aff (Millwood). 2005;Suppl Web Exclusives:W5-317-W315–325. | |
Sembrano JN, Polly DW Jr. How often is low back pain not coming from the back? Spine (Phila Pa 1976). 2009;34(1):E27–E32. | |
Bernard TN Jr, Kirkaldy-Willis WH. Recognizing specific characteristics of nonspecific low back pain. Clin Orthop Relat Res. 1987;(217):266–280. | |
Rudolf L. Sacroiliac Joint Arthrodesis-MIS Technique with Titanium Implants: Report of the First 50 Patients and Outcomes. Open Orthop J. 2012;6:495–502. | |
Giannikas KA, Khan AM, Karski MT, Maxwell HA. Sacroiliac joint fusion for chronic pain: a simple technique avoiding the use of metalwork. Eur Spine J. 2004;13(3):253–256. | |
Buchowski JM, Kebaish KM, Sinkov V, Cohen DB, Sieber AN, Kostuik JP. Functional and radiographic outcome of sacroiliac arthrodesis for the disorders of the sacroiliac joint. Spine J. 2005;5(5):520–528; discussion 529. | |
Moore JD Jr. Under new authority. KU Hospital joins movement toward independence. Mod Healthc. 1997;27(7):44, 48. | |
Sachs D, Capobianco R. One year successful outcomes for novel sacroiliac joint arthrodesis system. Ann Surg Innov Res. 2012;6(1):13. | |
Miller LE, Reckling WC, Block JE. Analysis of postmarket complaints database for the iFuse SI Joint Fusion System(R): a minimally invasive treatment for degenerative sacroiliitis and sacroiliac joint disruption. Medical Devices (Auckl). 2013;6:77–84. | |
Ackerman SJ, Polly DW, Yerby S, Kim E, Knight T. What is the Frequency of Minimally Invasive Sacroiliac Joint Fusion Annually in the United States? Paper presented at: 8th Interdisciplinary World Congress on Low Back and Pelvic Pain; October 27–31, 2013; Dubai. | |
Graf C, Battisti WP, Bridges D, et al. Research Methods and Reporting. Good publication practice for communicating company sponsored medical research: the GPP2 guidelines. BMJ. 2009;339:b4330. | |
Schulman KA, Rubenstein LE, Glick HA, Eisenberg JM. Relationships between sponsors and investigators in pharmacoeconomic and clinical research. Pharmacoeconomics. 1995;7(3):206–220. | |
National Center for Health Statistics (2002). Classification of Diseases and Injuries. Available from: http://www.cdc.gov/nchs/data/icd/icd9cm_guidelines_2011.pdf. Accessed January 10, 2014. | |
Consumer Price Index – All Urban Consumers [webpage on the Internet]. Washington, DC: Bureau of Labor and Statistics; 2013. Available from: http://data.bls.gov/timeseries/CUUR0000SAM? include_graphs=false&output_type=column&years_option= all_years. Accessed June 12, 2013. | |
Gore M, Sadosky A, Stacey BR, Tai KS, Leslie D. The burden of chronic low back pain: clinical comorbidities, treatment patterns, and health care costs in usual care settings. Spine (Phila Pa 1976). 2012;37(11):E668–E677. | |
Balu S, Thomas J 3rd. Incremental expenditure of treating hypertension in the United States. Am J Hypertens. 2006;19(8):810–816; discussion 817. | |
Ohsfeldt RL, Gandhi SK, Fox KM, Bullano MF, Davidson M. Medical and cost burden of atherosclerosis among patients treated in routine clinical practice. J Med Econ. 2010;13(3):500–507. | |
American Diabetes Association. Economic costs of diabetes in the U.S. In 2012. Diabetes Care. 2013;36(4):1033–1046. | |
Cebul RD, Rebitzer JB, Taylor LJ, Votruba ME. Unhealthy Insurance Markets: Search Frictions and the Cost and Quality of Health Insurance. Cambridge, MA: National Bureau of Economic Research; 2008. Available from: http://www.nber.org/papers/w14455.pdf?new_window=1%20August%202008. Accessed June 12, 2013. | |
Kleinke JD. The price of progress: prescription drugs in the health care market. Health Aff (Millwood). 2001;20(5):43–60. | |
Ackerman SJ, Polly DW, Knight T, Holt T, Cummings J. Non-Operative Care to Manage Sacroiliac Joint Disruption and Degenerative Sacroiliitis is Costly and Requires High Medical Resource Utilization in the Medicare Population. J Neurosurg Spine. 2013. In press. | |
Rajaee SS, Bae HW, Kanim LE, Delamarter RB. Spinal fusion in the United States: analysis of trends from 1998 to 2008. Spine (Phila Pa 1976). 2012;37(1):67–76. | |
Airaksinen O, Herno A, Turunen V, Saari T, Suomlainen O. Surgical outcome of 438 patients treated surgically for lumbar spinal stenosis. Spine (Phila Pa 1976). 1997;22(19):2278–2282. | |
Jansson KA, Németh G, Granath F, Jönsson B, Blomqvist P. Health-related quality of life (EQ-5D) before and one year after surgery for lumbar spinal stenosis. J Bone Joint Surg Br. 2009;91(2):210–216. | |
Hara N, Oka H, Yamazaki T, et al. Predictors of residual symptoms in lower extremities after decompression surgery on lumbar spinal stenosis. Eur Spine J. 2010;19(11):1849–1854. | |
Ha KY, Lee JS, Kim KW. Degeneration of sacroiliac joint after instrumented lumbar or lumbosacral fusion: a prospective cohort study over five-year follow-up. Spine (Phila Pa 1976). 2008;33(11):1192–1198. | |
Szadek KM, van der Wurff P, van Tulder MW, Zuurmond WW, Perez RS. Diagnostic validity of criteria for sacroiliac joint pain: a systematic review. J Pain. 2009;10(4):354–368. | |
Manchikanti L, Boswell MV, Singh V, et al. Comprehensive evidence-based guidelines for interventional techniques in the management of chronic spinal pain. Pain Physician. 2009;12(4):699–802. | |
Chou R, Loeser JD, Owens DK, et al. Interventional therapies, surgery, and interdisciplinary rehabilitation for low back pain: an evidence-based clinical practice guideline from the American Pain Society. Spine (Phila Pa 1976). 2009;34(10):1066–1077. | |
Manchikanti L, Datta S, Derby R, et al. A critical review of the American Pain Society clinical practice guidelines for interventional techniques: part 1. Diagnostic interventions. Pain Physician. 2010;13(3):E141–E174. | |
Segel JE. Cost-of-Illness Studies – A Primer. Research Triangle Park, NC: RTI-UNC Center of Excellence in Health Promotion Economics; 2006. Available from: http://www.rti.org/pubs/COI_Primer.pdf. Accessed May 15, 2013. | |
Kim MH, Johnston SS, Chu BC, Dalal MR, Schulman KL. Estimation of total incremental health care costs in patients with atrial fibrillation in the United States. Circ Cardiovasc Qual Outcomes. 2011;4(3):313–320. | |
Copher R, Cerulli A, Watkins A, Laura Monsalvo M. Treatment patterns and healthcare system burden of managed care patients with suspected pulmonary arterial hypertension in the United States. J Med Econ. 2012;15(5):947–955. | |
Mehra M, Hill K, Nicholl D, Schadrack J. The burden of chronic low back pain with and without a neuropathic component: a healthcare resource use and cost analysis. J Med Econ. 2012;15(2):245–252. | |
Manchikanti L, Pampati V, Boswell MV, Smith HS, Hirsch JA. Analysis of the growth of epidural injections and costs in the Medicare population: a comparative evaluation of 1997, 2002, and 2006 data. Pain Physician. 2010;13(3):199–212. |
 © 2014 The Author(s). This work is published and licensed by Dove Medical Press Limited. The full terms of this license are available at https://www.dovepress.com/terms.php and incorporate the Creative Commons Attribution - Non Commercial (unported, v3.0) License.
By accessing the work you hereby accept the Terms. Non-commercial uses of the work are permitted without any further permission from Dove Medical Press Limited, provided the work is properly attributed. For permission for commercial use of this work, please see paragraphs 4.2 and 5 of our Terms.
© 2014 The Author(s). This work is published and licensed by Dove Medical Press Limited. The full terms of this license are available at https://www.dovepress.com/terms.php and incorporate the Creative Commons Attribution - Non Commercial (unported, v3.0) License.
By accessing the work you hereby accept the Terms. Non-commercial uses of the work are permitted without any further permission from Dove Medical Press Limited, provided the work is properly attributed. For permission for commercial use of this work, please see paragraphs 4.2 and 5 of our Terms.