")
Back to Journals » Neuropsychiatric Disease and Treatment » Volume 18
Malnutrition and the Risk of Early Neurological Deterioration in Elderly Patients with Acute Ischemic Stroke
Authors Bao Y, Zhang Y, Du C, Ji Y, Dai Y, Jiang W
Received 21 March 2022
Accepted for publication 7 August 2022
Published 20 August 2022 Volume 2022:18 Pages 1779—1787
DOI https://doi.org/10.2147/NDT.S366851
Checked for plagiarism Yes
Review by Single anonymous peer review
Peer reviewer comments 4
Editor who approved publication: Dr Jun Chen
Yuanfei Bao,1,* Yao Zhang,2,* Chaopin Du,1 Yan Ji,1 Yiwei Dai,1 Wei Jiang3
1Department of Neurology, Affiliated Nantong Hospital 3 of Nantong University, Nantong, 226000, People’s Republic of China; 2Department of Neurology, Nanjing Brain Hospital Affiliated to Nanjing Medical University, Nanjing, 210002, People’s Republic of China; 3Department of Neurology, The Affiliated Wuxi No.2 People’s Hospital of Nanjing Medical University, Wuxi, 214000, People’s Republic of China
*These authors contributed equally to this work
Correspondence: Wei Jiang, Department of Neurology, The Affiliated Wuxi No.2 People’s Hospital of Nanjing Medical University, No. 68 Zhongshan Road, Wuxi, 214000, People’s Republic of China, Tel/Fax +86 0510-68562222, Email [email protected]
Background and Purpose: This study aimed to investigate the relationship between malnutrition and early neurological deterioration (END) in elderly patients with acute ischemic stroke in China.
Methods: We used the registry data in the Third Affiliated Hospital of Nantong University and Nanjing Brain Hospital from June 2019 to January 2021. Malnutrition risk was evaluated by controlling nutritional status score (CONUT), geriatric nutritional risk index (GNRI) and prognostic nutritional index (PNI) score, respectively. END was defined as an increment of at least two points in the total NIHSS score within three days after admission. We evaluated the relationship between malnutrition and END with multivariable logistic regression models and reclassification indexes.
Results: A total of 732 elderly patients with first-ever acute ischemic stroke were included in the study. 243 patients developed END. 5.7%, 21.4%, 4.6% patients were classified as moderate to severe malnutrition by CONUT, GNRI and PNI, respectively. Malnutrition was associated with the risk of END for CONUT (odds ratio [OR], 1.210; 95% confidence interval [CI] 1.092– 1.341; P < 0.001), for GNRI (OR, 0.943; 95% CI, 0.919– 0.967; P < 0.001), and for PNI (OR, 0.936; 95% CI, 0.908– 0.965; P < 0.001) in multivariable logistic regression models using the back-ward selection method. The discriminative ability was 0.763 (95% CI, 0.727– 0.798) for CONUT, 0.769 (95% CI, 0.733– 0.805) for GNRI and 0.769 (95% CI, 0.733– 0.805) for PNI after adjusting for confounders. Besides, adding malnutrition indexes into models made the prediction of END more accurate.
Conclusion: Malnutrition was associated with END in elderly Chinese patients with acute ischemic stroke.
Keywords: malnutrition, ischemic stroke, elderly, early neurological deterioration
Introduction
Ischemic stroke is the leading cause of mobility and mortality worldwide.1,2 Despite advances in management in the acute stage, early neurological deterioration (END) still occurs in approximately 5–40% of patients with ischemic stroke and is associated with mobility and mortality.3,4 Elderly patients make up more than 80% of the ischemic stroke population and have unfavorable clinical outcomes.5,6 Previous studies suggested that symptomatic intracranial hemorrhage, malignant vasogenic edema, and older age were associated with END.7,8 The increasingly older age at onset of END makes preventing END in elderly patients important.
Malnutrition is frequent in the elderly and causes various complications that affect the prognosis, such as muscle atrophy and immune system suppression.9 Stroke patients are more likely to be malnourished due to cognitive impairments and dysphagia.10 Besides, evaluating nutrition status could be hard in elderly stroke patients for stroke-related symptoms and age-related changes in body composition.10,11 Controlling nutritional status score (CONUT)12 was calculated from serum albumin, lymphocyte count and total cholesterol and was a helpful indicator of malnutrition in cardiovascular diseases.13 Geriatric nutritional risk index (GNRI)14 was associated with worse prognoses in elderly patients with heart failure using three objective parameters: body height, weight and serum albumin.15 Prognostic nutritional index (PNI)16 was calculated from serum albumin and lymphocyte count and could predict postoperative outcome of cancer surgery.17 Raposeiras Roubín et al integrated three malnutrition tools and found that these tools were associated with poor prognosis in acute coronary syndrome regardless of the malnutrition tools used.18 Hence, we performed this study to investigate the potential role of malnutrition in elderly patients with acute ischemic stroke with three convenient scores.
Methods
The data that support the findings of this study are available from the corresponding author on reasonable request.
Participants
This study was a retrospective analysis of a prospective registry in the Third Affiliated Hospital of Nantong University and Nanjing Brain Hospital from June 2019 to January 2021. All procedures performed in studies involving human participants were in accordance with the ethical standards of the 1964 Helsinki declaration and their later amendments or comparable ethical standards in the Third Affiliated Hospital of Nantong University and Nanjing Brain Hospital. Due to our retrospective nature, patient consent was waived. Patients’ data confidentiality were maintained in the Third Affiliated Hospital of Nantong University and Nanjing Brain Hospital.
Patients were included according to the following criterion: (1) aged ≥ 65 years old; (2) diagnosed as first-ever ischemic stroke with 24 hours of onset; (3) had a brain computed tomography or magnetic resonance imaging scan right before or during hospitalization. Patients were excluded if they: (1) were treated with intravenous thrombolysis or endovascular treatment; (3) early discharge; (4) had no measurement of weight, height, albumin level, lymphocyte count, and total cholesterol level; (5) had a history of malignant tumor, hematological system diseases, severe renal disease, hepatic disease and infectious disease.
Clinical Assessment
Demographic characteristics, vascular risk factors, and radical images were all collected. Laboratory data were routinely collected within 24 hours of hospital admission. Blood pressure was measured immediately after admission. Pneumonia during acute stroke was recorded. Smoking and drinking status were collected using a face-to-face questionnaire. Stroke subtypes were classified according to the trial of ORG 10172 in Acute Stroke Treatment classification (TOAST).19 Infarct sites were based on the brain computed tomography or magnetic resonance imaging scan right before or during hospitalization.
Definition of END
The baseline stroke severity was assessed with National Instituted of Health Stroke Scale (NIHSS).20 END was defined as an increment of at least two points in the total NIHSS score within three days after admission.3,21
Malnutrition Indexes
CONUT score was derived from the level of total cholesterol, serum albumin, and lymphocyte count and was calculated according to the following formula: albumin (g/dl): ≥3.5 (0), 3–3.4 (2), 2.9–2.9 (4), <2.5 (6), total cholesterol (mg/dl): ≥180 (0), 140–179 (1), 100–139 (2), <100 (3) lymphocyte count (109/l): ≥1.6 (0), 1.2–1.59 (1), 0.8–1.19 (2), <0.8 (3). Nutritional status was defined according to scores: absent (0–1), mild (2–4), moderate (5–8), severe (9–12) malnutrition.12
GNRI score was calculated with the following formula: 1.489 × serum albumin (g/l) + 41.7 × (current weight in kilograms/ideal weight). Ideal weight was measured with the Lorenz formulas: height - 100 - ([height – 150]/4) for men and height - 100 - ([height −150]/2.5) for women. (Current weight in kilograms /ideal weight) was set to 1 when the current weight was greater than the ideal body weight. Nutritional status was classified according to scores: absent (≥100), mild (97.50–99.99), moderate (83.50–97.49), and severe (<83.50) malnutrition.14
PNI score was calculated using the formula: 10 × serum albumin (g/dl) + 0.005 × total lymphocyte count (/mm3). Nutritional status was classified according to scores: absent (>38), moderate (35–38), and severe (<35) malnutrition.16
Statistical Analysis
Continuous variables were presented as mean ± SD or median (interquartile range, IQR) and compared with t-test or Mann–Whitney U-test as appropriate. Categorical variables were presented as n (%) and compared with χ2 test or Fisher exact test as appropriate. Multiple imputations with chain equations were performed to deal with missing values.
Variables were selectively included in logistic regression models to explore the relationship between malnutrition and END in the elderly with acute ischemic stroke. Model 1 was adjusted for age, sex, atrial fibrillation, hypertension, diabetes mellitus, hyperlipidemia, coronary heart disease, smoking, and drinking. Model 2 was adjusted for variables with a significance level of < 0.1 in univariable logistic regression analysis using a back-ward selection method except for variables included in the GNRI, CONUT, and PNI scores.
We used receiver operating characteristic curves with variables in model 2 to explore the discrimination of malnutrition indexes. We applied restricted cubic splines with 4 knots (at 5th, 35th, 65th, and 95th percentiles) to explore the pattern of the association between malnutrition indexes and END adjusted for variables in model 2.22 Additionally, we used the net reclassification index and integrated discrimination improvement to estimate the improvement of predictive performance after adding malnutrition indexes into different models.23
All statistical tests were conducted with R statistical software version 4.1.0. (R Foundation, Vienna, Austria) and a two-sided P value <0.05 was considered to be statistically significant.
Results
A total of 732 elderly patients with first-ever acute ischemic stroke were included in the study. 243 patients developed END within three days after admission (Table 1). 494 (67.5%) patients were male. The median age of patients was 71 [IQR, 67–75] years. 5.7% for CONUT, 21.4% for GNRI, 4.6% for PNI and 2.9% for all three tools were classified as moderate to severe malnutrition, respectively (Table 1, Supplementary Table 1). Compared with patients without END, those with END had a higher risk of malnutrition according to CONUT (P = 0.002), GNRI (P < 0.001) and PNI score (P = 0.001), older age (P = 0.045), lower body weight (P < 0.001), body mass index (P < 0.001), higher systolic blood pressure (P = 0.001), higher proportion of diabetes mellitus (P < 0.001), hypertension (P = 0.012), large-artery atherosclerosis and cardio embolic stroke (P < 0.001), lower level of triglyceride (P = 0.035), higher level of low-density lipoprotein (P = 0.041), fasting plasma glucose (P < 0.001), c-reactive protein (P < 0.001) and albumin (P < 0.001, Table 1).
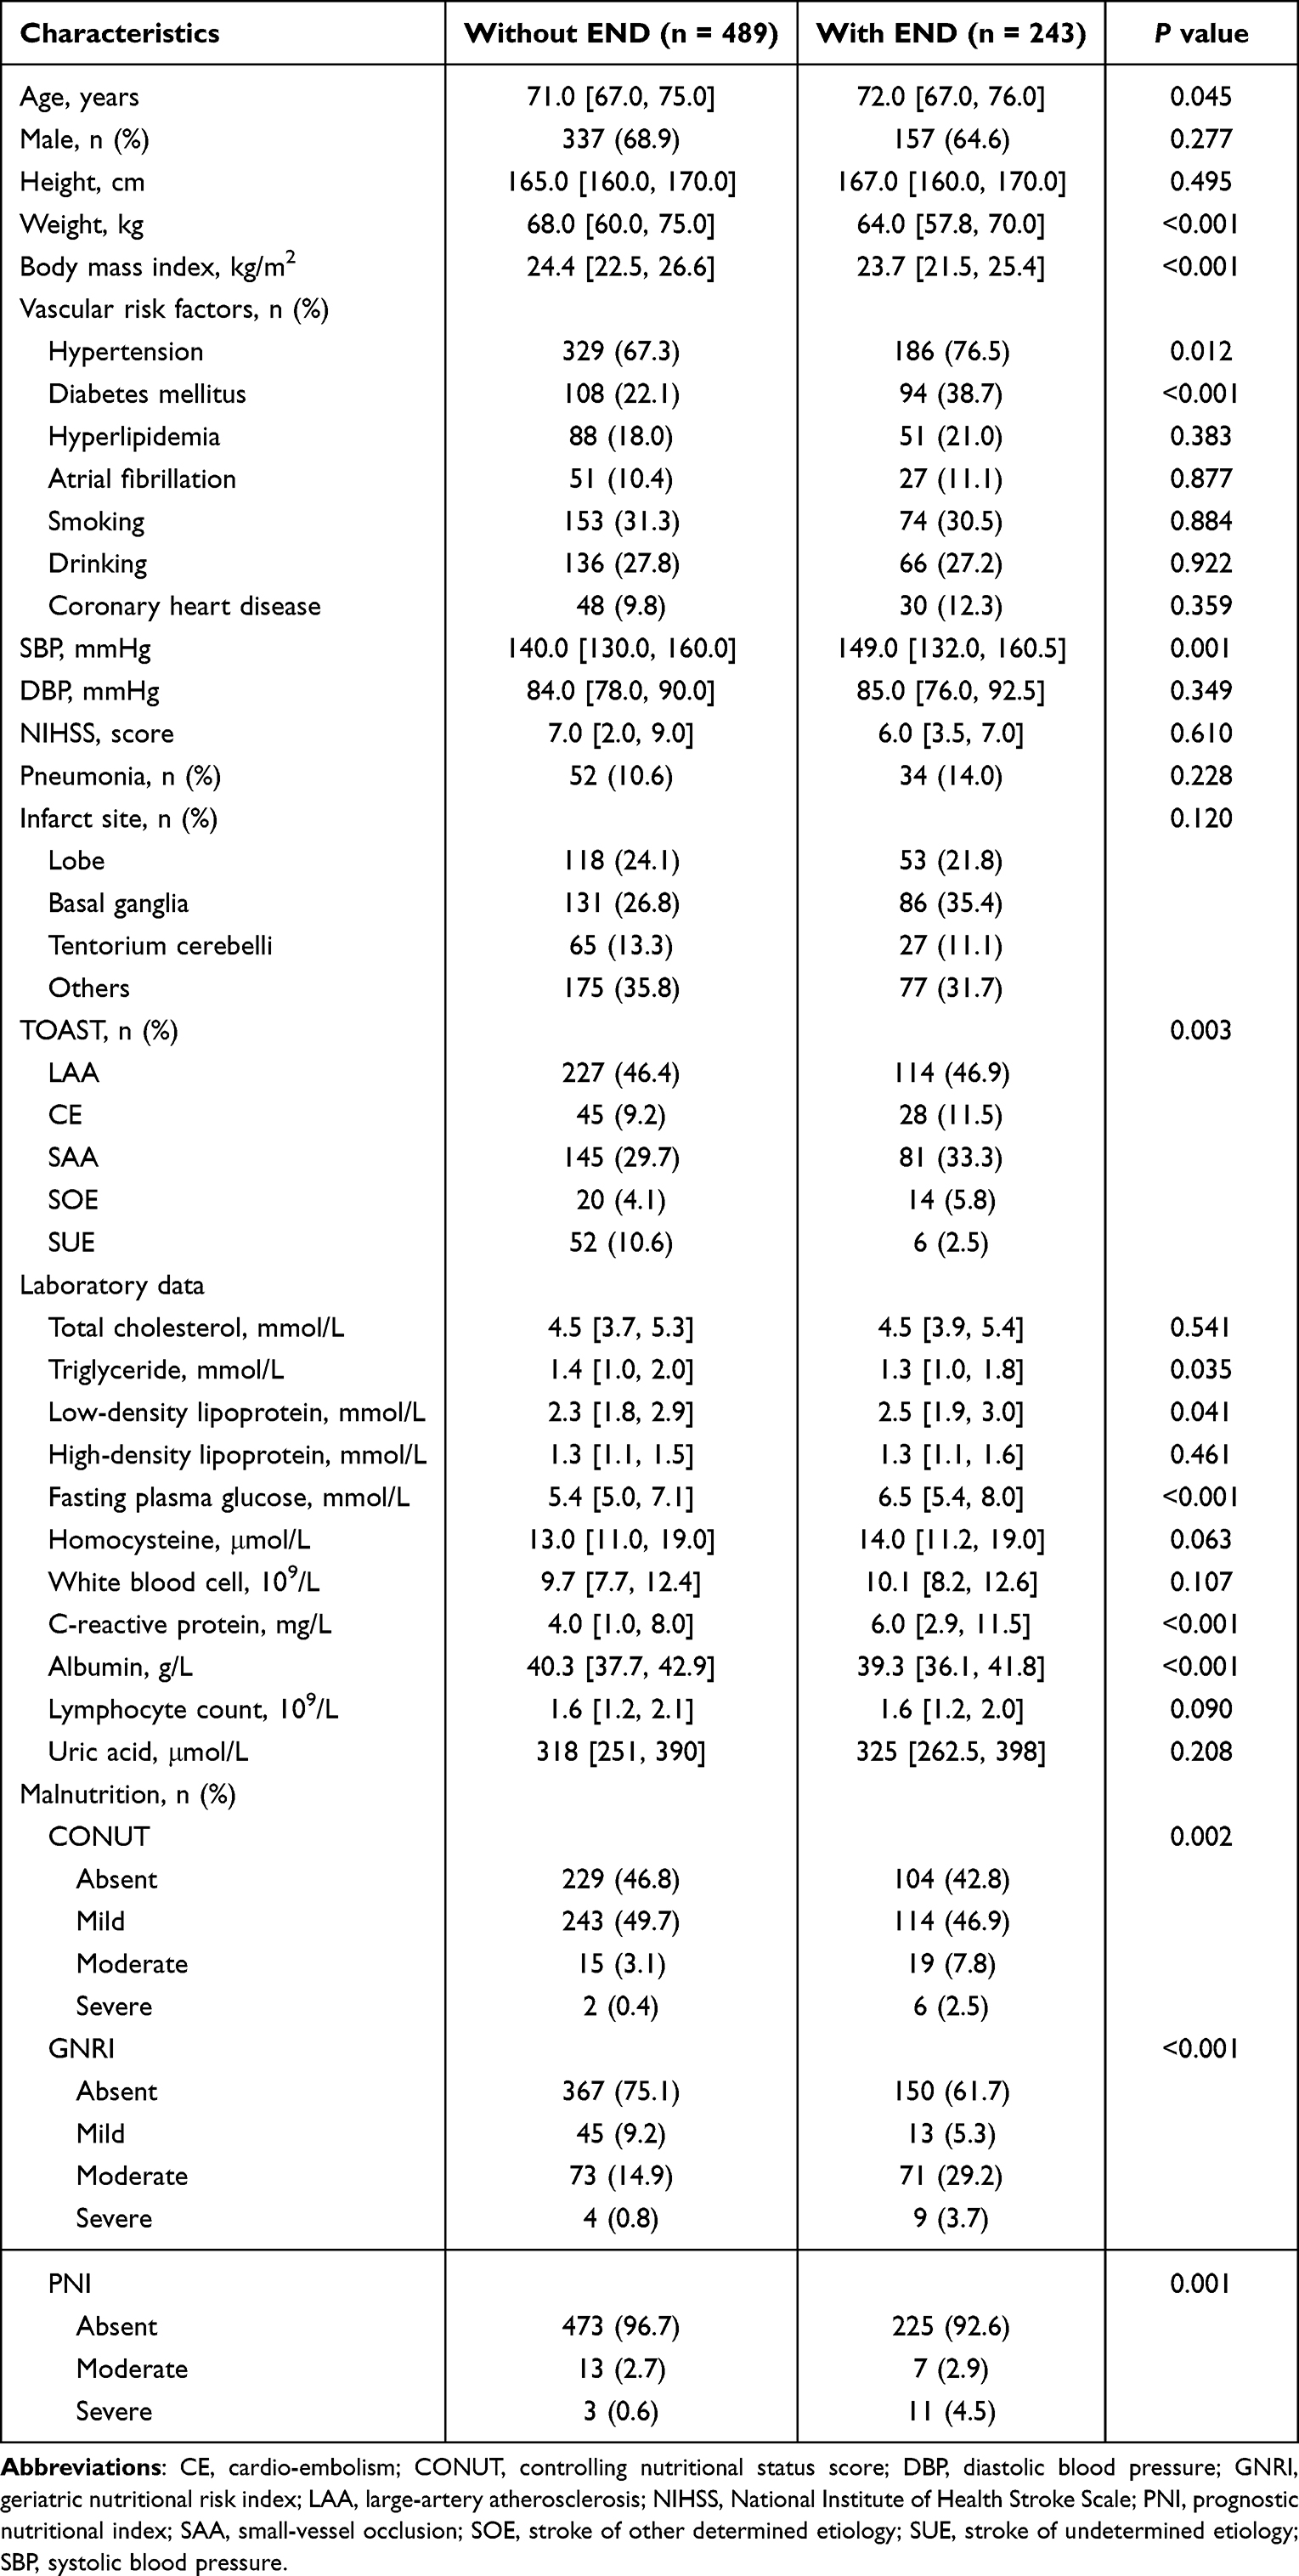 |
Table 1 Characteristics of Patients with or Without END |
Malnutrition indexes were associated with END in elderly patients with acute ischemic stroke in univariable logistic regression models (Supplementary Table 2). After adjusting for the potential cofounders, the association remained significant in model 1 (Table 2). Variables included in the model 2 after back-ward selecting were diabetes mellitus, hypertension, c-reactive protein, stroke subtype, homocysteine, triglyceride and body mass index for CONUT (odds ratio [OR], 1.210; 95% confidence interval [CI], 1.092–1.341; P < 0.001), for GNRI (OR, 0.943; 95% CI, 0.919–0.967; P < 0.001) and for PNI (OR, 0.936; 95% CI, 00.908–0.965; P < 0.001, Table 2, Supplementary Table 3).
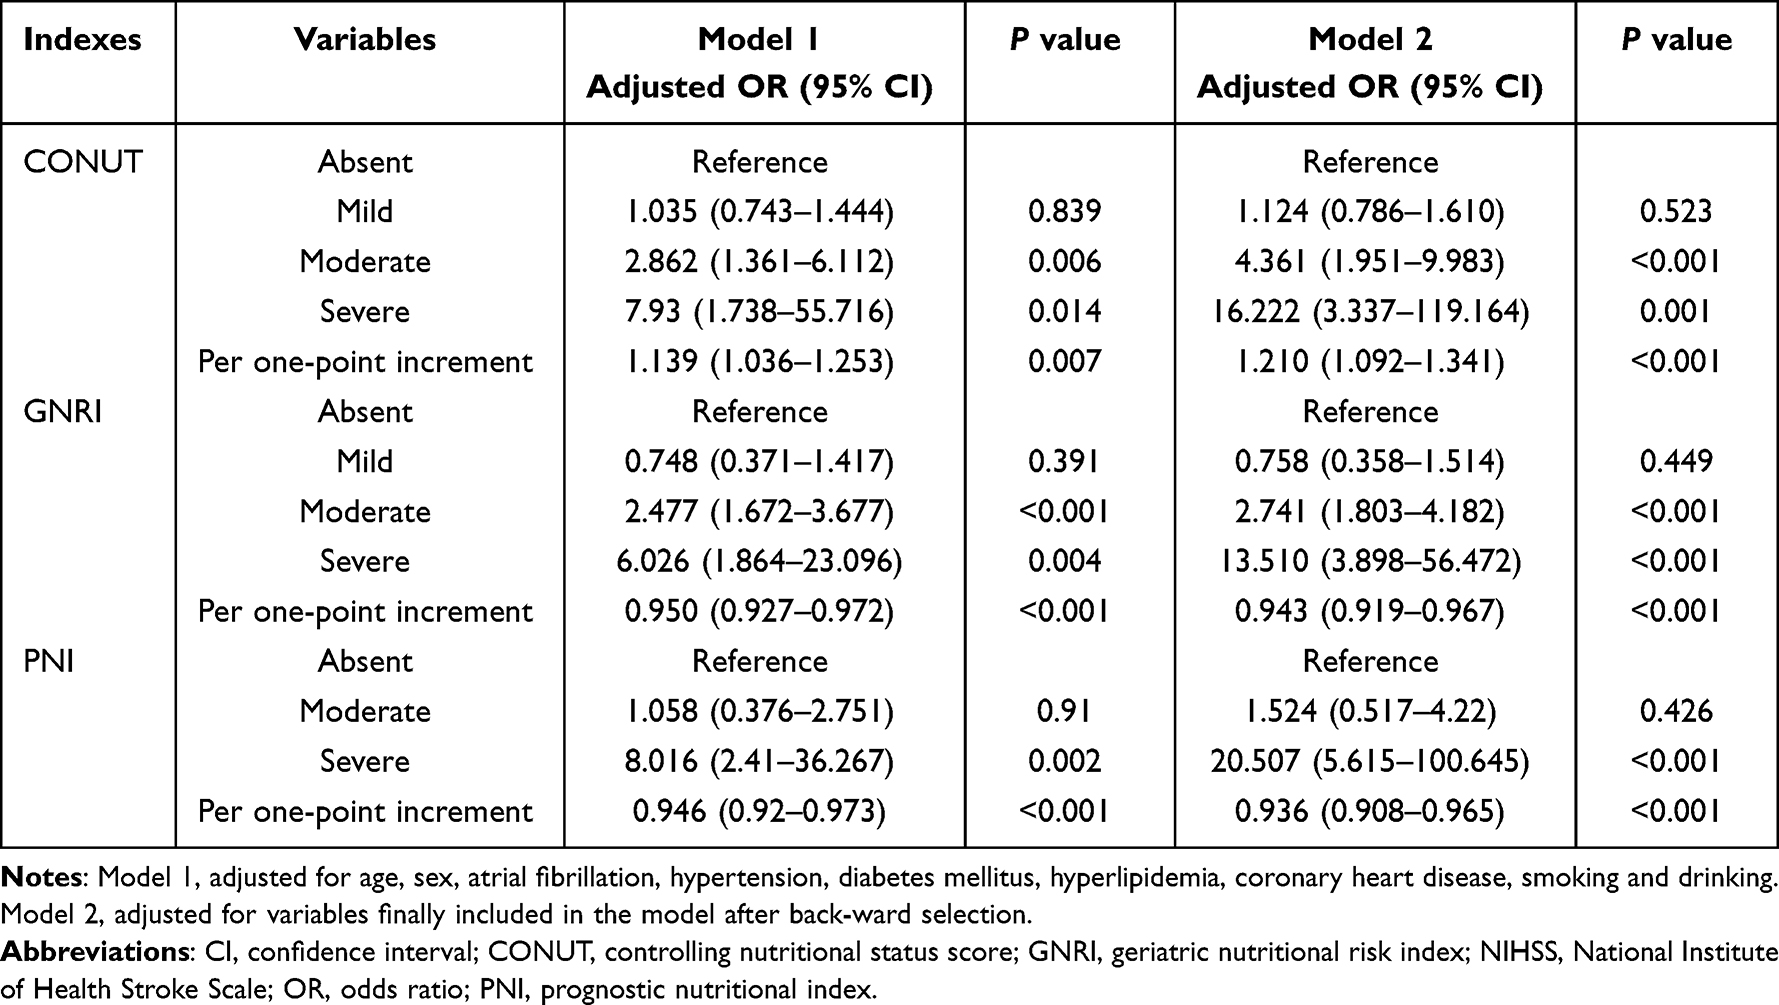 |
Table 2 Multivariable Analysis of Malnutrition Indexes and the Risk of END |
The discriminative ability was 0.763 (95% CI, 0.727–0.798) for CONUT, 0.769 (95% CI, 0.733–0.805) for GNRI, and 0.769 (95% CI, 0.733–0.805) for PNI score (Figure 1). Furthermore, adding malnutrition indexes to model 2 slightly improved the continuous NRI (CONUT, 0.235; 95% CI, 0.087–0.392; P = 0.002; GNRI, 0.293; 95% CI, 0.141–0.445; P < 0.001; PNI, 0.219; 95% CI, 0.066–0.372; P = 0.005), categorical NRI (CONUT, 0.076; 95% CI, 0.003–0.122; P = 0.001 GNRI, 0.078; 95% CI, 0.023–0.132; P = 0.005; PNI, 0.086; 95% CI, 0.033–0.139; P = 0.002) and IDI (CONUT, 0.014; 95% CI, 0.003–0.024; P = 0.011; GNRI, 0.027; 95% CI, 0.014–0.445; P < 0.001; PNI, 0.023; 95% CI, 0.011–0.035; P = 0.005, Supplementary Table 4).
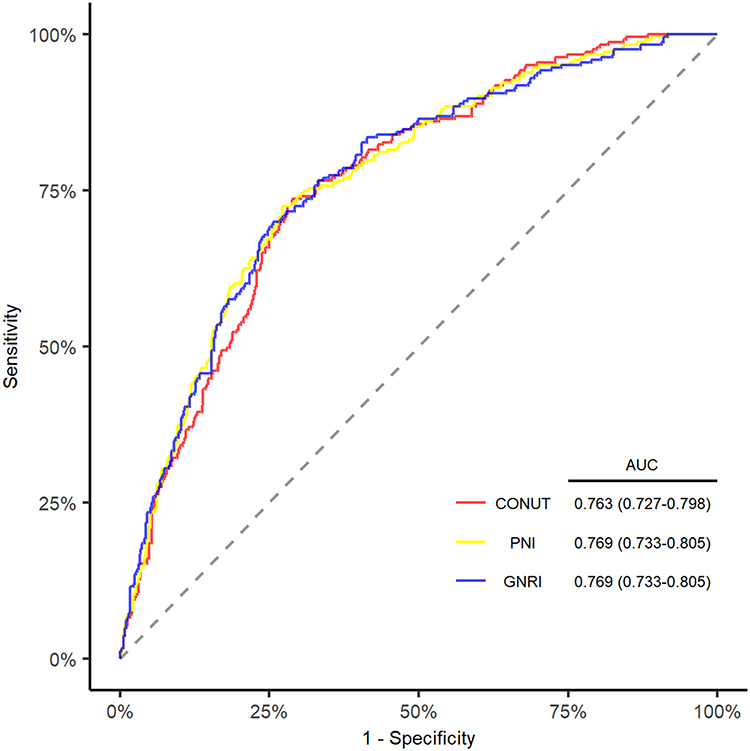 |
Figure 1 ROC Curve and AUC for the prediction of END with 3 Malnutrition Scores. Abbreviations: AUC, area under curve, CONUT, controlling nutritional status score; GNRI, geriatric nutritional risk index; PNI, prognostic nutritional index, ROC, receiver operating characteristic curve. |
Multiple-adjusted restricted cubic spline regression showed an ascending trend of CONUT score (P = 0.025 for nonlinearity, Figure 2A), a descending trend of GNRI (P = 0.004 for nonlinearity, Figure 2B), and PNI score (P = 0.182 for nonlinearity, Figure 2C) with the risk of END in elderly patients with acute ischemic stroke.
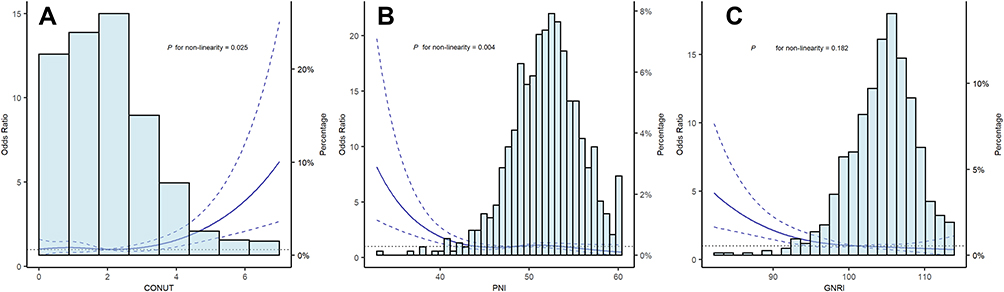 |
Figure 2 Restricted cubic spline with 4 knots (at fifth, 35th, 65th, 95th percentiles) for 3 malnutrition scores adjusted for variables included in model 2. The solid line indicated the odds ratio and the dashed lines indicated the corresponding 95% confidence interval. Subfigure (A), CONUT; subfigure (B), PNI; subfigure (C), GNRI. Abbreviations: CONUT, controlling nutritional status score; GNRI, geriatric nutritional risk index; PNI, prognostic nutritional index. |
Discussion
In the present study, we investigated the relationship between malnutrition and END in elderly patients with first-ever acute ischemic stroke using easily calculated screening scores. Our findings suggested that malnutrition was prevalent in elderly stroke patients and associated with an increased risk of END in the acute phase. Besides, adding malnutrition indexes into models made the prediction of END more accurate.
Previous studies reported that END was associated with poor prognosis in patients with acute ischemic stroke.4,24,25 Geng et al conducted a retrospective analysis in three stroke units and reported that 32% of patients with ischemic stroke experienced END.26 Identifying predictors of END at an early stage could improve the acute management of stroke patients. The prevalence of malnutrition varies from 6 to 62.5% in stroke patients owing to different tools and measuring time.27 Zhang et al reported that 1.95–5.89% of patients with acute ischemic stroke had a moderate to severe malnutrition risk.28 Due to the inclusion criterion of the elderly population only, the proportion of END (33.2%) and moderate to severe malnutrition risk (4.6–21.4%) in our study were higher than in previous reports.
CONUT, GNRI, and PNI scores are convenient tools that might be more suitable for stroke patients because of objective indicators. Zhang et al performed a nationwide study and found that malnutrition was associated with long-term mobility and mortality in acute ischemic stroke.28 The FOOD trial proved that ischemic stroke patients who were malnourished at admission had poor six-month prognoses.29 It is recommended that enteral diets, nutritional supplements, and nasogastric tubes should be supplied for patients with malnutrition or those at malnutrition risk.30 Daily nutrition supplements could improve nutrition and functional outcomes in the elderly population, and protein-based diets might reduce malnutrition risk in the elderly.31,32 To our knowledge, the association between malnutrition scores and END in acute ischemic stroke has yet to be investigated.
The components in the formula of scores might explain the relationship between malnutrition and END in elderly stroke patients. Previous studies showed that inflammatory response played an important role in the progression and early neurological outcome of acute ischemic stroke.33 Lymphocyte counts are a neuroprotective marker and could promote neurological improvements.34 Kim et al found that lower lymphocyte counts were linked to poor functional outcomes in the long term.35 Duan et al suggested that neutrophil-to-lymphocyte independently predicted SICH and functional outcomes in large vessel occlusion ischemic stroke.36 Serum albumin is a neuroprotective protein with multifunctional properties.37 Belayev et al found that human albumin therapy improved neurological function and reduced the swelling and infarction volume in stroke animal models.38 Dziedzic et al showed that lower albumin increased the risk of poor outcomes three months after ischemic stroke.37 In our study, patients with END had lower levels of albumin, which represented the reduced neuroprotective state and might lead to the occurrence of END in patients with acute ischemic stroke. Total cholesterol remained a controversial indicator in ischemic stroke. In our study, total cholesterol was not significant in the univariate analysis, and the CONUT score, which was the only score that included total cholesterol in the formula, had an average performance among the three malnutrition tools. Ryu et al investigated the association between serum lipid profile and END and found that hyperlipidemia increased END risk in acute ischemic stroke.39 However, Zhao et al found that patients with lower total cholesterol levels had poor outcomes in acute ischemic stroke and suggested that physicians should make suitable treatments based on cholesterol levels.40
In addition, our study found that diabetes mellitus, c-reactive protein, homocysteine, triglyceride, and stroke subtype were significantly associated with END in elderly stroke patients. Girot et al found that diabetes mellitus was an independent predictor of END in acute ischemic stroke treated with endovascular treatment.41 Huang et al found that admission glucose increased END risk in females with acute ischemic stroke.42 Duan et al explored the relation between c-reactive protein and END in stroke patients and reported that c-reactive protein level was independently related to END.43 Kwon et al reanalyzed data from the CAIST trial and found that elevated homocysteine increased the risk of END.44 Cui et al performed a secondary analysis of the INTRECIS trial and suggested that TOAST classification was associated with END in patients with anterior circulation stroke.45 Zhang et al conducted a prospective cohort study and found that hypertriglyceridemia was related to an increased risk of END in acute ischemic stroke.8
Our study has several limitations. Firstly, it was a retrospective study without a younger age group, which might generate sampling biases. Secondly, the definition of END varied across different studies, and we applied the acknowledged definition of END reported in a systematic review.3,21 Thirdly, the mechanism of END would differ between patients receiving reperfusion therapy and patients without receiving reperfusion therapy. We excluded patients receiving reperfusion therapy to better assess the association between malnutrition and END. Forth, although we limited the sampling time of blood parameters to 24 hours at admission, the variation of sampling time might still generate biases. Finally, limited by the study design, we could not compare the performance of malnutrition scores to other scores that were collected in a prospective study design.
In conclusion, our study found that malnutrition was associated with the risk of END in elderly Chinese patients with acute ischemic stroke and recommended the GRNI score for screening malnutrition in elderly patients with acute ischemic stroke because of the higher AUC value and better reclassification indexes. We suggested that clinical physicians should routinely screen malnutrition in elderly stroke patients and identify patients who might benefit from nutritional supplementation. However, we still warranted further investigations into potential mechanisms and whether nutrition intervention might mitigate the risk of END.
Disclosure
The authors have declared no conflicts of interest with respect to the authorship or publication of this article.
References
1. Wu S, Wu B, Liu M, et al. Stroke in China: advances and challenges in epidemiology, prevention, and management. Lancet Neurol. 2019;18:394–405. doi:10.1016/S1474-4422(18)30500-3
2. Forti P, Maioli F, Procaccianti G, et al. Independent predictors of ischemic stroke in the elderly: prospective data from a stroke unit. Neurology. 2012;80:29–38. doi:10.1212/WNL.0b013e31827b1a41
3. Seners P, Turc G, Oppenheim C, Baron JC. Incidence, causes and predictors of neurological deterioration occurring within 24 h following acute ischaemic stroke: a systematic review with pathophysiological implications. J Neurol Neurosurg Psychiatry. 2015;86:87–94. doi:10.1136/jnnp-2014-308327
4. Arenillas JF, Rovira A, Molina CA, Grivé E, Montaner J, Alvarez-Sabín J. Prediction of early neurological deterioration using diffusion- and perfusion-weighted imaging in hyperacute middle cerebral artery ischemic stroke. Stroke. 2002;33:2197–2203. doi:10.1161/01.STR.0000027861.75884.DF
5. Wang D, Hao Z, Tao W, et al. Acute ischemic stroke in the very elderly Chinese: risk factors, hospital management and one-year outcome. Clin Neurol Neurosurg. 2011;113:442–446. doi:10.1016/j.clineuro.2011.01.005
6. Chen R-L, Balami JS, Esiri MM, Chen L-K, Buchan AM. Ischemic stroke in the elderly: an overview of evidence. Nat Rev Neurol. 2010;6:256–265. doi:10.1038/nrneurol.2010.36
7. Siegler JE, Martin-Schild S. Early Neurological Deterioration (END) after stroke: the END depends on the definition. Int J Stroke. 2011;6:211–212. doi:10.1111/j.1747-4949.2011.00596.x
8. Zhang X, Sun Z, Ding C, et al. Metabolic syndrome augments the risk of early neurological deterioration in acute ischemic stroke patients independent of inflammatory mediators: a hospital-based prospective study. Oxid Med Cell Longev. 2016;2016:8346301. doi:10.1155/2016/8346301
9. Isabel TD, Correia M. The impact of malnutrition on morbidity, mortality, length of hospital stay and costs evaluated through a multivariate model analysis. Clinl Nutr. 2003;22:235–239. doi:10.1016/S0261-5614(02)00215-7
10. Sabbouh T, Torbey MT. Malnutrition in stroke patients: risk factors, assessment, and management. Neurocrit Care. 2018;29:374–384. doi:10.1007/s12028-017-0436-1
11. Ozkaya I, Gurbuz M. Malnourishment in the overweight and obese elderly. Nutr Hosp. 2019;36:39–42. doi:10.20960/nh.02062
12. Ignacio J, de Ulíbarri A, González-Madroño NGP, et al. CONUT: a tool for controlling nutritional status. First validation in a hospital population. Nutr Hosp. 2005;20:38–45.
13. Nakagomi A, Kohashi K, Morisawa T, et al. Nutritional status is associated with inflammation and predicts a poor outcome in patients with chronic heart failure. J Atheroscler Thromb. 2016;23:713–727. doi:10.5551/jat.31526
14. Bouillanne O, Morineau G, Dupont C, et al. Geriatric nutritional risk index: a new index for evaluating at-risk elderly medical patients. Am J Clin Nutr. 2005;82:777–783. doi:10.1093/ajcn/82.4.777
15. Honda Y, Nagai T, Iwakami N, et al. Usefulness of geriatric nutritional risk index for assessing nutritional status and its prognostic impact in patients aged ≥65 years with acute heart failure. Am J Cardiol. 2016;118:550–555. doi:10.1016/j.amjcard.2016.05.045
16. Buzby GP, Mullen JL, Matthews DC, Hobbs CL, Rosato EF. Prognostic nutritional index in gastrointestinal surgery. Am J Surg. 1980;139:160–167. doi:10.1016/0002-9610(80)90246-9
17. Jeon HG, Choi DK, Sung HH, et al. Preoperative prognostic nutritional index is a significant predictor of survival in renal cell carcinoma patients undergoing nephrectomy. Ann Surg Oncol. 2016;23:321–327. doi:10.1245/s10434-015-4614-0
18. Raposeiras Roubín S, Abu Assi E, Cespón Fernandez M, et al. Prevalence and prognostic significance of malnutrition in patients with acute coronary syndrome. J Am Coll Cardiol. 2020;76:828–840. doi:10.1016/j.jacc.2020.06.058
19. Adams HP
20. Brott T, Adams HP
21. Sun W, Liu W, Zhang Z, et al. Asymmetrical cortical vessel sign on susceptibility-weighted imaging: a novel imaging marker for early neurological deterioration and unfavorable prognosis. Eur J Neurol. 2014;21:1411–1418. doi:10.1111/ene.12510
22. Durrleman S, Simon R. Flexible regression models with cubic splines. Stat Med. 1989;8:551–561. doi:10.1002/sim.4780080504
23. Pencina MJ, D’Agostino RB Sr, D’Agostino RB Jr, Vasan RS. Evaluating the added predictive ability of a new marker: from area under the ROC curve to reclassification and beyond. Stat Med. 2008;27:157–172. doi:10.1002/sim.2929
24. Helleberg BH, Ellekjaer H, Indredavik B. Outcomes after early neurological deterioration and transitory deterioration in acute ischemic stroke patients. Cerebrovasc Dis. 2016;42:378–386. doi:10.1159/000447130
25. Kim YD, Song D, Kim EH, et al. Long-term mortality according to the characteristics of early neurological deterioration in ischemic stroke patients. Yonsei Med J. 2014;55:669–675. doi:10.3349/ymj.2014.55.3.669
26. Geng -H-H, Wang Q, Li B, et al. Early neurological deterioration during the acute phase as a predictor of long-term outcome after first-ever ischemic stroke. Medicine. 2017;96:e9068. doi:10.1097/MD.0000000000009068
27. Foley NC, Salter KL, Robertson J, Teasell RW, Woodbury MG. Which reported estimate of the prevalence of malnutrition after stroke is valid? Stroke. 2009;40:e66–74. doi:10.1161/STROKEAHA.108.518910
28. Zhang G, Pan Y, Zhang R, et al. Prevalence and prognostic significance of malnutrition risk in patients with acute ischemic stroke: results from the third china national stroke registry. Stroke. 2022;53:111–119. doi:10.1161/STROKEAHA.121.034366
29. Collaboration FT. Poor nutritional status on admission predicts poor outcomes after stroke. Stroke. 2003;34:1450–1456. doi:10.1161/01.STR.0000074037.49197.8C
30. Burgos R, Bretón I, Cereda E, et al. ESPEN guideline clinical nutrition in neurology. Clin Nutr. 2018;37:354–396. doi:10.1016/j.clnu.2017.09.003
31. Madeira T, Severo M, Oliveira A, Gorjão Clara J, Lopes C. The association between dietary patterns and nutritional status in community-dwelling older adults-The PEN-3S study. Eur J Clin Nutr. 2021;75:521–530. doi:10.1038/s41430-020-00745-w
32. Chew STH, Tan NC, Cheong M, et al. Impact of specialized oral nutritional supplement on clinical, nutritional, and functional outcomes: a randomized, placebo-controlled trial in community-dwelling older adults at risk of malnutrition. Clin Nutr. 2021;40:1879–1892. doi:10.1016/j.clnu.2020.10.015
33. Gong P, Liu Y, Gong Y, et al. The association of neutrophil to lymphocyte ratio, platelet to lymphocyte ratio, and lymphocyte to monocyte ratio with post-thrombolysis early neurological outcomes in patients with acute ischemic stroke. J Neuroinflammation. 2021;18:51. doi:10.1186/s12974-021-02090-6
34. Macrez R, Ali C, Toutirais O, et al. Stroke and the immune system: from pathophysiology to new therapeutic strategies. Lancet Neurol. 2011;10:471–480. doi:10.1016/S1474-4422(11)70066-7
35. Kim J, Song T-J, Park JH, et al. Different prognostic value of white blood cell subtypes in patients with acute cerebral infarction. Atherosclerosis. 2012;222:464–467. doi:10.1016/j.atherosclerosis.2012.02.042
36. Duan Z, Wang H, Wang Z, et al. Neutrophil-lymphocyte ratio predicts functional and safety outcomes after endovascular treatment for acute ischemic stroke. Cerebrovasc Dis. 2018;45:221–227. doi:10.1159/000489401
37. Dziedzic T, Slowik A, Szczudlik A. Serum albumin level as a predictor of ischemic stroke outcome. Stroke. 2004;35:e156–8. doi:10.1161/01.STR.0000126609.18735.be
38. Belayev L, Busto R, Zhao W, Clemens JA, Ginsberg MD. Effect of delayed albumin hemodilution on infarction volume and brain edema after transient middle cerebral artery occlusion in rats. J Neurosurg. 1997;87:595–601. doi:10.3171/jns.1997.87.4.0595
39. Ryu W-S, Schellingerhout D, Jeong S-W, Nahrendorf M, Kim D-E. Association between serum lipid profiles and early neurological deterioration in acute ischemic stroke. J Stroke Cerebrovasc Dis. 2016;25:2024–2030. doi:10.1016/j.jstrokecerebrovasdis.2016.05.009
40. Zhao W, An Z, Hong Y, et al. Low total cholesterol level is the independent predictor of poor outcomes in patients with acute ischemic stroke: a hospital-based prospective study. BMC Neurol. 2016;16:36. doi:10.1186/s12883-016-0561-z
41. Girot J-B, Richard S, Gariel F, et al. Predictors of unexplained early neurological deterioration after endovascular treatment for acute ischemic stroke. Stroke. 2020;51:2943–2950. doi:10.1161/STROKEAHA.120.029494
42. Huang Z-X, Huang Y, Zeng J, et al. Admission glucose levels may increase the risk for early neurological deterioration in females with acute ischemic stroke. Front Neurol. 2020;11:548892. doi:10.3389/fneur.2020.548892
43. Duan Z, Guo W, Tang T, Tao L, Gong K, Zhang X. Relationship between high-sensitivity C-reactive protein and early neurological deterioration in stroke patients with and without atrial fibrillation. Heart Lung. 2020;49:193–197. doi:10.1016/j.hrtlng.2019.10.009
44. Kwon H-M, Lee Y-S, Bae H-J, Kang D-W. Homocysteine as a predictor of early neurological deterioration in acute ischemic stroke. Stroke. 2014;45:871–873. doi:10.1161/STROKEAHA.113.004099
45. Cui Y, Meng W-H, Chen H-S. Early neurological deterioration after intravenous thrombolysis of anterior vs posterior circulation stroke: a secondary analysis of INTRECIS. Sci Rep. 2022;12:3163. doi:10.1038/s41598-022-07095-6
 © 2022 The Author(s). This work is published and licensed by Dove Medical Press Limited. The full terms of this license are available at https://www.dovepress.com/terms.php and incorporate the Creative Commons Attribution - Non Commercial (unported, v3.0) License.
By accessing the work you hereby accept the Terms. Non-commercial uses of the work are permitted without any further permission from Dove Medical Press Limited, provided the work is properly attributed. For permission for commercial use of this work, please see paragraphs 4.2 and 5 of our Terms.
© 2022 The Author(s). This work is published and licensed by Dove Medical Press Limited. The full terms of this license are available at https://www.dovepress.com/terms.php and incorporate the Creative Commons Attribution - Non Commercial (unported, v3.0) License.
By accessing the work you hereby accept the Terms. Non-commercial uses of the work are permitted without any further permission from Dove Medical Press Limited, provided the work is properly attributed. For permission for commercial use of this work, please see paragraphs 4.2 and 5 of our Terms.