")
Back to Journals » OncoTargets and Therapy » Volume 12
Malic enzyme 1 (ME1) is a potential oncogene in gastric cancer cells and is associated with poor survival of gastric cancer patients
Authors Shi Y, Zhou S, Wang P, Guo Y, Xie B, Ding S
Received 28 January 2019
Accepted for publication 17 June 2019
Published 11 July 2019 Volume 2019:12 Pages 5589—5599
DOI https://doi.org/10.2147/OTT.S203228
Checked for plagiarism Yes
Review by Single anonymous peer review
Peer reviewer comments 2
Editor who approved publication: Dr William C. Cho
Yanyan Shi,1 Siliang Zhou,2 Pan Wang,3 Yanlei Guo,4 Bingteng Xie,3 Shigang Ding4
1Peking University Third Hospital, Research Center of Clinical Epidemiology, Beijing 100191, People’s Republic of China; 2Peking University Health Science Center, School of Public Health, Beijing 100191, People’s Republic of China; 3Peking University Third Hospital, Department of Obstetrics and Gynecology, Beijing 100191, People’s Republic of China; 4Peking University Third Hospital, Department of Gastroenterology, Beijing 100191, People’s Republic of China
Background and objective: Gastric cancer is one of the most common cancers worldwide. However, the mechanisms associated with this disease are still not clear. Malic enzyme 1 (ME1) is a metabolic enzyme that is overexpressed in various cancers. Here, we examined whether it is involved in gastric cancer.
Methods: ME1 expression was knocked down in the gastric cancer cell line SGC7901. Cell growth and migration were measured using a real-time microelectronic cell sensor system. Cell invasion was measured using a Transwell assay. Cell cycle analysis was also performed to examine cell cycle arrest. A gastric cancer tissue microarray of gastric cancer was stained using immunohistochemistry. ME1 expression levels were also statistically analysed.
Results: ME1 knockdown in gastric cancer SGC7901 cells significantly inhibited cell proliferation, migration, and invasion. Cell cycle arrest was induced in the G2 phase. Further, ME1 expression was significantly correlated with gastric cancer patient prognosis based on both univariable and multivariable survival analysis. No significant difference was found between ME1 expression in gastric cancer tissues and that in adjacent tissues.
Conclusion: Our results provide evidence that ME1 is a key factor for gastric cancer. ME1 might be pro-oncogenic during both the development and migration of gastric cancer; it also might be related to gastric cancer patient survival.
Keywords: gastric cancer, malic enzyme 1, cell proliferation, migration, patients’ survival
Introduction
Gastric cancer is one of the most common cancers worldwide. Further, it remains a global health burden even though incidence rates are generally low in Northern America, Northern Europe, and Africa.1 In Eastern Asia, the incidence rates of gastric cancer are highest and are as high as 32.1 per 100,000 individuals. Accordingly, China contributes 40% of new global cases every year.2 Moreover, gastric cancer is the fifth most-frequently diagnosed cancer and the third leading cause of cancer-associated death according to global cancer statistics.3 It is thus urgent to develop effective gastric cancer-control plans. As such, investigations on potential target genes are essential for prevention strategies and targeted therapies for cancer-control planning.4
Recently, perturbations in cellular metabolism have been linked to the development of cancer.5 Metabolism affects all aspects of cellular functions. Specifically, the complex regulatory events and interactions that occur during metabolism function to maintain cell homeostasis and support the shift in cell status from rest to proliferation. Cancer cells often exhibit reprogrammed metabolism, as a mechanism to satisfy their requirement for increased cell proliferation, which demands abundant NADPH generation.6 Malic enzyme 1 (ME1), a cytosolic protein, is NADP-dependent and responsible for NADPH generation. It is widely expressed in the human body and its sequence is highly conserved among species, indicating that it is responsible for important biological functions; moreover, critical effects occur when its expression is disturbed.7 For example, the inhibition of ME1 has been found to disrupt cellular metabolism and the association between this enzyme and cancer has generated much attention recently.8–11
In this study, we investigated the effects of ME1 knockdown on gastric cancer proliferation and migration using the cell line SGC7901. ME1 expression levels in gastric cancer patients were also evaluated using a tissue microarray to determine their relationship with patients’ clinicopathological features and prognosis.
Materials and methods
Cell line culture
The human gastric cancer cell line SGC7901 and 293T cells were purchased from the Chinese National Infrastructure of Cell Line Resource. SGC7901 cells were cultured in RPMI-1640 medium supplemented with 10% fetal bovine serum (FBS) (HyClone, Logan, UT, USA) at 37 °C in a humidified incubator with 5% CO2. 293T cells were grown in DMEM medium with 10% FBS.
Generation of ME1-stable knockdown cell line
Stable knock-down of ME1 was performed in SGC7901 cells. The ME1 knock-down vector (Vector: psi-LVRH1GP; Catalog No. CS-HSH011142-5-LVRH1GP-01) was purchased from GeneCopoeia, Inc. (Rockville, Maryland, USA), of which the complementary DNA target sequence of the short hairpin RNA (shRNA) for ME1 was GGGCATATTGCTTCAGTTC. 293T cells were then transfected with the ME1 knockdown (shME1) or empty control (shControl) vector. At 24 h after transfection, the medium was refreshed. An empty vector was used as the shRNA control. After culturing for 48 h, transfection was confirmed based on GFP expression, assessed by fluorescence microscopy (LEICA DMI3000 B, Leica microsystems, Wetzlar, Germany) at 200× magnification. Viral particles were harvested from the media and SGC7901 cells were infected, which was followed by puromycin (1 μg/mL, Life Tech, Carlsbad, CA, USA) selection. Stable knock-down of ME1 was confirmed by real-time PCR and Western blot analysis. RNA isolation, reverse transcription and real-time PCR procedures were performed as described previously.12 The primers used in this study were as follows: 18S rRNA: 5ʹ-GTAACCCGTTGAACCCCATT-3ʹ (forward primer) and 5ʹ- CCATCCAATCGGTAGTAGCG-3ʹ (reverse primer); ME1: 5ʹ-GGGAACCGAAAATGAGGAG-3ʹ (forward primer) and 5ʹ- CTTGTTCAGGAGACGAAATGC-3ʹ (reverse primer). Primary antibodies for ME1 (1:500, ab97445, Abcam, Cambridge, MA, USA) and β-actin (1:1000, ab8227, Abcam, Cambridge, MA, USA) were used for Western blot analysis. Real-time PCR reaction and Western blot analysis were performed in technical triplicates.
Real-time cell proliferation assay
A real-time cell proliferation assay was conducted using the ACEA RT-CES microelectronic cell sensor system (ACEA Biosciences) to measure the number of living cells. This system works by measuring electrical impedance using sensor electrodes that are integrated on the bottom of microtiter E-plates. Briefly, for SGC7901 wild-type cells, SGC7901 shRNA control cells, and SGC7901 shME1 cells, 5×10³ cells per well were seeded in an E-Plate 96 and allowed to attach for 12 h. The cell index was normalized to the baseline reading at time point 0 after the attachment. Cellular impedance was measured every 5 min. The electronic sensors provided a continuous and quantitative measurement of the cell index and cell proliferation, measured based on the cell index, was monitored for 72 h.
Cell cycle analysis
SGC7901 cells, including wild-type, shRNA control, and shME1, were seeded in 6-well plates (at a density of 1×10⁵ cells per well). Cell cycle analysis was performed as described.12 Briefly, cells were synchronized, harvested, suspended in ethanol, and resuspended in PBS containing propidium iodide (PI) and RNase A. Then, cells were incubated at 37 °C for 30 min and assayed by flow cytometry (Becton Dickinson FACS Calibur). The results were analysed using ModFit LT Software (Verity Software House, Topsham, ME, USA).
Real-time measurement of cell migration
The ACEA xCELLigence RTCA DP system (ACEA Biosciences) was used to measure real-time cell migration with SGC7901 wild-type, shRNA control, and shME1 cells. For this, 1×10⁴ cells per well were seeded in CIM-Plates 16. The assay was performed as described.13 Changes in impedance resulting from cells that migrated to the underside of wells were measured every 15 min and followed over a time period of up to 72 h.
Cell invasion assay
For invasion assay, a Transwell experiment was performed using a 24-well transwell chamber with a polycarbonate membrane with a pore size of 8 μm (Corning, NY, USA). The bottom of the Transwell membrane was coated with a 1:5 mixture of Matrigel (BD Sciences, San Jose, CA, USA) and serum-free RPMI 1640 medium to form a matrix barrier. After the Matrigel was allowed to solidify at 37 °C for 2 h, SGC7901 cells (at a density of 5×10⁴ cells per well) were suspended in serum-free RPMI 1640 medium, and plated in the upper chamber. RPMI 1640 medium with 10% FBS was added in the lower chamber. After incubation at 37 °C for 24 h, noninvasive cells were removed from the upper surface of the filter with a cotton swab, and the invaded cells on the lower surface of the filter were fixed, stained with DAPI, photographed, and counted under high-power magnification.
Tissue microarrays and immunohistochemistry staining
The gastric cancer tissue microarrays of gastric cancer and the corresponding adjacent noncancer tissues were obtained from Shanghai Outdo Biotech Co., Ltd. (Shanghai, China). Patient information, including general characteristics, TNM stage and overall survival was available meanwhile from Shanghai Outdo Biotech Co., Ltd. (Shanghai, China). The present study was approved by the Research Ethics Committee of Zhejiang Taizhou Hospital. We confirmed that all participants provided written informed consent, and that this study was conducted in accordance with the Declaration of Helsinki. ME1 expression levels in the microarray slides were measured by immunohistochemical staining. An anti-ME1 antibody (Abcam, diluted to 1:500) was used as the primary antibody. The microarray slides were deparaffinized in xylene and rehydrated in a graded series of alcohol. Antigen retrieval was performed followed by blocking endogenous peroxidase activity. Next, 10% serum was used to block the slides before incubating them with the anti-ME1 primary antibody at 4 °C overnight. IgG was used as the negative control. Secondary antibody incubation, DAB coloration, and haematoxylin staining were performed based on routine immunohistochemical staining protocols.
Evaluation of immunohistochemistry staining
ME1 expression, based on immunohistochemistry staining, was scored by three pathologists independently following an immunoreactivity scoring system (IRS). Category A was applied to rate the intensity of staining as 0 (no immunostaining), 1 (weak), 2 (moderate), or 3 (strong). Category B was used to document the percentage of immunoreactive cells and was graded as 0 (negative or fewer than 10% positive), 1 (10–25% positive), 2 (25–50% positive), 3 (50–75% positive), or 4 (more than 75% positive). The staining score, calculated by multiplying category A by category B, ranged from 0 to 12. ME1 expression was defined as low level when the score was ≤4. When the score was 5–8, ME1 expression was defined as moderate. When the score was ≥9, ME1 expression was defined as high.
Statistical analysis
A Student’s t test was used to analyse differences between two groups. A Chi-square test was used to assess correlations analysis. Nonparametric tests for related samples were used to analyse differences in ME1 expression differences between tumor and adjacent tissues. The Kaplan–Meier method was used to calculate overall survival, and the log rank test was applied to determine significant differences. The univariable Cox regression model was used to calculate hazard ratios for variables. Those variables associated with P-values less than 0.05 or interesting variables for gastric cancer survival were then used with multivariable Cox regression to identify independent prognostic variables. Data are presented as the mean ± s.d. of three independent experiments. All statistical analyses were performed using SPSS 18.0 computer software. P-values less than 0.05 were considered statistically significant.
Results
ME1 knockdown in SGC7901 cells inhibits cell proliferation
ME1 knockdown in SGC7901 cells was performed and confirmed by real-time PCR and Western blot analysis, and the results are shown in Figure 1. To study the effect of ME1 on the growth of SGC7901 gastric cancer cells, a real-time cell proliferation assay was performed after ME1-stable knockdown. As shown in Figure 2, the growth of SGC7901 ME1-knockdown cells was significantly inhibited. Approximately 20 h after plating, the growth of SGC7901 wild-type cells and SGC7901-shRNA control cells reached a plateau. However, ME1-knockdown cells reached a plateau at approximately 30 h after plating, and the cell index was significantly lower than that of the control cells.
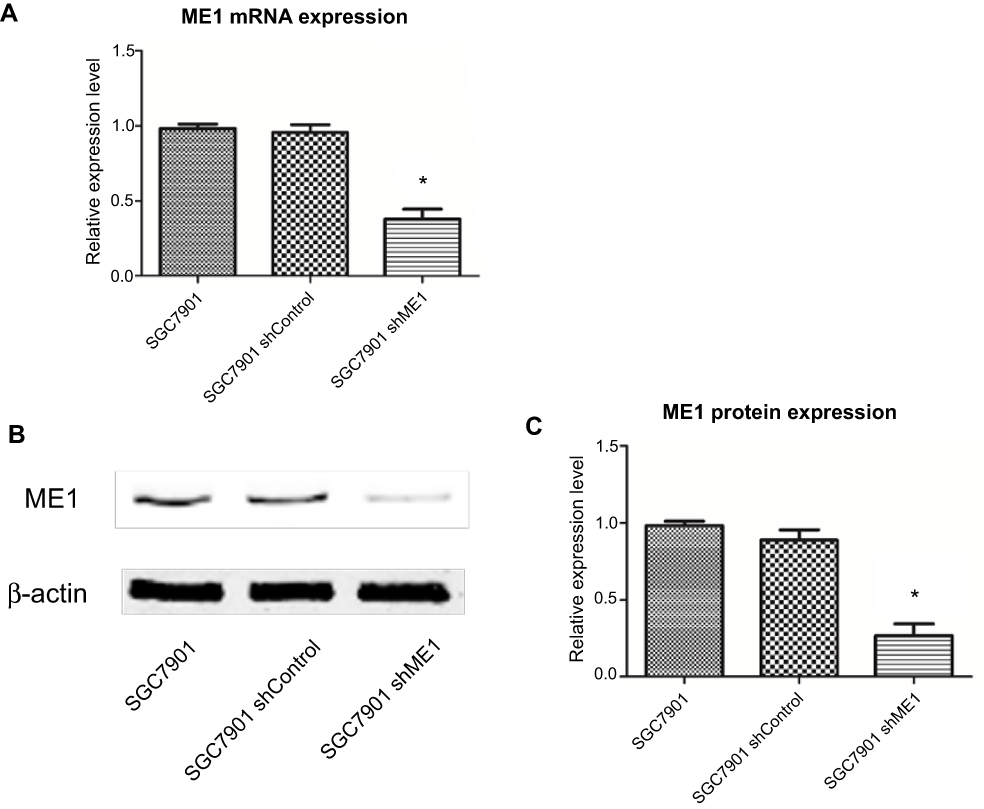 |
Figure 1 Knockdown of ME1 in gastric cancer SGC7901 cells. (A) ME1 mRNA expression was measured using real-time PCR. ME1 expression was significantly knocked down by shME1 vector transfection. (B) ME1 protein expression was measured using Western blot analysis. (C) Quantitation of the band intensity of Western blot analysis to show the significant suppression of ME1 expression. Data are presented as the mean ± SD of three independent experiments. *P<0.05 was considered statistically significant versus control. |
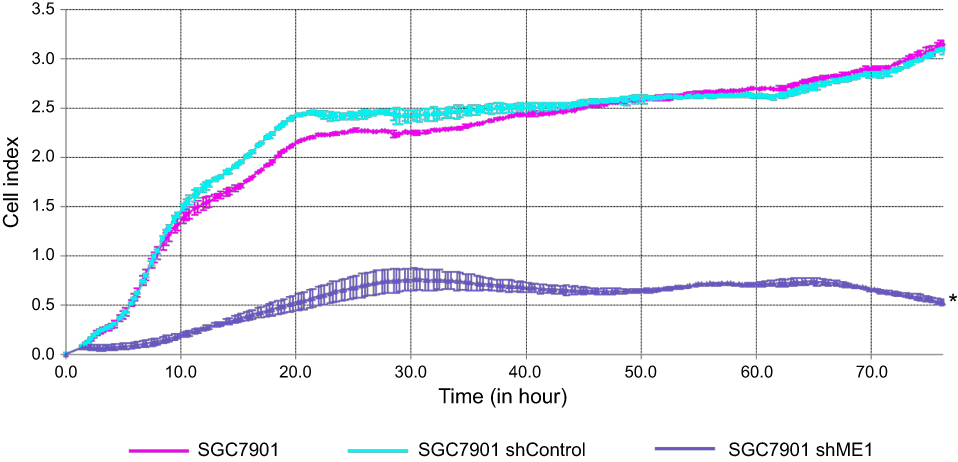 |
Figure 2 ME1 knockdown in SGC7901 cells inhibited cell proliferation. Real-time cell proliferation assay using electric impedance as a measure of gastric cancer cell growth. Electrical impedance was normalized according to the background measurement at time point 0. The results showed that compared with SGC7901 wild-type and shRNA control cells, ME1 knockdown inhibited the growth of SGC7901 cells significantly. *P<0.05 was considered statistically significant versus control. |
ME1-knockdown in SGC7901 cells results in cell cycle arrest
To further determine the effects of ME1 expression on SGC7901 cell growth, the cell cycle was analysed for SGC7901 wild-type cells, SGC7901 shRNA control cells, and SGC7901 shME1 cells. The results (Figure 3) showed that the cell cycle of shRNA control cells was not different from that of negative control cells (3.61% vs 4.68%, respectively). For ME1-knockdown cells, the percentage of G2-phase cells significantly increased compared to that in negative control cells, indicating that cell cycle arrest was induced in the G2 phase (11.33% vs 4.68%, respectively).
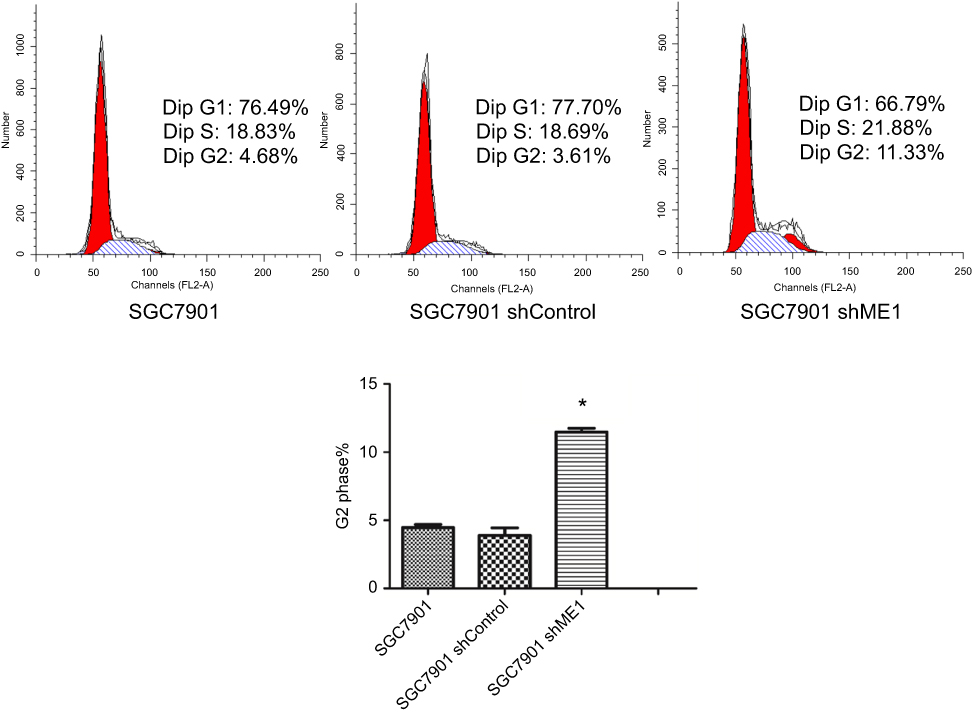 |
Figure 3 ME1 knockdown in SGC7901 cells resulted in cell cycle arrest. Compared with SGC7901 wild-type cells and shRNA control cells, ME1 knockdown in SGC7901 significantly leads to cell cycle arrest in G2 phase. *P<0.05 was considered statistically significant versus control. |
ME1-knockdown in SGC7901 cells inhibits cell migration
To detect cell migration induced by ME1 knockdown in SGC7901 cells, a real-time cell migration assay was performed using the xCELLigence RTCA DP device, which allows for continuous data recording during a period of several days. As shown in Figure 4, for SGC7901 wild-type cells and shRNA control cells, cell migration occurred and reached a plateau at approximately 60 h after plating. However, for SGC7901 shME1 cells, almost no cell migration was observed for a total of 72 h. Thus, the migration of SGC7901 cells was obviously inhibited when ME1 expression was suppressed.
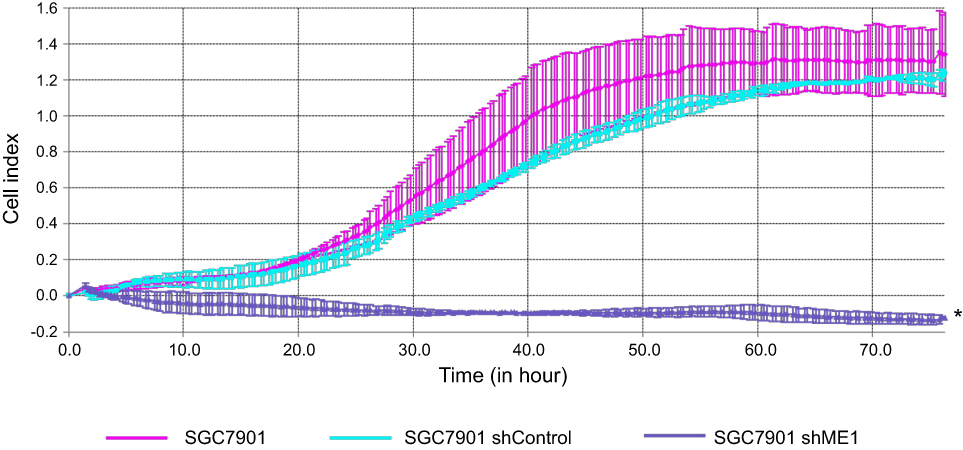 |
Figure 4 ME1 knockdown in SGC7901 cells inhibited cell migration. Compared with SGC7901 wild-type cells and shRNA control cells, ME1 knockdown in SGC7901 inhibited the migration of SGC7901 cells significantly. *P<0.05 was considered statistically significant versus control. |
ME1-knockdown in SGC7901 cells inhibits cell invasion
The Transwell assay was performed to detect cell invasion induced by ME1 knockdown in SGC7901 cells. As shown in Figure 5, the number of invaded SGC7901 cells transfected with shME1 (73.7±8.5) was significantly reduced compared with the negative control (246.7±18.1) and shControl (237.0±12.5) groups (n=5). Our data indicate that ME1 could induce invasion of SGC7901 gastric cancer cells.
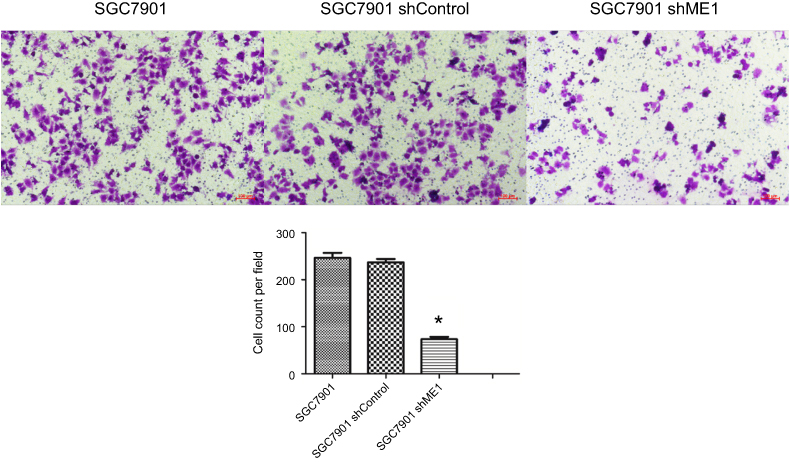 |
Figure 5 ME1 knockdown in SGC7901 cells inhibited cell invasion. Compared with SGC7901 wild-type cells and shRNA control cells, ME1 knockdown in SGC7901 inhibited the invasion of SGC7901 cells significantly (magnification, ×100). *P<0.05 was considered statistically significant versus control. |
Characteristics and ME1 expression in gastric cancer patients
A total of 63 primary gastric cancer samples in the tissue microarray were successfully assessed for ME1 expression, including specimens from 25 females and 38 males. The median age was 65 years (range from 32 to 84 years). Ten cases were located at the proximal part including the cardia, 19 cases in the corpus, 29 cases at the distal part including the antrum, and 5 cases disseminated to the entire stomach. All cases were adenocarcinoma, among which 41 cases were well differentiated, 15 cases were moderately-differentiated, and 7 cases were undifferentiated carcinoma. Detailed characteristics of gastric cancer patients are shown in Table 1. No significant correlation was found between ME1 expression and clinicopathological parameters of gastric cancer (P>0.05). ME1 expression was also evaluated in tumor and the adjacent tissues. The median score of ME1 expression in tumor tissues was 1, and the minimum and maximum scores were 0 and 12, respectively. In the adjacent tissues, the median score of ME1 expression in tumor tissues was 2, and the minimum and maximum scores were 0 and 9, respectively. No significant difference was found between tumor tissues and adjacent tissues. Representative figures showing ME1 expression in tumor (Figure 6A,C,E) and adjacent (Figure 6B,D,F) tissues based on immunohistochemistry are shown in Figure 6.
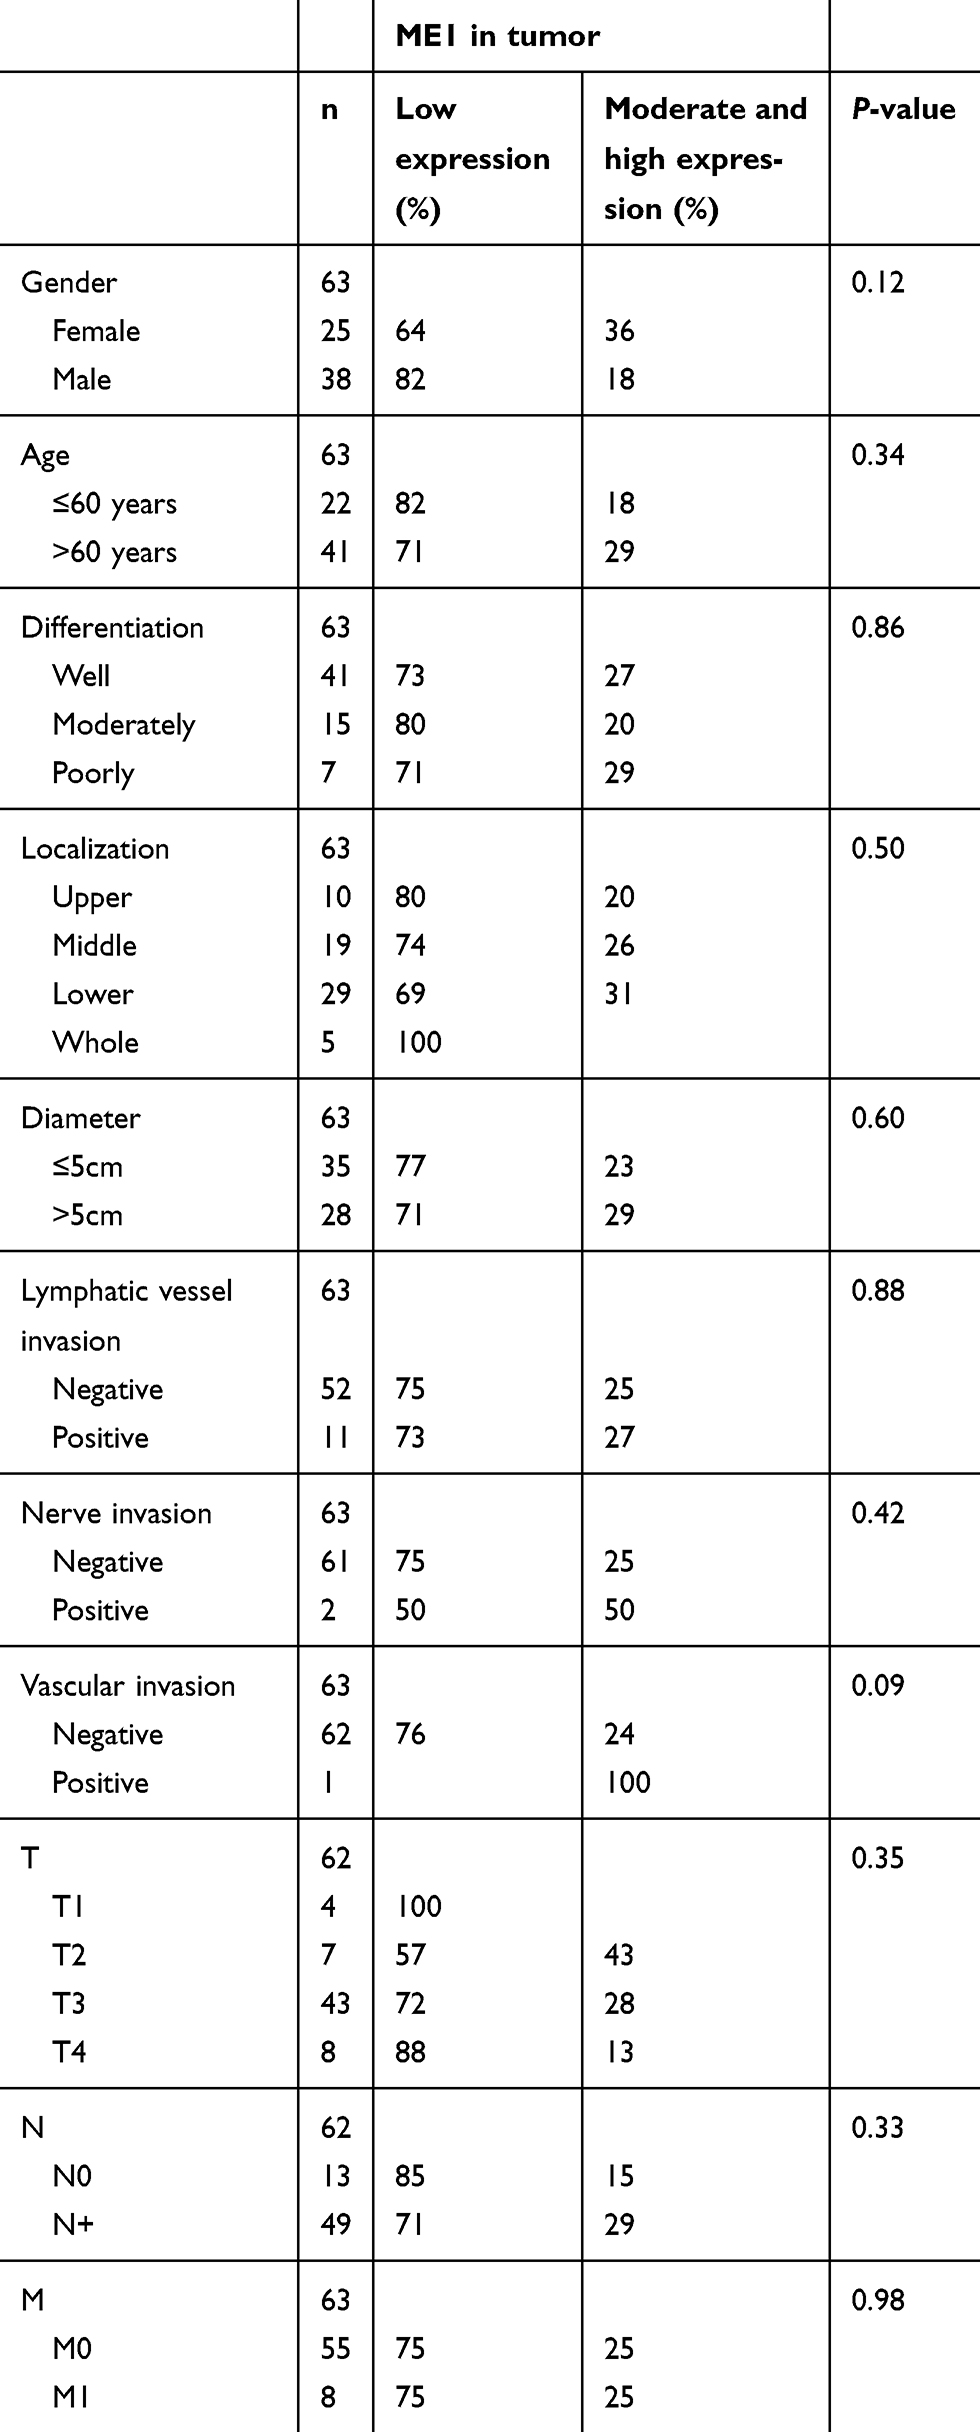 |
Table 1 Patient characteristics and molecular features according to ME1 expression |
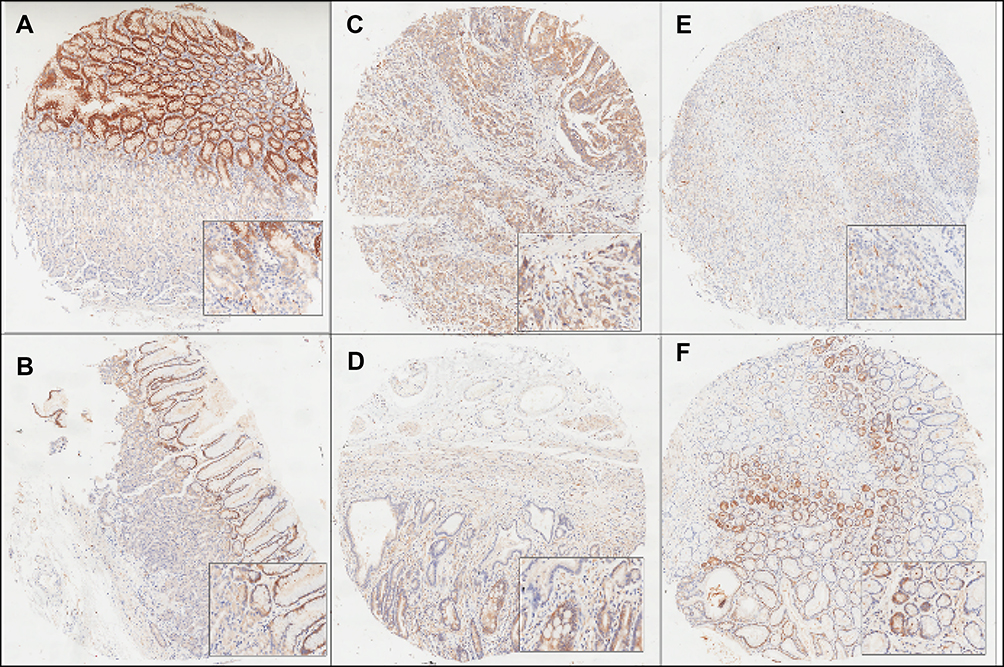 |
Figure 6 Representative images of ME1 expression by immunohistochemistry. (A, C, E) ME1 expression in gastric cancer tissues. (B, D, F) ME1 expression in the adjacent tissues. No significant difference of ME1 expression was found in cancer and adjacent tissues. Category A rated the intensity of staining as 0 (no immunostaining), 1 (weak), 2 (moderate), or 3 (strong). Category B documenting the percentage of immnoreactive cells was graded as 0 (negative or less than 10% positive), 1 (10–25% positive), 2 (25–50% positive), 3 (50–75% positive), and 4 (more than 75% positive). The staining score, calculated by category A multiplying by category B, was ranging from 0 to 12. |
Prognostic significance of ME1 expression in gastric cancer
Base on univariable survival analysis, variables including differentiation, lymphatic vessel invasion, vascular invasion, lymph node status (N) and distant metastasis (M) of pathological TNM staging were found to be significantly associated with patient survival (Table 2). Levels of ME1 in tumor tissues were also significantly associated with patient survival (P<0.05), and Kaplan-Meier analysis showed that moderate and high levels of ME1 expression predicted worse prognosis compared to that in cases with low ME1 expression (Figure 7).
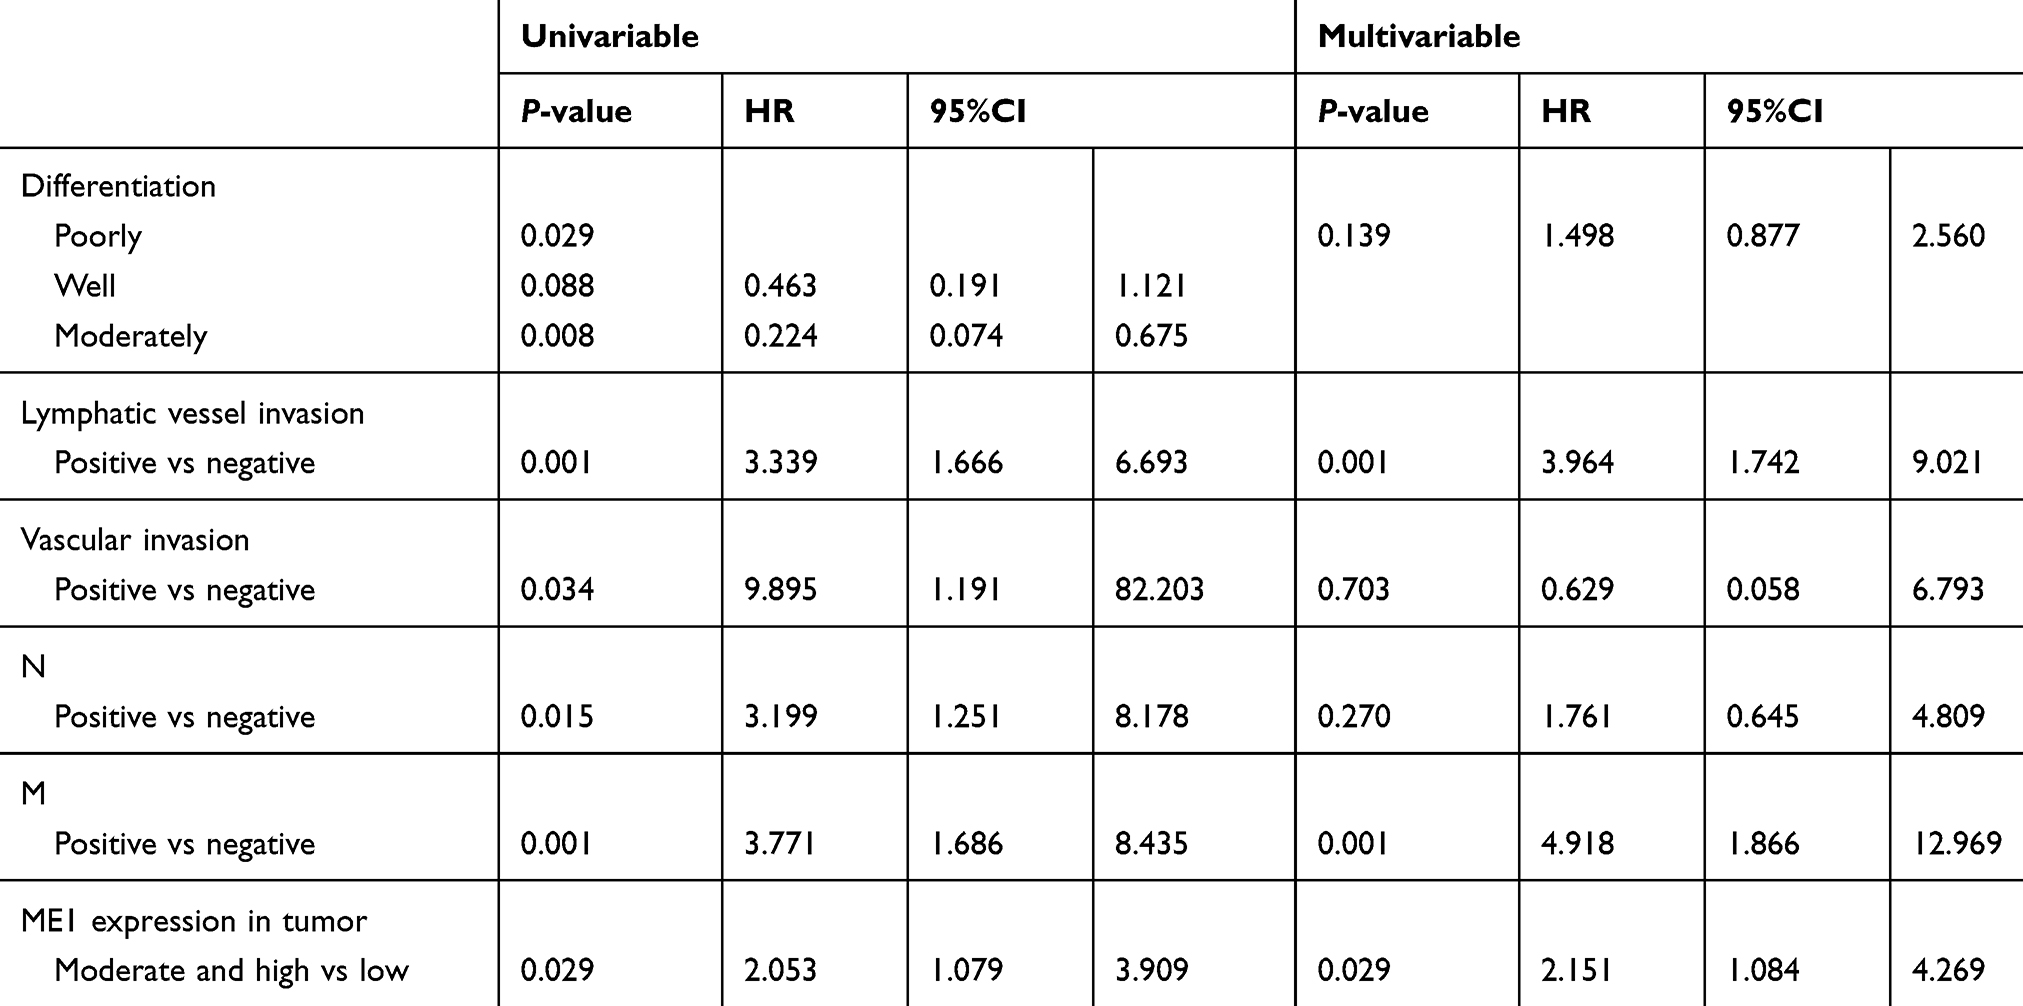 |
Table 2 Prognostic analysis of gastric cancers |
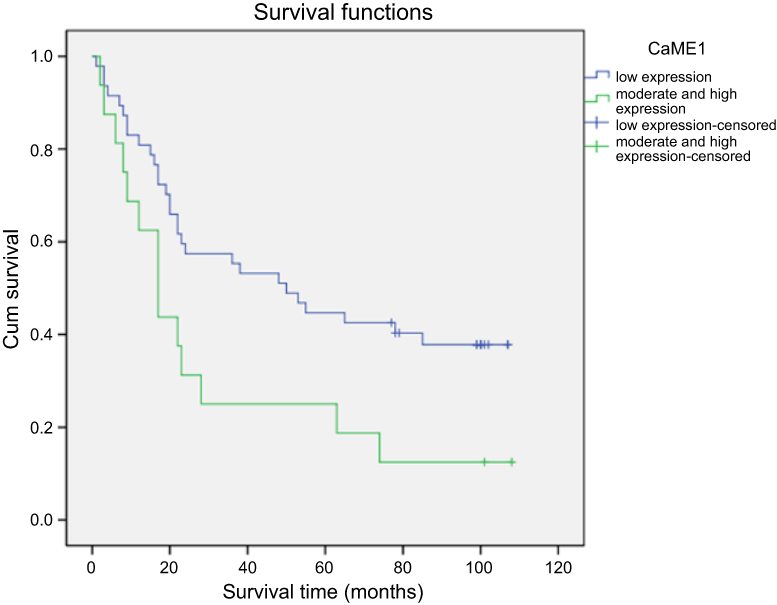 |
Figure 7 Survival of gastric cancer patients. The cumulative survival rates of 63 gastric cancer patients were analysed using Kaplan-Meier method. A significant lower cumulative survival rate was found in the patients with moderate or high ME1 expression comparing to low ME1 expression (P<0.05). |
Multivariable Cox regression analysis was performed adjusting for variables including differentiation, lymphatic vessel invasion, vascular invasion, lymph node status (N), distant metastasis (M) and ME1 expression scores in tumor tissues (Table 2). Results showed that adjusted lymphatic vessel invasion, distant metastasis (M), and ME1 expression were independent prognostic factors for gastric cancer patient survival (P<0.05).
Discussion
In 2018, more than 1,000,000 new cases of gastric cancer are diagnosed, which are expected to cause approximately 783,000 deaths.3 The mechanisms underlying gastric cancer development and metastasis are complex and not clear. Further, the managements of gastric cancer has been improved in recent years. Endoscopic diagnosis and therapy, surgery, radiotherapy, systemic therapy, neoadjuvant and adjuvant therapy and even immunotherapies have been used or are being researched for gastric cancer. However, to personalize therapy in various settings and to perform effective primary prevention, studies on the molecular biology of gastric cancer remain necessary. Recently, cell metabolic changes have been under investigation, as they are related to cancer pathology mechanisms and are thought to contribute to tumor occurrence and development.14,15 As metabolic changes occur, the interplay between catabolic and anabolic processes is disturbed. Reprogrammed metabolic activities threaten the homeostasis of cell rest and proliferation. This phenomenon contributes to cancer initiation and progression. Cancer cells rely on sufficient energy and biosynthesis to fulfill the increased requirements of cell division. Thus the identification of genes used by cancer cells to meet such requirements would ultimately help to yield new strategies to prevent cancer, cell growth, and metastasis.8,16
ME1 can catalyse the oxidative decarboxylation of malate to generate pyruvate. Moreover, it depends on NADP and is critical for NADPH production. ME1 has been reported to be suppressed by p53, to modulate p53 activation, and is likely important in regulating the growth of some cancers. In colon mucinous adenocarcinoma, glioblastoma and some other cancers, ME1 expression is upregulated.11 In bladder cancer cells, ME1 was found to be a target for tumor suppression.10 ME1 expression was also reported to be linked to oral squamous cell carcinoma progression,9 and recently, ME1 was confirmed to be pro-oncogenic for intestinal tumors.8 However, data regarding the role of ME1 in gastric cancer are not consistent. For example, some studies have reported that ME1 is an oncogene,17 whereas according to the TCGA dataset, ME1 expression is lower in gastric cancers than in healthy normal tissues, indicating that it might be a tumor suppressor (http://ualcan.path.uab.edu/analysis.html). In our previous study, ME1 was identified in gastric carcinogenesis based on isobaric tags for relative and absolute quantitation (iTRAQ)-based quantitative proteomic analysis,18 indicating that it might be involved in the mechanisms of gastric cancer.
In this study, we investigated whether ME1 expression is associated with gastric cancer development and survival. As the expression of ME1 in gastric tissues were shown to be relatively high (https://www.proteinatlas.org/ENSG00000065833-ME1/tissue), we suppressed its expression in SGC7901 gastric cancer cells. Our results showed that in this cell line, ME1-knockdown significantly inhibited cell growth and migration based on an assay that measured the cell index precisely in real time, and cell invasion was also inhibited. ME1 was previously reported to promote the epithelial–mesenchymal transition (EMT) and could enhance cancer progression.9 Our results vertified the function of ME1 in the migration of gastric cancer cells. In gastric cancer tissues, we did not find differences in ME1 expression between tumor and adjacent tissues, and we did not identify an association between ME1 expression and the general characteristics or clinicopathologic features of gastric cancer patients. ME1 is a key protein in the tricarboxylic acid (TCA) cycle and is regulated by the redox state in humans. It is likely that feedback between ME1 expression and the redox state occurs.19,20 ME1 expression would reflect patient whole-body mechanism and might be associated with diseases in both cancer tissues and adjacent tissues. We speculated that ME1 would be a novel, independent risk factor for gastric cancer reflecting the patients’ metabolism, which might not be connected to current well-known risk factors. Further studies should be performed in large sample sets to compare ME1 expression in gastric cancers and healthy controls, and to investigate the mechanisms underlying the role of ME1 in gastric carcinogenesis.
To evaluate ME1 expression with respect to gastric cancer prognosis, we further analysed ME1 levels with gastric cancer patient prognosis using univariable and multivariable prognostic analyses. ME1 expression levels were found to be associated with survival based on univariable prognostic analysis in our study. As multivariable analysis is considered much more important due to the complex risk factors associated with cancer prognosis,21 in this study, we evaluated the prognostic implication of ME1 expression adjusted by other critical risk factors for gastric cancer patient survival using multivariable Cox regression. Our results confirmed that ME1 expression is an independent risk factor for gastric cancer prognosis. Taken together, in vitro and clinical analysis results indicated that ME1 has an oncogenic role in gastric carcinogenesis and could be a valuable biomarker for gastric cancer prognosis. Future studies will be performed to explore the downstream mechanisms through with ME1 affects gastric carcinogenesis.
In conclusion, this study provides evidence that ME1 is involved in gastric cancer pathology, and especially in cancer cell growth, metastasis, invasion, and patient prognosis. Further studies should be performed to examine the mechanisms underlying the role of ME1 in gastric carcinogenesis and its potential clinical application for evaluating gastric cancer prognosis.
Ethical approval
The present study was approved by the Research Ethics Committee of Zhejiang Taizhou Hospital. We confirmed that all participants provided written informed consent, and that this study was conducted in accordance with the Declaration of Helsinki.
Acknowledgments
This study was funded by the National Natural Science Foundation of China (Grant No. 81700496), the interdisciplinary medicine Seed Fund of Peking University (BMU2017MX015), and the Beijing Key Laboratory for Helicobacter pylori infection and upper gastrointestinal diseases (No. BZ0371).
Disclosure
The authors report no conflicts of interest in this work.
References
1. Ajani JA, Lee J, Sano T, Janjigian YY, Fan D, Song S. Gastric adenocarcinoma. Nat Rev Dis Primers. 2017;3:17036. doi:10.1038/nrdp.2017.36
2. Torre LA, Siegel RL, Ward EM, Jemal A. Global cancer incidence and mortality rates and trends–an update. Cancer Epidemiol Biomarkers Prev. 2016;25(1):16–27. doi:10.1158/1055-9965.EPI-15-0578
3. Bray F, Ferlay J, Soerjomataram I, Siegel RL, Torre LA, Jemal A. Global cancer statistics 2018: GLOBOCAN estimates of incidence and mortality worldwide for 36 cancers in 185 countries. CA Cancer J Clin. 2018;68(6):394–424. doi:10.3322/caac.21492
4. Vineis P, Wild CP. Global cancer patterns: causes and prevention. Lancet (London, England). 2014;383(9916):549–557. doi:10.1016/S0140-6736(13)62224-2
5. Vander Heiden MG, DeBerardinis RJ. Understanding the Intersections between metabolism and cancer biology. Cell. 2017;168(4):657–669. doi:10.1016/j.cell.2016.12.039
6. Pavlova NN, Thompson CB. The emerging hallmarks of cancer metabolism. Cell Metab. 2016;23(1):27–47. doi:10.1016/j.cmet.2015.12.006
7. Ranzani AT, Nowicki C, Wilkinson SR, Cordeiro AT. Identification of specific inhibitors of trypanosoma cruzi malic enzyme isoforms by target-based HTS. SLAS Discov. 2017;22(9):1150–1161. doi:10.1177/2472555217706649.
8. Fernandes LM, Al-Dwairi A, Simmen RCM, et al. Malic enzyme 1 (ME1) is pro-oncogenic in Apc(Min/+) mice. Sci Rep. 2018;8(1):14268. doi:10.1038/s41598-018-32532-w
9. Nakashima C, Yamamoto K, Fujiwara-Tani R, et al. Expression of cytosolic malic enzyme (ME1) is associated with disease progression in human oral squamous cell carcinoma. Cancer Sci. 2018;109(6):2036–2045. doi:10.1111/cas.13594
10. Liu M, Chen Y, Huang B, et al. Tumor-suppressing effects of microRNA-612 in bladder cancer cells by targeting malic enzyme 1 expression. Int J Oncol. 2018;52(6):1923–1933. doi:10.3892/ijo.2018.4342
11. Jiang P, Du W, Mancuso A, Wellen KE, Yang X. Reciprocal regulation of p53 and malic enzymes modulates metabolism and senescence. Nature. 2013;493(7434):689–693. doi:10.1038/nature11776
12. Shi Y, Liu L, Zhang T, et al. The involvement of Helicobacter pylori thioredoxin-1 in gastric carcinogenesis. J Med Microbiol. 2013;62(Pt 8):1226–1234. doi:10.1099/jmm.0.056903-0
13. Greiner M, Kreutzer B, Jung V, et al. Silencing of the SEC62 gene inhibits migratory and invasive potential of various tumor cells. Int J Cancer. 2011;128(10):2284–2295. doi:10.1002/ijc.25580
14. Aird KM, Zhang G, Li H, et al. Suppression of nucleotide metabolism underlies the establishment and maintenance of oncogene-induced senescence. Cell Rep. 2013;3(4):1252–1265. doi:10.1016/j.celrep.2013.03.004
15. Brand A, Singer K, Koehl GE, et al. LDHA-associated lactic acid production blunts tumor immunosurveillance by T and NK cells. Cell Metab. 2016;24(5):657–671. doi:10.1016/j.cmet.2016.08.011
16. Satoh K, Yachida S, Sugimoto M, et al. Global metabolic reprogramming of colorectal cancer occurs at adenoma stage and is induced by MYC. Proc Natl Acad Sci U S A. 2017;114(37):E7697–e7706. doi:10.1073/pnas.1710366114
17. Lu YX, Ju HQ, Liu ZX, et al. ME1 regulates NADPH homeostasis to promote gastric cancer growth and metastasis. Cancer Res. 2018;78(8):1972–1985. doi:10.1158/0008-5472.CAN-17-3155
18. Shi YY, Zhang J, Zhang T, et al. Cellular stress and redox activity proteins are involved in gastric carcinogenesis associated with helicobacter pylori infection expressing high levels of thioredoxin-1. J Zhejiang Univ Sci B. 2018;19(10):750–763. doi:10.1631/jzus.B1700456
19. Lahey R, Carley AN, Wang X, et al. Enhanced redox state and efficiency of glucose oxidation with miR based suppression of maladaptive NADPH-dependent malic enzyme 1 expression in hypertrophied hearts. Circ Res. 2018;122(6):836–845. doi:10.1161/CIRCRESAHA.118.312660
20. Zhu W, Wang H, Wei J, et al. Cocaine exposure increases blood pressure and aortic stiffness via the miR-30c-5p-malic enzyme 1-reactive oxygen species pathway. Hypertension (Dallas, Tex: 1979). 2018;71(4):752–760. doi:10.1161/HYPERTENSIONAHA.117.10213
21. Moons KG, Altman DG, Reitsma JB, et al. Transparent reporting of a multivariable prediction model for individual prognosis or diagnosis (TRIPOD): explanation and elaboration. Ann Intern Med. 2015;162(1):W1–W73. doi:10.7326/M14-0698
 © 2019 The Author(s). This work is published and licensed by Dove Medical Press Limited. The full terms of this license are available at https://www.dovepress.com/terms.php and incorporate the Creative Commons Attribution - Non Commercial (unported, v3.0) License.
By accessing the work you hereby accept the Terms. Non-commercial uses of the work are permitted without any further permission from Dove Medical Press Limited, provided the work is properly attributed. For permission for commercial use of this work, please see paragraphs 4.2 and 5 of our Terms.
© 2019 The Author(s). This work is published and licensed by Dove Medical Press Limited. The full terms of this license are available at https://www.dovepress.com/terms.php and incorporate the Creative Commons Attribution - Non Commercial (unported, v3.0) License.
By accessing the work you hereby accept the Terms. Non-commercial uses of the work are permitted without any further permission from Dove Medical Press Limited, provided the work is properly attributed. For permission for commercial use of this work, please see paragraphs 4.2 and 5 of our Terms.