")
Back to Journals » OncoTargets and Therapy » Volume 11
MALAT1 promotes proliferation, migration, and invasion of MG63 cells by upregulation of TGIF2 via negatively regulating miR-129
Authors Liu K , Zhang YG, Liu L, Yuan QL
Received 7 August 2018
Accepted for publication 24 October 2018
Published 4 December 2018 Volume 2018:11 Pages 8729—8740
DOI https://doi.org/10.2147/OTT.S182993
Checked for plagiarism Yes
Review by Single anonymous peer review
Peer reviewer comments 4
Editor who approved publication: Dr Tohru Yamada
Kai Liu, Yingang Zhang, Liang Liu, Qiling Yuan
Department of Orthopedics, The First Affliated Hospital of Xi’an Jiaotong University, Xi’an, China
Purpose: This article aimed to investigate the mechanism by which MALAT1 and miR-129 affected the development of osteosarcoma.
Methods: Tumor tissues and adjacent tissues of 23 osteosarcoma patients were collected. Normal osteoblasts hFOB1.19 and osteosarcoma cells MG63 were cultured. MG63 cells were transfected and grouped: si-negative control (NC) group, si-MALAT1 group, miR-129 NC group, miR-129 mimics group, p-Empty vector group, p-MALAT1 group, p-MALAT1+ miR-129 mimics group, and p-MALAT1+ si-TGIF2 group. Luciferase reporter assay, Cell Counting Kit-8 assay, Transwell assay, quantitative reverse transcription PCR, Western blot, and Pearson correlation analysis were performed.
Results: MALAT1 expression in tumor tissues and MG63 cells was increased (P<0.01). High MALAT1 expression predicted poor prognosis of osteosarcoma patients. MG63 cells of si-MALAT1 group exhibited much lower cell viability, migration, and invasive cell numbers when compared with si-NC group (P<0.01). For MG63 cells of miR-129 mimics group, they had markedly lower cell viability, migration, and invasive cell numbers than miR-129 NC group (P<0.01). miR-129 was targetedly and negatively regulated by MALAT1. TGIF2, which was targetedly and negatively regulated by miR-129, was overexpressed in tumor tissues and MG63 cells (P<0.01). miR-129 overexpresison and TGIF2 downregulation significantly reversed the enhanced cell viability, migration, and invasion induced by MALAT1 (P<0.01).
Conclusion: MALAT1 promotes TGIF2 expression through negative regulation of miR-129, which further promotes the proliferation, migration, and invasion of MG63 cells.
Keywords: MALAT1, miR-129, TGIF2, osteosarcoma, invasion, prognosis
Introduction
Osteosarcoma, a primary malignant bone tumor, often occurs in children and adolescents.1 About 5.6 per million were diagnosed with osteosarcoma according to a 2009 statistic.2 Up to 80% of patients had metastasized when they were first diagnosed with osteosarcoma. Metastasis caused a serious adverse outcome for osteosarcoma patients and absence of metastasis was a key factor in improving patients’ 5-year survival rate.3 Complete cure could not be achieved by traditional treatment methods. Therefore, the discovery of molecular targets is very important for the research of pathogenesis and therapeutic strategies of osteosarcoma.
lncRNAs are a family of RNA molecules, which are composed of >200 nucleotides.4 lncRNAs are located in the cytoplasm and nucleus and they do not possess the ability of encoding proteins.5,6 More and more studies have found that lncRNAs are involved in the regulation of a variety of biological processes, such as cell proliferation, differentiation, migration, and invasion.7,8 Osteosarcoma occurrence and development have also been found to be regulated by a variety of genes, including lncRNAs. For examples, Ma et al9 suggested that lncRNA TUG1 in osteosarcoma tissues was markedly higher than corresponding adjacent tissues. High level of TUG1 is closely related to tumor size and poor prognosis, which might be used as a candidate molecular indicator for monitoring osteosarcoma. Lv et al10 revealed that lncRNA XIST might stimulate osteosarcoma cells proliferation and invasion through directly repressing miR-320b. They proposed XIST to be a biomarker and target for osteosarcoma diagnosis and treatment. Osteosarcoma is a disease usually treated by surgery and a long-course chemotherapy treatment. Previous research had found that, in colorectal cancer, MALAT1 was associated with poor response to oxaliplatin-based chemotherapy.11 Its suppression could also improve diffuse large B-cell lymphoma chemotherapy sensitivity by enhancing autophagy-related proteins.12 However, the relevant mechanism of MALAT1 affecting osteosarcoma progression is still not clear. miRNA is a kind of small non-coding RNA, the aberrant expression of which has been proved to be involved in multiple tumors initiation and progression.13 miR-129 acted as a tumor suppressor in several cancers, including hepatocellular carcinoma, breast cancer, and colon cancer, etc.14–17 Few reports have documented the influence and mechanism of MALAT1 and miR-129 on osteosarcoma progression.
In this paper, we researched the expression of MALAT1 and miR-129 in osteosarcoma and investigated their effects on proliferation, migration, and invasion of osteosarcoma cells. More importantly, the relationship between MALAT1 and miR-129 was also deeply explored in order to provide guidance for molecular therapy of osteosarcoma.
Methods
Clinical samples
This study enrolled 23 osteosarcoma patients, and their tumor tissues and paracancerous normal tissues were obtained. All patients were diagnosed with osteosarcoma for the first time between October 2016 and August 2017, and none of them had received medical treatment or had radiochemical history of osteosarcoma. The clinicopathological characteristics of 23 patients are listed in Table 1. The study was conducted with the approval of all patients and the Ethics Committee of our hospital.
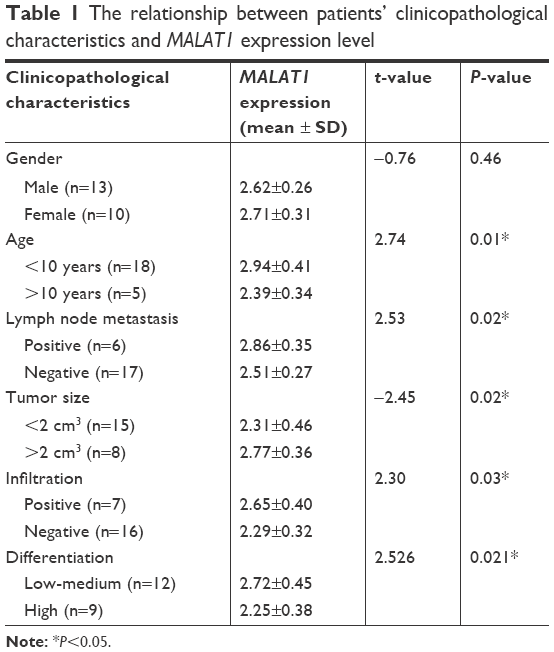 | Table 1 The relationship between patients’ clinicopathological characteristics and MALAT1 expression level |
Cell culture
Normal osteoblasts (hFOB1.19) and osteosarcoma cells (MG63) were purchased from Cell Resource Center of Shanghai Institutes for Biological Sciences, Chinese Academy of Sciences. All cells were cultured in DMEM supplemented with 10% FBS and were maintained in a 5% CO2 incubator. It should be noted that the culture environment of hFOB1.19 cells was 34°C whereas MG63 cells were cultured at 37°C.
Cell transfection
MG63 cells were maintained in 6-well plates at a density of 1 × 10⁵ cells/mL. When the confluence reached 40%–60%, the cells were transfected by MALAT1 siRNA (si-negative control [NC] group), MALAT1 siRNA NC (si-MALAT1 group), miR-129 mimics (miR-129 NC group), and miR-129 NC (miR-129 mimics group). All transfection plasmids were purchased from Shanghai GenePharma Co., Ltd. (Shanghai, China). In addition, MALAT1 overexpression vector and its empty vector were also constructed (Shanghai Jima Gene Co., Ltd., Shanghai, China) to transfect MG63 cells, which were named as p-MALAT1 group and p-Empty vector group, respectively. Meanwhile, MG63 cells were subjected to co-transfection by MALAT1 overexpression vector and miR-129 mimics (p-MALAT1+ miR-129 mimics group) or by MALAT1 overexpression vector and TGIF2 siRNA (p-MALAT1+ si-TGIF2 group). All transfections were carried out by using Lipfectamine 2000 transfection kit (Thermo Fisher Scientific, Waltham, MA, USA) according to the instructions. Cells of each group were collected for 48 hours after transfection.
Luciferase reporter gene assay
The binding sites of MALAT1 and miR-129 were 3′UTR region according to Starbase online prediction software. The wild-type (WT) and mutant-type (MT) of miR-129 sequences containing MALAT1 3′UTR binding sites were designed by Shanghai Jima Gene Co., Ltd. All sequences were constructed into pmirGLO vector (Promega Corporation, Fitchburg, WI, USA). MG63 cells were pre-transfected with MALAT1 siRNA or its NC, and subsequently transfected with WT miR-129 vector or MT miR-129 vector. Furthermore, the binding sites of TGIF and miR-129 were also predicted by Target Scan, and these two genes were combined in 3′UTR region. TGIF2 WT and MT containing miR-129 3′UTR sequences were obtained from Shanghai Jima Gene Co., Ltd. They were incorporated into pmirGLO vector to transfect MG63 cells after these cells were transfected with miR-129 mimics or miR-129 NC. All cells were incubated in the incubator for 48 hours at 37°C, 5% CO2. Luciferase activity was measured by using Dual-luciferase Reporter Assay Kit (Promega).
Cell Counting Kit-8 (CCK-8) assay
MG63 cells were seeded in 96-well plates (1 × 10⁵ cells/mL), with 100 μL cell suspension in each well. After being incubated for 24, 48, 72, and 96 hours at 37°C, 5% CO2, the cells were incubated again for 2 hours after adding 10 μL CCK-8 solution into each well. OD 450 value of each well was measured by ELISA. In this study, normal MG63 cells were set as Control group. Cell viability of other groups was considered as the percentage of Control group.
Transwell assay
Invasion ability was measured with 24-well Transwell chamber. The upper chamber was pre-coated with a layer of Matrigel. DMEM containing 10% FBS was added into the lower chamber, while a total of 2 × 10⁴ MG63 cells were inoculated in the upper chamber. Cells were cultured at 37°C, 5% CO2 for 24 hours. Then cells on the upper layer of the membrane were gently wiped off with a cotton swab, and those on the lower layer of the membrane were fixed by formaldehyde for 5 minutes. After being stained with crystal violet (0.1%) for 10 minutes, the cells on the lower layer of the membrane were observed under a microscope and five fields were randomly selected to count invading cell numbers.
Migration ability was also detected by using the same procedure mentioned before, but the upper chamber was without Matrigel.
Quantitative reverse transcription (qRT)-PCR
Trizol reagent (Thermo Fisher Scientific) was used to extract total RNA in tissues and cells according to the instructions. Reverse Transcription Kit (Promega) was used to synthesize cDNA templates. qRT-PCR was conducted under the following conditions by applying the Fast Start Universal SYBR Green Master (Roche, Palo Alto, CA, USA): initial denaturation at 94°C for 2 minutes, followed by 40 cycles of 94°C for 20 seconds, 58°C for 30 seconds, and 72°C for 30 seconds. Relative expression of candidate genes was calculated by 2−ΔΔCT method. Primers involved in this article were as follows: MALAT1-F, 5′-GGGTGTTTACGTAGACCAGAACC-3′, MALAT1-R, 5′-CTTCCAAAAGCCTTCTGCCTTAG-3′. miR-129-F, 5′-GTTGGGGAGATTTAGTTTGTT-3′, miR-129-R, 5′-CCTACTCCAATTCCCCCTATAATAC-3′, U6-F, 5′-CTCGCTTCGGCAGCACATATACT-3′, U6-R, 5′-ACGCTTCACGAATTTGCGTGTC-3′, TGIF2-F, 5′-GTACTTGCACCGCTACAACG-3′, TGIF2-R, 5′-GGCATTGATGAACCAGTTAC-3′, GAPDH-F, 5′-GTCGATGGCTAGTCGTAGCATCGAT-3′, GAPDH-R, 5′-TGCTAGCTGGCATGCCCGATCGATC-3′. MALAT1 and miR-129 expression was normalized to U6, while TGIF2 expression was normalized to glyceraldehyde-3-phosphate dehydrogenase (GAPDH).
Western blot analysis
Tissues (ground in liquid nitrogen) and cells were lysed by RIPA buffer to collect total protein. Bicinchoninic Acid Protein Assay Kit (Pierce, Rockford, IL, USA) was applied to determine the concentration of these protein samples. Protein samples were transferred onto polyvinylidene difluoride membranes after being separated by SDS-PAGE. These membranes were exposed to 5% skim milk for 2 hours before being incubated with primary antibody (mouse anti-rabbit TGIF2 antibody, 1:1,000, Santa Cruz, Dallas, TX, USA) and secondary antibody (goat anti-mouse IgG secondary antibody, 1:5,000; Zhongshang Jinqiao Biotechnology Co., Ltd., Beijing, China). Kodak film developer (Fujifilm, Tokyo, Japan) was selected to detect immunoblots. GAPDH was set as internal control.
Statistical analyses
SPSS 19.0 was used to process data in this study and all data were presented in the form of mean ± SD. The differences between two groups were compared by t-test and one-way ANOVA was used to compare differences among multiple groups. Correlation analysis of two genes expression was performed using Pearson correlation analysis. P<0.05 was considered statistically significant. In this paper, all experiments were repeated three times.
Ethics approval and consent to participate
This study was conducted after obtaining the ethical committee approval of The First Affliated Hospital of Xi’an Jiaotong University and written informed consent from the patients and complies with the Declaration of Helsinki.
Results
Upregulated MALAT1 in osteosarcoma predicted poor prognosis
qRT-PCR was conducted to determine MALAT1 expression in tissues and cells. The results showed significantly increased MALAT1 relative expression in osteosarcoma tumor tissues than that in adjacent tissues (P<0.01) (Figure 1A). At the same time, we also analyzed the relationship between patients’ clinicopathological characteristics and MALAT1 level. As shown in Table 1, patients’ gender was not a factor that affected MALAT1 expression. However, low age, positive lymph node metastasis and infiltration, large tumor size, and low-medium differentiation were significantly associated with high MALAT1 expression level (P<0.05), indicating that high MALAT1 expression predicted poor prognosis of osteosarcoma patients. In addition, MALAT1 relative expression in MG63 cells was also remarkably higher than that found in hFOB1.19 cells (P<0.01) (Figure 1B).
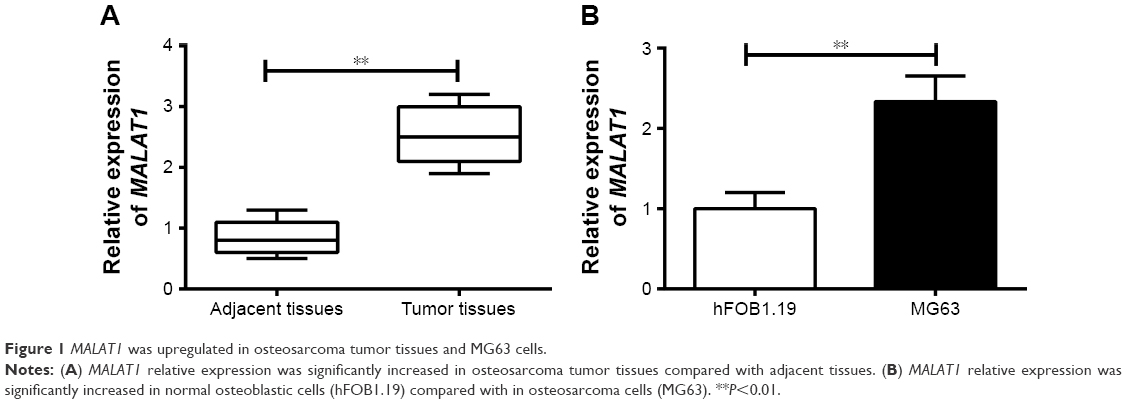 | Figure 1 MALAT1 was upregulated in osteosarcoma tumor tissues and MG63 cells. |
MALAT1 promoted MG63 cells proliferation, migration, and invasion
MG63 cells were transfected by MALAT1 siRNA and its NC. Compared with si-NC group, MALAT1 relative expression in MG63 cells of si-MALAT1 group was significantly decreased (P<0.01) (Figure 2A). CCK-8 assay revealed markedly lower cell viability of MG63 cells in si-MALAT1 group than that found in si-NC group at 48–96 hours (P<0.01) (Figure 2B). In addition, the number of migrating and invading cells of si-MALAT1 group was remarkably decreased when compared with si-NC group (P<0.01) (Figure 2C and D). Silencing of MALAT1 markedly inhibited MG63 cells proliferation, migration, and invasion ability.
 | Figure 2 MALAT1 promoted MG63 cells proliferation, migration, and invasion. |
miR-129 inhibited proliferation, migration, and invasion of MG63 cells
miR-129 relative expression in tumor tissues was much lower than that in adjacent tissues (P<0.01) (Figure 3A). At the same time, significantly declined miR-129 relative expression was found in MG63 cells when compared with that found in hFOB1.19 cells (P<0.01) (Figure 3B). Transfection with miR-129 mimics successfully increased the expression level of miR-129 in MG63 cells (P<0.01) (Figure 3C). Furthermore, MG63 cells of miR-129 mimics group exhibited significantly lower MG63 cells viability, migration, and invasion ability than that of miR-129 NC group (P<0.01) (Figure 3D–F).
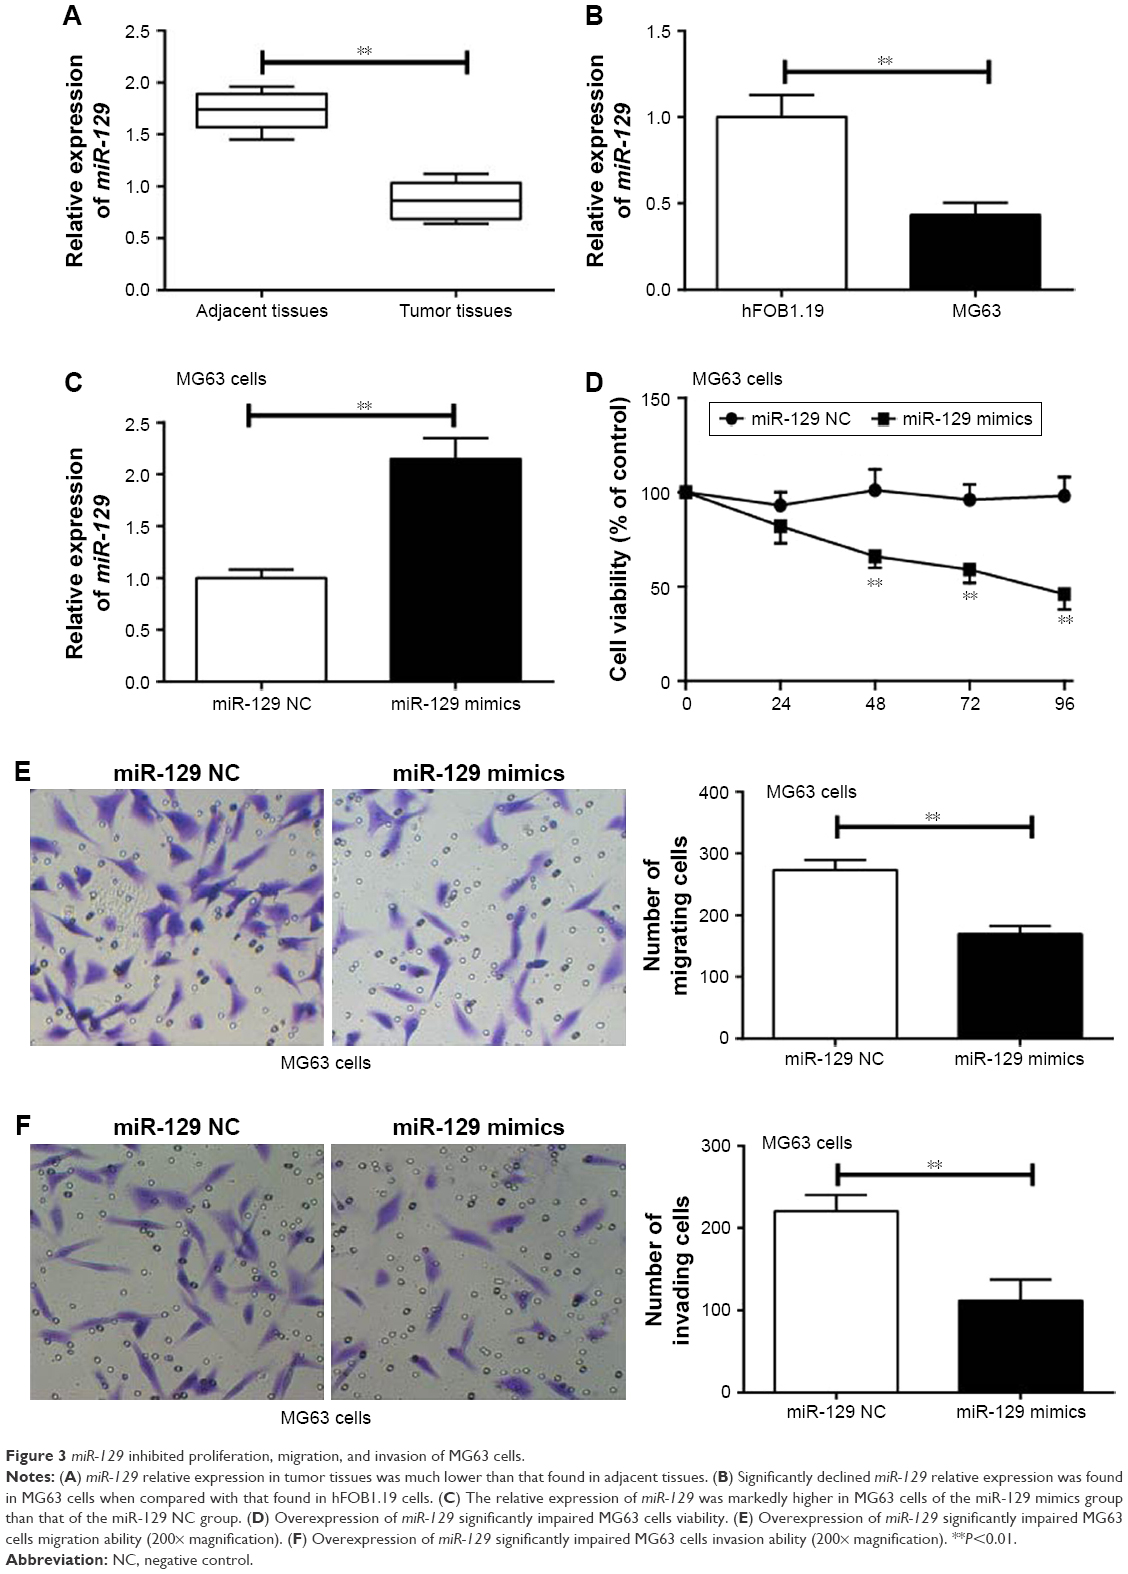 | Figure 3 miR-129 inhibited proliferation, migration, and invasion of MG63 cells. |
miR-129 was targetedly and negatively regulated by MALAT1
Correlation analysis between MALAT1 and miR-129 expression in tumor tissues was investigated. The result indicated an obviously negative correlation between MALAT1 and miR-129 expression levels (P<0.01) (Figure 4A). After being transfected by MALAT1 siRNA or its NC, miR-129 relative expression in MG63 cells of si-MALAT1 group was significantly higher than that of si-NC group (P<0.01) (Figure 4B). Starbase online prediction results showed that MALAT1 was directly bound to miR-129 at 3′UTR region. The binding site is shown in Figure 4C. Luciferase reporter gene assay also demonstrated significantly increased relative luciferase activity in WT+ si-MALAT1 group when compared with WT+ si-NC group (P<0.01). However, no statistical significance was found in relative luciferase activity between MT+ si-MALAT1 group and MT+ si-NC group (Figure 4D). All these results indicated that miR-129 was directly and negatively regulated by MALAT1.
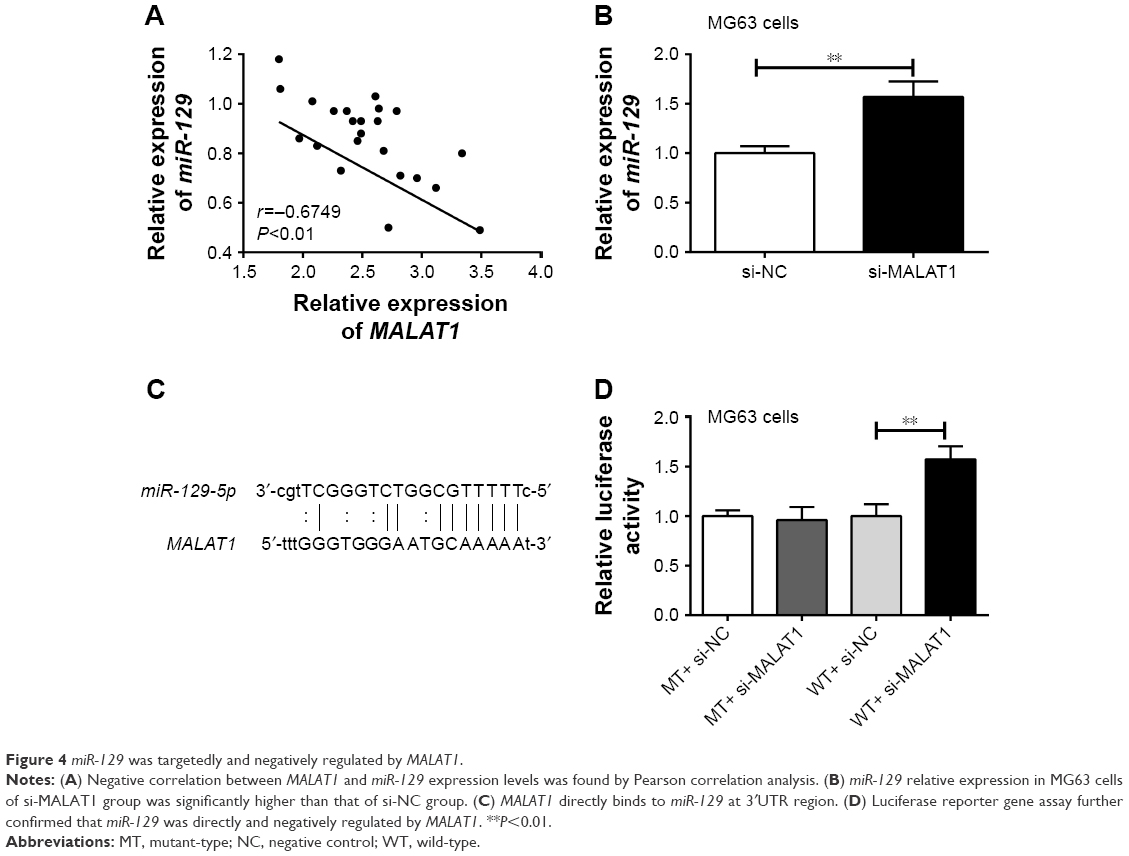 | Figure 4 miR-129 was targetedly and negatively regulated by MALAT1. |
TGIF2 was upregulated in osteosarcoma tumor tissues and MG63 cells, and its expression might be affected by MALAT1 and miR-129
As shown in Figure 5A and B, the relative expression of TGIF2 mRNA and protein in osteosarcoma tumor tissues was dramatically higher than those in adjacent tissues (P<0.01). Meanwhile, when compared with hFOB1.19 cells, MG63 cells had much higher TGIF2 mRNA and protein relative expression (P<0.01) (Figure 5C and D). Pearson correlation analysis revealed that there was a positive correlation between TGIF2 mRNA and MALAT1 expression (P<0.01), while a negative correlation was observed between TGIF2 mRNA and miR-129 expression (P<0.05) (Figure 5E and F).
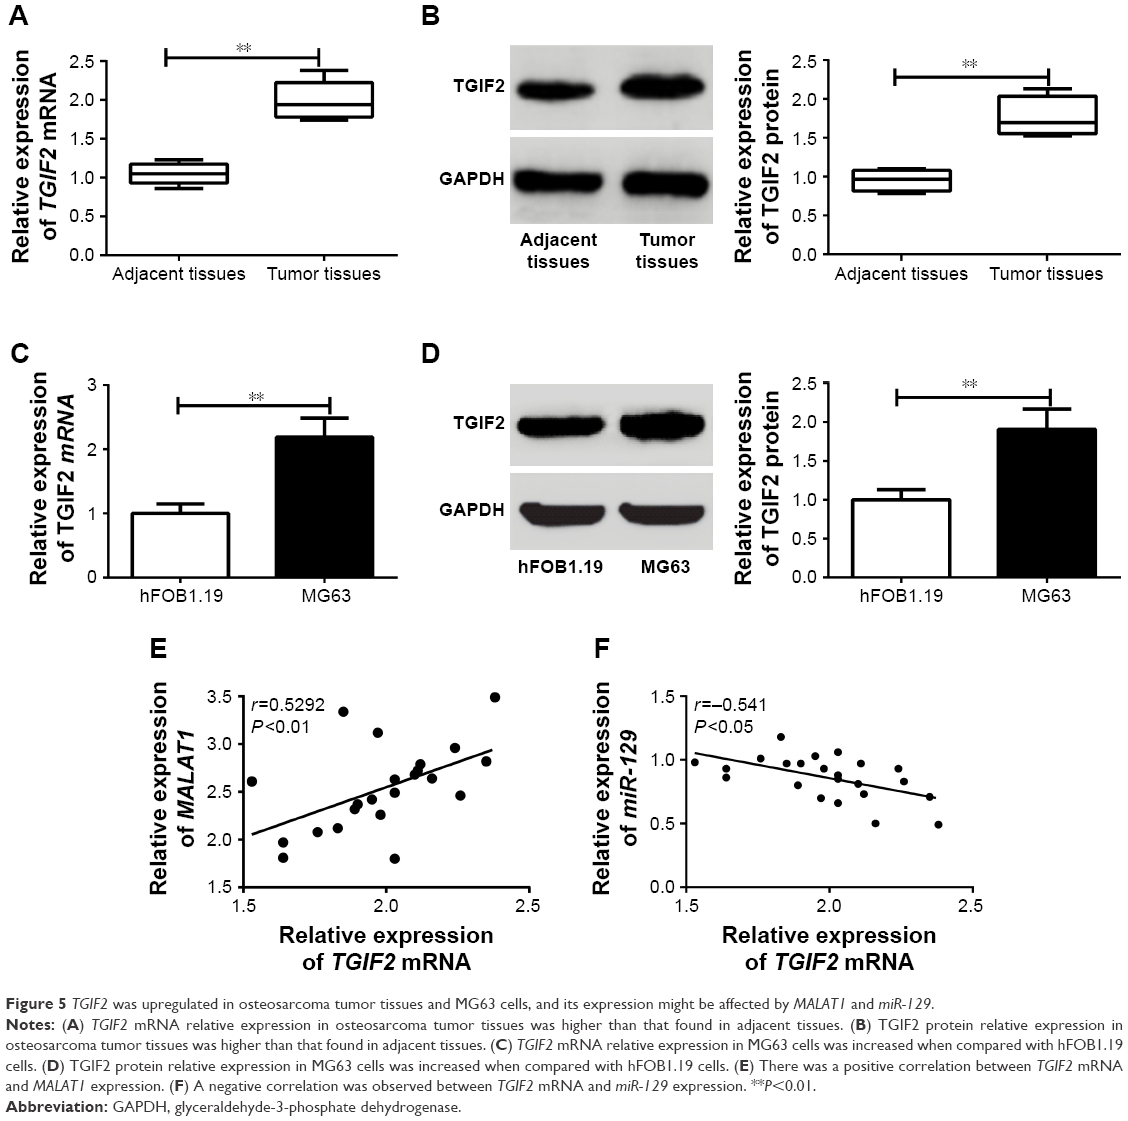 | Figure 5 TGIF2 was upregulated in osteosarcoma tumor tissues and MG63 cells, and its expression might be affected by MALAT1 and miR-129. |
TGIF2 was directly and negatively regulated by miR-129
Compared with miR-129 NC group, MG63 cells of miR-129 mimics group had significantly lower TGIF2 mRNA and protein relative expression (P<0.01) (Figure 6A and B). We speculated that TGIF2 might be regulated by miR-129. Therefore, Target Scan online forecasting was used to verify this speculation. As seen in Figure 6C, miR-129 was directly bound to TGIF2 at 3′UTR region. Luciferase reporter assay suggested that there was no statistical significance in luciferase activity between MT+ NC group and MT+ mimics group. However, the luciferase activity was found to be significantly decreased in the WT+ mimics group when compared with the WT+ NC group (P<0.01) (Figure 6D), indicating that TGIF2 was targetedly and negatively regulated by miR-129.
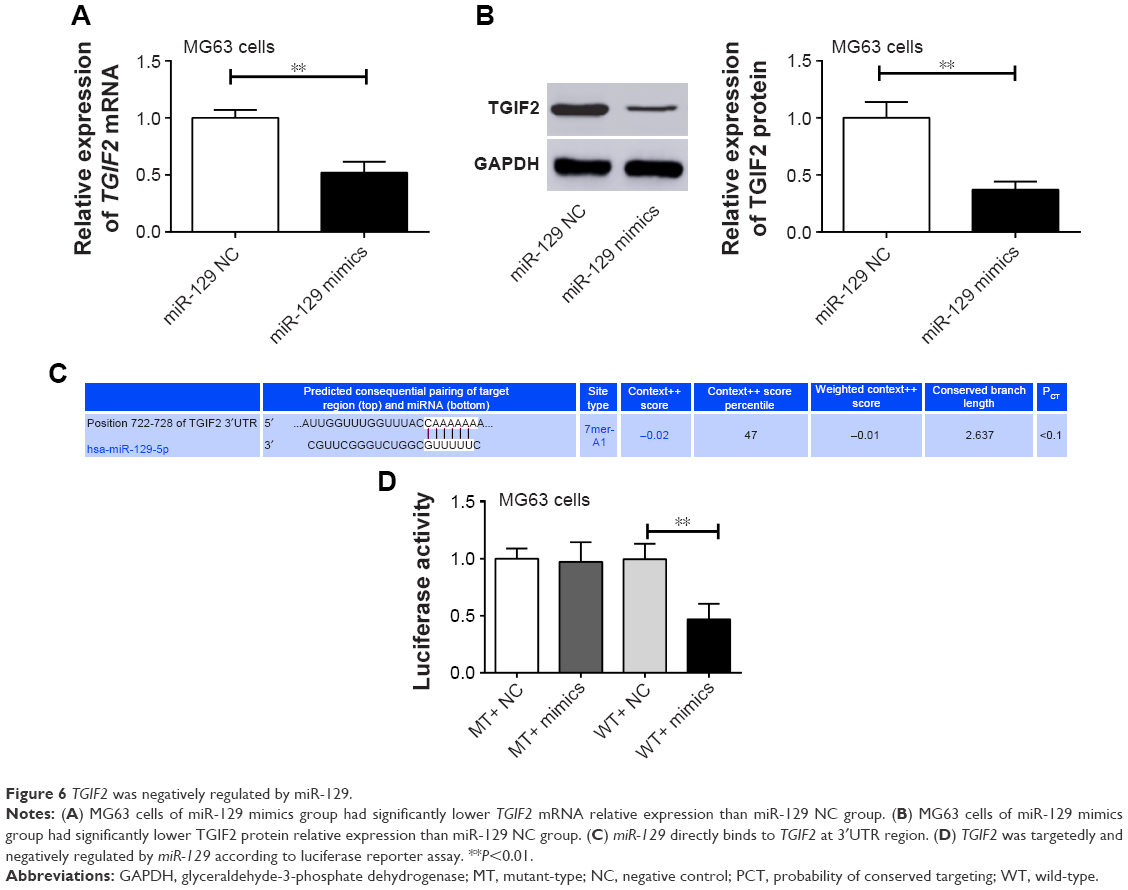 | Figure 6 TGIF2 was negatively regulated by miR-129. |
MALAT1 promoted proliferation, migration, and invasion of MG63 cells by upregulating TGIF2 via negatively regulating miR-129
This research still studied the interaction mechanism of MALAT1, miR-129, and TGIF2 affecting osteosarcoma progression. When compared with p-Empty vector group, p-MALAT1+ miR-129 mimics group, and p-MALAT1+ si-TGIF2 group, significantly increased TGIF2 mRNA and protein relative expression could be seen in p-MALAT1 group (P<0.01) (Figure 7A and B). From 48 to 96 hours, the cell viability of p-MALAT1 group was much higher than the other three groups (P<0.01) (Figure 7C). Moreover, the number of migration and invasion cells of p-MALAT1 group was the highest, which was markedly higher than that of the other three groups (P<0.01) (Figure 7D and E). Thus, MALAT1 promoted proliferation, migration, and invasion of MG63 cells by upregulating TGIF2 via negatively regulating miR-129.
 | Figure 7 MALAT1 promoted proliferation, migration, and invasion of MG63 cells by upregulating TGIF2 via negatively regulating miR-129. |
Discussion
Rapid growth and metastasis of osteosarcoma was the leading cause of death.18 The discovery of effective prognostic factors and therapeutic targets are important tasks in improving the prognosis of patients with osteosarcoma. The regulation effect of lncRNAs in various tumors has attracted the attention of researchers. lncRNA MALAT1 is located on chromosome 11q13, which has been pointed out to be involved in the regulation of multiple cancers.19 Tee et al20 suggested that, under hypoxic conditions, overexpression of MALAT1 stimulated tumor-driven angiogenesis by promoting fibroblast growth factor 2 expression and vasculature formation. In gastric cancer, high MALAT1 expression predicted deep tumor invasion.21 Jadaliha et al22 considered that MALAT1 was a metastasis driver, which could also serve as a prognostic marker for breast cancer patients. High level of MALAT1 was still closely related to shorter survival rate in nephrectomy patients.23,24 Existing literatures have also found abnormal expression of MALAT1 in osteosarcoma. Through Kaplan–Meier survival analysis, Huo et al3 reported that high serum MALAT1 expression of osteosarcoma patients exhibited declined survival rate, and MALAT1 promoted migration of osteosarcoma cells and invasion by negatively regulating EZH2. Li et al25 illustrated that upregulation of MALAT1 was related to unfavorable prognosis in osteosarcoma patients. MALAT1 could also enhance proliferation of osteosarcoma cells by inhibiting miR-205 and stimulating SMAD4. In this study, we observed that MALAT1 was aberrantly overexpressed in osteosarcoma tissues and cells, which enhanced osteosarcoma cells proliferation, migration, and invasion by upregulating TGIF2 via suppressing miR-129.
miR-129 acted as a tumor suppressor in a variety of cancers, such as glioma, gastric cancer, and renal cell carcinoma.26–28 In this study, miR-129 was downregulated in osteosarcoma tissues and cells, and the proliferation, migration, and invasion ability of osteosarcoma cells was remarkably decreased after miR-129 was overexpressed. A previous study has also shown that osteosarcoma cells with high miR-129 expression had decreased migration and invasion ability.29 Several articles also reported the relationship between MALAT1 and miR-129 in tumors. For example, Zuo et al30 demonstrated that MALAT1 promoted the progression of triple-negative breast cancer cells through mediating the expression of miR-129. In colon cancer, miR-129 was found to be directly regulated by MALAT1. MALAT1 could cause extremely elevated expression of HMGB by sponging miR-129, thereby promoting the progression of colon cancer.16 Other studies have also reported that MALAT1/miR-129 axis could be used as candidate biomarker in glioma.31 Currently, only one published literature was found to have studied the relationship between miR-129 and MALAT1 in osteosarcoma. Liu et al32 found that MALAT1 promoted osteosarcoma cells growth through suppression of miR-129 expression. Our study further revealed that in osteosarcoma, miR-129 was negatively and targetedly regulated by MALAT1.
TGIF2 acts as an oncogene, the upregulation of which was first discovered in ovarian cancer.33 It has also been confirmed to be upregulated in many malignant tumors, including multiple myeloma cancer, non-small-cell lung cancer, prostate cancer, and so on.33–35 Accumulated studies have found that TGIF2 was regulated by multiple miRNAs in tumors. It could be negatively regulated by miR-34 in gastric and breast cancer, and multiple myeloma.34,36,37 In non-small-cell lung cancer, TGIF2 was targeted and inhibited by miR-541-3p. It reversed the inhibition of growth and metastasis of non-small lung cancer cells induced by miR-541-3p overexpression.33 In glioma, TGIF2 expression was also found to be inhibited by miR-129,38 which was similar to the findings of this study.
There was a limitation in this research. We performed correlation analysis of expression relationships between MALAT1 and miR-129 or TGIF2 by Pearson correlation analysis. However, some potential interfering causes might also affect the correlation between these genes expression. Due to some limitations, we are currently unable to conduct related research. This will be further explored in our future research.
Conclusion
MALAT1 was upregulated in osteosarcoma tissues and cells, which enhanced osteosarcoma cells proliferation, migration, and invasion by upregulating TGIF2 via suppression of miR-129. Therefore, MALAT1 might be a new potential target for diagnosis and treatment of osteosarcoma.
Disclosure
The authors report no conflicts of interest in this work.
References
Mukherjee S, Dash S, Lohitesh K, Chowdhury R. The dynamic role of autophagy and MAPK signaling in determining cell fate under cisplatin stress in osteosarcoma cells. PLoS One. 2017;12(6):e0179203. | ||
Ottaviani G, Jaffe N. The epidemiology of osteosarcoma. Cancer Treat Res. 2009;152:3–13. | ||
Huo Y, Li Q, Wang X, et al. MALAT1 predicts poor survival in osteosarcoma patients and promotes cell metastasis through associating with EZH2. Oncotarget. 2017;8(29):46993–47006. | ||
Jain S, Thakkar N, Chhatai J, Pal Bhadra M, Bhadra U. Long non-coding RNA: Functional agent for disease traits. RNA Biol. 2017;14(5):522–535. | ||
Luo X, Qiu Y, Jiang Y, et al. Long non-coding RNA implicated in the invasion and metastasis of head and neck cancer: possible function and mechanisms. Mol Cancer. 2018;17(1):14. | ||
Qiu L, Wang T, Xu X, Wu Y, Tang Q, Chen K. Long non-coding RNAs in hepatitis B virus-related hepatocellular carcinoma: regulation, functions, and underlying mechanisms. Int J Mol Sci. 2017;18(12):E2505. | ||
Yang W, Li Y, He F, Wu H. Microarray profiling of long non-coding RNA (lncRNA) associated with hypertrophic cardiomyopathy. BMC Cardiovasc Disord. 2015;15:62. | ||
Li H, Liu X, Zhang L, Li X. LncRNA BANCR facilitates vascular smooth muscle cell proliferation and migration through JNK pathway. Oncotarget. 2017;8(70):114568–114575. | ||
Ma B, Li M, Zhang L, et al. Upregulation of long non-coding RNA TUG1 correlates with poor prognosis and disease status in osteosarcoma. Tumour Biol. 2016;37(4):4445–4455. | ||
Lv GY, Miao J, Zhang XL. Long noncoding RNA XIST promotes osteosarcoma progression by targeting Ras-related protein RAP2B via miR-320b. Oncol Res. 2018;26(6):837–846. | ||
Li P, Zhang X, Wang H, et al. MALAT1 is associated with poor response to oxaliplatin-based chemotherapy in colorectal cancer patients and promotes chemoresistance through EZH2. Mol Cancer Ther. 2017;16(4):739–751. | ||
Li LJ, Chai Y, Guo XJ, Chu SL, Zhang LS. The effects of the long non-coding RNA MALAT-1 regulated autophagy-related signaling pathway on chemotherapy resistance in diffuse large B-cell lymphoma. Biomed Pharmacother. 2017;89:939–948. | ||
Zhou S, Xiong M, Dai G, et al. MicroRNA-192-5p suppresses the initiation and progression of osteosarcoma by targeting USP1. Oncol Lett. 2018;15(5):6947–6956. | ||
Zhai J, Qu S, Li X, et al. miR-129 suppresses tumor cell growth and invasion by targeting PAK5 in hepatocellular carcinoma. Biochem Biophys Res Commun. 2015;464(1):161–167. | ||
Setijono SR, Park M, Kim G, Kim Y, Cho KW, Song SJ. miR-218 and miR-129 regulate breast cancer progression by targeting Lamins. Biochem Biophys Res Commun. 2018;496(3):826–833. | ||
Wu Q, Meng WY, Jie Y, Zhao H. LncRNA MALAT1 induces colon cancer development by regulating miR-129-5p/HMGB1 axis. J Cell Physiol. 2018;233(9):6750–6757. | ||
Li J, Wang H, Ke H, Ni S. MiR-129 regulates MMP9 to control metastasis of non-small cell lung cancer. Tumour Biol. 2015;36(8):5785–5790. | ||
Zhuo B, Li Y, Gu F, et al. Overexpression of CD155 relates to metastasis and invasion in osteosarcoma. Oncol Lett. 2018;15(5):7312–7318. | ||
Zhai H, Li XM, Maimaiti A, et al. Prognostic value of long noncoding RNA MALAT1 in digestive system malignancies. Int J Clin Exp Med. 2015;8(10):18099–18106. | ||
Tee AE, Liu B, Song R, et al. The long noncoding RNA MALAT1 promotes tumor-driven angiogenesis by up-regulating pro-angiogenic gene expression. Oncotarget. 2016;7(8):8663–8675. | ||
Lee NK, Lee JH, Ivan C, et al. MALAT1 promoted invasiveness of gastric adenocarcinoma. BMC Cancer. 2017;17(1):46. | ||
Jadaliha M, Zong X, Malakar P, et al. Functional and prognostic significance of long non-coding RNA MALAT1 as a metastasis driver in ER negative lymph node negative breast cancer. Oncotarget. 2016;7(26):40418–40436. | ||
Chen H, Meng T, Liu X, et al. Long non-coding RNA MALAT-1 is downregulated in preeclampsia and regulates proliferation, apoptosis, migration and invasion of JEG-3 trophoblast cells. Int J Clin Exp Pathol. 2015;8(10):12718–12727. | ||
Sun L, Sun P, Zhou QY, Gao X, Han Q. Long noncoding RNA MALAT1 promotes uveal melanoma cell growth and invasion by silencing of miR-140. Am J Transl Res. 2016;8(9):3939–3946. | ||
Li Q, Pan X, Wang X, et al. Long noncoding RNA MALAT1 promotes cell proliferation through suppressing miR-205 and promoting SMAD4 expression in osteosarcoma. Oncotarget. 2017;8(63):106648–106660. | ||
Yang Y, Huang JQ, Zhang X, Shen LF. MiR-129-2 functions as a tumor suppressor in glioma cells by targeting HMGB1 and is down-regulated by DNA methylation. Mol Cell Biochem. 2015;404(1–2):229–239. | ||
Wang Q, Yu J. MiR-129-5p suppresses gastric cancer cell invasion and proliferation by inhibiting COL1A1. Biochem Cell Biol. 2018;96(1):19–25. | ||
Hl X, Feng YY, Jia ZK. MicroRNA-129-5p inhibits the proliferation and migration in renal cell carcinoma via targeting IGF2BP1. Int J Clin Exp Pathol. 2016;9:8254–8260. | ||
Long XH, Zhou YF, Peng AF, et al. Demethylation-mediated miR-129-5p up-regulation inhibits malignant phenotype of osteogenic osteosarcoma by targeting Homo sapiens valosin-containing protein (VCP). Tumour Biol. 2015;36(5):3799–3806. | ||
Zuo Y, Li Y, Zhou Z, Ma M, Fu K. Long non-coding RNA MALAT1 promotes proliferation and invasion via targeting miR-129-5p in triple-negative breast cancer. Biomed Pharmacother. 2017;95:922–928. | ||
Xiong Z, Wang L, Wang Q, Yuan Y. LncRNA MALAT1/miR-129 axis promotes glioma tumorigenesis by targeting SOX2. J Cell Mol Med. 2018;22(8):3929–3940. | ||
Liu K, Huang J, Ni J, et al. MALAT1 promotes osteosarcoma development by regulation of HMGB1 via miR-142-3p and miR-129-5p. Cell Cycle. 2017;16(6):578–587. | ||
Lu YJ, Liu RY, Hu K, Wang Y. MiR-541-3p reverses cancer progression by directly targeting TGIF2 in non-small cell lung cancer. Tumour Biol. 2016;37(9):12685–12695. | ||
Wu S, He X, Li M, et al. MiRNA-34a overexpression inhibits multiple myeloma cancer stem cell growth in mice by suppressing TGIF2. Am J Transl Res. 2016;8(12):5433–5443. | ||
Zhiping C, Shijun T, Linhui W, Yapei W, Lianxi Q, Qiang D. MiR-181a promotes epithelial to mesenchymal transition of prostate cancer cells by targeting TGIF2. Eur Rev Med Pharmacol Sci. 2017;21(21):4835–4843. | ||
Hu Y, Pu Q, Cui B, Lin J. MicroRNA-34a inhibits tumor invasion and metastasis in gastric cancer by targeting Tgif2. Int J Clin Exp Pathol. 2015;8(8):8921–8928. | ||
Krzeszinski JY, Wei W, Huynh HD, et al. Abstract P6-17-01: MicroRNA-34a suppresses breast cancer bone metastasis by inhibiting osteoclastogenesis and targeting tgif2. Cancer Res. 2015;75 (Suppl 9):P6-17-01. | ||
Diao Y, Jin B, Huang L, Zhou W. MiR-129-5p inhibits glioma cell progression in vitro and in vivo by targeting TGIF2. J Cell Mol Med. 2018;22(4):2357–2367. |
 © 2018 The Author(s). This work is published and licensed by Dove Medical Press Limited. The full terms of this license are available at https://www.dovepress.com/terms.php and incorporate the Creative Commons Attribution - Non Commercial (unported, v3.0) License.
By accessing the work you hereby accept the Terms. Non-commercial uses of the work are permitted without any further permission from Dove Medical Press Limited, provided the work is properly attributed. For permission for commercial use of this work, please see paragraphs 4.2 and 5 of our Terms.
© 2018 The Author(s). This work is published and licensed by Dove Medical Press Limited. The full terms of this license are available at https://www.dovepress.com/terms.php and incorporate the Creative Commons Attribution - Non Commercial (unported, v3.0) License.
By accessing the work you hereby accept the Terms. Non-commercial uses of the work are permitted without any further permission from Dove Medical Press Limited, provided the work is properly attributed. For permission for commercial use of this work, please see paragraphs 4.2 and 5 of our Terms.