")
Back to Journals » Journal of Asthma and Allergy » Volume 15
MALAT1 Induces Food Allergy by Promoting Release of IL-6 from Dendritic Cells and Suppressing the Immunomodulatory Function of Tregs
Authors Feng H, Xiong X, Chen Z, Luo N, Wu Y
Received 28 September 2021
Accepted for publication 2 February 2022
Published 29 April 2022 Volume 2022:15 Pages 529—544
DOI https://doi.org/10.2147/JAA.S341742
Checked for plagiarism Yes
Review by Single anonymous peer review
Peer reviewer comments 2
Editor who approved publication: Dr Luis Garcia-Marcos
Hua Feng,1,2 Xiujuan Xiong,3 Zhuo Chen,1 Nan Luo,2 Yongning Wu1,4,5
1State Key Laboratory of Food Science and Technology, Nanchang University, Nanchang, 330000, People’s Republic of China; 2School of Public Health, Nanchang University, Nanchang, 330006, People’s Republic of China; 3Department of Pathology, Basic Medical College of Nanchang University, Nanchang, 330006, People’s Republic of China; 4China National Center for Food Safety Risk Assessment, Beijing, 100022, People’s Republic of China; 5Chinese Academy of Medical Science Research Unit, Beijing, 100730, People’s Republic of China
Correspondence: Yongning Wu, State Key Laboratory of Food Science and Technology, Nanchang University, Nanchang, 330000, People’s Republic of China, Tel +86-10-52165589, Email [email protected]
Background: Dendritic cells (DCs) comprise a valuable target for immune-modulation in food allergy (FA). Long noncoding RNA (lncRNA), metastasis associated lung adenocarcinoma transcript 1 (MALAT1) has immunomodulatory capacities and may influence the outcome of DC antigen presentation. However, the precise molecular mechanisms underlying the implication of MALAT1 in FA remain unclear.
Methods: BALB/c mice were sensitized to ovalbumin in accordance with a model of FA protocol and injected with adenovirus. After modeling, immunohistochemistry was performed to analyze the jejunal tissues of FA mice and hematoxylin-eosin staining and toluidine blue staining were performed to detect inflammation and mast cell numbers. Ovalbumin-sensitized mice were monitored for symptoms of diarrhea and rectal temperature. Immature DCs were stimulated by oxidized low density lipoprotein to trigger their maturation.
Results: MALAT1 was found highly expressed in mice with FA, and its silencing relieved allergic reactions with reduction in intestinal inflammatory cells and mast cells in FA mice. MALAT1 aggravated symptoms by downregulating zinc finger protein 36 (ZFP36). MALAT1 also downregulated ZFP36 expression to promote interleukin-6 (IL-6) secretion by DCs and maturation of DCs, with increased serum-specific immunoglobulin E (IgE) and IgG1 levels.
Conclusion: Together, these data suggested that therapeutically blocking MALAT1 in FA could reduce the severity of FA by decreasing secretion of IL-6 by DCs and suppressing the immunomodulation of Tregs.
Keywords: food allergy, metastasis associated in lung adenocarcinoma transcript 1, zinc finger protein 36, dendritic cells, interleukin 6, Tregs, immunomodulation
Introduction
Food allergy (FA) is an immune reaction caused by antigens from innocuous food protein antigens.1 Oral antigen-induced allergies are frequently elicited by immunoglobulin (Ig) E and mast cells.2 An epidemiological study has reported that FA is increasingly prevalent worldwide and the elderly are particularly vulnerable.3 Such increase can be attributed to environmental alterations, which include lower exposure to protective factors (eg, farming conditions) and increased exposure to risk factors (eg, pollution).4 The interplay of genetic and environmental factors has been implicated in allergic diseases and environmental factors may act by modulating epigenetic mechanisms that interact with an individual’s genetic background.5 The diagnosis of FA is mainly dependent on medical history and tests for sensitization, while component-resolved diagnostics is potentially applied for improving diagnostic accuracy.6 Treatment modalities under current investigation are closely associated with immunotherapy and related strategies have been explored for the prevention of FA.7
Dendritic cells (DCs) play a crucial role in immune-modulation in allergies and antigen presentation.8 Based on the marked difference between antigenic environments, ie, host “self” antigens vs foreign or pathogen-associated “non-self” antigens, DCs are classified into steady immature DCs (iDCs) and fully mature DCs presenting as two major States.9,10 The discrepancy between immature and mature DCs is partially manifested as alterations at the phenotypic and functional levels.11–13 Unlike iDCs, DCs positively modulates surface maturation ligands (CD80, CD83, and CD86) along with the major histocompatibility complex class II molecule and secrete cytokines in which the balance between inflammatory or immunostimulatory cytokines, interleukin-12 (IL-12), IL-6, and IL-1β, and immunosuppressive cytokines, IL-10 and transforming growth factor-β (TGF-β) is dependent on the environmental context.14 In normal and healthy conditions, iDCs can impair adaptive immune cells to maintain immune tolerance from attacking host antigen-presenting cells.15 Specifically, blocking regulatory T cell (Treg) function can promote FA16 and DCs are antigen-presenting cells can regulate the immunomodulatory functions of Tregs by secreting IL-6.17 Therefore, we planned to determine the molecular mechanisms engaged in regulating DCs and Tregs in FA.
Metastasis-associated lung adenocarcinoma transcript 1 (MALAT1) is a long non-coding RNA (lncRNA) that is implicated in tumorigenesis, which is linked to the maturation of DCs in atherosclerosis.18,19 MALAT1 can affect various biological processes via epigenetic modification and gene expression, and the manipulation of MALAT1 can mediate allergic immune responses in asthmatic patients,20 as well as the secretion of IL-6.21 However, how MALAT1 might function in FA is still largely unknown. MALAT1 stabilizes forkhead box protein 3 by binding to the zinc finger (ZF) domain.22 Zinc acts as an important trace element for cell-cell interactions, cellular differentiation, etc.23 Zinc finger protein 36 (ZFP36) is an AU-rich elemental protein that binds to the 3’-untranslated region and promotes the decay of target mRNA, and a reduction in ZFP36 leads to increased levels of IL-6 secreted by DCs.24,25 ZFP36 has been found to be among hub genes in androgen deprivation therapy-induced immune remodeling process26 but the role of ZFP36 in FA is still unclear.
To gain insight into the roles of MALAT1 and ZFP36 in FA, we aimed to testify the putative regulatory interaction between MALAT1 and ZFP36 in modulating IL-6 secretion by DCs and activity of Tregs, as well as in the immune modulation of FA. We also aimed to identify the involvement of Treg generation in the intestine and its association with FA.
Materials and Methods
Bioinformatics Analysis
The Gene Expression Omnibus database was used to obtain FA-related gene expression datasets GSE159706 (12 FA samples and 3 control samples) and GSE117898 (6 FA samples and 2 control samples). With |logFoldChange| > 1 and p < 0.05 as the threshold, the “limma” package in R was applied for screening of differentially expressed genes (DEGs). The RNA-binding protein (RBP) bound with lncRNAs was predicted by the ENCORI database.
Establishment of a FA Mouse Model
All experimental procedures involving animals were approved by Animal Ethics Committee of Nanchang University and were performed conforming to the Guide for the Care and Use of Laboratory Animals issued by the National Institutes of Health. Specific pathogen free (SPF) BALB/C female mice (18–20 g; aged 6–8 weeks, Charles River Laboratories, Beijing, China) were individually caged in an SPF animal laboratory at 22–25°C under humidity of 60–65% with free access to food and drinking water, under a 12-h light/darkness cycle. After one week of acclimatization, the health status of mice was verified.
Thereafter the mice were randomly assigned, with 10 mice serving as normal controls and 50 mice receiving modeling treatment. To induce sensitization, 10 mg of ovalbumin (OVA) was weighed and dissolved in 1 mL of saline. Subsequently, every 100 μg OVA was mixed with 2 mg aluminium hydroxide adjuvant, 100 μL of which was administrated into each mouse through subcutaneous injection, 1 time every 2 days. Stimulation was performed on day 7, when mice were gavaged with 50 mg of OVA (dissolved in saline) once every other day for four times in total. Control mice were administered with saline of equal amount.
After 1 week, 2 μL of adeno-associated virus (AVV) at a titer 1 × 10¹² pfu/mL was injected into mice via the tail vein, and three days later, mice were euthanized for relevant experiments. In addition to mice as control, the modeled mice were injected with adenovirus expressing short hairpin RNA (shRNA) against MALAT1 (sh-MALAT1), overexpressing ZFP36 (oe-ZFP36) and corresponding negative controls (NCs) with 10 mice for each treatment protocol.
The AVV for mice was purchased from GeenChem (Shanghai, China), and the silencing virus was constructed with the utility of GV119 vector (GeneChem), while the overexpression virus was generated utilizing the GV314 vector (GeneChem), with a viral titer of 1 × 10¹² pfu/mL. The primer sequence, vector construction, and virus packaging and purification were done by GeneChem, and the experimental steps were performed as per the manufacturer’s instructions. During the experiments, the mice were weighed weekly and recorded.
Observation of Allergic Reactions
On the 14th day of animal modeling, diarrhea was observed and recorded (mice with diarrhea having wet perianal hair) and the rectal temperature of mice was detected with a petroleum jelly-coated anal temperature thermometer. The normal rectal temperature of mice was considered as 37–38°C.
Mouse Serum Antibody Assay
Mice were anesthetized and blood was attained from the orbital venous plexus. The blood was stored at 4°C overnight and centrifuged at 3000 rpm for 10 min on the 2nd day in a frozen centrifuge at 4°C. The attained supernatant was cryopreserved at −80°C. The levels of serum OVA-specific immunoglobulin E (IgE) and IgG1 were measured by enzyme-linked immunosorbent assay (ELISA). OVA was diluted with citrate-buffered saline to an inclusion solution (100 μL) containing 200 ng OVA. A total of 100 μL of the inclusion solution was added to a 96-well plate and incubated overnight at 4°C, followed by 4 washes using 0.05% Tween-20 to phosphate buffer saline (PBS). Then, 200 μL of 5% (w/v) skim milk powder was pipetted and incubated at 37°C for 2 h. The plate was washed 4 times. The serum used for detection of specific IgE was diluted by 5 times and the serum for detection of specific IgG1 was diluted by 100 times. Next, 100 μL of the diluted serum samples to be tested was incubated in the 96-well plate for 2 h at 37°C. Antibodies for anti-mouse IgE, and horseradish peroxidase (HRP)-coupled IgG1 diluted at a ratio of 1: 2000 with 2.5% (w/v) skimmed milk powder were added, respectively. Finally, TMB color developer was added for color development at 37°C in an oven, the reaction was terminated with 2 M H2SO4 after about 10 min of color development, and the absorbance value was read at 450 nm.
Mouse Spleen Sampling with Treg Cell Assay
The mouse spleen was taken and gently ground, the splenocytes were collected and resuspended in Roswell Park Memorial Institute (RPMI) 1640 culture and fixed to 3 mL. The supernatant was removed through centrifugation at 1400 rpm for 5 min. The cells were resuspended in 2 mL of 0.83% ammonium chloride solution to lyse the erythrocytes for 2 min, and then cell lysis was terminated by adding 4 mL of PBS. After centrifugation at 1400 rpm for 5 min, the cells were washed twice with PBS, 5 min per time, counted, and resuspended in RPMI 1640 medium harboring 10% fetal bovine serum.
A total of 1 × 10⁶ splenocytes were used for flow cytometric detection of Treg content according to the instructions of mouse Forkhead Box P3 (Foxp3) fixation breaking reagent. Then, cell surface staining was performed with Fluorescein 5-isothiocyanate anti-mouse CD4 (12–0043-82, eBioscience, San Diego, CA, USA), and APC anti-mouse CD25 (17–0251-82, eBioScience), while anti-PE Anti-mouse Foxp3 (72–5775-40, eBioscience) was used for intranuclear staining. Flowjo software was employed to analyze the flow cytometry data, and CD25, Foxp3-positive cells and CD4-positive cell populations were identified.
Induction and Activation of DCs
Peripheral blood was extracted from healthy BALB/C female mice (~20 g), and from which peripheral blood mononuclear cells (PBMCs) were isolated through Ficoll-Hypaque density gradient centrifugation. PBMCs were cultured in RPMI-1640 medium replenished with rhGM-CSF (1000 U/mL) and rhIL-4 (500 U/mL) under air conditions of 5% CO2 at 37°C. The medium was renewed every three days and iDCs were harvested after 6 days of culture. The iDCs were stimulated by oxidized low-density lipoprotein (ox-LDL; 50 μg/mL, Solarbio, Beijing, China) for 24 h.
Flow Cytometric Analysis of DC Maturation Degree
DCs treated with ox-LDL were harvested and the concentration of which was adjusted to 1 × 10⁶/mL. The DC suspensions were tagged with markers of mature DCs (CD83 and CD86). IgG antibodies specific for CD83 and CD86 were added to another portion of the DC suspension as a control. The suspension was maintained in a dark room at an indoor temperature for 20 min, and then resuspended in wash buffer. DC maturation was assessed by flow cytometry.
DC Treatment
iDCs were infected with lentivirus overexpressing MALAT1, ZFP36, or corresponding NCs. In brief, the iDCs were exposed to ox-LDL for 24 h, followed by infection of lentivirus overexpressing MALAT1, ZFP36, and/or corresponding NCs. The core plasmid (PLKO.1) and helper plasmid (RRE, REV, Vsvg) inserted with the target gene silencing sequence were adopted to package the silencing lentivirus, while the core plasmid (Fugw-GFP, Plx304) and helper plasmid (RRE, REV, Vsvg) inserted with the target gene complementary DNA (cDNA) sequence were utilized for the overexpression lentivirus packaging. The lentivirus was purchased from Sangon Biotech (Shanghai, China). The viral titer used was 1 × 10⁹TU/mL. The primer sequence and plasmid construction were done by Sangon Biotech.
RNA Isolation and Quantification
Total RNAs were extracted from tissues or cells using Trizol reagent (Invitrogen, Carlsbad, CA, USA). A NanoDrop spectrophotometer (Thermo, St Louis, MO, USA) was used to analyze the amount of RNAs. The cDNA was obtained as per the instructions of mRNA Reverse Transcription Kit (B532451, Sangon Biotech) and cDNA Reverse Transcription Kit (B532445, Sangon Biotech), followed by amplification of gene fragments. Reverse transcription quantitative polymerase chain reaction (RT-qPCR) was performed with a RT-qPCR kit (Q511-02, Vazyme Biotech, Nanjing, China) used conforming to the contained instructions. With 2 μL of cDNA as the template, 0.2 μL of forward and reverse primers were mixed with 10 μL of RT-qPCR Mix and diluted up to 20 μL with RNAase-free water. PCR amplification was performed on a Bio-rad real-time qPCR instrument CFX96. MALAT1 and ZFP36 expression levels were normalized to β-actin and the primer sequences are shown in Supplementary Table 1. The relative quantification method (2−ΔΔCT method) was used to calculate the relative transcript levels of the genes to be tested.
Western Blot Analysis
Total proteins of cells or tissues were extracted using pre-cooled radio immunoprecipitation analysis lysis buffer (R0010, Solarbio) containing phenylmethylsulfonyl fluoride at 4°C strictly according to the instructions. The protein concentration of each sample was determined using a bicinchoninic acid kit (C503021-0500, Sangon Biotech). Protein separation was done using sodium dodecyl sulfate polyacrylamide gel electrophoresis and the proteins were transferred onto a polyvinylidene fluoride membrane (Millipore, Burlington, MA, USA) by wet transfer method, followed by blocking at ambient temperature with 5% bovine serum albumin for 1 h. Subsequently, diluted primary antibodies against β-actin (4970, 1: 5000, Cell Signaling Technology, Dancers, MA, USA), ZFP36 (ab204922, 1: 5000, Abcam, Cambridge, UK), IL-10 (ab189392, 1: 1000, Abcam), Foxp3 (ab215206, 1: 1000, Abcam), and TGF-β (ab215715, 1: 1000, Abcam) were allowed to incubate with the membrane overnight at 4°C. The next day, the membranes were washed 3 times at room temperature with 1 × TBST for 5 min each and then incubated with HRP-labeled goat anti-rabbit IgG (ab6721, 1: 5000, Abcam) or goat anti-mouse IgG (ab197774, 1: 5000, Abcam) as the secondary antibody for l h. The membranes were immersed in enhanced chemiluminescence reaction solution (1705062, Bio-Rad, Hercules, CA, USA) for 1 min at room temperature. The proteins were analyzed using a gel imaging system (GIS-500, Beijing Qianming Gene Technology Co., Ltd., Beijing, China) and Image J software. The relative protein content was summarized as the gray value of the corresponding protein band/the β-actin protein band. Total cellular proteins and cytoplasmic proteins were analyzed with β-actin as the internal reference.
ELISA
Commercially obtained ELISA kits including mouse IL-4 (PI612, Beyotime Biotech, Shanghai, China), mouse IL-5 (PI620, Beyotime Biotech), mouse IL-13 (P6294, Beyotime Biotech), mouse IL-10, (PI522, Beyotime Biotech), TGF-β (PT878, Beyotime Biotech), mouse IL-12 (PI530, Beyotime Biotech), mouse IL-6 (PI326, Beyotime Biotech), mouse interferon-γ (IFN-γ) (PI508, Beyotime Biotech) and mouse IL-17A (PI545) were employed to analyze the corresponding protein levels, and used according to the manufacturer’s instructions. Briefly, the supernatant was collected by centrifugation after cell treatment or harvested by centrifugation after tissue homogenization. The standard samples were prepared and the standard curves were plotted. The samples or standards of different concentrations were added (100 μL/well), and the reaction wells were sealed with sealing film (transparent), followed by incubation at room temperature for 120 min. Then, biotinylated antibody was added (100 μL/well), followed by sealing with sealing film (transparent) and incubation for 60 min. HRP-labeled Streptavidin (100 μL/well) was further added, and the reaction wells were sealed with sealing film (white) and incubated for 20 min under conditions devoid of light. After addition of TMB solution (100 μL/well), the reaction wells were sealed with sealing film (white), and incubated for 20 min at ambient temperature in light devoid conditions. The termination solution (50 μL/well) was then added and the A450 value was measured immediately.
Immunofluorescence Assay
Frozen mouse jejunal tissue sections (8 μm) were fixed with 4% formaldehyde, cleared with 0.1% Triton X-100, blocked with 5% bovine serum albumin and incubated with antibody to Foxp3 (sc-53876, Santa Cruz, CA, USA) at 4°C overnight. Then, sections were incubated with different secondary antibodies and 4’,6-diamidino-2-phenylindole (DAPI)-supplemented Vectashield mounting medium (Vector Laboratories, Burlingame, CA, USA). Fluorescence images were visualized using confocal laser scanning microscope (LSM700, Zeiss, Germany).
Hematoxylin-Eosin (H&E) Staining
Intact jejunal tissue sections were dried at room temperature, fixed for 30s, rinsed with 1 × PBS for 2 s, dyed in hematoxylin (60°C) for 60s, treated with 1% hydrochloric acid alcohol differentiation solution for 3 s, and dyed in eosin for 3 min. After dehydration with graded series of ethanol for 5 min each, the sections were treated with xylene 3 times (5 min/time) and the histomorphology of jejunum was observed under a microscope (BX63, Olympus, Japan) after mounting by balsam. Finally, Aperio ImageScope software (Leica Biosystems, Buffalo Grove, IL, USA) was used for image analysis. The numbers of eosinophils (CD11b + SiglecF +) and monocytes (CD11b + Ly6C +) were sorted and counted by flow cytometry.
Immunohistochemistry
Intact jejunal tissues were embedded with paraffin and sliced into sections for immunohistochemistry. The sections were dewaxed, and hydrated, followed by antigen retrieval at 121°C for 5 min. Endogenous peroxidase was inactivated through incubation with 3% H2O2 for 10 min. The sections were blocked with 10% goat serum, probed with mouse monoclonal antibody to Foxp3 (ab253297, 1: 50, Abcam) at 4°C overnight and re-probed with goat anti-mouse IgG (ab150113, 1: 200, Abcam) for 1 h. Color development was performed using 3,3’-diaminobenzidine for 5–10 min, followed by counterstaining with hematoxylin for 2 min. Sections were microscopically observed to count the number of Foxp3+ cells in at least 5 fields.
Toluidine Blue Staining
Mouse jejunal tissues (1 cm) were embedded with optimal cutting temperature (OTC) and stored at −80°C. The tissues were sliced into 10-μm thick sections with a frozen sectioning machine and dried, followed by fixation in pre-chilled acetone at −20°C for 10 min. These were then stained with toluene blue dye for 8 min, differentiated using 1% sodium chloride hydrochloride solution for 10 min and dehydrated with 95 and 100% ethanol for 2 min each. The sections were placed in a mixture of xylene and anhydrous ethanol (1: 1) for 2 min, followed by 2 washes in xylene and finally, mounted by balsam, and visualized under a microscope (BX63, Olympus, Japan).
Statistical Analysis
SPSS version 21.0 (IBM SPSS Statistics, Armonk, NY, USA) was used for statistical analysis. The measurement data were displayed as mean ± standard deviation. Unpaired data from two groups with normal distribution and homogeneity of variance were compared by an unpaired t-test. Data comparison between multiple groups was realized employing one-way analysis of variance (ANOVA) combined with Tukey’s post hoc test. A p-value < 0.05 suggested that the difference was statistically significant.
Results
MALAT1/ZFP36 Might Be Implicated in Treg Cell Functions and IL-6 Release of DCs in FA
As shown in Figure 1A, a total of 122 differentially expressed lncRNAs in the DCs sourced from FA samples were screened, and MALAT1 had the highest differential fold change among all upregulated lncRNAs, and was, therefore, selected as the study focus.
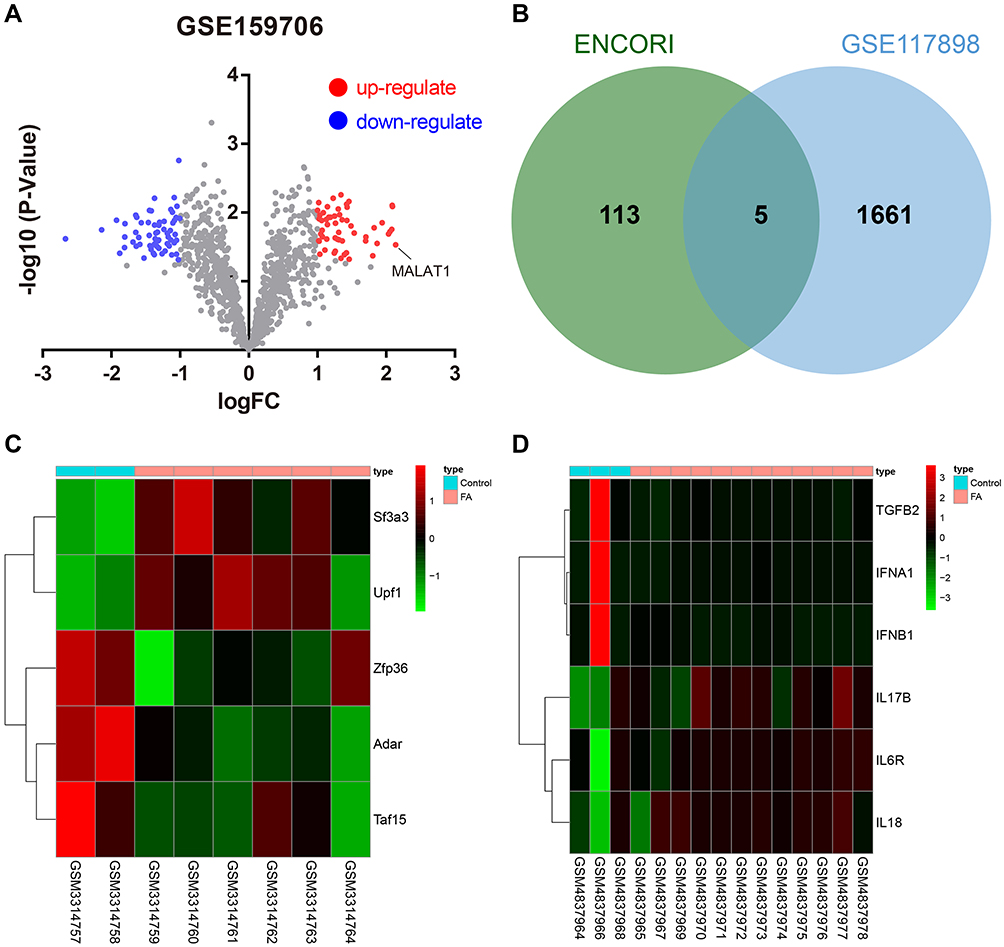 |
Figure 1 Bioinformatics analysis predicts putative FA-related genes. (A) Volcano plot of DEGs in DCs sourced from 12 FA samples and 3 control samples in the GSE159706 dataset. (B) Venn diagram showing the overlap of the RBP of MALAT1 predicted using the ENCORI database with the DEGs in GSE117898. (C) Heatmap of 5 candidate RBPs in the GSE117898 dataset. (D) Heatmap of pro-inflammatory factors and anti-inflammatory factors in the GSE159706 dataset. |
We predicted the RBP of MALAT1 using the ENCORI database, and these results were intersected with DEGs from GSE117898, thus identifying five candidate RBPs: ADAR, SF3A3, UPF1, ZFP36, and TAF15 (Figure 1B and C). Among these, ZFP36 was associated with IL-6 secreted by DCs.16 Therefore, we selected ZFP36 as the target gene for subsequent studies. In addition, the analysis of the microarray dataset GSE159706 revealed high expression levels of pro-inflammatory factors (IL6R, IL17B, and IL18) and low expression of anti-inflammatory factors (TGFB2, IFNA1, and IFNB1) in patients with FA (Figure 1D).
Based on a previous study reporting that IL-6 increases MALAT1 expression,21 we hypothesized that MALAT1 may enhance the stability of IL-6 transcripts by downregulating ZFP36, to promote IL-6 secretion from DCs, and inhibit the regulatory function of Tregs, thus inducing food allergic reactions.
MALAT1 is Highly Expressed in a FA Mouse Model, and Silencing of MALAT1 Attenuates the Symptoms of FA in Mice
Considering the findings of the aforementioned bioinformatics analysis suggesting a functional role of MALAT1 in FA, we next developed mouse models of FA. It was shown that in the FA mice, MALAT1 expression was strikingly increased in the jejunal tissues as compared to the control (Figure 2A).
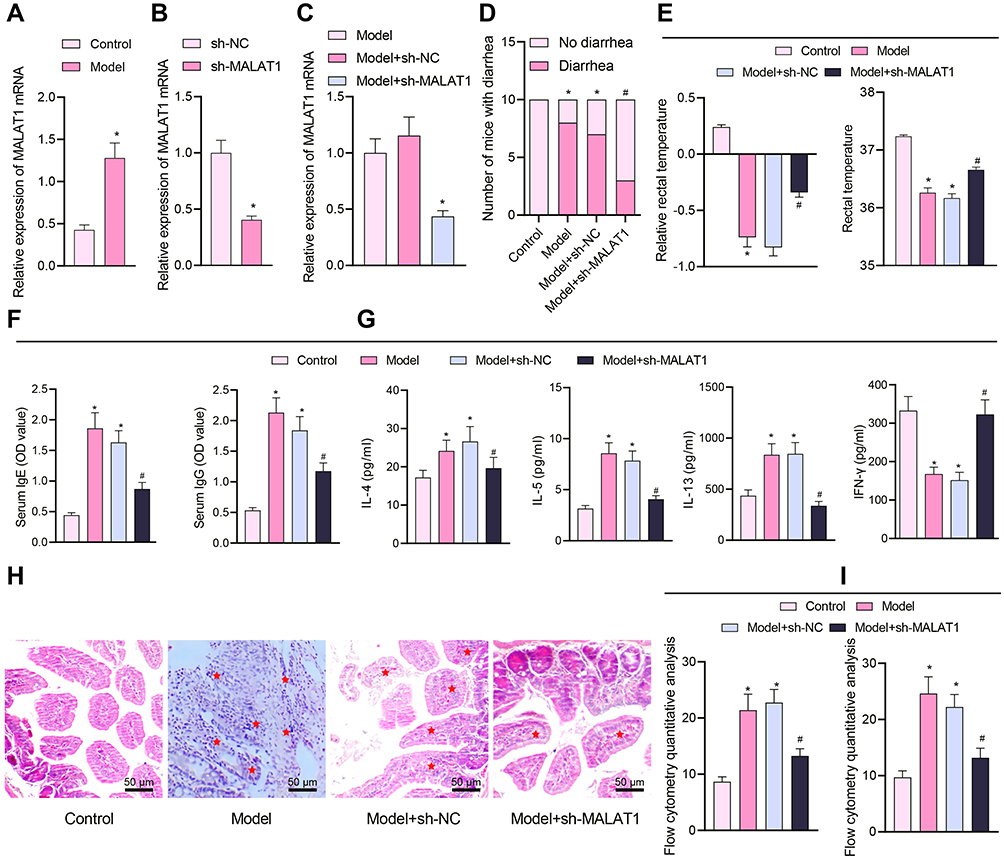 |
Figure 2 Silencing of MALAT1 affects FA symptoms in the modeled mice. (A) RT-qPCR quantification of MALAT1 expression levels in jejunal tissue samples of mice (n = 10, *p < 0.05 vs the control group). (B) RT-qPCR quantification of sh-MALAT1 silencing efficiency (*p < 0.05 vs the sh-NC group). (C) RT-qPCR quantification of MALAT1 expression levels in jejunal tissues of mice in each treatment group (*p < 0.05 vs the model group). (D) Number of mice with diarrhea. (E) Relative rectal temperature of mice. (F) ELISA to measure serum-specific IgE and IgG1 levels in mice. (G) ELISA to measure Th2 cytokines (IL-4, IL-5, and IL-13), and Th1 cytokine IFN-γ. (H) Representative H&E staining images showing inflammatory cell infiltration (shown by stars) in jejunal tissues. (I) Flow cytometric quantification of eosinophils and monocytes (left) observed by HE staining and mast cells (right) observed by Toluidine blue staining (in panels (D–I), *p < 0.05 vs the control group, #p < 0.05 vs the model + sh-NC group, n = 10). All cellular experiments were repeated 3 times independently. |
To verify the action of MALAT1 expression modulating the symptoms of FA mice, we constructed a MALAT1 silencing sequence and examined the efficiency of MALAT1 silencing sequence by RT-qPCR, which exhibited that MALAT1 expression was lowered in DCs by sh-MALAT1 (Figure 2B). In addition, MALAT1 expression was found to be reduced in the jejunal tissues of FA mice injected with virus of sh-MALAT1 (Figure 2C).
The observation of allergic symptoms showed that FA-induced mice exhibited diarrhea and reduced rectal temperature, while in the FA mice injected with virus of sh-MALAT1, diarrhea was comparatively relieved (Figure 2D), and rectal temperature appeared normal (Figure 2E). IgE antibody stimulated the release of inflammatory mediators such as histamine, serotonin, and leukotriene from mast cell degranulation, and the level of IgG1 was closely associated with the allergic reaction.27 As revealed from ELISA, serum-specific IgE and IgG1 levels were significantly increased in the FA-induced mice but reversed by injection with virus of sh-MALAT1 (Figure 2F).
As previously reported, FA is mainly induced due to the imbalance between Th1 and Th2 cells. The major cytokines secreted by Th2 cells are IL-4, IL-5, and IL-13 and that secreted by Th1 is IFN-γ.28 It was observed using ELISA that the levels of IL-4, IL-5, and IL-13 were increased and the IFN-γ levels were decreased in the FA mice. Moreover, sh-MALAT1 resulted in markedly decreased levels of IL-4, IL-5, and IL-13 and increased levels of IFN-γ in the FA mice (Figure 2G).
Histopathological observation of mouse jejunal tissues by means of H&E staining revealed that the intestinal inflammatory cells were severely infiltrated in FA mice, accompanied by more intestinal eosinophils and monocytes, whereas these histopathological changes were reversed upon MALAT1 silencing (Figure 2H and I).
We further conducted toluidine blue staining to observe the intestinal mast cells, which are considered as the core effectors of local and systemic manifestations in FA.29 The results showed that mast cells were increased in the jejunal tissues of FA mice, but reduced in the FA mice injected with sh-MALAT1 virus (Figure 2I).
These results indicated that the FA mouse model was successfully constructed, and displayed that MALAT1 expression was elevated in the jejunal tissues of FA mice. Silenced MALAT1 was able to alleviate the symptoms of FA response in mice.
MALAT1 Inhibits the Immunomodulatory Effects of Tregs in Mice with FA
Since downregulation of MALAT1 can alleviate the clinical symptoms of FA in mice, we next examined the number of Tregs in splenocytes and intestine of mice following different treatments by flow cytometry, and detected the expression of immunosuppressive factors IL-10 and TGF-β and inflammatory cytokine IL-17 to further investigate the immunosuppressive effect of MALAT1 by Western blot analysis and ELISA. The proportion of CD4+CD25+Foxp3+ cells in splenocytes was noticeably decreased in FA mice, while FA mice injected with the virus of sh-MALAT1 produced more CD4+CD25+Foxp3+ cells (Figure 3A and B).
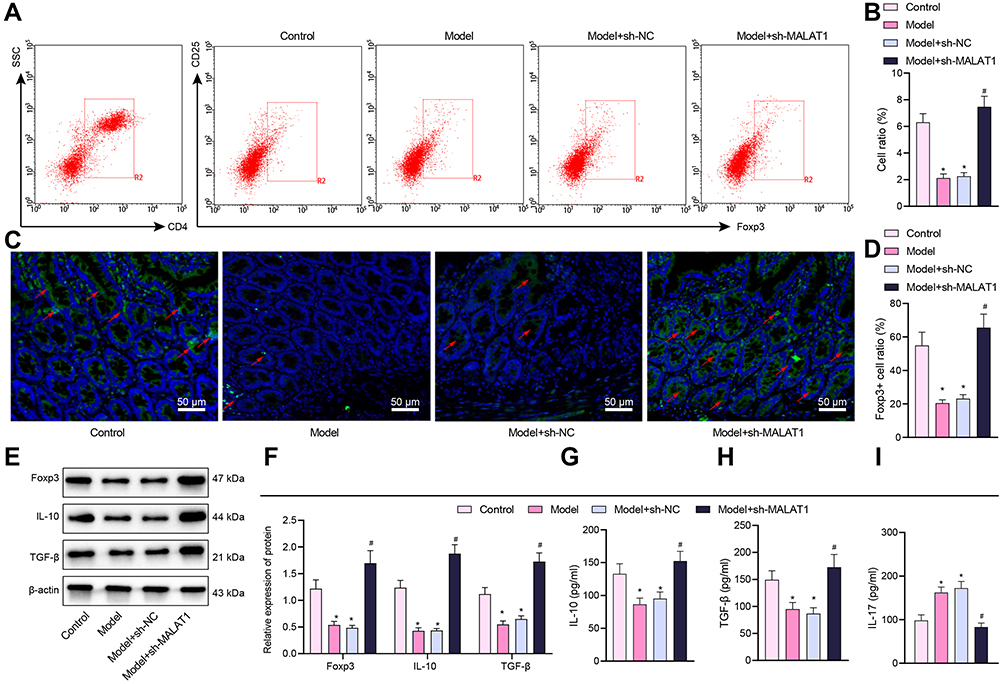 |
Figure 3 Silencing of MALAT1 induces IL-10 and TGF-β secretion by Tregs in FA mice. (A) Flow cytometry detection of the proportion of CD4+CD25+Foxp3+ cells in mouse splenocytes. (B) Results showing the proportion of CD4+CD25+Foxp3+ cells in mouse splenocytes. (C) Immunofluorescence detection of Foxp3+ cells (green fluorescence) in jejunal tissues (blue fluorescence indicates DAPI staining and red arrows indicates the localization of representative Foxp3+ cells, scale bar = 20 μm). (D) Proportion of Foxp3+ cells. (E) Representative Western blot bands of Foxp3, IL-10, and TGF-β in mouse jejunal tissues. (F) Foxp3, IL-10, and TGF-β protein expression in mouse jejunal tissues. (G) ELISA detection of IL-10 level in mouse splenocyte supernatant. (H) ELISA detection of TGF-β level in mouse splenocyte supernatant. (I) ELISA detection of IL-17 level in mouse splenocyte supernatant. *p < 0.05 vs the control group, #p < 0.05 vs the model + sh-NC group. All cellular experiments were repeated 3 times independently. |
Next, to observe whether the allergic inflammatory response was mediated by the increase of Tregs cells in the intestinal tract, immunofluorescence results of mouse jejunal tissues showed that the number of Foxp3+ cells was markedly reduced in the FA mice, but increased in theFA mice injected with virus of sh-MALAT1 (Figure 3C and D), indicating that the downregulation of MALAT1 increased the number of Tregs in the jejunal tissues.
Tregs are implicated in immunomodulation by releasing IL-10 and TGF-β.30 Western blot analysis offered data showing that the levels of Foxp3, IL-10, and TGF-β proteins were reduced in the jejunal tissues of FA mice but significantly increased in the FA mice injected with virus of sh-MALAT1 (Figure 3E and F).
Next, we performed ELISA for detecting the protein levels of IL-10, TGF-β and Th17 cell-released inflammatory factor IL-17 in mouse splenocyte culture supernatants, and the results showed that the levels of IL-10 and TGF-β were markedly decreased while IL-17 level was elevated in the FA mice, and these effects were counteracted by MALAT1 silencing (Figure 3G–I), suggesting that MALAT1 inhibited Treg activity and stimulated TH17 activity.
Hence, these data reflected that MALAT1 could impair the immune regulation of Tregs in FA.
MALAT1 Downregulates ZFP36 and Promotes IL-6 Secretion from DCs
We further explored whether MALAT1 affects ZFP36 expression thereby promoting IL-6 secretion. DCs were isolated from the FA mice for measurement of the released IL-6. Results of RT-qPCR and Western blot analysis showed that ZFP36 expression was notably decreased in DCs of the FA mice and increased following MALAT1 knockdown (Figure 4A and B). The secretion of serum inflammatory cytokines (IL-12 and IL-6) and the levels of mature DCs markers (CD83 and CD86) were measured by ELISA and flow cytometry, respectively. Serum inflammatory cytokines and mature DCs markers were elevated in the FA mice, with a significant increase in IL-6 secretion in particular. However, the secretion of serum inflammatory cytokines and mature DCs markers significantly decreased in the FA mice injected with virus of sh-MALAT1 (Figure 4C–E). The above results indicated that ZFP36 expression was decreased and IL-6 secretion was considerably increased in FA mice, both of which were reversed by inhibiting MALAT1.
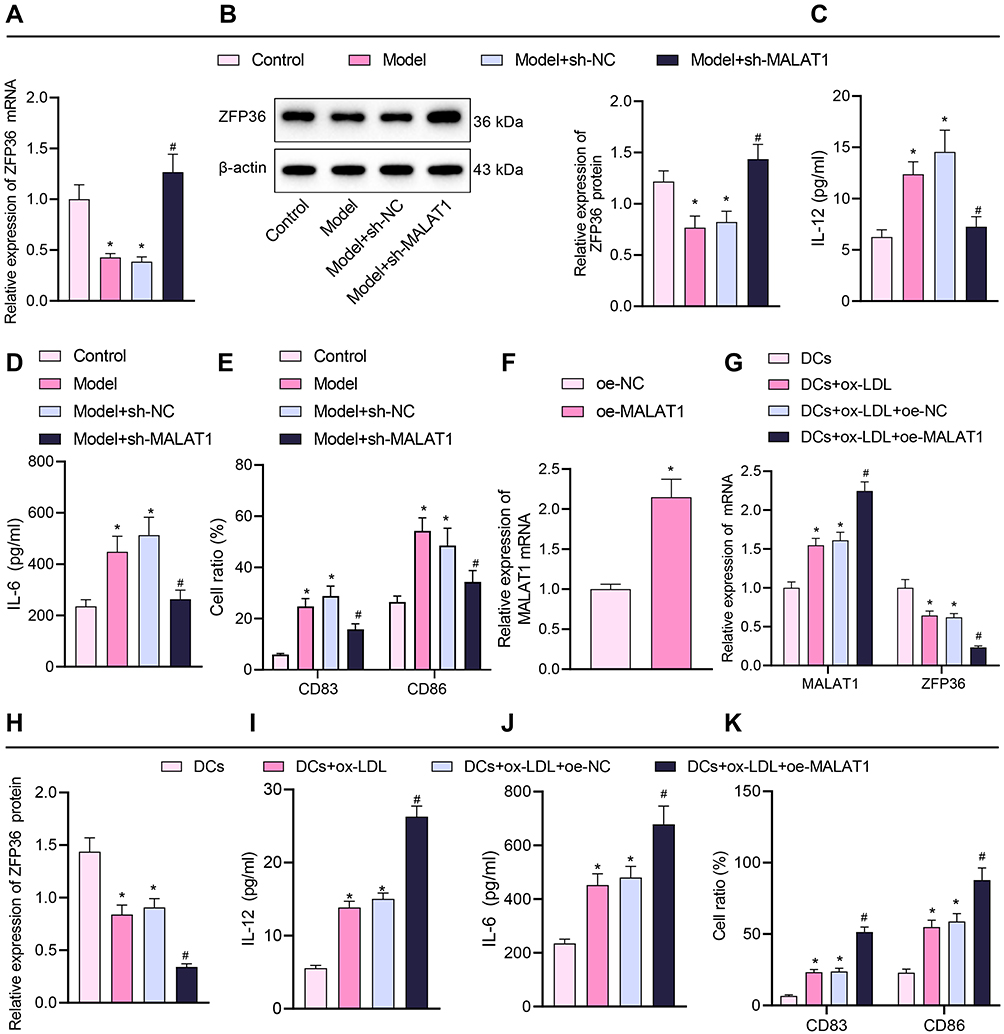 |
Figure 4 Effect of silencing or overexpression of MALAT1 on the maturation and IL-6 secretion of DCs. (A) RT-qPCR quantification of ZFP36 expression in mouse-sourced DCs. (B) Western blot assay to measure ZFP36 protein expression in mouse-sourced DCs. (C) ELISA to measure IL-12 levels in DC supernatant. (D) ELISA to measure IL-6 levels in DC supernatant. (E) Expression of CD83 and CD86 in DCs determined by flow cytometry (in panels (A–E), n = 10, *p < 0.05 vs the control group, #p < 0.05 vs the model + sh-NC group). (F) Overexpression efficiency of oe-MALAT1 determined by RT-qPCR (*p < 0.05 vs the oe-NC group. (G) Expression of MALAT1 and ZFP36 in DCs determined by RT-qPCR. (H) ZFP36 protein expression in DCs quantified by Western blot analysis. (I) IL-12 level in DC supernatant by ELISA. (J) IL-6 level in DC supernatant by ELISA. (K) Expression of CD83 and CD86 in DCs by flow cytometry (in panels (G–K), *p < 0.05 vs the DCs group, #p < 0.05 vs the DCs + ox-LDL + oe-NC group). All cellular experiments were repeated 3 times independently. |
To further investigate the role of MALAT1 in the maturation of DCs, DCs were exposed to ox-LDL for 48 h to induce mature DCs.31 Then, transfection of pcDNA3.1-MALAT1 significantly enhanced MALAT1 expression in DCs (Figure 4F). Based on the RT-qPCR and Western blot data, MALAT1 expression increased and ZFP36 expression decreased in the DCs treated with ox-LDL, while the increase of MALAT1 and the reduction of ZFP36 was more pronounced in the DCs treated with both ox-LDL and oe-MALAT1 (Figure 4G and H).
ELISA and flow cytometric analysis displayed that the levels of serum inflammatory cytokines (IL-12 and IL-6) and markers of mature DCs (CD83 and CD86) were notably augmented in the DCs exposed to ox-LDL, especially enhanced in the DCs treated with both ox-LDL and oe-MALAT1 (Figure 4I–K).
The above-mentioned results suggested that MALAT1 inhibited ZFP36 expression and promoted IL-6 secretion from DCs.
Overexpression of ZFP36 Inhibits IL-6 Secretion from DCs
To further demonstrate the correlation between ZFP36 and the release of IL-6 from DCs, we transfected oe-ZFP36 into DCs, and the transfection efficacy was validated by results of RT-qPCR (Figure 5A). Then, DCs were stimulated by ox-LDL for 48 h, followed by transfection of oe-ZFP36. At mRNA and protein levels, ZFP36 expression was remarkably reduced in the DCs treated with ox-LDL, but rescued in DCs treated with both ox-LDL and oe-ZFP36 (Figure 5B–D).
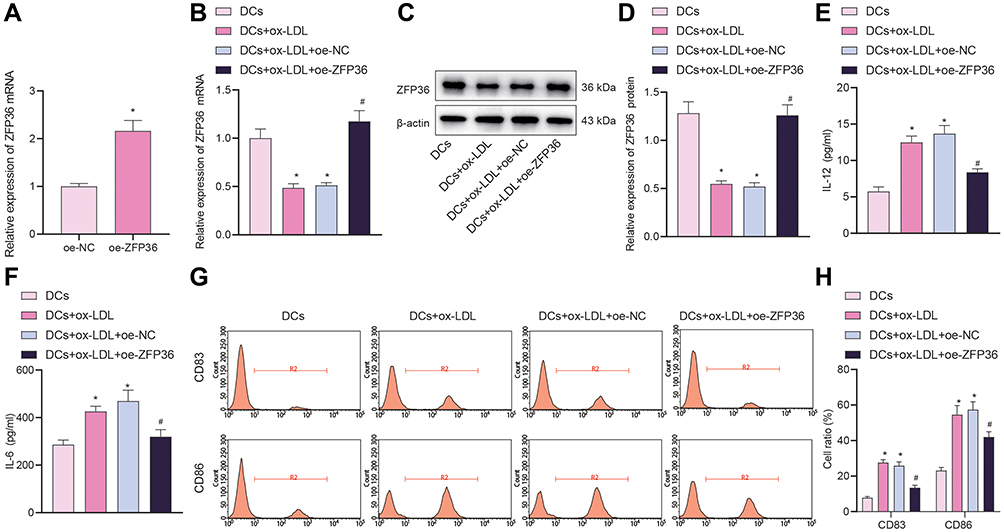 |
Figure 5 Effect of overexpressed ZFP36 on IL-6 secretion in DCs. (A) Transfection efficiency of oe-ZFP36 in DCs determined by RT-qPCR (*p < 0.05 vs the oe-NC group). (B) ZFP36 expression in DCs determined by RT-qPCR. (C) ZFP36 protein band in DCs detected by Western blot analysis. (D) ZFP36 protein level in DCs determined by Western blot analysis. (E) ELISA to measure IL-12 expression levels in DC supernatant. (F) ELISA to measure IL-6 expression in DC supernatant. (G) Expression of CD83 and CD86 in DCs measured by flow cytometry. (H) CD83 and CD86 expression in DCs measured by flow cytometry (in panels (B–H), *p < 0.05 vs the DCs group, #p < 0.05 vs the DCs + ox-LDL + oe-NC group). All cellular experiments were repeated 3 times independently. |
ELISA results showed that IL-12 and IL-6 secretion was noticeably increased in the supernatant of ox-LDL-induced DCs, which was decreased when ZFP36 expression was restored (Figure 5E and F). Flow cytometry results showed that CD83 and CD86 secretion was markedly increased in the DCs treated with ox-LDL. After treatment of ox-LDL and oeZFP36, CD83 and CD86 secretion was decreased in DCs (Figure 5G and H).
In sum, these findings showed that the overexpression of ZFP36 inhibited the IL-6 secretion from DCs.
MALAT1 Promotes IL-6 Secretion from DCs and Suppresses Treg Cell Immunomodulatory Functions to Induce FA by Downregulating ZFP36
Finally, we verified in vivo whether MALAT1 aggravated FA by downregulating ZFP36 to promote IL-6 secretion and inhibit Treg cell immunomodulation. MALAT1 expression was noticeably increased, while ZFP36 expression was decreased in the jejunal tissues of FA mice as revealed by RT-qPCR and Western blot results, whereas an elevation of ZFP36 expression was induced in the FA mice injected with virus of oe-ZFP36 (Figure 6A and B).
 |
Figure 6 MALAT1 promotes IL-6 secretion from DCs and inhibits Treg immunomodulatory function by downregulating ZFP36 expression to facilitate FA. (A) RT-qPCR to determine MALAT1 expression levels in FA mouse jejunal tissue samples. (B) RT-qPCR to determine ZFP36 expression levels in FA mouse jejunal tissue samples. (C) Number of mice with diarrhea. (D) Relative rectal temperature of mice. (E) ELISA to measure serum-specific IgE and IgG1 levels in mice. (F) ELISA to measure IL-12 and IL-6 expression in DC supernatant. (G) Determination of CD83 and CD86 expression levels in DCs by flow cytometry. n = 10, *p < 0.05 vs the control group, #p < 0.05 vs the model and model + oe-NC group. All cellular experiments were repeated 3 times independently. |
Among the FA mice, diarrhea was observed accompanied by reduced rectal temperature. Following injection with the virus of oe-ZFP36, the diarrhea was relieved and rectal temperature was normalized (Figure 6C and D). Furthermore, the increase in the levels of the serum-specific IgE and IgG1 in FA mice was reversed when ZFP36 was overexpressed (Figure 6E).
In addition, IL-12 and IL-6 secretion in DCs was increased in the FA mice as measured by ELISA, while ZFP36 re-expression led to a reduced secretion (Figure 6F). Moreover, flow cytometric analysis showed that CD83 and CD86 secretion was increased in the FA mice, but after treatment with oe-ZFP36, CD83, and CD86 secretion showed a decrease (Figure 6G).
The results of H&E staining revealed severely infiltrated intestinal inflammatory cells in the jejunal tissues of FA mice, while fewer inflammatory cells were infiltrated in the FA mice with oe-ZFP36 (Figure 7A). The results of toluidine blue staining showed that increased numbers of intestinal mast cells were found in the jejunal tissues of FA mice but reduced in the FA mice injected with the virus of oe-ZFP36 (Figure 7B).
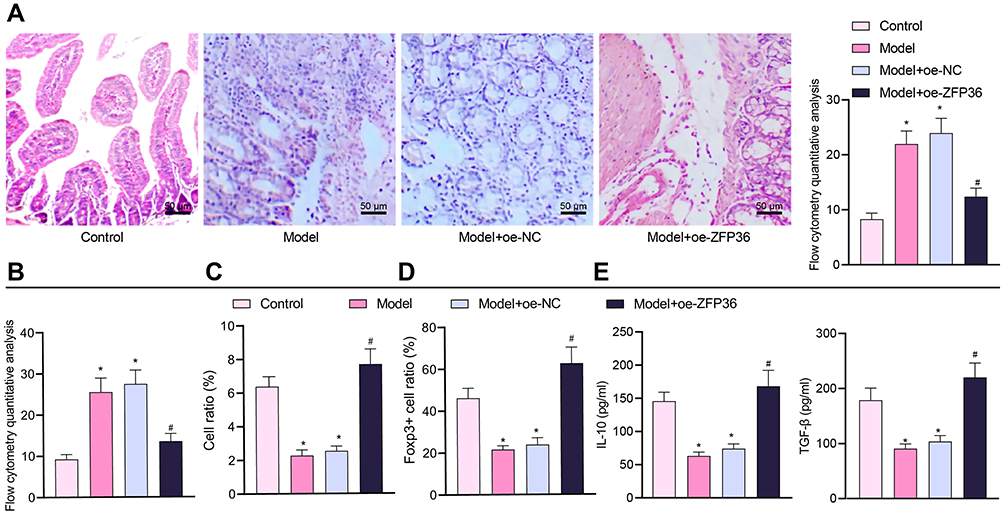 |
Figure 7 MALAT1 aggravates FA by promoting release of IL-6 from DCs and inhibiting Treg immunomodulatory function through downregulation of ZFP36. (A) Representative H&E staining images of mouse jejunal tissues to observe inflammation and flow cytometric quantification of eosinophils and monocytes. (B) Flow cytometry quantification of mast cells observed by Toluidine blue staining. (C) CD4+CD25+Foxp3+ cell ratio in mouse splenocytes. (D) Immunohistochemical detection of Foxp3+ cell ratio in mouse jejunal tissues. (E) ELISA to measure IL-10 and TGF-β expression levels in mouse splenocyte supernatant (in panels (B–E), n = 10, *p < 0.05 vs the control group, #p < 0.05 vs the model + oe-NC group). All cellular experiments were repeated 3 times independently. |
Furthermore, splenocytes were extracted from mice for subsequent flow cytometric analysis. The proportion of CD4+CD25+Foxp3+ cells in the splenocytes was decreased in FA mice, yet more CD4 + CD25 + Foxp3+ cells were produced upon restoration of ZFP36 (Figure 7C). The number of Foxp3+ cells was lessened in the jejunal tissues of FA mice, but increased in the FA mice injected with the virus of oe-ZFP36 as detected by immunohistochemistry (Figure 7D). The expression of IL-10 and TGF-β was also decreased in splenocyte supernatant of FA mice as shown by the results of ELISA, but increased in response to ZFP36 re-expression (Figure 7E).
These results suggested that the promotion of FA by MALAT1 was potentially attributable to the downregulation of ZFP36, thereby promoting the secretion of IL-6 from DCs and inhibiting the immunomodulatory function of Tregs.
Discussion
DCs are the most potent antigen-presenting cells, which dominate the immune response and are critical in mediating autoimmune response, transplant immunity, as well as infective immunity.32 DCs display antigens and interact with T cells to affect the differentiation and function of T cells, while the maturation, function, and cytokine microenvironment of DCs determine the tendency of DC-T cell interactions in immunity.33 Moreover, the expansion of Tregs from conditioned DCs may represent a promising strategy for antigen-specific modulation of unwanted immune responses.34 Identification of the molecular machinery engaged in regulating the functional states of DCs and Tregs can support the development of novel interventional strategies for FA. Our study unveiled the participation of lncRNA MALAT1 in the modulation of DCs and Tregs and further validated its regulatory role in FA.
The results of our bioinformatic study showed that MALAT1 might be associated with the function of DCs and Tregs. Type-2 immune responses are detected in individuals with allergic diseases, such as asthma and FA, and lncRNAs are involved in type-2 immune responses in both clinical and pre-clinical disease settings.35 Upregulated Circ_MALAT1 has been associated with increased DC maturation and consequent enhanced immune responsive functions.36 DCs are important immune cells that release proinflammatory cytokines including IL-6 and express T cell immunoglobulin.37 Moreover, MALAT1 can induce DCs maturation markers including CD83 and IL-6 in atherosclerosis, where aberrantly expressed MALAT1 mediates ox-LDL-treated iDCs.31 In FA mice, we further examined MALAT1 expression, and found high expression of MALAT1 in FA, while silenced MALAT1 by sh-MALAT1 reduced diarrhea and normalized rectal temperature. Nevadensin potentially alleviates food hypersensitivity by upregulating rectal temperature, suppressing the development of diarrhea, and reducing the level of serum-specific IgE in OVA-allergic mice.38 Therefore, reduced diarrhea and normalized rectal temperature might represent relieved allergic reactions induced by silenced MALAT1. Notably, Th2 cells and innate lymphoid cells are capable of releasing cytokines (IL-4, IL-5, and IL-13), among which IL-4 and IL-13 activate B cells to class-switch to IgE and exert roles in allergic inflammatory tissues.39 In our study, IL-4, IL-5, and IL-13 levels were reduced after silencing of MALAT1 in FA mice. Mast cells are the main sources of biologically active mediators that contribute to the pathological and lethal phenomena that can occur in allergic responses including anaphylaxis.40 Silenced MALAT1 decreased the number of mast cells in FA mice. Taken together, our experiments demonstrated that in FA mice, silencing of MALAT1 relieved allergic reactions, accompanied by suppressed maturation of DCs. The intestinal Treg response is crucial in the development of oral tolerance and protection against IgE-mediated food allergies.41 Increased CD4+CD25+Foxp3+ Treg frequency in the spleen indicates alleviated symptoms of allergic reaction,42 and we observed similar findings in the FA mice upon MALAT1 downregulation. Reduced expression of Foxp3, IL-10, and TGF-β represents weakened suppressive activity of Tregs and the opposite represents enhancement.43 MALAT1 knockdown significantly increased levels of Foxp3, IL-10, and TGF-β while elevating the IL-17 level, which indicated the promotive role of sh-MALAT1 in Treg immune modulation.
As shown by by bioinformatics analysis, ZFP36 was bound by MALAT1. Tristetraprolin (encoded by the ZFP36 gene) deficiency leads to the development of a complex inflammatory syndrome, and this phenotype has been largely attributed to the dysregulated production of TNF and IL-23 by DCs.44 Furthermore, ZFP36 is reported as an anti-inflammatory modulator in murine models with inflammatory diseases, stimulating decreased inflammatory cytokine production.45 In agreement, our results indicated that overexpressed ZFP36 attenuated FA by suppressing DC maturation and IL-6 secretion.
Finally, in FA modeled mice, we found that the promotion of FA by MALAT1 was achieved by downregulating ZFP36, thus promoting IL-6 secretion from DCs and inhibiting the regulatory function of Tregs. Likewise, MALAT1 was able to modulate the expression of ZFP91, another member from the zinc finger protein family, in gastric cancer.46 However, the regulatory relationship between MALAT1 and ZFP36 has rarely been explored in previous research. Of note, epidemiological data has shown correlation of environmental alterations and FA occurrence.4 Whether allergies induced by different environmental factors share similar regulatory mechanisms, and the role of MALAT1 or its downstream regulatory factors involvement in this context, is worthy of further investigation.
In conclusion, our initial results unraveled that MALAT1 was able to alter the secretion of IL-6 by DCs and regulate the immunomodulatory functions of Tregs via downregulation of ZFP36, eventually inducing FA (Figure 8). Thus, MALAT1 exerted a regulatory role in promoting FA reaction in a FA mouse model. Mechanistically, MALAT1 suppressed IL-6 production by negatively regulating ZFP36. This study offers a comprehensive functional and mechanistic characterization of MALAT1 activity with respect to functions of DCs and Tregs in FA. Furthermore, MALAT1 knockdown may have important implications in preventing FA.
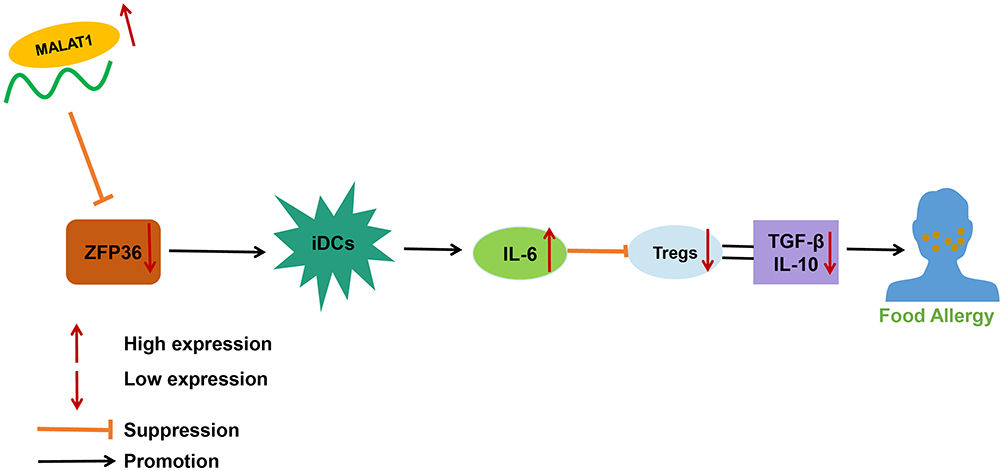 |
Figure 8 Molecular mechanism of MALAT1-mediated ZFP36 affecting the immunomodulatory function of DCs and Tregs in FA. |
Abbreviations
DCs, dendritic cells; FA, food allergy; LncRNA, long noncoding RNA; MALAT1, metastasis-associated lung adenocarcinoma transcript 1; ZFP36, zinc finger protein 36; IL-6, interleukin-6; IgE, immunoglobulin E; SPF, the specific pathogen free; CBS, citrate-buffered saline; FBS, fetal bovine serum; PBMCs, peripheral blood mononuclear cells.
Ethics Statement
All experimental procedures involving animals were approved by Animal Ethics Committee of Nanchang University and were performed conforming to the Guide for the Care and Use of Laboratory Animals issued by the National Institutes of Health.
Funding
There is no funding to report.
Disclosure
The authors declare that they have no competing interests.
References
1. Yu W, Freeland DMH, Nadeau KC. Food allergy: immune mechanisms, diagnosis and immunotherapy. Nat Rev Immunol. 2016;16(12):751–765. doi:10.1038/nri.2016.111
2. Yamaki K, Yoshino S. Tyrosine kinase inhibitor sunitinib relieves systemic and oral antigen-induced anaphylaxes in mice. Allergy. 2012;67(1):114–122. doi:10.1111/j.1398-9995.2011.02717.x
3. De Martinis M, Sirufo MM, Suppa M, Ginaldi L. New perspectives in food allergy. Int J Mol Sci. 2020;21(4):1474. doi:10.3390/ijms21041474
4. Acevedo N, Alashkar Alhamwe B, Caraballo L, et al. Perinatal and Early-Life Nutrition, Epigenetics, and Allergy. Nutrients. 2021;13(3):724. doi:10.3390/nu13030724
5. Alashkar Alhamwe B, Meulenbroek L, Veening-Griffioen DH, et al. Decreased histone acetylation levels at Th1 and regulatory loci after induction of food allergy. Nutrients. 2020;12(10):3193. doi:10.3390/nu12103193
6. Sicherer SH, Sampson HA. Food allergy: a review and update on epidemiology, pathogenesis, diagnosis, prevention, and management. J Allergy Clin Immunol. 2018;141(1):41–58. doi:10.1016/j.jaci.2017.11.003
7. Oriel RC, Wang J. Diagnosis and management of food allergy. Pediatr Clin North Am. 2019;66(5):941–954. doi:10.1016/j.pcl.2019.06.002
8. Hayen SM, Knulst AC, Garssen J, Otten HG, Willemsen LEM. Fructo-oligosaccharides modify human DC maturation and peanut-induced autologous T-cell response of allergic patients in vitro. Front Immunol. 2020;11:600125. doi:10.3389/fimmu.2020.600125
9. Reis e Sousa C. Dendritic cells in a mature age. Nat Rev Immunol. 2006;6(6):476–483. doi:10.1038/nri1845
10. Mellman I. Dendritic cells: master regulators of the immune response. Cancer Immunol Res. 2013;1(3):145–149. doi:10.1158/2326-6066.CIR-13-0102
11. Steinman RM, Idoyaga J. Features of the dendritic cell lineage. Immunol Rev. 2010;234(1):5–17. doi:10.1111/j.0105-2896.2009.00888.x
12. Reis e Sousa C. Toll-like receptors and dendritic cells: for whom the bug tolls. Semin Immunol. 2004;16(1):27–34. doi:10.1016/j.smim.2003.10.004
13. Garg AD, Dudek AM, Agostinis P. Autophagy-dependent suppression of cancer immunogenicity and effector mechanisms of innate and adaptive immunity. Oncoimmunology. 2013;2(10):e26260. doi:10.4161/onci.26260
14. Dudek AM, Martin S, Garg AD, Agostinis P. Immature semi-mature, and fully mature dendritic cells: toward a dc-cancer cells interface that augments anticancer immunity. Front Immunol. 2013;4:438. doi:10.3389/fimmu.2013.00438
15. Kappen JH, Durham SR, Veen HI, Shamji MH. Applications and mechanisms of immunotherapy in allergic rhinitis and asthma. Ther Adv Respir Dis. 2017;11(1):73–86. doi:10.1177/1753465816669662
16. Satitsuksanoa P, Jansen K, Globinska A, Van de veen W, Akdis M. Regulatory immune mechanisms in tolerance to food allergy. Front Immunol. 2018;9:2939. doi:10.3389/fimmu.2018.02939
17. Wan S, Xia C, Morel L. IL-6 produced by dendritic cells from lupus-prone mice inhibits CD4+CD25+ T cell regulatory functions. J Immunol. 2007;178(1):271–279. doi:10.4049/jimmunol.178.1.271
18. Li H, Zhu X, Hu L, Li Q, Ma J, Yan J. Loss of exosomal MALAT1 from ox-LDL-treated vascular endothelial cells induces maturation of dendritic cells in atherosclerosis development. Cell Cycle. 2019;18(18):2255–2267. doi:10.1080/15384101.2019.1642068
19. Zhu Y, Wang C, Becker SA, et al. miR-145 antagonizes SNAI1-mediated stemness and radiation resistance in colorectal cancer. Mol Ther. 2018;26(3):744–754. doi:10.1016/j.ymthe.2017.12.023
20. Foronjy R. Commentary on: the potency of lncRNA MALAT1/miR-155 in altering asthmatic Th1/Th2 balance by modulation of CTLA4. Biosci Rep. 2020;40(5). doi:10.1042/BSR20190768
21. Liu C, Yang Z, Wu J, et al. Long noncoding RNA H19 interacts with polypyrimidine tract-binding protein 1 to reprogram hepatic lipid homeostasis. Hepatology. 2018;67(5):1768–1783. doi:10.1002/hep.29654
22. Li M, Shi M, Hu C, Chen B, Li S. MALAT1 modulated FOXP3 ubiquitination then affected GINS1 transcription and drived NSCLC proliferation. Oncogene. 2021;40(22):3870–3884. doi:10.1038/s41388-021-01816-3
23. Esenboga S, Cetinkaya PG, Sahiner N, et al. Infantile atopic dermatitis: serum vitamin D, zinc and TARC levels and their relationship with disease phenotype and severity. Allergol Immunopathol. 2021;49(3):162–168. doi:10.15586/aei.v49i3.191
24. Van Tubergen EA, Banerjee R, Liu M, et al. Inactivation or loss of TTP promotes invasion in head and neck cancer via transcript stabilization and secretion of MMP9, MMP2, and IL-6. Clin Cancer Res. 2013;19(5):1169–1179. doi:10.1158/1078-0432.CCR-12-2927
25. Rosenberger CM, Podyminogin RL, Navarro G, et al. miR-451 regulates dendritic cell cytokine responses to influenza infection. J Immunol. 2012;189(12):5965–5975. doi:10.4049/jimmunol.1201437
26. Long X, Hou H, Wang X, et al. Immune signature driven by ADT-induced immune microenvironment remodeling in prostate cancer is correlated with recurrence-free survival and immune infiltration. Cell Death Dis. 2020;11(9):779. doi:10.1038/s41419-020-02973-1
27. Kanagaratham C, El Ansari YS, Lewis OL, Oettgen HC. IgE and IgG antibodies as regulators of mast cell and basophil functions in food allergy. Front Immunol. 2020;11:603050. doi:10.3389/fimmu.2020.603050
28. Shin HS, See HJ, Jung SY, et al. Turmeric (curcuma longa) attenuates food allergy symptoms by regulating type 1/type 2 helper T cells (Th1/Th2) balance in a mouse model of food allergy. J Ethnopharmacol. 2015;175:21–29. doi:10.1016/j.jep.2015.08.038
29. Kraneveld AD, Sagar S, Garssen J, Folkerts G. The two faces of mast cells in food allergy and allergic asthma: the possible concept of Yin Yang. Biochim Biophys Acta. 2012;1822(1):93–99. doi:10.1016/j.bbadis.2011.06.013
30. Palomares O, Martin-Fontecha M, Lauener R, et al. Regulatory T cells and immune regulation of allergic diseases: roles of IL-10 and TGF-beta. Genes Immun. 2014;15(8):511–520. doi:10.1038/gene.2014.45
31. Chen L, Hu L, Zhu X, et al. MALAT1 overexpression attenuates AS by inhibiting ox-LDL-stimulated dendritic cell maturation via miR-155-5p/NFIA axis. Cell Cycle. 2020;19(19):2472–2485. doi:10.1080/15384101.2020.1807094
32. Iberg CA, Jones A, Hawiger D. Dendritic cells as inducers of peripheral tolerance. Trends Immunol. 2017;38(11):793–804. doi:10.1016/j.it.2017.07.007
33. Worbs T, Hammerschmidt SI, Forster R. Dendritic cell migration in health and disease. Nat Rev Immunol. 2017;17(1):30–48. doi:10.1038/nri.2016.116
34. Wu J, Zhang H, Zheng Y, et al. The long noncoding RNA MALAT1 induces tolerogenic dendritic cells and regulatory T cells via miR155/dendritic cell-specific intercellular adhesion molecule-3 grabbing nonintegrin/IL10 axis. Front Immunol. 2018;9:1847. doi:10.3389/fimmu.2018.01847
35. Guidi R, Wedeles CJ, Wilson MS. ncRNAs in type-2 immunity. Noncoding RNA. 2020;6(1). doi:10.3390/ncrna6010010
36. Zhang Y, Zhang G, Liu Y, et al. GDF15 regulates malat-1 circular RNA and inactivates NFkappaB signaling leading to immune tolerogenic DCs for preventing alloimmune rejection in heart transplantation. Front Immunol. 2018;9:
37. Zhao Q, Yang WR, Wang XH, et al. Clostridium butyricum alleviates intestinal low-grade inflammation in TNBS-induced irritable bowel syndrome in mice by regulating functional status of lamina propria dendritic cells. World J Gastroenterol. 2019;25(36):5469–5482. doi:10.3748/wjg.v25.i36.5469
38. Zhang YF, Shu ZD, Liu QM, et al. Nevadensin relieves food allergic responses and passive cutaneous anaphylaxis in mice through inhibiting the expression of c-Kit receptors. Food Funct. 2020;11(12):10375–10385. doi:10.1039/d0fo02398a
39. Akdis CA, Arkwright PD, Bruggen MC, et al. Type 2 immunity in the skin and lungs. Allergy. 2020;75(7):1582–1605. doi:10.1111/all.14318
40. Bellomo RG, Gallenga CE, Caraffa A, Tete G, Ronconi G, Conti P. Anaphylaxis is a rare reaction in COVID-19 vaccination. J Biol Regul Homeost Agents. 2021;35(3):839–842. doi:10.23812/BELLOMO_EDIT_3_21
41. Wang J, Zheng S, Yang X, Huazeng B, Cheng Q. Influences of non-IgE-mediated cow’s milk protein allergy-associated gut microbial dysbiosis on regulatory T cell-mediated intestinal immune tolerance and homeostasis. Microb Pathog. 2021;158:
42. Zhang G, Duan X, Zhang C, Chen P, Yu J, Zheng J. Immunoregulatory effects of the traditional Dai prescription Yajieshaba on food allergic mice. Exp Ther Med. 2017;13(6):3175–3182. doi:10.3892/etm.2017.4442
43. Li H, Zhu XX, Xiang JB, Jian L. Buserelin inhibits the immunosuppressive activity of regulatory T cells through the protein kinase a signaling in a central precocious puberty model. Immunol Invest. 2021;1–15. doi:10.1080/08820139.2021.1885437
44. Andrianne M, Assabban A, La C, et al. Tristetraprolin expression by keratinocytes controls local and systemic inflammation. JCI Insight. 2017;2(11). doi:10.1172/jci.insight.92979
45. Makita S, Takatori H, Iwata A, et al. RNA-binding protein ZFP36L2 downregulates helios expression and suppresses the function of regulatory T cells. Front Immunol. 2020;11:1291. doi:10.3389/fimmu.2020.01291
46. Zhang Z, Li M, Zhang Z. lncRNA MALAT1 modulates oxaliplatin resistance of gastric cancer via sponging miR-22-3p. Onco Targets Ther. 2020;13:1343–1354. doi:10.2147/OTT.S196619
 © 2022 The Author(s). This work is published and licensed by Dove Medical Press Limited. The full terms of this license are available at https://www.dovepress.com/terms.php and incorporate the Creative Commons Attribution - Non Commercial (unported, v3.0) License.
By accessing the work you hereby accept the Terms. Non-commercial uses of the work are permitted without any further permission from Dove Medical Press Limited, provided the work is properly attributed. For permission for commercial use of this work, please see paragraphs 4.2 and 5 of our Terms.
© 2022 The Author(s). This work is published and licensed by Dove Medical Press Limited. The full terms of this license are available at https://www.dovepress.com/terms.php and incorporate the Creative Commons Attribution - Non Commercial (unported, v3.0) License.
By accessing the work you hereby accept the Terms. Non-commercial uses of the work are permitted without any further permission from Dove Medical Press Limited, provided the work is properly attributed. For permission for commercial use of this work, please see paragraphs 4.2 and 5 of our Terms.