")
Back to Journals » Nutrition and Dietary Supplements » Volume 12
Magnitude of Under Nutrition and Associated Factors Among Adolescent Street Children at Jimma Town, South West Ethiopia
Authors Bekele Daba D , Shaweno T , Taye Belete K , Workicho A
Received 4 October 2019
Accepted for publication 24 January 2020
Published 24 February 2020 Volume 2020:12 Pages 31—39
DOI https://doi.org/10.2147/NDS.S233393
Checked for plagiarism Yes
Review by Single anonymous peer review
Peer reviewer comments 2
Editor who approved publication: Dr Chandrika J Piyathilake
Derese Bekele Daba,1 Tamrat Shaweno,2 Kefyalew Taye Belete,1 Abdulhalik Workicho2
1Department of Public Health, College of Medicine and Health Science, Ambo University, Ambo, Ethiopia; 2Departement of Epidemiology, Faculty of Public Health, Jimma University, Jimma, Ethiopia
Correspondence: Kefyalew Taye Belete
Department of Public Health, College of Medicine and Health Science, Ambo University, P.O.Box 19, Ambo, Ethiopia
Tel +251 912 30 60 13
Email [email protected]
Background: Undernutrition is the major health problem in developing countries especially among underprivileged populations. In Ethiopia there is no clear information regarding the magnitude and forms of undernutrition and their associated factors among adolescent street children. This study assessed the magnitude of undernutrition and its associated factors among adolescent street children at Jimma town from March 1– 31, 2019.
Methods: A community based cross-sectional study was conducted among 312 street children. Pretested self-administered structured questions were used for data collection. Data were entered to EpiData version 3.1 and exported to SPSS version 20 for statistical analysis. WHO AnthroPlus software version 1.0.4 was used for computing standardized indicators of nutritional status. Independent variables with P-value ≤ 0.25 in bivariate analysis were included in multivariable logistic regression and variables with P-value < 0.05 in multivariable logistic regression were declared as statistically significant.
Results: A community based cross-sectional study was conducted among 312 street children from March 1– 31, 2019. The study found 29.2% (95%CI: 24– 34.0) and 30.4% (95%CI: 24.6– 35.3) magnitude of thinness and stunting respectively. Being female (AOR: 2.55; 95%CI: 1.16– 5.63), Ever skipped one or more daily meal per day (AOR: 6.56; 95%CI: 2.25– 19.15), low dietary diversity score (AOR: 1.86; 95%CI: 1.05– 3.27) and using unprotected water source (AOR: 1.78; 95%CI: 1.03– 3.05) were statistically significant factors for thinness whereas being in age group 15– 18 (AOR: 5.78; 95%CI: 3.20− 10.40) and ever used substance (AOR: 3.01; 95%CI: 1.17– 7.77) were statistically significant factors for stunting.
Conclusion: This study found that the magnitude of thinness and stunting was high among adolescent street children and a range of factors were observed that result in thinness and stunting. Service provisions targeting nutritional supply, personal and environmental sanitation should be given to these street children through intersectoral collaboration.
Keywords: adolescent, street children, stunting, thinness, undernutrition
Introduction
The term street children has many definitions in different settings.1 The United Nations defines street children as children under 18 years of age who spend all or part of their time on the street, lack supervision, or protection which makes them vulnerable to different problems.2 The United Nations' children’s fund (UNICEF) strengthens this definition.3 Street children can be of two types: child of the streets; those who have no family members left alive, or the family may have abandoned him/her so that the child struggles to survive on the streets. And a child on the street; those who spend most of the day on the streets due to poverty, overcrowding, sexual, or physical abuse at home. This group has the chance to visit family members some days and even live under a good shelter.3–5
Adolescence is a concept encompassing physical, physiological and emotional stages of transition from childhood to adulthood and the age ranges from 10 through 19.6 Adolescents who gain adequate dietary demand and emotional support at this stage gain 15–20% of adult height, up to 60% of skeletal mass and 50% of adult body weight.7 On the contrary, poor quality or quantity dietary intake during adolescence may lead to undernutrition that could resonate throughout generations.6 Such problems can be worst among adolescent street inhabitants.8
Undernutrition is common among underprivileged populations like women, children and adolescents, especially street dwellers.9,10 It is the single threat to global public health and by far the greatest contributing factor for child morbidity and mortality.11 It is a significant public health problem described as the silent killer.11,12 This public health problem can touch any segment of the population like children, adolescents, pregnant women, children of the street and so on.12,13
Adolescents, who comprise 20% of world’s population and 80% of the developing countries, are the most affected group of the population due to undernutrition, although over nutrition is an emerging problem.6 Even though prevalence of undernutrition among adolescents was not declared in the past three decades,14 it is estimated that the global burden of undernutrition, especially thinness, was found to be 8.4% for girls and 12.4% for boys.7 The global estimate for stunting among adolescents’ data varied from 52% in Guatemala and 44% in Bangladesh to 8% in Kenya and 6% in Brazil.15 However, there is a scarcity of data on the nutritional status of adolescents who are street dwellers in the global and local context.
In Ethiopia, child malnutrition has become a concern since the late 1950s when the first nutrition survey showed that protein and calorie malnutrition was rampant.16 However, there were no supporting policies and strategies related to nutrition until the formation and launching of national nutrition strategy (NNS) in February 2008.17 In addition, the country committed to improve food, nutrition security and reduce, then end, undernutrition. Some of the commitments the country hold are: the growth and transformation plan-II (GTP-II) (2015/16 to 2019/20),18 second national nutrition program II (NNP II) (2016–2020),19 Seqota declaration (2015)20 and national school health and nutrition strategy21 can be mentioned. Even though Ethiopia has many initiatives, programs and strategies, almost none of them are specifically targeted and with regard street children. The reason might be due limited information regarding the magnitude of undernutrition and the associated factors among adolescent street children since few qualitative studies exist and do not show the depth of the problem. Thus, this research aimed at filling the information gap by investigating the prevalence of undernutrition and its associated factors among street children in Ethiopia, specifically in the study area so that policy makers, aid organizations and others will gain information on the existing problem.
Methods
Study Design and Setting
Community based cross-sectional study design was employed among 312 adolescent street children at Jimma town, Oromia regional state, South West Ethiopia from March 1–31, 2019. The town is found 345 km from Addis Ababa, the capital city of Ethiopia. According to the 2015 National Urban System Study, the population of the city was 199,576, of which 100,347 are male, and 99,229 are female. The town has 13 urban Kebeles (kebele refers the lowest administrative unit) in which all street children were considered for the study (data from Jimma Town Municipality, unpublished source).
Sample Size Determination and Sampling Procedures
The total enumeration of all adolescent street children aged 12–18 years were made in the study setting. Children less than 12 years were excluded because of ethical issues explained elsewhere.22 Single population proportion formula was used to obtain a sample size of 296 with the following assumptions: 95%CI, 5% marginal error and 26% prevalence of thinness taken from studies conducted elsewhere.23 However, due to absence of recorded data about the number of street children, preliminary assessment was made to quantify the number of street children in the study area resulting in a total count of 365 adolescent street children. Then a total of 312 participants who fulfill the inclusion criteria were enumerated after intensive search throughout the 13 Kebeles in the town.
Data Collection methods and Procedures
Data were collected using pretested interviewer-administered structured questionnaires and anthropometric measurements. The questionnaire was prepared after reviewing different published literature and related studies.24–29 Questions related to sociodemographic, socioeconomic, sanitation, behavior, infection, physical and sexual violence, and health care access were prepared originally in English language and then translated to Amharic for easy management, then translated back to English to maintain the quality of data and consistent information. The translated version was pretested on 10% of the study sample in a nearby town through five trained data collectors and two supervisors.
Measurements and Tools
Dietary behavior was assessed using a qualitative food frequency questionnaire (FFQ) containing 29 food items, accessed elsewhere.24 Local food items were categorized into nine groups based on food and agriculture (FAO) recommendations in order to assess individual dietary adequacy.25 The total scores were calculated and those with a dietary diversity score (DDS) <5 were categorized as having inadequate dietary diversity and those with ≥5 adequate dietary diversity.26 Individual level food insecurity was assessed using an individual food insecurity assessment scale (IFIAS) that was previously validated in the study area.28 Street adolescents were asked whether they (1) had ever worried about having enough food; (2) had to reduce food intake because of shortages of food or money to buy food; (3) had to go without having eaten because of shortage of food or money to buy food and (4) had to ask outside the home for food because of shortage of food or money to buy food. “Yes” responses were coded “1” and “No” responses were coded “0” and the scores were summed. Adolescents who had a food insecurity score of 1 and above were labeled as food insecure (one or more “Yes” responses) or else food secure. Stool specimens were collected using clean and labeled plastic vials. The collected stool samples were properly mixed with 10 mL of 10% formalin for preservation and processed using formalin-ether concentration. All the different developmental stages (eggs, cyst, oocyst, larvae, adult and segments of adult worm) of the parasitic organism were recorded by a senior laboratory technician. Furthermore, weight was measured using digital scales (SECA) with the subjects shoeless and in light clothes and recorded to the nearest 0.1 kg. Height was measured in a standing position using a height meter mounted against a plastic board and recorded to the nearest 0.1 cm with a detachable sliding head piece.30 In this research, adolescent street children were considered as children of either sex who were within the age group of 12–18 years and who were both economically and socially engaged in street life.31 According to World Health Organization (WHO) 2007 standard reference values, height for age Z-score below –2 SD and BMI for age Z-score below −2 SD was used to identify stunting and thinness respectively in the study population.32 Ever substance use was defined based on use of at least one of the substances (alcohol, khat, cigarettes, or illicit drugs) to alter mood or behavior at any time in life.29 For physical violence, a principal component (PCA) analysis was made based on 21 items taken from elsewhere27 and two components, namely low and high physical violence created following all steps of PCA using SPSS version 20 (IBM Corporation, Armonk, NY, USA) statistical software.
Data Processing and Analysis Procedures
The collected data were entered using EpiData version 3.1 (the EpiData Association, Odense, Denmark, Europe) then exported to SPSS version 20 (Armonk, NY, USA)). Entered data were checked for completeness and errors, described and checked for outliers. For anthropometric data analysis, standard deviation (Z scores) was obtained by WHO AnthroPlus software version 1.0.4 (WHO, Geneva, Switzerland). Descriptive analysis was done to determine means, frequencies and percentage distributions for the variables. Bivariate and multivariable logistic regressions were performed. Independent variables with P-value <0.25 in bivariate logistic regression were included for multivariable logistic regression after checking their collinearity effect and normality of data using stepwise backward elimination procedure. The fitness of the model was tested by Hosmer–Lemeshow goodness of fit test. Variables were considered as statistically significant at P-value <0.05 in multivariable logistic regression with respective 95%CI.
Ethical Approval and Consent to Participate
After reviewing study procedures in detail, Jimma University Institute of Health, Faculty of Public Health Research Ethics Review Board issued ethical approval on February 25, 2019, with reference no. IHRP GO/757/2019. The official letter of support was submitted to Jimma town administrators, Jimma town health office and respective 13 kebele administrations, child and womens' affairs bureau and Jimma town police department to get permission for the study. The nature of the study was explained to the study participants to obtain assent prior to participation in the study. Since this study was conducted on children less than 18 years, it is recommended to obtain written consent from guardian or parents. Nevertheless obtaining written consent from parents of street children was problematic. Thus written informed consent was waived as indicated on Ethiopian national research ethics review guideline (page 38 sections 6.14 and page 56 sections 8.3.5.3 of national research ethics review guideline, https://www.ccghr.ca/wp-content/uploads/2013/11/national-research-ethics-review-guidline.pdf).
Finally Privacy and confidentiality of collected information was ensured at all levels.
Results
Sociodemographic Characteristics of the Respondents
A total of 312 street children were enrolled from March 1 through 31, 2019 with a response rate of 100%. The median age of study participants was 14 (IQR=2) years and the median duration of being street inhabitant was 12 (IQR=17) months. The majority of these children were born in rural areas 229 (73.4%) and came to Jimma for different reasons whereas 81 (26.0%) were born in urban areas, but 2 (0.6%) do not know their place of birth. Nearly half of the respondents mentioned that their biological parents (both father and mother) were alive whereas 130 (41.7%) mentioned one or both of their parents were not alive but 26 (8.3%) did not know about current family existence. These street children were involved in different income generating activities in order to cover their daily needs in which the median income of the respondents was 35 (IQR=20) birr/day (Table 1).
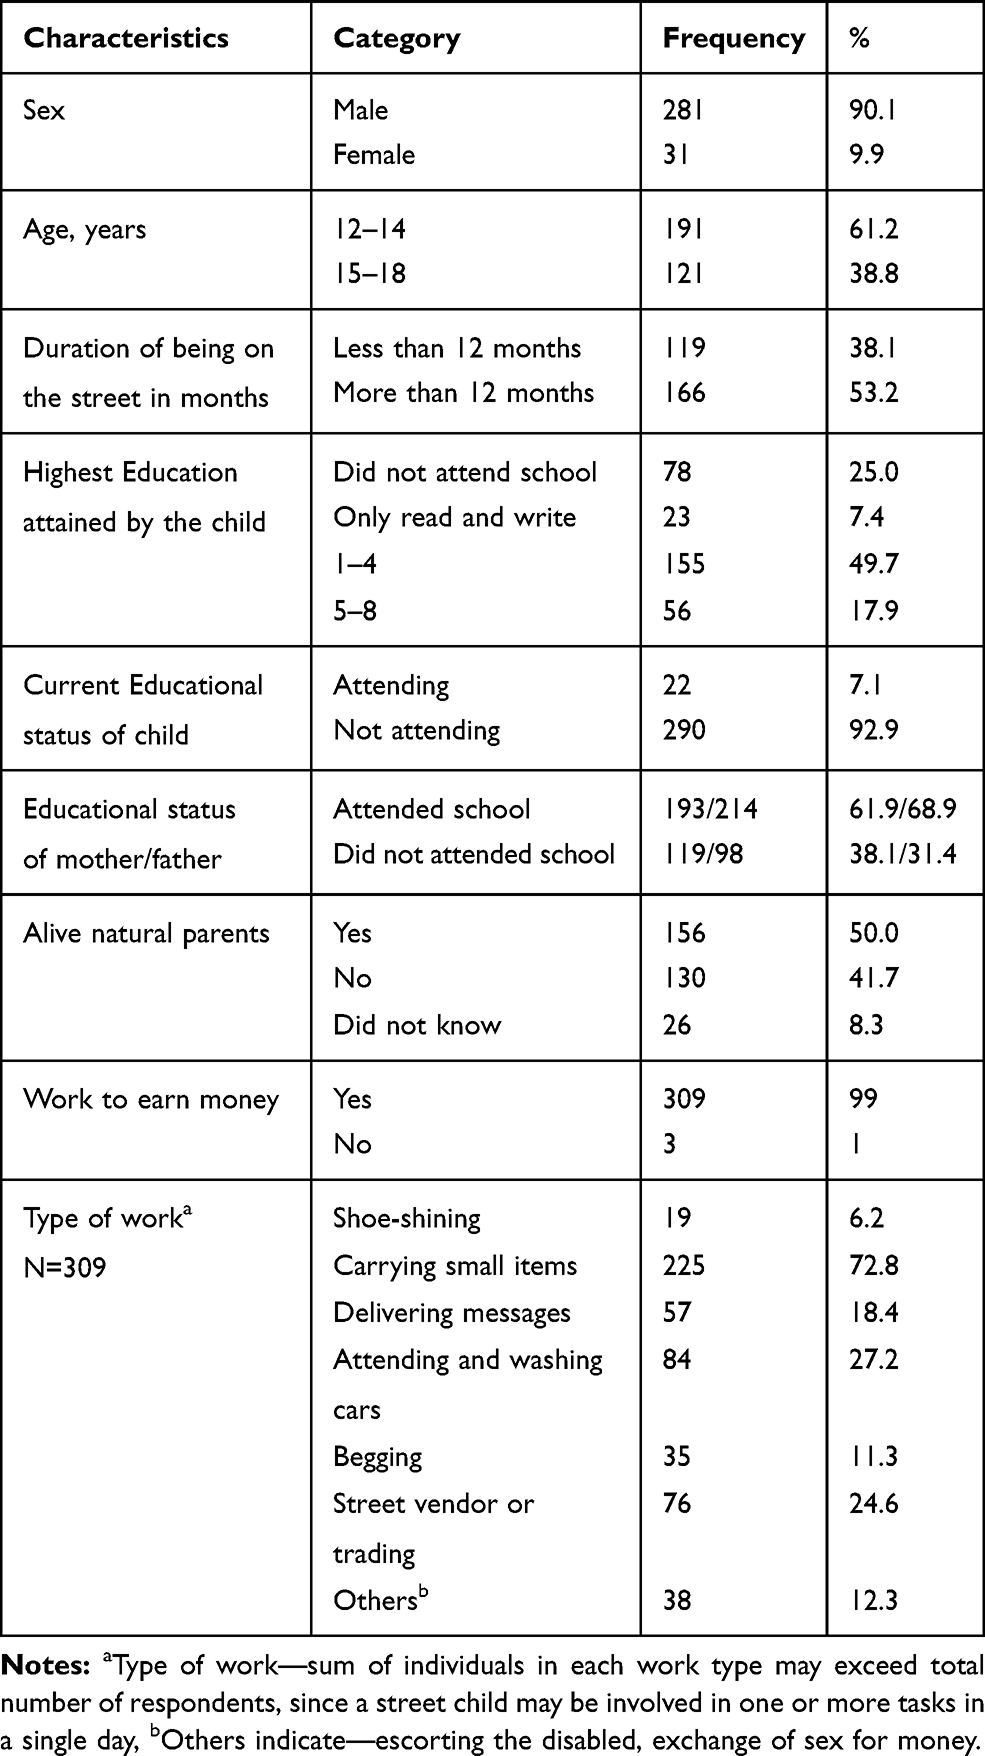 |
Table 1 Sociodemographic Characteristics of Adolescent Street Children and their Parents in Jimma Town, South West Ethiopia, 2019 (N=312) |
Based on the seven days dietary recall, mean dietary diversity score was 5.35 (±1.33) so that 230 (73.7%) children had adequate daily diet consumption (one score for at least five food groups out of nine) but 82 (26.3%) had low dietary diversity (scored less or equal to four food groups). Furthermore, 55.4% of the respondents were using unprotected water sources and, 38.8% had poor hand washing habits during a meal. The study also found that 124 (39.9%) of children had ever used substances whereas 96 (30.8%) were currently using substances at the time of study; khat, cigarette and mastish (glue) were the most commonly used substances (Table 2)
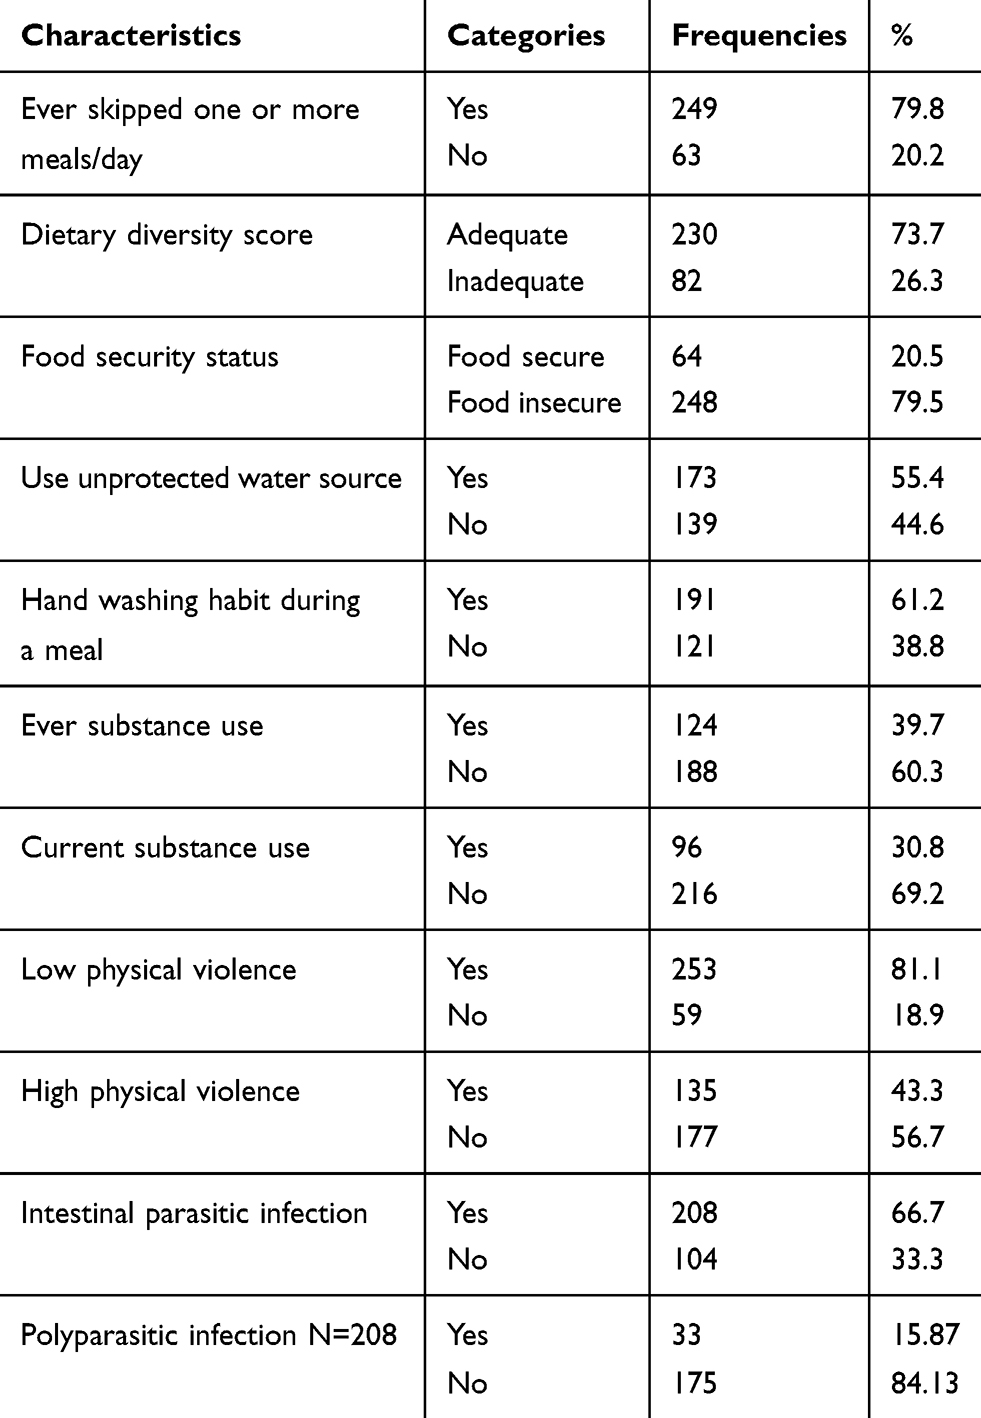 |
Table 2 Frequency Distribution of Selected Dietary Behavior, Sanitation, Behavioral and Physical Characteristics of Adolescent Street Children and their Parents inat Jimma Town, South West Ethiopia, 2019 (N=312) |
Prevalence of Thinness and Stunting Among Street Children Who Were Residing in Jimma Town, 2019
Anthropometric Data
The mean weight was 39.87 (±7.197 SD) ranging from 26.1–62.3 kg and the mean height was 151 cm (±7.959 SD) ranging from 130–176 cm
The magnitude of thinness, stunting and both thinness and stunting was 29.2% (95%CI: 24–34.0); 30.4% (95%CI: 24.6–35.3) and 4.2% (95%CI: 2.2–6.4) respectively
Factors Associated with Thinness and Stunting
After controlling for the effects of potentially confounding variables using multivariable logistic regression, sex (being female) (AOR: 2.55; 95%CI: 1.16–5.63; P-value=0.02), ever skipping one or more meal/day (AOR: 6.56; 95%CI: 2.25–19.15; P-value=0.001), low dietary diversity score (AOR: 1.86; 95%CI: 1.05–3.27; P-value=0.032) and using unprotected water source (AOR: 1.78; 95%CI: 1.03–3.05; P-value=0.037) significantly predicted thinness among street children (Table 3). Furthermore, age (15–18 years) (AOR: 5.78; 95%CI: 3.20–10.40; P-value <0.001) and ever use of substance (AOR: 3.01; 95%CI: 1.17–7.77; P-value=0.023) were variables that have increased the risk of stunting. Adolescents street children who encounter high physical violence were 0.52 times less likely to develop stunting (AOR: 0.48; 95%CI: 0.26–0.87; P-value=0.016) than those who did not encounter high physical violence (Table 4).
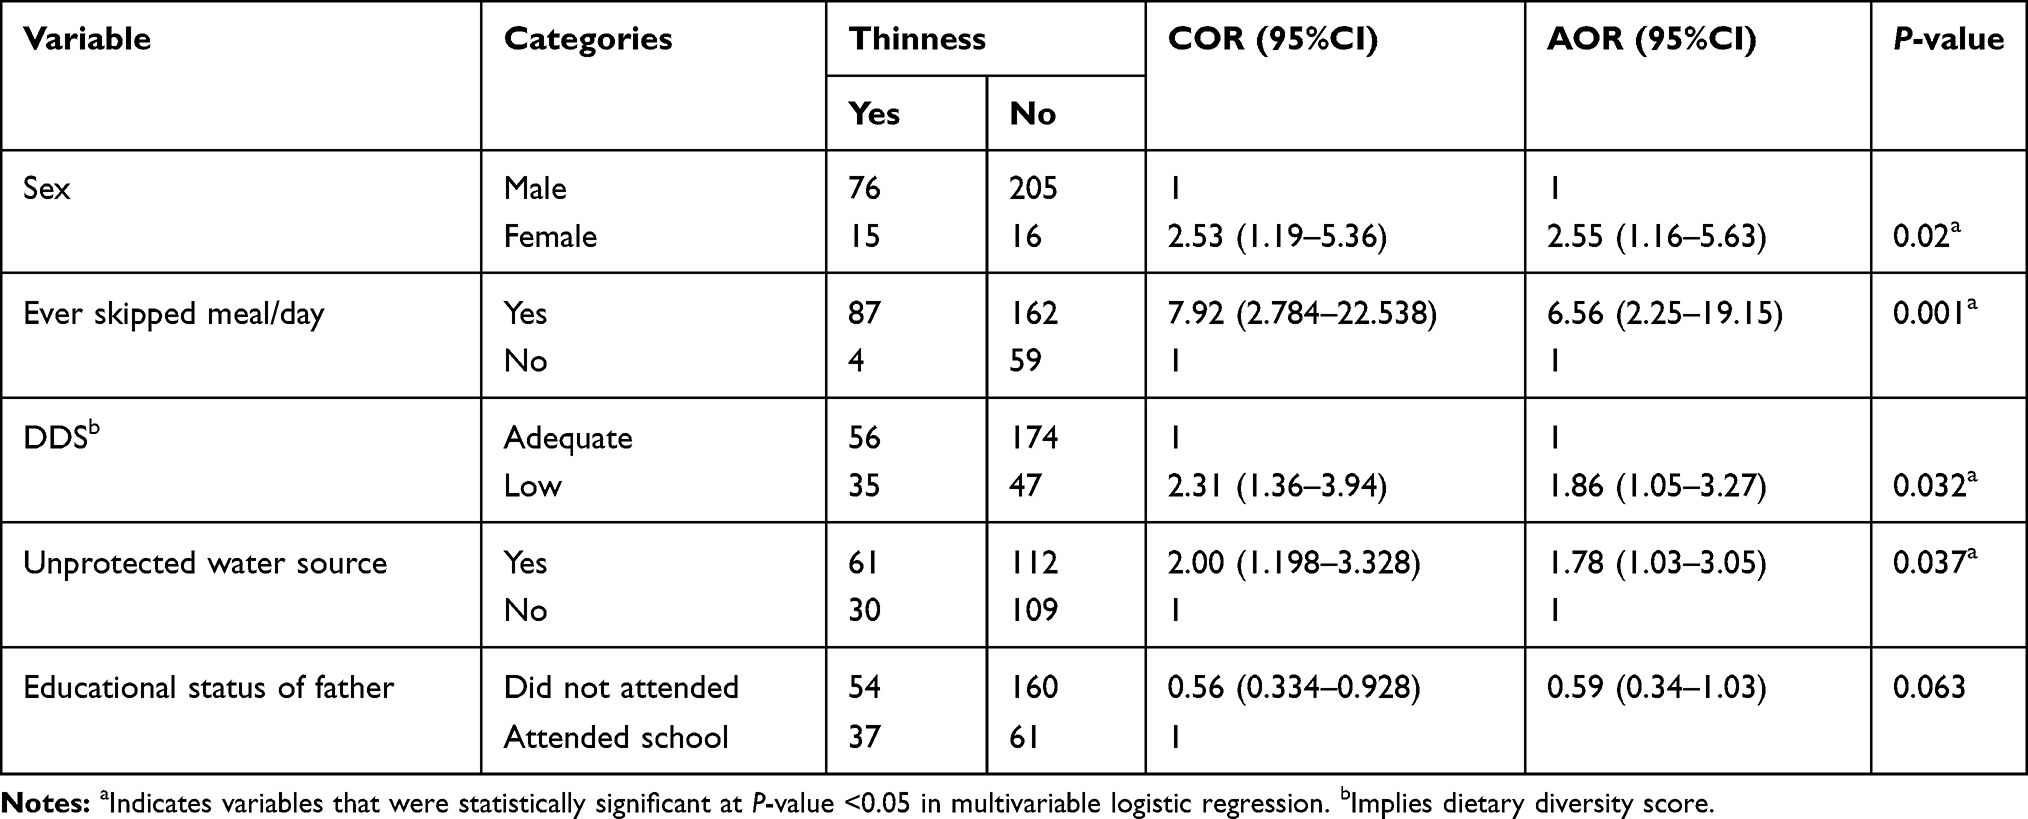 |
Table 3 Multivariable Logistic Regression Analysis of Factors Associated with Thinness among Street Adolescent Children inat Jimma Town, South West Ethiopia, 2019 (N=312) |
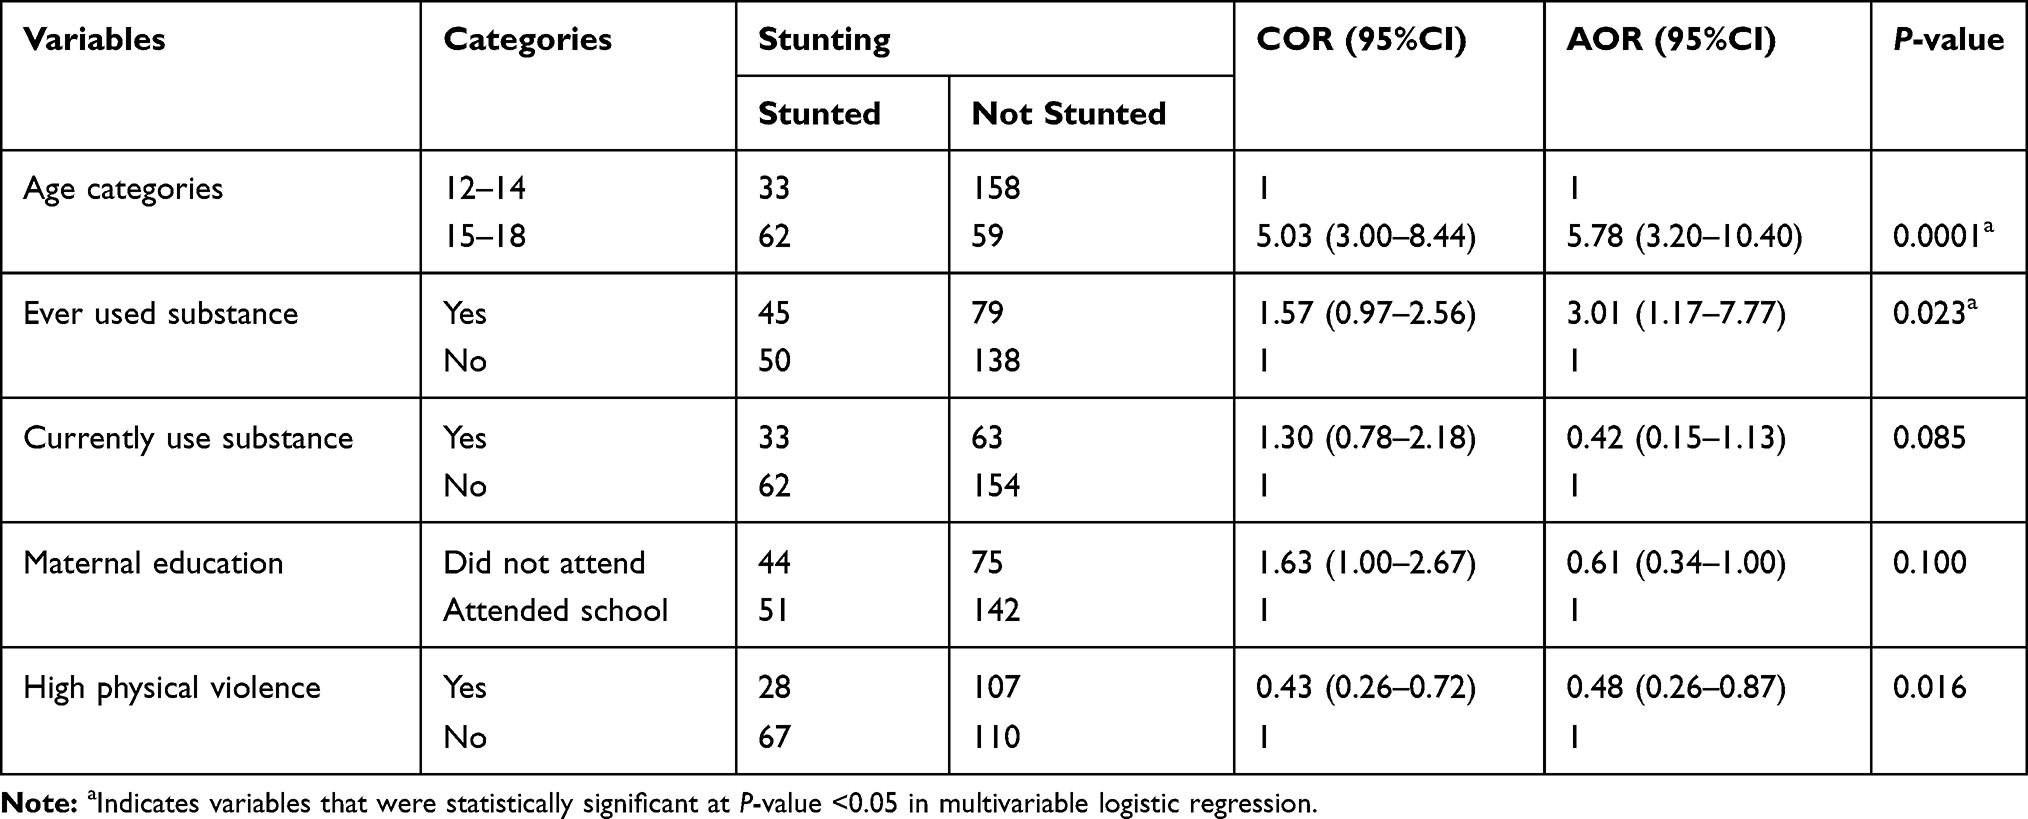 |
Table 4 Multivariable Logistic Regression Analysis of Factors Associated with Stunting among Street Adolescent Children inat Jimma Town, South West Ethiopia, 2019 (N=312) |
Discussion
This study revealed that prevalence of thinness, stunting and both thinness and stunting was 29.2%, 30.4%, and 4.2% respectively.
The prevalence of thinness seen at the study area was lower than in the study conducted at Shabagh Area of Dhaka City33 but nearly similar to the study conducted in southern India.23 The discrepancy might be due to differences in the setting like: age group at which the study was conducted (6–18 in Dhaka and 8–18 in southern India vs 12–18 in the current study), variation in the denominator and other socioeconomic variables. The prevalence of stunting was 30.4% and higher among the 15–18 years age group which was lower than the study in southern India (48%) and higher among the under 10 years age group. The difference may be due to age composition, or socioeconomic characteristics of the study participants in different study areas.23
Even though there were no studies with similar study population in Ethiopia, the magnitude of thinness and stunting in the current study was higher than in previous studies among adolescent girls in the normal population in Ethiopia.24–26 Similarly, the magnitude seen was also higher than school-going adolescents of general population,27–30 adolescents from Somali refugee camps41 and adolescents of pastoralist and agro-pastoralist communities.42
This study revealed that female street adolescents were twice as likely to have thinness (AOR: 2.55; 95%CI: 1.16–5.63) than male. This finding is different from studies conducted elsewhere among general population which states that females were less vulnerable to thinness than males.33–36 The reason for the difference may be, that females in the street life have limited involvement with income generating activities, low daily income to purchase food, are less competent to fight and scramble for food from a common pot. Furthermore, in this study 90%, 68%, and 87% of female street inhabitants were skipping one or more daily meal, lived for more than one year in the street and were food insecure respectively. Thus the Cumulative effect of skipping meal, living on the street for more than a year, being food insecure and other related factors can lead to thinness.
The street children who were having low dietary diversity score were more likely to be thin (AOR: 1.86; 95%CI: 1.05–3.27) than those who were eating a dietary diverse meal. This finding is consistent with others finding that inadequate dietary diversity is a well-established predictor of undernutrition among adolescents in normal population. Additionally, since adolescence is a period for rapid growth and development, failure in supplying adequate food for daily bodily demand would result in loss of weight.
The street children who had ever skipped one or more daily meal were six times more likely to be thin (AOR: 6.56; 95%CI: 2.25–19.15) than those children who never skipped their daily meal. This may be due to a cumulative effect of daily deficiency in micro and macronutrients that are essential for body metabolism and energy supply. In addition, those who were using an unprotected water source were more likely to be thin (AOR: 1.78; 95%CI: 1.03–3.05) than those who did not use it. This may be due to impure water sources that serve as a vehicle for intestinal parasites and bacteria that would increase risk of infection especially diarrheal disease resulting in depletion of micronutrients as described elsewhere.47,48
Variables like age, educational status of the child and parents, daily income, food insecurity and presence of intestinal parasites do not show statistical association with thinness although they showed association in other target populations in the general population.21,37,38 This may be due to sociodemographic compositions, cultural and geographical variations in the study settings.
This study also revealed that adolescents in the age range of 15–18 years were found to be five times more likely to be stunted (AOR: 5.78; 95%CI: 3.20–10.40) than the 12–14 age group. This finding is different from studies conducted among adolescents in the normal population which revealed early adolescents are more likely to be stunted than late adolescents.28,30 The reason behind for this can be explained by the fact that stunting measures chronic or prolonged exposure to nutrient deficiencies so that the effect may be seen later in life.
In addition, those who ever used substance were three times more likely to be stunted (AOR: 3.01; 95%CI: 1.17–7.77) than those who never used substance. This might be due to the fact that street children were involved in a range of substance abuse that can result in loss of appetite, early satiety, and increased expense for substances rather than food.
Limitation of the Study
Prevalence of thinness and stunting observed in this study may not be due to living on the street as a street child. These street children might come up to the street while having thinness and stunting. Recall bias for retrospective inquiry of personal, family history and dietary practice may affect the results of the study..
Conclusion
In this study group, undernutrition, especially thinness and stunting, was found to be high and a range of factors were observed that result in undernutrition. But, being female, ever having skipped one or more daily meals, inadequate dietary diversity score, and use of unprotected water source were statistically significant evidence for thinness and being older (found in the age group of 15–18 years) and ever used substances were statistically significant associated factors for stunting.
Recommendations
Jimma town women, children, and youth office should show concern for the street children to reduce children’s social, economic, personal, and environmental problems that contribute to undernutrition. Similarly, the town municipality should strive for provision of sanitation facilities to halt problems related with unprotected water sources and poor sanitation. Finally, the Federal Ministry of Health, Ethiopia (FMOH) should work on policies and a strategy that benefits females, including those who live on the street.
Abbreviations
AOR, adjusted odds ratio; BAZ, body mass index for age Z-score; BMI, body mass index; COR, crude odds ratio; HAZ, height for age Z-score; DDS, dietary diversity score; IFIAS, individual food insecurity assessment scale; WHO, World Health Organization.
Data Sharing Statement
All data that support the findings of this study is available from the corresponding author upon request.
Acknowledgments
Our special gratitude goes to Jimma University, Department of Epidemiology for all their invaluable support. Finally we would like to appreciate Feya integrated development organization staffs in each kebele, Jimma town health office, Jimma town health centers, supervisors, data collectors and respondents.
Author Contributions
All authors contributed to data analysis, drafting and revising the article, gave final approval of the version to be published, and agree to be accountable for all aspects of the work. Finally all authors have proof read the final manuscript.
Disclosure
The authors declare that they have no competing interests in this work.
References
1. Owoaje TAOA, Asuzu MC. Socio-demographic characteristics of street children in rural communities undergoing urbanization. Ann Ibadan Postgraduate Med. 2009;7(1):10–15. doi:10.4314/aipm.v7i1.64055
2. UN general secratary. Report of the United Nations High Commissioner for Human Rights on the Protection and Promotion of the Rights of Children Working And/Or Living on the Street; 2012.
3. UNICEF. A study on street children in Zimbabwe. orphans and other vulnerable children and adolescents in Zimbabwe; 2001:89–104. Available from: www.unicef.org.
4. Consortium for Street Children: A Mapping & Gapping Review of the Literature 2000 to 2010. Save the children; 2010.
5. World Health Organaization. MODULE 1 a Profile of Street Children: A Training Package on Substance Use, Sexual and Reproductive Health Including HIV/AIDS and STDs.
6. World Health Organization. Nutrition in adolescence: issues and challenges for the health sector: issues in adolescent health and development; 2005. Available from: https://apps.who.int/iris/handle.
7. Christian P, Smith. ER. Adolescent undernutrition: global burden, physiology, and nutritional risks. Ann Nutr Metab. 2018;72(4):316–328. doi:10.1159/000488865
8. de Benítez ST. State of the World’s Street Children: Research. 2011.
9. Blössner M, De OM, Prüss-üstün A, Campbell-lendrum D, Corvalán C, Woodward A. Malnutrition: Quantifying the Health Impact at National and Local Levels. Vol. 12. World Health Organization; 2005.
10. Obeid O. Malnutrition in Adolescents & Children: the hidden deficiencies. Am Acad Pediatr. 2012;103:516–520.
11. Rathod N, Warbhe P. Assessment of nutritional status of street children in selected wards of an urban area. Int J Interdiscip Multidiscip Stud. 2014;1(8):136–143.
12. Kourgialis N, Wendel J, Darby P, Kory WP, Seim L. Improving the Nutrition Status of Homeless Children: Guidelines for Homeless Family Shelters.
13. Summary of Research Findings on the Nutritional Status and Risk Factors for Vulnerability of Older People in Africa. HelpAge International Africa Regional Development Centre; 2014. Available from: www.helpage.org.
14. NCD-RisC. Worldwide trends in body-mass index, underweight, overweight, and obesity from 1975 to 2016: a pooled analysis of 2416 population-based measurement studies in 128.9 million children, adolescents, and adults. Lancet. 2017;390:2627–2642.
15. Benedict RK, Schmale A, Namaste S. Adolescent nutrition 2000–2017: DHS data on adolescents age 15–19. DHS Comparative Report No. 47. Rockville, Maryland; 2018.
16. Ajebush A. Childhood poverty in Ethiopia: deprivations and disparities in child well-being. researchgate. 2015.
17. Ethiopia National Nutrition Strategy: Review and Analysis of Progress and Gaps; One Year On.; 2009.
18. National Planning Commission. Federal Democratic Republic of Ethiopia: Growth and Transformation Plan II (GTP II). 2016;I.
19. Federal Democratic Republic of Ethiopia National Nutrition Program. 2016.
20. USAID. Ethiopia: Nutrition Profile; 2018.
21. Mokrini F, Waeyenberge L, Viaene N, Moens M The federal democratic republic of Ethiopia national school health and nutrition strategy. 2012
22. Federal Ministry of Science and Technology. National-Research-Ethics-Review-Guideline.
23. Meshram II, Stephen GL, Pothu Raju B. Nutritional status and substance abuse among street children in South India. Indian J Comm Health. 2015;27(1):52–59.
24. Belachew T, Lindstrom D, Gebremariam A, et al. Food insecurity, food based coping strategies and suboptimal dietary practices of adolescents in Jimma Zone Southwest Ethiopia. PLoS One. 2013;8:3. doi:10.1371/journal.pone.0057643
25. Food And Agriculture Organization. Guidelines for Measuring Household and Individual Dietary Diversity; 2011.
26. Roba. KT, Abdo M, Wakayo T. Nutritional status and its associated factors among school adolescent girls in Adama City, Central Ethiopia. J Nutr Food Sci. 2016;6(3):4–11.
27. UNICEF. Inventory Child Protection Monitoring and Evaluation Reference Group, Measuring Violence Against Children: Inventory and Assessment of Quantitative Studies, Division of Data, Research and Policy. New York: UNICEF; 2014.
28. Hadley, Hadley C, Lindstrom D, et al. Gender bias in the food insecurity experience of Ethiopian adolescents. Soc Sci Med. 2008;66(2):427–438. doi:10.1016/j.socscimed.2007.08.025
29. Salz A. Substance abuse and nutrition Available from: https://www.todaysdietitian.com/newarchives.
30. De Onis M. World Health Organization. Child Growth Standards: Length/Height-For-Age, Weight-For-Age, Weight-For-Length, Weight-For-Height and Body Mass Index-For-Age. Methods and Development; 2006.
31. Kevin Jlalor. Street children: a comparative perspective. Child Abuse Neglect. 1999;23(8):759–770.
32. WHO AnthroPlus for Personal Computers Manual: Software for Assessing Growth of the World’s Children and Adolescents. Geneva: WHO; 2009. Available from: http://www.who.int/growthref/tools/en/.
33. Talukder MU, Alam MM, Islam MA, Paul GK, Islam MT, Akther F. Study on the nutritional status of the street children at Shabagh Area of Dhaka City. Int J Nutr Food Sci. 2015;4(3):240–245. doi:10.11648/j.ijnfs.20150403.11
34. Tegegne M, Sileshi S, Assefa T, Kalu A. Nutritional status and associated factors of adolescent school girls, Goba Town, Southeast Ethiopia. Global J Med Res. 2016;16:1.
35. Wassie MM, Gete AA, Yesuf ME, Alene GD, Belay A. Predictors of nutritional status of Ethiopian adolescent girls: a community based cross sectional study. BMC Nutr. 2015;4:1–7.
36. Yemaneh Y, Girma A, Niguse W, et al. Under nutrition and its associated factors among adolescent girls in rural community of Aseko district, Eastern Arsi Zone, Oromia region, Eastern Ethiopia, 2017. Int J Clin Obstetrics Gynaecol. 2017;1(2):17–26.
37. Teferi DY, Atomssa GE, Mekonnen TC. Overweight and undernutrition in the cases of school-going adolescents in Wolaita Sodo Town, Southern Ethiopia: cross-sectional study. J Nutr Metab. 2018;2018;10.
38. Woday A, Menber Y, Tsegaye D. Prevalence of and associated factors of stunting among adolescents in Tehuledere District, North East Ethiopia, 2017. J Clin Cell Immunol. 2018;9:2. doi:10.4172/2155-9899
39. Demilew YM, Emiru AA. Under nutrition and associated factors among school adolescents in Dangila Town, Northwest Ethiopia: a cross sectional study. Afr Health Sci. 2018;18(3):756–766. doi:10.4314/ahs.v18i3.34
40. Melaku YA, Zello GA, Gill TK, Adams RJ, Shi Z. Prevalence and factors associated with stunting and thinness among adolescent students in Northern Ethiopia: a comparison to World Health Organization standards. Arch Publ Health. 2015;73:1–11. doi:10.1186/s13690-015-0093-9
41. Engidaw MT. Prevalence and associated factors of stunting and thinness among adolescent Somalian refugee girls living in eastern Somali refugee camps, Somali regional state, Southeast Ethiopia. BMC. 2019;13(17):1–8.
42. Awel AA, Lema TB, Hebo HJ. Nutritional status and associated factors among primary school adolescents of pastoral and agro-pastoral communities, Mieso Woreda, Somali Region, Ethiopia: a comparative cross-sectional study. J Public Health Epidemiol. 2016;8(11):297–310.
43. Gali N, Tamiru D, Tamrat M. The emerging nutritional problems of school adolescents: overweight/obesity and associated factors in Jimma Town, Ethiopia. J Pediatr Nurs. 2017;35:98–104. doi:10.1016/j.pedn.2017.03.002
44. Gebremariam H, Seid O, Assefa H. Assessment of nutritional status and associated factors among school going adolescents of Mekelle City, Northern Ethiopia. Int J Nutr Food Sci. 2015;4(1):118–124. doi:10.11648/j.ijnfs.20150401.26
45. Bereket AH, Beyero M, Fikadu AR, Bosha T. Risk factors for overweight and obesity in private high school adolescents in Hawassa City, Southern Ethiopia: a case-control study. Food Publ Health. 2017;7(2):29–34.
46. Teshome T, Singh P, Prevalence MD. Associated factors of overweight and obesity among high school adolescents in urban communities of Hawassa, Southern Ethiopia. Curr Res Nutr F Ood Sci Jour. 2013;1(1):23–36. doi:10.12944/CRNFSJ.1.1.03
47. Opara KN, Udoidung NI, Opara DC, Okon OE. The impact of intestinal parasitic infections on the nutritional status of rural and urban school-aged children in Nigeria. Int J MCH AIDS. 2012;1(1):73–82. doi:10.21106/ijma.8
48. Hunter PR, Macdonald AM, Carter RC. Water supply and health. PLoS Med. 2010;7:11. doi:10.1371/journal.pmed.1000361
49. Assefa H, Belachew T, Negash L. Socioeconomic factors associated with underweight and stunting among adolescents of Jimma Zone, South West Ethiopia: a cross-sectional study. Hindawi Publ Corporation. 2013;2013:7.
50. Feleke BE. Nutritional status and intestinal parasite in school age children: a comparative cross-sectional study. Int J Pediatr. 2016;2016:23–28.
 © 2020 The Author(s). This work is published and licensed by Dove Medical Press Limited. The full terms of this license are available at https://www.dovepress.com/terms.php and incorporate the Creative Commons Attribution - Non Commercial (unported, v3.0) License.
By accessing the work you hereby accept the Terms. Non-commercial uses of the work are permitted without any further permission from Dove Medical Press Limited, provided the work is properly attributed. For permission for commercial use of this work, please see paragraphs 4.2 and 5 of our Terms.
© 2020 The Author(s). This work is published and licensed by Dove Medical Press Limited. The full terms of this license are available at https://www.dovepress.com/terms.php and incorporate the Creative Commons Attribution - Non Commercial (unported, v3.0) License.
By accessing the work you hereby accept the Terms. Non-commercial uses of the work are permitted without any further permission from Dove Medical Press Limited, provided the work is properly attributed. For permission for commercial use of this work, please see paragraphs 4.2 and 5 of our Terms.