")
Back to Journals » Diabetes, Metabolic Syndrome and Obesity » Volume 14
Magnitude and Associated Factors of Metabolic Syndrome Among Adult Urban Dwellers of Northern Ethiopia
Authors Gebreegziabiher G , Belachew T, Mehari K, Tamiru D
Received 22 October 2020
Accepted for publication 27 January 2021
Published 10 February 2021 Volume 2021:14 Pages 589—600
DOI https://doi.org/10.2147/DMSO.S287281
Checked for plagiarism Yes
Review by Single anonymous peer review
Peer reviewer comments 3
Editor who approved publication: Prof. Dr. Antonio Brunetti
Gebremedhin Gebreegziabiher,1 Tefera Belachew,2 Kibriti Mehari,3 Dessalegn Tamiru2
1Department of Human Nutrition, Adigrat University, Adigrat, Ethiopia; 2Department of Nutrition and Dietetics, Faculty of Public Health, Jimma University, Jimma, Ethiopia; 3Tigray Health Research Institute, Mekelle, Ethiopia
Correspondence: Gebremedhin Gebreegziabiher
Jimma University, P.O. Box: +251378, Addis Ababa, Ethiopia
Email [email protected]
Background: Metabolic Syndrome (MetS) is becoming a big public health problem in developing countries like Ethiopia. Developing countries have an almost two-fold higher risk of death due to non-communicable diseases (NCDs) compared to high-income countries. This study aimed to assess the magnitude and factors associated with MetS among adult residents of Mekelle city.
Methods: A population-based cross-sectional study was carried out among 266 randomly selected adults from July to September 2019. Data were collected on socio-demographic, clinical, anthropometric, and lifestyle characteristics using a structured questionnaire adapted from the WHO STEPs survey tool. Fasting Blood Glucose (FBG) and lipid profiles were tested using a blood sample. Bivariate and multivariable logistic regression analyses were used to identify factors associated with MetS and variables were considered statistically significant at p ≤ 0.05.
Results: The findings of this study showed the magnitude of MetS was 21.8%. The proportion of MetS was relatively higher among women (24.6%) than men (18.5%). Raised blood pressure was the most prominent (42.5%) component of MetS followed by central obesity (41.7%). The magnitude of the other components of MetS was 38.0%, 21.4%, and 14.3% for elevated triglyceride, raised FBG, and low HDL-C, respectively. Advanced age, medium and high monthly income, walking less than 10 minutes per day, raised Body Mass Index (BMI), higher waist to hip ratio, and elevated total cholesterol were significantly associated with a higher risk of metabolic syndrome.
Conclusion: In this study, we found a high prevalence of metabolic syndrome and its components, which highlights an urgent need for a public health strategy for its prevention, early diagnosis, and management.
Keywords: magnitude, metabolic syndrome, adult, Northern Ethiopia
Background
Metabolic syndrome (MetS) is a group of interrelated Cardiovascular Disease (CVD) risk factors which consists of raised waist circumference (WC), hyperglycemia, dyslipidemia, and raised blood pressure.1 MetS increases the risk of CVD and diabetes by twofold and fivefold, respectively, within five to ten years interval.2 MetS is becoming a worldwide public health concern due to the spread of the Western lifestyle.3 Premature morbidity and mortality because of Non-Communicable Diseases (NCDs) pose a big challenge for development4 and MetS increases the risk of NCDs and the cost of its treatment.5
Dietary changes, physical inactivity, rural to urban migration, industrial development, and genetic susceptibility are playing a substantial role in the spread of MetS.6 MetS is spreading at an alarming rate in developing countries because of lifestyle changes, urbanization, decreasing levels of physical activity, and increased intake of energy.7–9 A study from South Africa indicated a high prevalence of MetS among the black urban inhabitants,10 which is mostly caused by dietary change.11
NCDs kill 41 million people annually, corresponding to 71% of all deaths globally. Over 85% of these deaths occur in low- and middle-income countries.12 The risk of dying from NCDs in low- or lower-middle-income countries is twofold higher compared to high-income countries.13 NCDs are projected to surpass communicable diseases as the major cause of morbidity in sub-Saharan Africa by the year 2030.14 The prevalence of MetS is higher in the urban areas of some developing countries than even their western counterparts.13,15
NCDs cause 42% and 27% of all deaths in Ethiopia among all age groups and under 70 years, respectively.16 A study conducted on causes of mortality in Ethiopia indicated that NCDs contribute to 31% of all deaths. NCDs attributed mortality is increasing over time in Ethiopia.17 According to a systematic review finding from Ethiopia cardiovascular disease, diabetes, and the chronic obstructive pulmonary disease accounts for 24%, 5%, and 3% of deaths, respectively.18 In 2015, NCDs were the major cause of the age-standardized mortality rate in Ethiopia.19 A study done in Ethiopia also found a 4.8% prevalence of NCDs (11.7% in the urban and 3.2% in rural areas).20 A hospital-based study carried out in Ethiopia among subjects with NCDs found a MetS prevalence ranging from 21.1% to 70.1%.21–26 Low HDL-C is the most prominent component of MetS and females have an increased risk to develop MetS in Ethiopia.25–28
The burden of NCDs is growing at an alarming rate in developing countries including Ethiopia. Besides, Ethiopia has a very weak health system to control this malady. Since its diagnosis and treatment is too expensive, more focus should be given to the upstream risk factors (MetS). Few hospital based studies were carried out in Ethiopia to assess MetS.21–26 Besides, the majority of studies were from hypertensive patients,21,26 HIV patients on ART,22,23 diabetic adults24,25 which can make the findings unrepresentative of the general population. Therefore, it was the first population-based study to assess the magnitude and predictors of MetS among adults residing in Mekelle city, Northern Ethiopia.
Methods and Materials
Study Design and Setting
A population-based cross-sectional study design was used to conduct the study in Mekelle city, Northern Ethiopia. Mekelle city is the capital city of Tigray regional state and is the second-largest city in Ethiopia. It is located 783 km to the north of the capital city, Addis Ababa. The city has a total population of 505,000, of whom 48.1% (242,905) are adults. The data was collected from July to September 2019.
Inclusion and Exclusion Criteria
Adults aged over 20 years and living at least for 6 months in the city were considered as the study population. Pregnant women and mothers in the first 6 months of lactating were excluded from the study. Participants who had any types of physical deformity like scoliosis were excluded from the study.
Sample Size Determination and Sampling Procedure
A total sample size of 273 was calculated using the single population proportion formula by considering 95% level of confidence, 4% margin of error, 80% power, 11.7% prevalence of MetS in urban Ethiopia20, and 10% non-response rate. The sample size was proportionally allocated to the seven sub-cities. Then, the required numbers of households (HH) were selected from each sub-city by simple random sampling technique. Family folder in each sub-city’s health office was used as a sampling frame to select households. The address of each household is recorded in the family folder. One eligible participant was selected using the lottery method from each selected household.
Data Collection and Quality Control
A data collection team comprised of six health professionals (four data collectors, one laboratory technician, and one supervisor) was established to collect the data. The team was trained for two days on data collection tools and techniques. Data collectors were experienced health professionals and native speakers of the local language. The total data collection period was two months. A structured questionnaire adapted from the WHO STEPS survey tool was used to collect the data.29 The questionnaire was translated to the local language (Tigrigna) and translated back to English to check the consistency. The reliability of the tool was measured using Cronbach’s alpha and it was 0.83. A cut-off value of 0.7 and above was used as an acceptable internal consistency level.30 The data collection tools were pretested in 5% (n = 14) of the sample size in a different site to check completeness, consistency, sensitivity, and applicability and were ratified accordingly. Data on socio-demographic, anthropometric, clinical, lifestyle, and behavioral characteristics were collected. Weight, height, WC, hip circumference, and blood pressure were measured using standard tools and procedures.31
Height and weight were measured using a stadiometer and an inbuilt weighing scale (UNICEF SECA) with light clothes and without shoes. Waist and hip circumference were also taken to the nearest 0.1 cm using fixed tension tape. Hip circumference was measured with the subjects wearing a pant. Blood pressure was measured using a digital measuring apparatus. Blood pressure was taken after five minutes of rest and the subsequent measurements were also taken five minutes apart. On the first day, face-to-face interviews, anthropometric, and blood pressure measurements were carried out at the participants’ homes. Participants were appointed the next day to their nearest health facility to give a fasting venous blood sample after overnight fasting.
To control the quality of the data, the weighing scale and stadiometer were checked before each measurement. All blood pressure and anthropometric measurements were collected in triplicate and the average was used. The field supervisor made daily supervision during the data collection. The data collectors and the field supervisor checked the completeness and consistency of the data on a daily basis. Besides, experienced laboratory technologist did the laboratory tests in the regional health research institute following standard operating procedures.
Blood Sample Collection and Laboratory Analysis
Participants were appointed to their nearest health facility to give fasting venous blood in the early morning (8:00 am–9:00 am). Around 5mL of venous blood was collected after overnight fasting (at least 10 hours of fasting) for fasting blood glucose (FBG), high density lipoprotein cholesterol (HDL-C), triglyceride, low density lipoprotein cholesterol (LDL-C), and total cholesterol tests. The blood sample was collected using an appropriate test tube. After the blood was clotted within 30 minutes, it was centrifuged at 4000 revolutions per minute for 5 minutes. Then, a 2.5 mL pure serum sample was separated to the Nunc tube. The sample was analyzed using Bio-system A25 automated chemistry machine (Spain). Before sample analysis, the machine was checked using controls and blank on a daily basis.
Definition of Terms
Metabolic syndrome is defined as a compulsory raised WC of ≥94 cm for men and ≥80 cm for women plus two of the remaining four metabolic syndrome components. Elevated triglyceride≥1.7 mmol/L (≥150 mg/dL); low HDL-C of <1.03 mmol/L (<40 mg/dL) for men, <1.3 mmol/L (<50 mg/dL) for women; raised blood pressure ≥130/85 mmHg or on hypertension treatment; and raised FBG ≥5.56 mmol/L (≥100 mg/dL) or on diabetes treatment.32
Elevated total cholesterol is defined as ≥5.17 mmol/L (≥200 mg/dL). Elevated LDL-C is defined as ≥3.36 mmol/L (≥130 mg/dL).33 Body Mass Index (BMI) was calculated by dividing weight in kilograms (kg) by the square meter (m2) of height. Adults with BMI <18.5 kg/m2are considered as underweight, 18.5–24.9 kg/m2 as normal, 25.0–29.9 kg/m2 as overweight, and ≥30.0 kg/m2 as obese.34 Waist to hip ratio was calculated by dividing the WC in cm by hip circumference in cm and it was considered as raised if the ratio is ≥0.88 in men and >0.82 in women.35 Physical activity was measured by using the WHO global physical activity questionnaire.31,36
Data Management and Analysis
Data were checked for completeness and consistency in the hard copy and double entered into EPI data software version 3.1 to check clerical errors. Then, data were exported to the Statistical Package for the Social Sciences (SPSS) for windows version 24 program for analyses. Descriptive analysis of the background characteristics was performed and normality was checked for continuous variables. Before the inclusion of predictors in the final model, multi co-linearity was checked using the cut-off point VIF<10. Bivariate and multivariable logistic regression analyses were performed to identify factors independently associated with MetS. Crude and adjusted odds ratios and their corresponding 95% Confidence Intervals (CI) were computed using bivariate and multivariable logistic regression analysis. Backward stepwise elimination was used to remove non-significant variables until only statistically significant variables remained in the final logistic model. The statistical association between independent and dependent variables was declared at p-value <0.05. The goodness of fit of the final logistic model was tested by using Hosmer and Lemeshow’s test at a p-value of >0.05.
Results
Socio-Demographic and Lifestyle Characteristics of the Participants
A total of 266 participants were involved in the study with a response rate of 97.4% while 2.6% of participants did not show a willingness to participate. The mean (± SD) age of the participants was 37.96 (±14.76) years, with no significant difference across gender (p=0.209). More than half (53.4%) of the participants were women; two-thirds (67.3%) were married and 89.9% were literate. Besides, 4.9% of participants were smokers, 4.1% live with smokers, and 80.8% were alcohol consumers. Significantly higher proportion of men were literate (p = 0.007), alcohol consumers (p = 0.015), smokers (p <0.001) and involved in formal exercise (p = 0.003) compared to women. Contrary to this, a significantly higher proportion of women were engaged in vigorous and moderate-intensity work than men (p = 0.027) (Table 1).
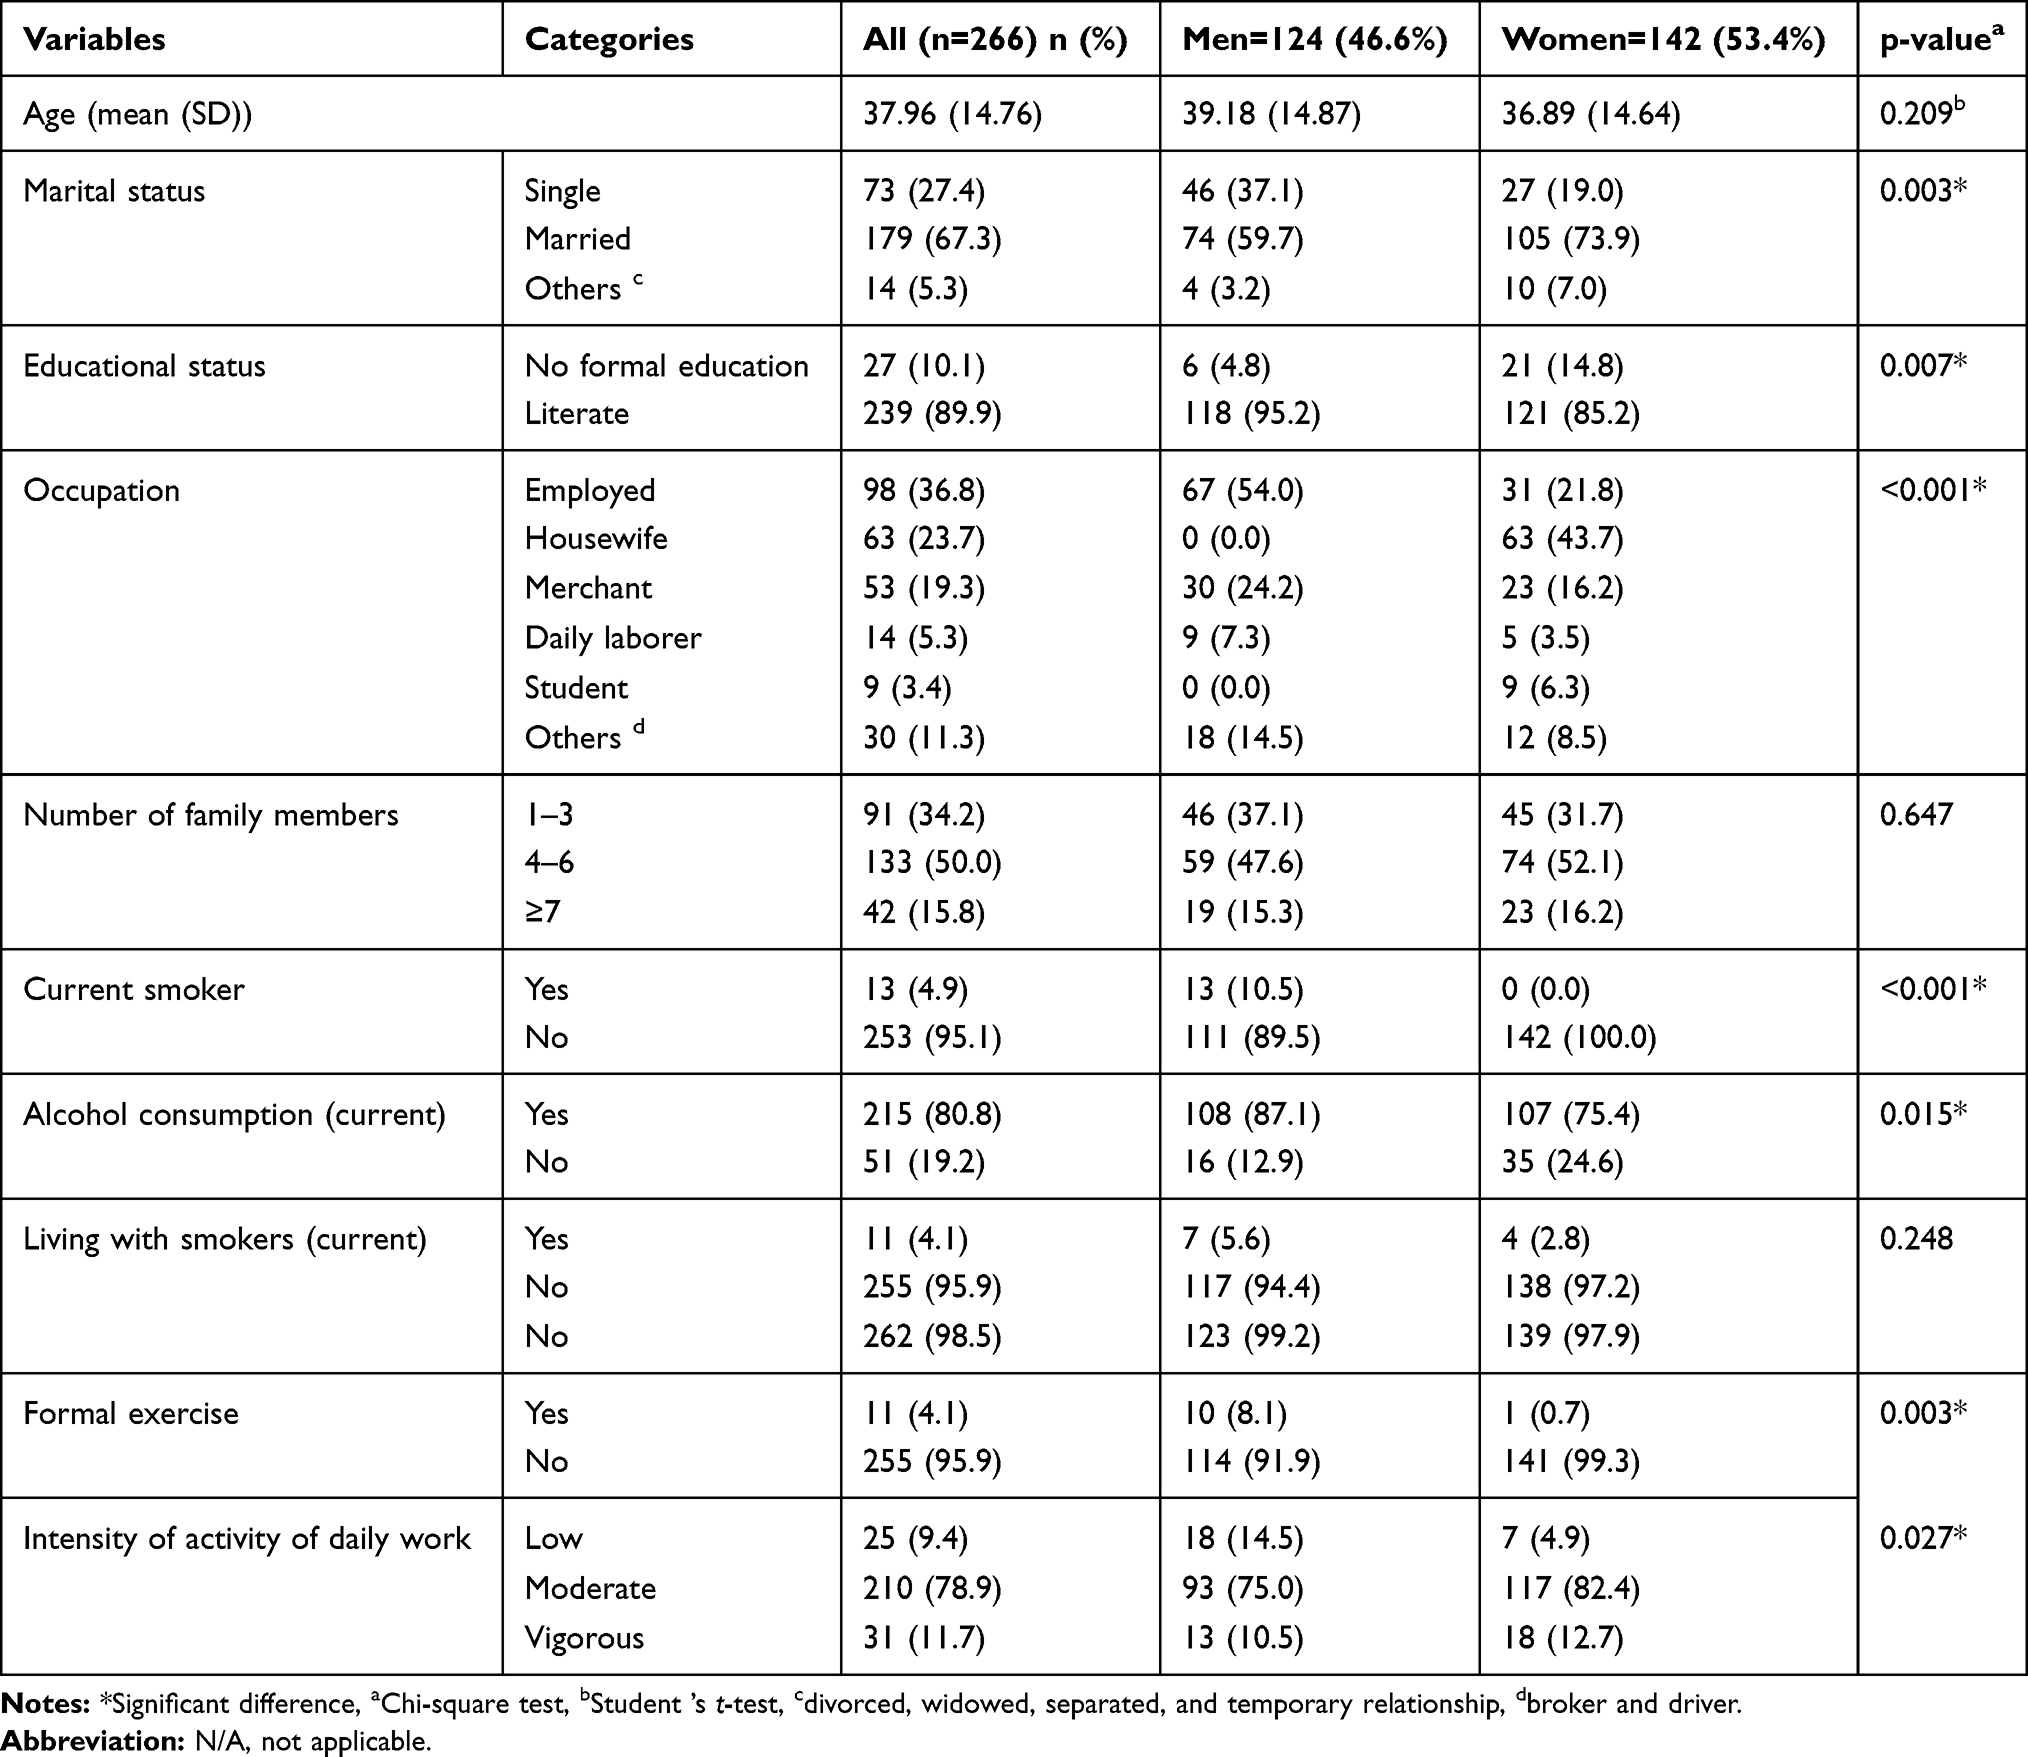 |
Table 1 Socio-Demographic, Lifestyle, and Clinical Characteristics of the Participants (n=266) |
Magnitude of MetS and Its Components
In this study, the prevalence of MetS is 21.8%, slightly higher among women (24.6%) compared to men (18.5%). Hypertension was the most prominent component of MetS followed by central obesity with a prevalence of 42.5% and 41.7%, respectively. The magnitude of elevated triglyceride, raised FBG and low HDL-C was also 38.0%, 21.4%, and 14.3%, respectively. A significantly higher proportion of women had central obesity and low HDL-Compared to men (p <0.01). Contrary to this, a significantly higher proportion of men had elevated triglyceride (p = 0.003) (Table 2).
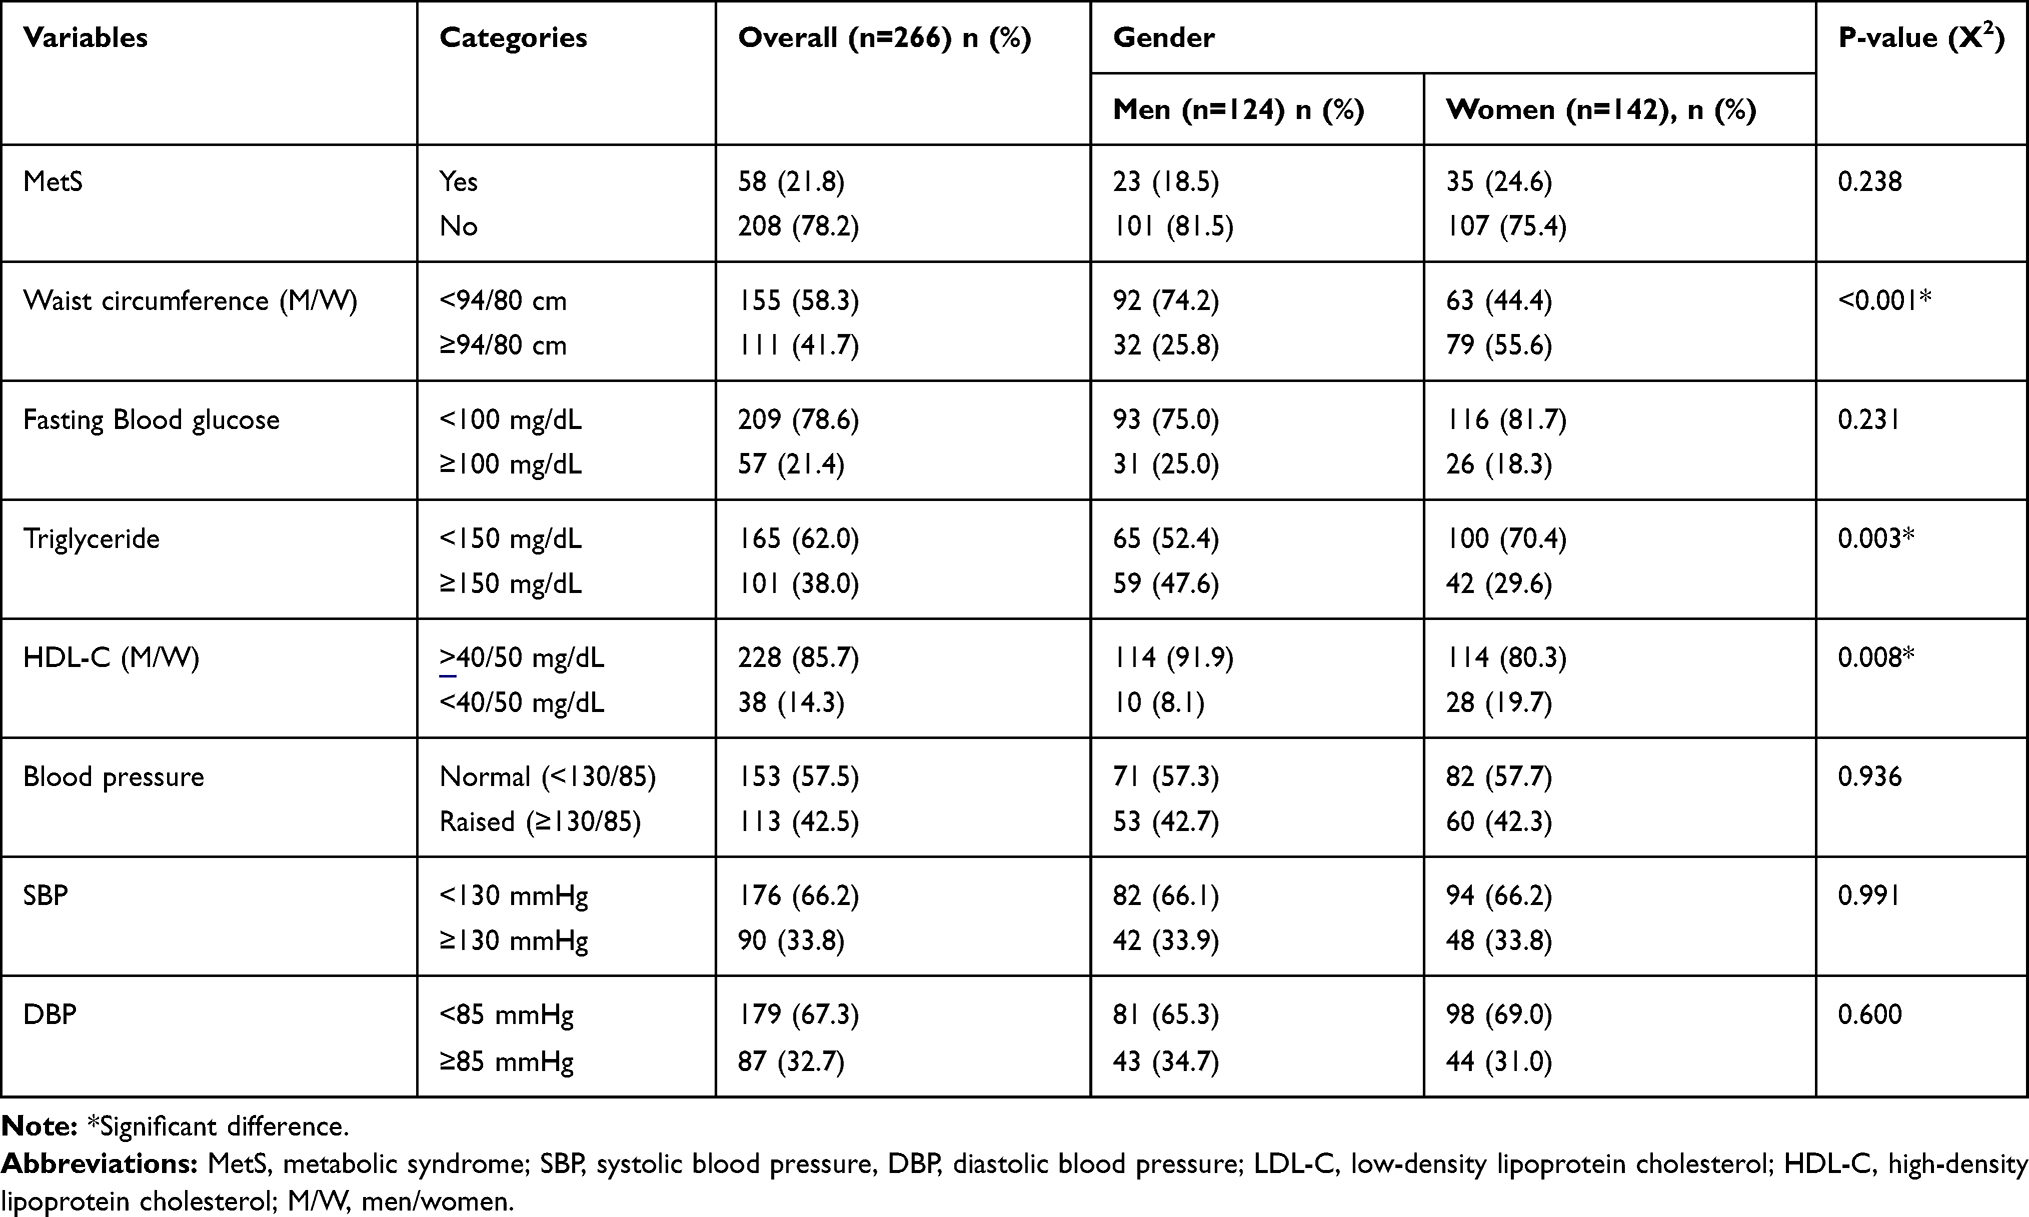 |
Table 2 Prevalence of Metabolic Syndrome and Its Components Stratified by Sex (n = 266) |
This study showed the higher the lipid profile and FBG of the participants, the more the probability of having MetS, except for HDL-C. The proportion of MetS was significantly increased with household monthly income and waist to hip ratio (p<0.05). Similarly, the risk of having MetS and other related metabolic disorders was significantly increased with BMI. None of the underweight and only 10.7% of the normal weight adults had MetS, whereas the prevalence of MetS was significantly higher among overweight (38.1%) and obese (66.7%) participants (p = 0.044). Besides, 92.6%, 77.8%, 63.0%, 59.3%, 55.6%, 40.7%, and 33.3% of the obese participants had central obesity, high LDL-C, raised blood pressure, elevated total cholesterol, elevated triglyceride, raised FBG, and low HDL-C, respectively (Table 3 and Figure 1).
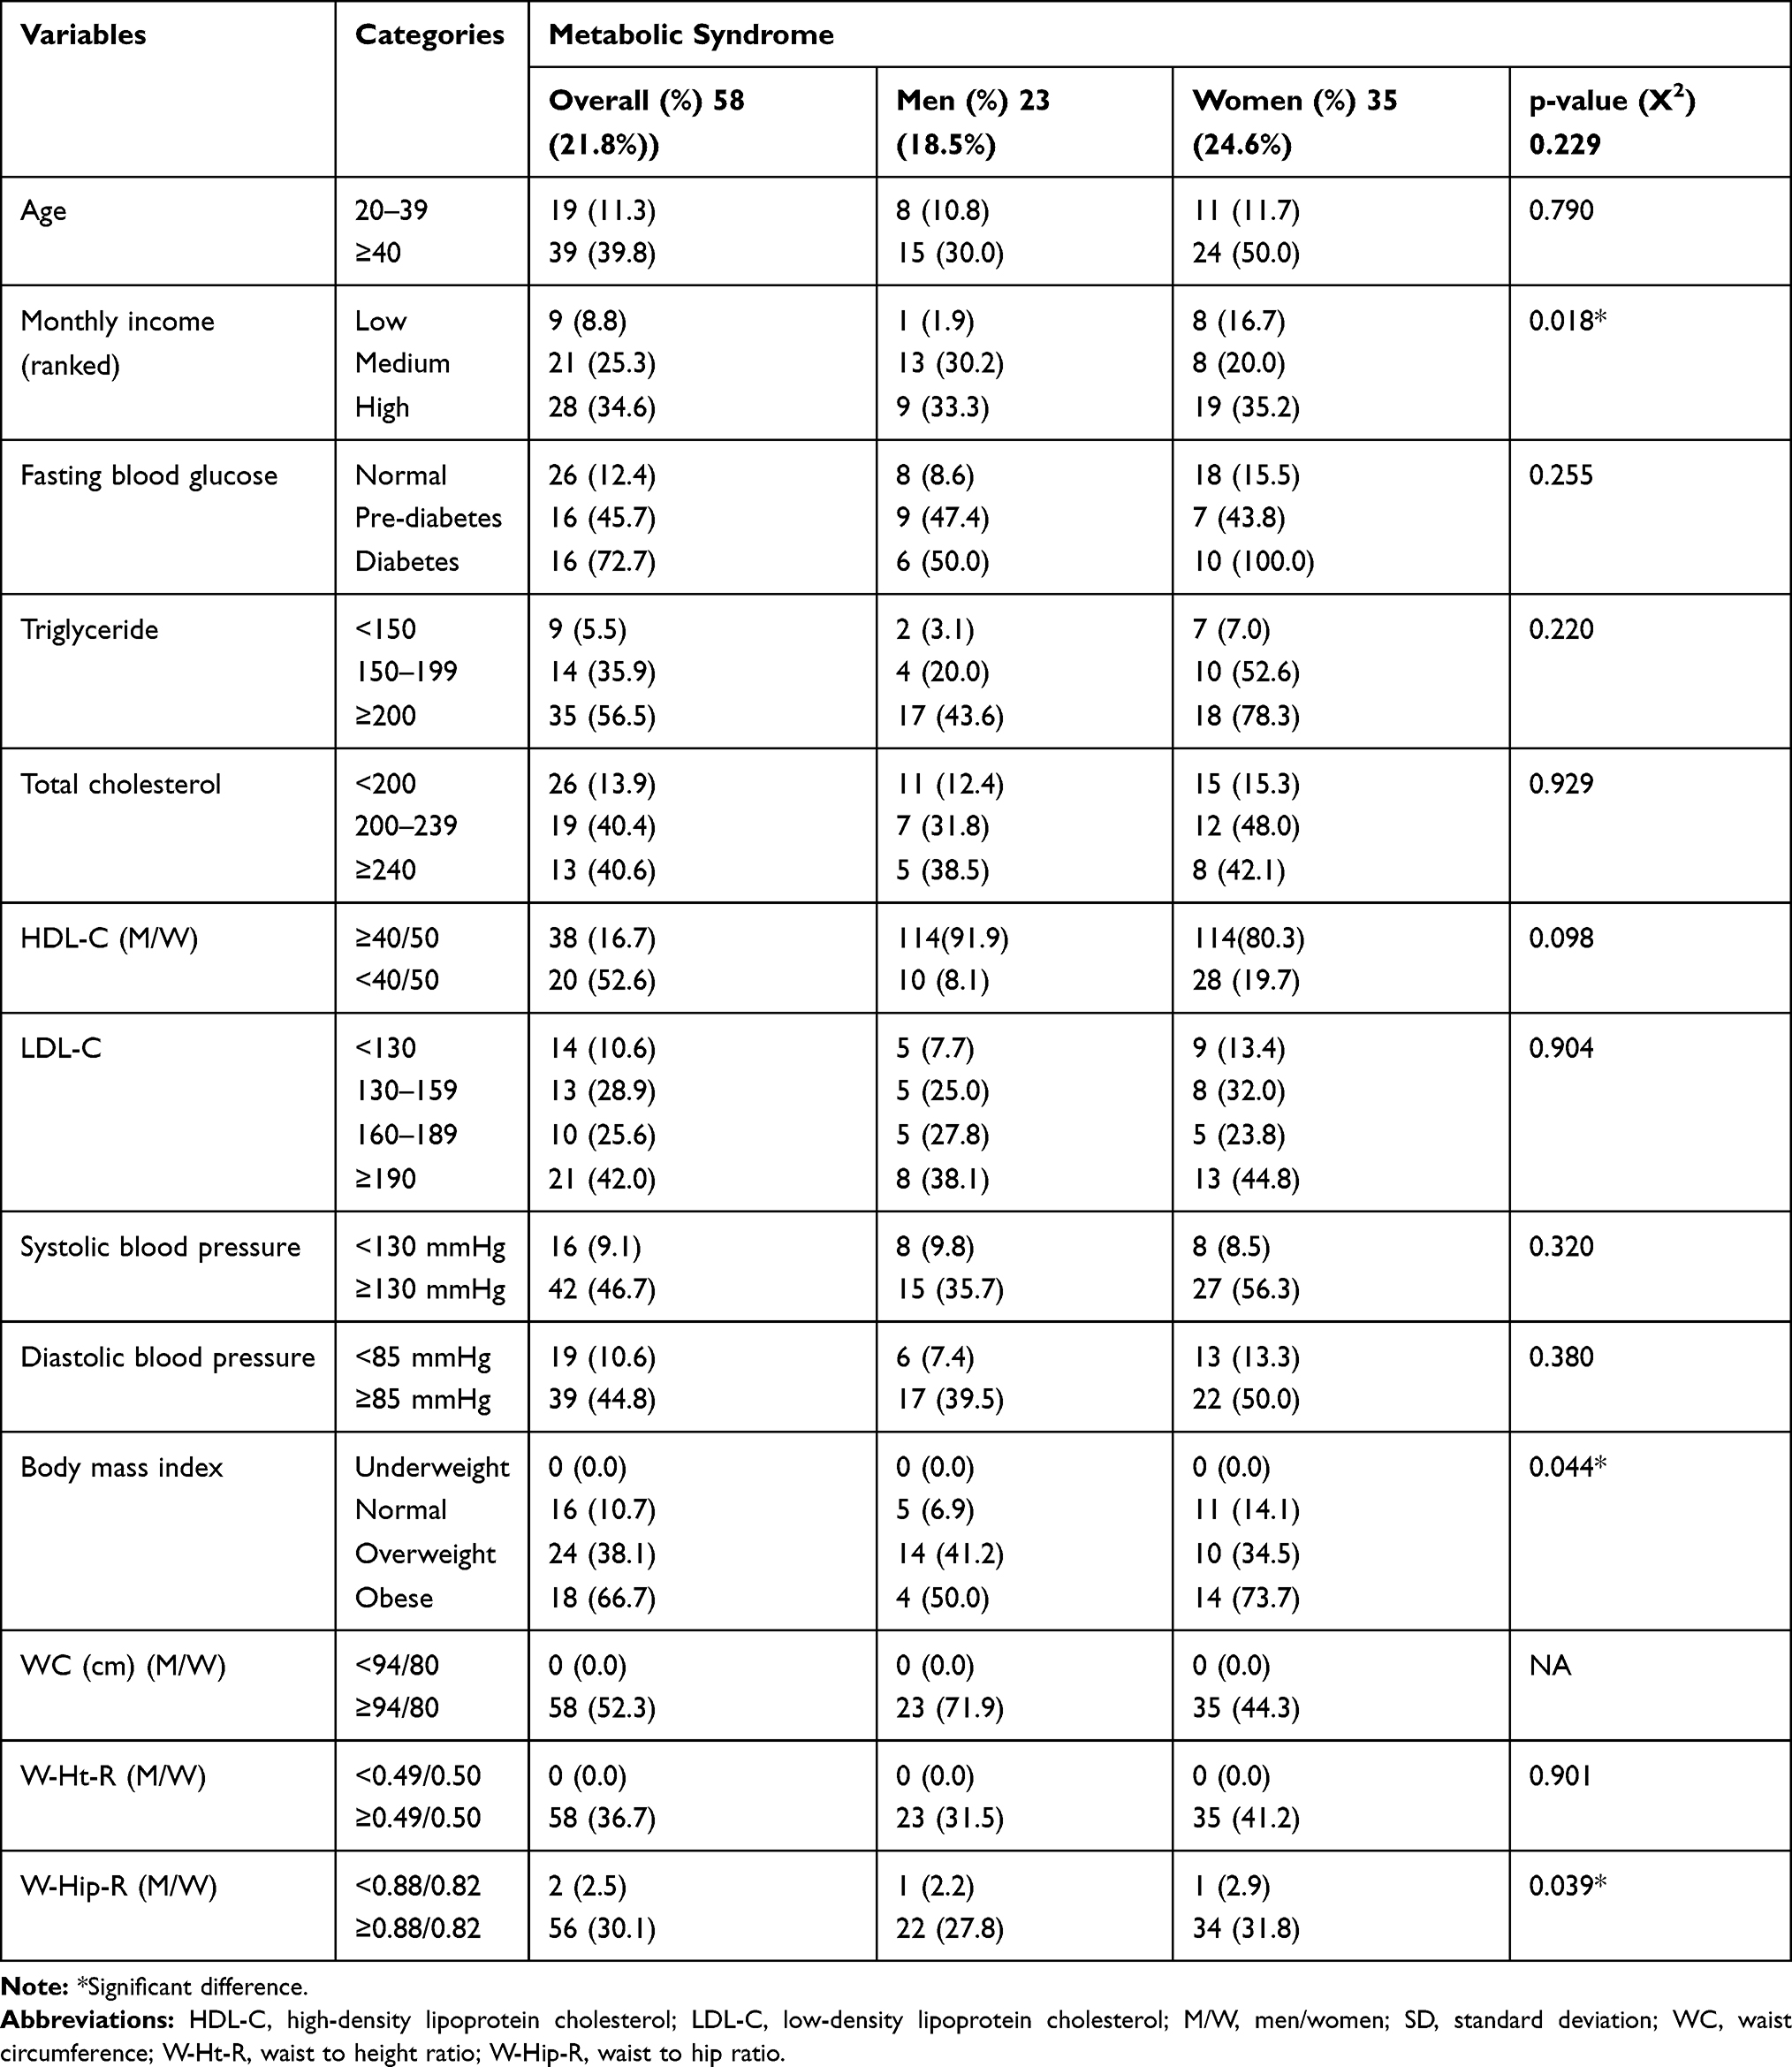 |
Table 3 The Distribution of MetS Among the Participants Stratified by Sex (n=266) |
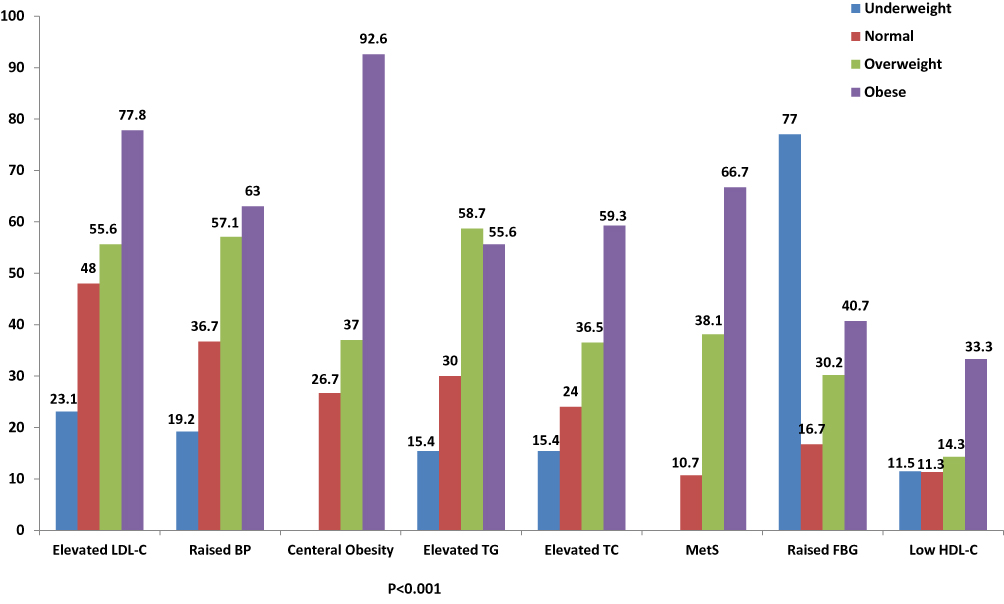 |
Figure 1 Variation of different metabolic disorders with BMI cutoffs among the participants (n = 266). Abbreviations: BP, blood pressure; BMI, body mass index; FBG, fasting blood glucose; HDL-C, high-density lipoprotein cholesterol; LDL-C, low-density lipoprotein cholesterol; MetS, metabolic syndrome; TC, total cholesterol; TG, triglyceride; WC, waist circumference. |
The mean values of all components of MetS, total cholesterol, and LDL-C were high among participants who had metabolic syndrome. Similarly, the mean age, SBP, DBP, and anthropometric findings were higher among participants with MetS. The mean total cholesterol (217.7 mg/dL), LDL-C (175.3 mg/dL), age (46.4 years), and BMI (28.4 kg/m2) of MetS positive adults were higher than MetS negative participants (Figure 2).
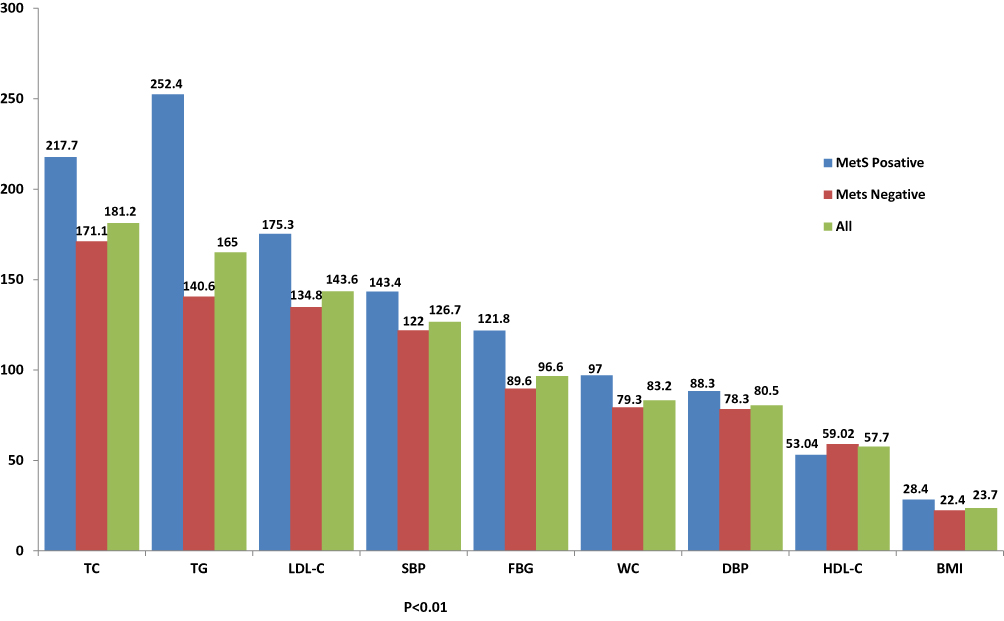 |
Figure 2 Variation in the mean value of different CVD risk factors with MetS status of the participants (n = 266). Abbreviations: BMI, body mass index (kg/m2); DBP, diastolic blood pressure (mmHg); FBG, fasting blood glucose (mg/dL); HDL-C, high-density lipoprotein cholesterol (mg/dL); LDL-C, low-density lipoprotein cholesterol (mg/dL); MetS, metabolic syndrome; SBP, systolic blood pressure (mmHg); TC, total cholesterol (mg/dL); TG, triglyceride (mg/dL); WC, waist circumference (cm); W-Ht-R, waist to height ratio; W-Hip-R, waist to hip ratio. |
Factors Associated with Metabolic Syndrome
Findings of multivariable logistic regression model showed advanced age, medium and high monthly income, walking less than 10 minutes per day, overweight and obesity, raised waist to hip ratio, and elevated total cholesterol were significantly associated with MetS. Adults aged 40 years and above had a 2.6 (aOR: 2.545, 95% CI: 1.201–5.392) times higher risk of developing MetS compared to under 40 years. The odds of having MetS among participants with medium and high monthly income was 2.8 (aOR: 2.807, 95% CI: 1.028–7.669) and 4.2 (aOR: 4.221, 95% CI: 1.606–11.094) times, respectively, compared to their low-income counterparts. Likewise, adults who did not walk for at least 10 minutes daily were 2.9 (aOR: 2.847, 95% CI: 1.112–7.290) times more likely to develop MetS compared to adults who walked at least for the stated time daily. Overweight and obese participants had a 5.4 (aOR: 5.411, 95% CI: 2.549–11.487) times higher risk of developing MetS compared to normal and underweight participants. Similarly, participants with a raised waist to hip ratio were 4.9 (aOR: 4.910, 95% CI: 1.076–22.402) times at a higher risk of developing MetS compared to those with a low waist to hip ratio. Besides, the odds of having MetS among adults with elevated total cholesterol was around 2.5 (aOR: 2.453, 95% CI: 1.172–5.132) times higher compared to adults with normal total cholesterol (Table 4).
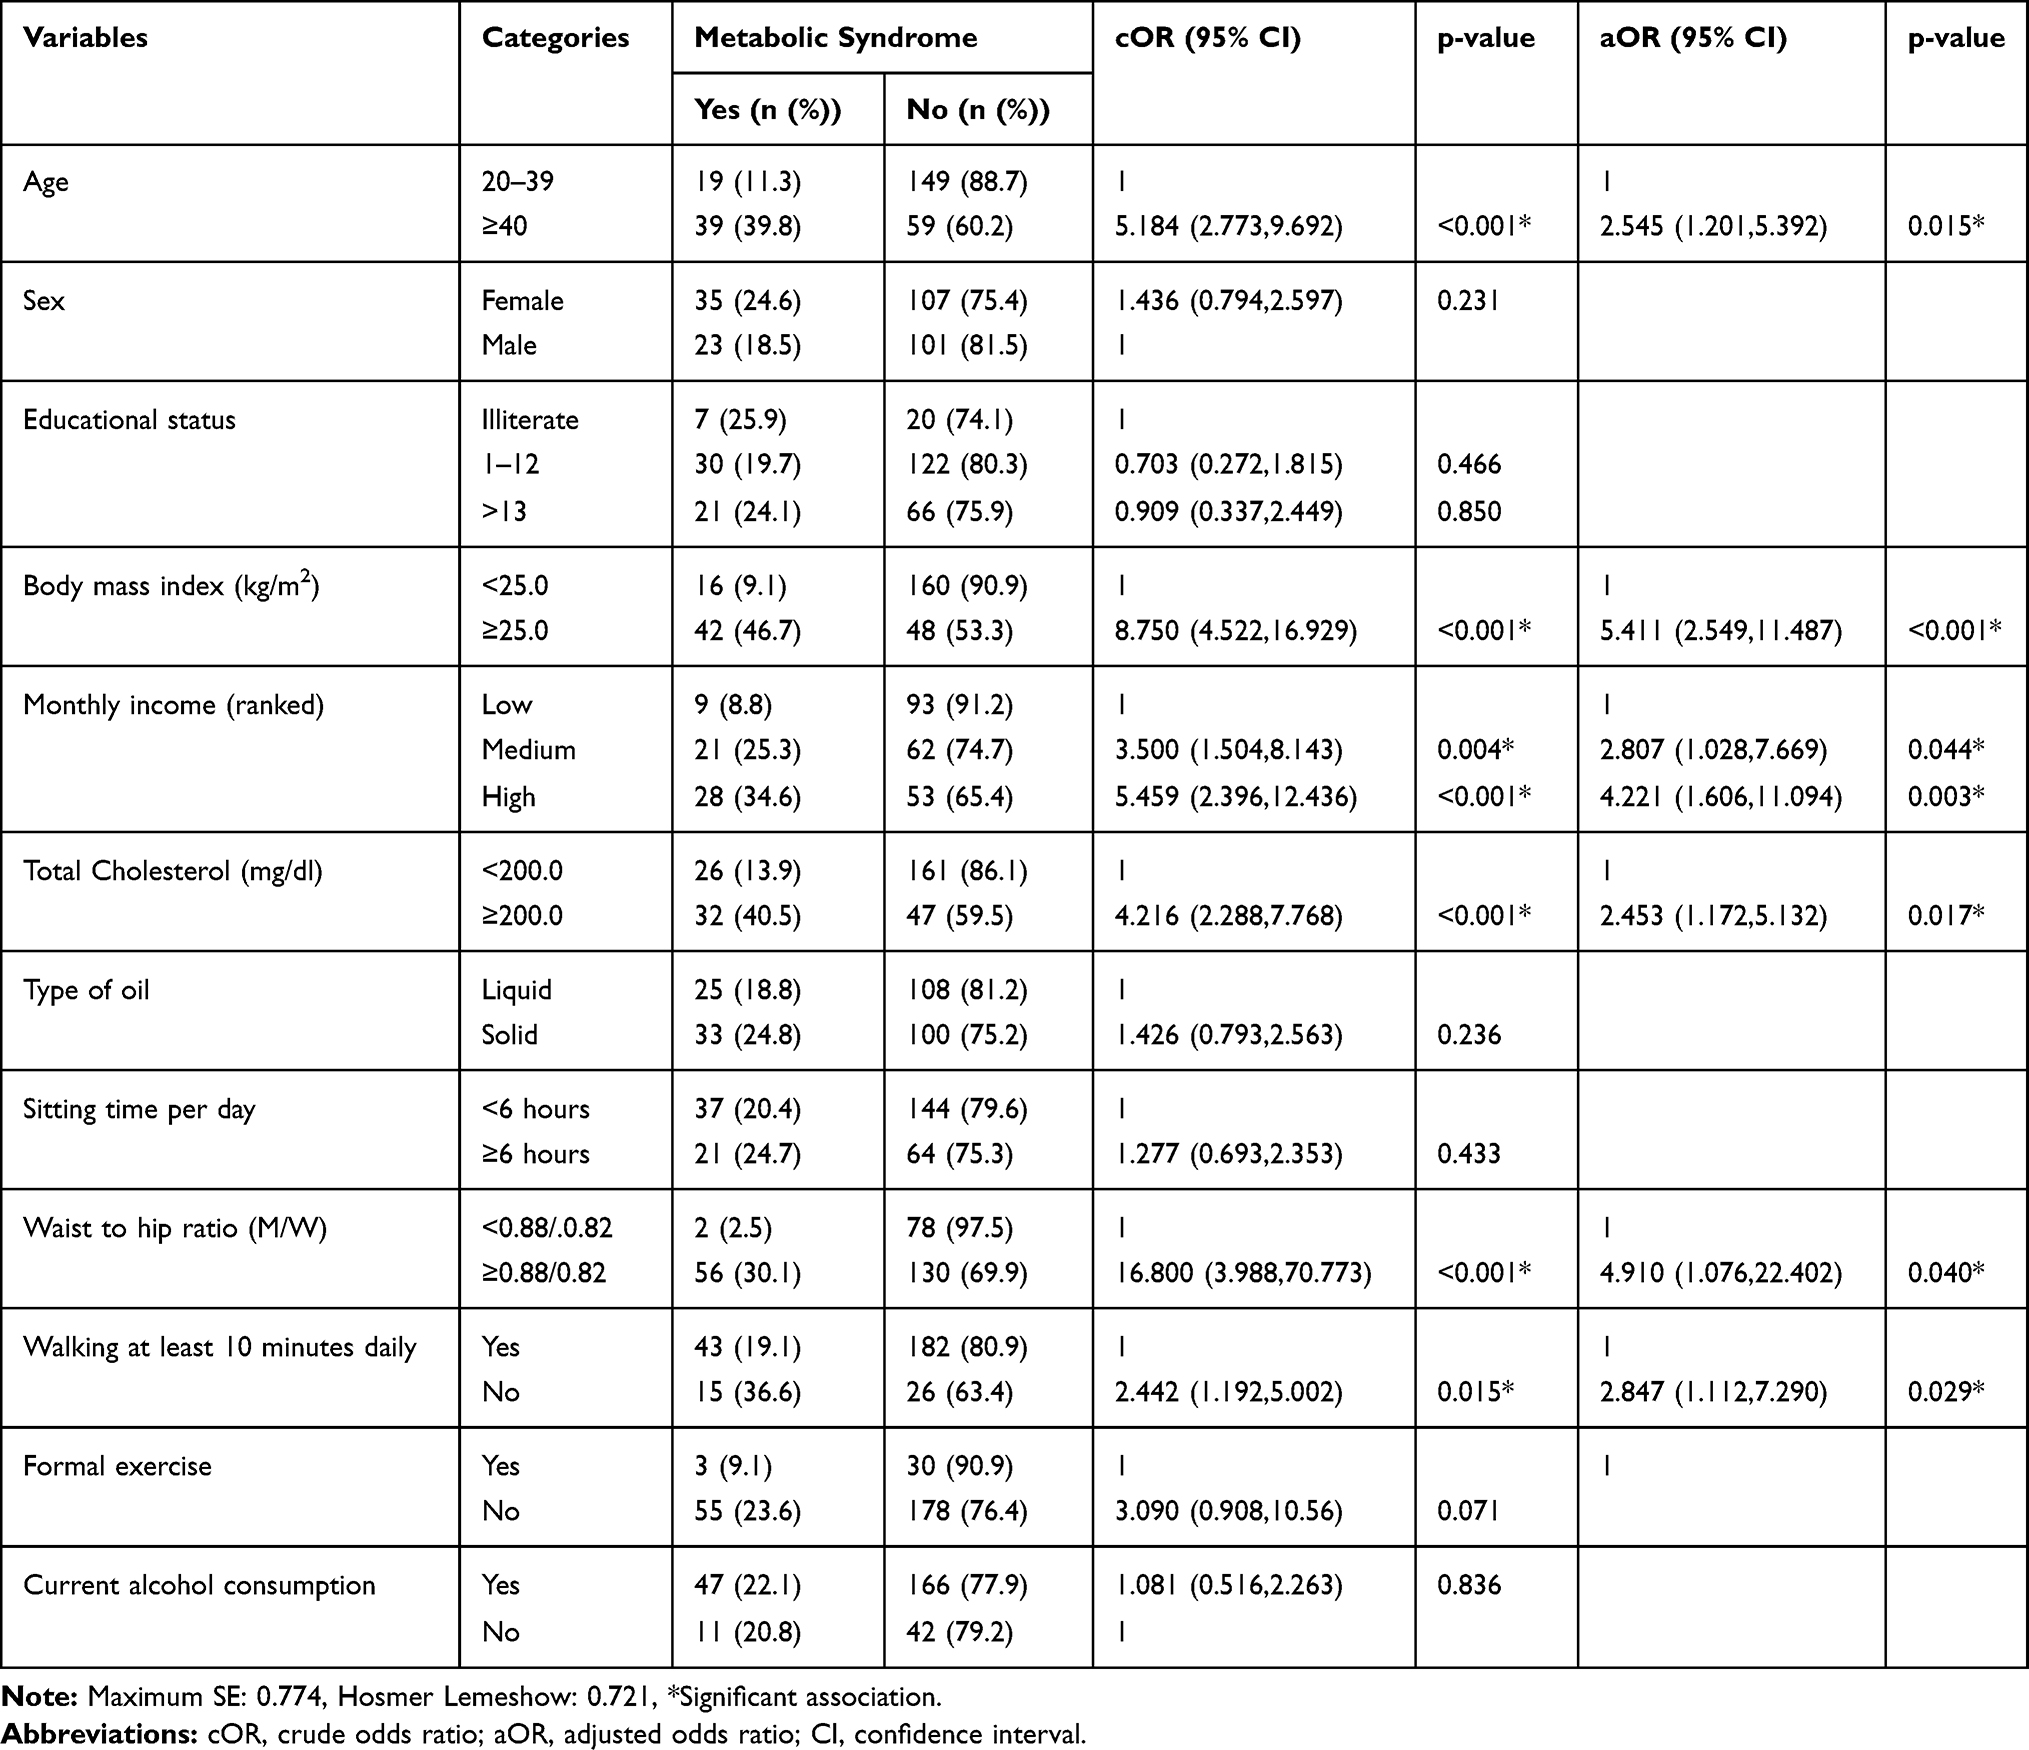 |
Table 4 Factors Associated with Metabolic Syndrome in Mekelle City (n=266) |
Discussion
The magnitude of MetS in the present study was 21.8%, which was higher than previously documented findings from some urban areas of Ethiopia like Addis Ababa (17.9%).20,27,37 The difference may be due to variation in sample size, level of urbanization, and study period. Besides, since the study was carried out in the second-largest city in Ethiopia, residents may have better economic status, which may contribute to a dietary shift (from fiber-rich traditional foods to refined and processed foods). Hospital-based studies from Ethiopia also documented a higher prevalence of MetS (70.1%) among adults with diabetes (48.7%)24,38 and hypertensive patients (40.7%).26 This might be due to the presence of one of the metabolic syndrome components in all the study participants. The finding of this study was also higher than the study from India (16.7%)39 and consistent with the study done in Pakistan (21.7%)40 and Indonesia (21.7%).41 However, this figure was lower than findings documented in different African countries like South Africa (42.6%),42 Kenya (25.6%),43 Botswana (27.1%),44 and Nigeria (29.1%).45 The possible reason for this inconsistency might be due to the variation in the study period, socioeconomic status, and level of urbanization.
Raised blood pressure was the most prominent component of MetS followed by central obesity with a magnitude of 42.5% and 41.7%, respectively. This finding was relatively low compared to the finding from southern Ethiopia where the prevalence of raised blood pressure, and central obesity was 26.2% and16.9%,37 respectively. This difference might be due to variation in the study setting where the present study was conducted in the second-largest city in Ethiopia with a more urbanized lifestyle, inclusion of older age participants, and better income which could contribute to an increased risk of developing all the components of metabolic syndrome.45–47 Similar findings were also reported from south Africa and the United Arab Emirates.42,48
Being older age was significantly associated with a higher risk of MetS. This may be due to physical inactivity and physiological changes like increased fat mass accompanied by decreased muscle mass among the older age participants. This finding was consistent with the study done in some urban areas of Ethiopia, South Africa, and India.27,37,40,42 Different studies also showed the tendency of developing MetS increases with age.49–52
Participants with medium and high monthly income had a higher risk of developing MetS compared to participants with low monthly income. The prevalence of MetS was 8.8%, 25.3%, and 34.6% among adults with low, medium, and high monthly income, respectively. This might be due to better access to energy-dense foods, alcoholic drinks, motorized transportation, and low engagement in energy-demanding daily work. However, a study from Angola also showed social class was not significantly associated with MetS,44 and the study from South Korea indicated only women with higher income had a lower risk of developing MetS.45
In this study, participants who did not walk at least 10 minutes per day had a significantly higher risk of developing MetS. More than one-third (36.6%) of participants who were walking less than 10 minutes per day had MetS. This might be due to the effect of walking on burning more energy which can prevent the accumulation of fat and weight gain. Besides, walking can improve insulin sensitivity and build muscle mass rather than fat mass.53 A study conducted in Ethiopia has shown that physical activity had a protecting role against NCDs among men.54
Overweight and obesity were significantly associated with having metabolic syndrome. Only 9.1% of the underweight and normal subjects had MetS while 46.7% of the overweight and obese participants had MetS. Increased body weight contributes to central obesity, which leads to accumulation of fat in the body. Fat forms artery plaque, which narrows arteries and capillaries leading to hypertension, and insulin sensitivity also decreases with body weight.55–59
Raised waist to hip ratio was significantly associated with a higher risk of MetS. Only 2.5% of subjects with a normal waist to hip ratio had MetS, whereas 30.1% of the subjects with a raised waist to hip ratio had MetS. This might be due to the fact that central obesity is one component of MetS. Besides, adults with central obesity were at higher risk of developing insulin resistance, elevated triglyceride and low HDL-C. Likewise, shorter subjects tend to have a higher ratio, which supports the evidence that early under-nutrition (stunting) leads to late over-nutrition.60 However, the literature on the effect of waist to hip ratio on MetS is limited.
Elevated total cholesterol was significantly associated with a higher risk of having MetS. Only 13.9% of subjects with normal total cholesterol had MetS while 40.5% of subjects with elevated total cholesterol had MetS. The possible justification is that elevated total cholesterol has a positive correlation with most MetS components and an inverse correlation with HDL-C. Total cholesterol can also increase with weight and central obesity and a study from Indonesia reported similar findings.39
Limitations of the Study
The findings of this study have a significant contribution to the prevention of metabolic syndrome. However, the cross-sectional nature of this study limits us from determining causal effects as the study variables. Recall bias may influence results as the participants could forget about family history on metabolic syndrome, but intensive training was given for data collectors on how to probe respondents. Anthropometric measurements are prone to errors. However, this study was conducted with the highest precaution in training the anthropometric data collectors, equipment calibration, and standardization of procedure to minimize the possibility of error occurrence.
Conclusion
In this study, we found a high prevalence of MetS and its components among healthy adults in the urban area of Northern Ethiopia. This shows Ethiopia is in a transitional stage from communicable to NCDs burden. Besides, in Ethiopia there is a problem of both under and over nutrition. Since most adults in Ethiopia were under-nourished during their childhood and adolescent period, they are more prone to late over nutrition. Emphasis should be given especially for urban residents because of improved economic status and lower activity levels. Addressing the upstream risk factors of MetS is cost-effective and feasible for developing countries like Ethiopia prior to the creation of the NCDs epidemic. Routine screening, counseling, and management scheme of MetS should be in place in the health facilities, especially in urban areas. Besides, it is necessary to improve the awareness of individuals on the risk factors and the use of nutritional, exercise, and behavioral interventions for both the prevention and treatment of metabolic syndrome.
Abbreviations
BMI, body mass index; CVD, cardiovascular disease, DBP, diastolic blood pressure; FBG, fasting blood glucose; HDL-C, high-density lipoprotein cholesterol; IDF, International Diabetic Federation; IFG, impaired fasting glucose; LDL-C, low-density lipoprotein cholesterol; MetS, metabolic syndrome; NCDs, non-communicable diseases; SBP, systolic blood pressure; WC, waist circumference; WHO, World Health Organization.
Data Sharing Statement
The data used for this study are available from the corresponding author on reasonable request.
Ethical Approval
The institutional review board of Jimma University has approved the study with a reference number of IHRPGD/349/2019. We have obtained a support letter to conduct the study from all concerned health authorities (Tigray regional health bureau, Mekelle city zonal health office, and the seven sub-cities’ district health offices). All participants were informed of what is expected from them and their rights using the information sheet. We have obtained written informed consent from each participant. We have linked participants with abnormal lipid profile, abnormal glucose metabolism, and hypertension to their nearest health facility for further investigation, counseling, and treatment. This study was conducted in accordance with the Declaration of Helsinki.
Acknowledgments
We would like to express our heartfelt gratitude to all study participants, data collectors, Tigray Health Research Institute, Jimma University, and Adigrat University for facilitating this study.
Author Contributions
All authors made substantial contributions to conception and design, acquisition of data, or analysis and interpretation of data; took part in drafting the article or revising it critically for important intellectual content; agreed to submit to the current journal; gave final approval of the version to be published; and agree to be accountable for all aspects of the work.
Funding
The authors received no financial support for the publication of the article.
Disclosure
The authors declare that they have no conflicts of interest for this work.
References
1. Grundy S, Bryan Brewer H, Cleeman J, et al. Definition of metabolic syndrome: report of the national heart, lung and blood institute/American Heart Association conference on scientific issues related to definition. Circulation. 2004;109(3):433–438. doi:10.1161/01.CIR.0000111245.75752.C6
2. Alberti KG, Eckel RH, Grundy SM, et al. Harmonizing the metabolic syndrome: a joint interim statement of the international diabetes federation task force on epidemiology and prevention; national heart, lung, and blood institute; American Heart Association; world heart federation; international. Circulation. 2009;120(16):1640–1645. doi:10.1161/CIRCULATIONAHA.109.192644
3. Saklayen MG. The global epidemic of the metabolic syndrome. Curr Hypertens Rep. 2018;20(2):1–8. doi:10.1007/s11906-018-0812-z
4. WHO. Think piece: why is 2018 a strategically important year for NCDs? WHO independent high-level commission on NCDs. Think. 2018; 1–12
5. Scholze J, Alegria E, Ferri C, et al. Epidemiological and economic burden of metabolic syndrome and its consequences in patients with hypertension in Germany, Spain and Italy; a prevalence-based model. BMC Public Health. 2010;10(1):529. doi:10.1186/1471-2458-10-529
6. Misra A, Khurana L. Obesity and the metabolic syndrome in developing countries. J Clin Endocrinol Metab. 2008;93(11_supplement_1):S9–S30. doi:10.1210/jc.2008-1595
7. Mohan V, Deepa M. The metabolic syndrome in developing countries. Diabetes Voice. 2006:51.
8. Adediran O, Akintunde AA, Edo AE, et al. Impact of urbanization and gender on frequency of metabolic syndrome among native Abuja settlers in Nigeria. J Cardiovasc Dis Res. 2012;3(3):191–196. doi:10.4103/0975-3583.98890
9. Vorster HH. The emergence of cardiovascular disease during urbanization of Africans. Public Health Nutr. 2002;5(1a):239–243. doi:10.1079/PHN2001299
10. Peer N, Steyn K, Lombard C, et al. A high burden of hypertension in the urban black population of Cape Town: the cardiovascular Risk in Black South Africans (CRISBA) study. PLoS One. 2013;8(11):11. doi:10.1371/journal.pone.0078567
11. Pradeilles R, Griffiths PL, Norris SA, et al. Socio-economic influences on anthropometric status in urban South African adolescents: sex differences in the birth to twenty plus cohort. Public Health Nutr. 2015;18(16):2998–3012. doi:10.1017/S1368980015000415
12. WHO. WHO independent high-level commission on non-communicable diseases version dated 1 may 2018. WHO. 2018. Available from: http://apps.who.int/iris/bitstream/handle/10665/272710/9789241514163-eng.pdf?ua=1.
13. WHO. Report of the WHO independent high-level commission on non-communicable diseases. WHO, Geneva 2018. Available from: http://apps.who.int/iris/bitstream/handle/10665/272710/9789241514163-eng.pdf?ua=1.
14. Mathers CD, Loncar D, Samet J. Projections of global mortality and burden of disease from 2002 to 2030. PLoS Med. 2006;3(11):e442. doi:10.1371/journal.pmed.0030442
15. Gyasi RM, Phillips DR, Meeks S. Aging and the rising burden of noncommunicable diseases in sub-Saharan Africa and other low-and middle-income countries: a call for holistic action. Gerontologist. 2020;60(5):806–811. doi:10.1093/geront/gnz102
16. Misganaw A, Haregu TN, Deribe K, et al. National mortality burden due to communicable, non-communicable, and other diseases in Ethiopia, 1990–2015: findings from the global burden of disease study 2015. Popul Health Metrics. 2017;15(1):29. doi:10.1186/s12963-017-0145-1
17. Misganaw A, Mariam DH, Araya T, et al. Patterns of mortality in public and private hospitals of Addis Ababa, Ethiopia. BMC Public Health. 2012;12(1):1. doi:10.1186/1471-2458-12-1007
18. Misganaw A, Mariam DH, Ali A, et al. Epidemiology of major non-communicable diseases in ethiopia: a systematic review. J Health Popul Nutr. 2014;32(1):1–13.
19. Shiferaw F, Letebo M, Misganaw A, et al. Non-communicable diseases in Ethiopia: disease burden, gaps in health care delivery and strategic directions. Ethiop J Health Dev. 2018;32:3.
20. Gebreyes YF, Goshu DY, Geletew TK, et al. Prevalence of high blood pressure, hyperglycemia, dyslipidemia, metabolic syndrome and their determinants in Ethiopia: evidences from the National NCDs STEPS. PLoS One. 2018;13(5):1–18. doi:10.1371/journal.pone.0194819
21. Tadewos A, Egeno T, Amsalu A. Risk factors of metabolic syndrome among hypertensive patients at Hawassa University Comprehensive Specialized Hospital, Southern Ethiopia. BMC Cardiovasc Disord. 2017;17(1):218. doi:10.1186/s12872-017-0648-5
22. Hirigo AT, Tesfaye DY. Influences of gender in metabolic syndrome and its components among people living with HIV virus using antiretroviral treatment in Hawassa, southern Ethiopia. BMC Res Notes. 2016;9(1):1–7. doi:10.1186/s13104-016-1953-2
23. Tsegay B, Alemishet Y, Fessahaye A, et al. Prevalence of lipodystrophy and metabolic syndrome among HIV positive individuals on highly active anti-retroviral treatment in Jimma, South West Ethiopia. Pan Afr Med J. 2012;13(43):1–14.
24. Woyesa SB, Hirigo AT, Wube TB. Hyperuricemia and metabolic syndrome in type 2 diabetes mellitus patients at Hawassa university comprehensive specialized hospital, South West Ethiopia. BMC Endocr Disord. 2017;17(1):1–8. doi:10.1186/s12902-017-0226-y
25. Edris A, Leja H, Fassil T, et al. Metabolic syndrome and associated factors among outpatients of Jimma university teaching hospital. Diabetes Metab Syndr Obes. 2016;9:47–53. doi:10.2147/DMSO.S97561
26. Tachebele B, Abebe M, Addis Z, et al. Metabolic syndrome among hypertensive patients at University of Gondar Hospital, North West Ethiopia: a cross sectional study. BMC Cardiovasc Disord. 2014;14(1):177. doi:10.1186/1471-2261-14-177
27. Tran A, Gelaye B, Girma B, et al. Prevalence of metabolic syndrome among working adults in Ethiopia. Int J Hypertens. 2011;2011.
28. Birarra M, Gelayee D. Metabolic syndrome among type 2 diabetic patients in Ethiopia: a cross-sectional study. BMC Cardiovasc Disord. 2018;18(1):1–12. doi:10.1186/s12872-018-0880-7
29. WHO. The WHO STEPwise approach to chronic disease risk factor surveillance (STEPS). Geneva, Switzerland. V2.1. Available from: www.who.int/chp/steps.
30. Bland M, Altman D. Statistics notes: cronbach’s alpha. Br Med J. 1997;314(7080):314–572. doi:10.1136/bmj.314.7080.572
31. Marfell-Jones M, Stewart A, de Ridder J. International Standards for Anthropometric Assessment. Wellington, New Zealand: International Society for the Advancement of Kinanthropometry; 2012. https://repository.openpolytechnic.ac.nz/handle/11072/1510.
32. Alberti K, Zimmet P, Shaw J. Metabolic syndrome — a new world-wide definition. A consensus statement from the international diabetes federation. Diabet Med. 2006;23(5):469–480. doi:10.1111/j.1464-5491.2006.01858.x
33. National Cholesterol Education Program (US). Expert panel on detection, evaluation, and treatment of high blood cholesterol in adults. Executive summary of the third report of the National Cholesterol Education Program (NCEP) expert panel on detection, evaluation, and treatment of high blood cholesterol in adults (adult treatment panel III). JAMA. 2001;285(19):2486–2497. doi:10.1001/jama.285.19.2486
34. Douglas G, Nicol F, Robertson C. Macleod’s Clinical Examination E-Book.
35. Sinaga M, Worku M, Yemane T, et al. Optimal cut-off for obesity and markers of metabolic syndrome for Ethiopian adults. Nutr J. 2018;17(1):1–12. doi:10.1186/s12937-018-0416-0
36. Vyas S, Kumaranayake L. Constructing socio-economic status indices: how to use principal components analysis. Health Policy Plan. 2006;21(6):459–468. doi:10.1093/heapol/czl029
37. Kerie S, Menberu M, Geneto M. Metabolic syndrome among residents of Mizan-Aman town, South West Ethiopia, 2017: a cross sectional study. PLoS One. 2019;3:1–9.
38. Tadewos A, Egeno T, Amsalu A. Risk factors of metabolic syndrome among hypertensive patients at Hawassa University comprehensive specialized hospital. BMC Cardiovasc Disord. 2017;17(1):1–9
39. Selvaraj P, Muthunarayanan L. Lifestyle prevalence of metabolic syndrome and associated risk factors among men in a rural health centre area in Tamil Nadu. J Lifestyle Med. 2019;9(1):44–51. doi:10.15280/jlm.2019.9.1.44
40. Roomi MA, Mohammadnezhad M. Prevalence of metabolic syndrome among apparently healthy workforce. J Ayub Med Coll Abbottabad. 2019;31(2):252–254.
41. Herningtyas EH, Ng TS. Prevalence and distribution of metabolic syndrome and its components among provinces and ethnic groups in Indonesia. BMC Public Health. 2019;19(1):1–12. doi:10.1186/s12889-019-6711-7
42. Kruger MJ, Nell TA. The prevalence of the metabolic syndrome in a farm worker community in the Boland district, South Africa. BMC Public Health. 2017;17(1):1–10. doi:10.1186/s12889-016-3973-1
43. Omuse G, Maina D, Hoffman M, et al. Metabolic syndrome and its predictors in an urban population in Kenya: a cross sectional study. BMC Endocr Disord. 2017;17(1):1–11. doi:10.1186/s12902-016-0144-4
44. Tshikuka J, Tsima B, Mwita J, Tsima B, Nkomazana O, Amone_P’ Olak K. Prevalence and determinants of metabolic syndrome: a cross-sectional survey of general medical outpatient clinics using National Cholesterol Education Program-Adult Treatment Panel III criteria in Botswana. Diabetes Metab Syndr Obes. 2016;9:273–279. doi:10.2147/DMSO.S109007
45. Young E, Okafor C, Iroezindu M, et al. Insulin resistance, metabolic syndrome, and lipids in African women. Niger J Clin Pract. 2016;9(6).
46. Nshisso L, Reese A, Gelaye B, et al. Prevalence of hypertension and diabetes among Ethiopian Adults. Diabet Metab Syndr. 2012;6(1):36–41.
47. Sabir A, Jimoh A, Iwuala S, et al. Metabolic syndrome in urban city of North-Western Nigeria: prevalence and determinants. Pan Afr Med J. 2016;23:19. doi:10.11604/pamj.2016.23.19.5806
48. Khthir R, Espina FL. The metabolic syndrome in rural UAE: the effect of gender, ethnicity and the environment in its prevalence. J Metab Synd. 2014;3(4):8–12.
49. Hajian-tilaki K. Metabolic syndrome and its associated risk factors in Iranian adults: a systematic review. Caspian J Intern Med. 2015;6(2):51–61.
50. Magalhães P, Capingana DP, Mill JG. Prevalence of the metabolic syndrome and determination of optimal cut-off values of waist circumference in university employees from Angola. Cardiovasc J Afr. 2014;25(1):27–33. doi:10.5830/CVJA-2013-086
51. Tran BT, Jeong BY, Oh J. The prevalence trend of metabolic syndrome and its components and risk factors in Korean adults: results from the Korean National Health and Nutrition Examination Survey 2008 – 2013. BMC Public Health. 2017;17(1):1–8. doi:10.1186/s12889-016-3936-6
52. Yeboah K, Dodam K, Affrim PK, et al. Metabolic syndrome and parental history of cardiovascular disease in young adults in urban Ghana. BMC Public Health. 2018;18(1):96. doi:10.1186/s12889-017-4652-6
53. Sareen S, Jack L. Advanced Nutrition and Human Metabolism.
54. Workalemahu T, Gelaye B, Berhane Y, et al. Original article physical activity and metabolic syndrome among Ethiopian Adults. Am J Hypertens. 2013;26(4):535–540. doi:10.1093/ajh/hps079
55. Misra A, Khurana L. Obesity and the metabolic syndrome in developing countries. J Clin Endocrinol Metab. 2008;93(11_supplement_1):9–30.
56. Ofer K, Ronit L, Ophir A, Amir K. Normal body mass index (BMI) can rule out metabolic syndrome. Medicine. 2019;98(9).
57. Anderson AA, Yoo H, Franke WD. Associations of physical activity and obesity with the risk of developing the metabolic syndrome in law enforcement officers. JOEM. 2016;58(9).
58. Goodpaster BH, Krishnaswami S, Harris TB, et al. Obesity, regional body fat distribution, and the metabolic syndrome in older men and women. Arch Intern Med. 2005;165(7):777–783. doi:10.1001/archinte.165.7.777
59. Nguyen NT, Magno CP, Lane KT, et al. Association of hypertension, diabetes, dyslipidemia, and metabolic syndrome with obesity: findings from the national health and nutrition examination survey, 1999 to 2004. J Am Coll Surg. 2008;207(6):928–934. doi:10.1016/j.jamcollsurg.2008.08.022
60. Thang S, Michael E. Metabolic syndrome. Medicine. 2015;43(2):80–87. doi:10.1016/j.mpmed.2014.11.006
 © 2021 The Author(s). This work is published and licensed by Dove Medical Press Limited. The full terms of this license are available at https://www.dovepress.com/terms.php and incorporate the Creative Commons Attribution - Non Commercial (unported, v3.0) License.
By accessing the work you hereby accept the Terms. Non-commercial uses of the work are permitted without any further permission from Dove Medical Press Limited, provided the work is properly attributed. For permission for commercial use of this work, please see paragraphs 4.2 and 5 of our Terms.
© 2021 The Author(s). This work is published and licensed by Dove Medical Press Limited. The full terms of this license are available at https://www.dovepress.com/terms.php and incorporate the Creative Commons Attribution - Non Commercial (unported, v3.0) License.
By accessing the work you hereby accept the Terms. Non-commercial uses of the work are permitted without any further permission from Dove Medical Press Limited, provided the work is properly attributed. For permission for commercial use of this work, please see paragraphs 4.2 and 5 of our Terms.