")
Back to Journals » International Journal of Nanomedicine » Volume 17
Magnetic Nano-Platform Enhanced iPSC-Derived Trabecular Meshwork Delivery and Tracking Efficiency
Authors Wang X, Cao Q, Wu S, Bahrani Fard MR, Wang N, Cao J, Zhu W
Received 25 October 2021
Accepted for publication 9 March 2022
Published 22 March 2022 Volume 2022:17 Pages 1285—1307
DOI https://doi.org/10.2147/IJN.S346141
Checked for plagiarism Yes
Review by Single anonymous peer review
Peer reviewer comments 3
Editor who approved publication: Professor Lei Yang
Xiangji Wang,1 Qilong Cao,2 Shen Wu,3 Mohammad Reza Bahrani Fard,4 Ningli Wang,3 Jie Cao,1 Wei Zhu1,5
1School of Pharmacy, Qingdao University, Qingdao, People’s Republic of China; 2Qingdao Haier Biotech Co. Ltd, Qingdao, People’s Republic of China; 3Beijing Tongren Hospital Eye Center, Capital Medical University, Beijing, People’s Republic of China; 4George W. Woodruff School of Mechanical Engineering, Georgia Institute of Technology, Atlanta, GA, USA; 5Beijing Advanced Innovation Center for Big Data-Based Precision Medicine, Beihang University & Capital Medical University, Beijing, People’s Republic of China
Correspondence: Wei Zhu; Jie Cao, Email [email protected]; [email protected]
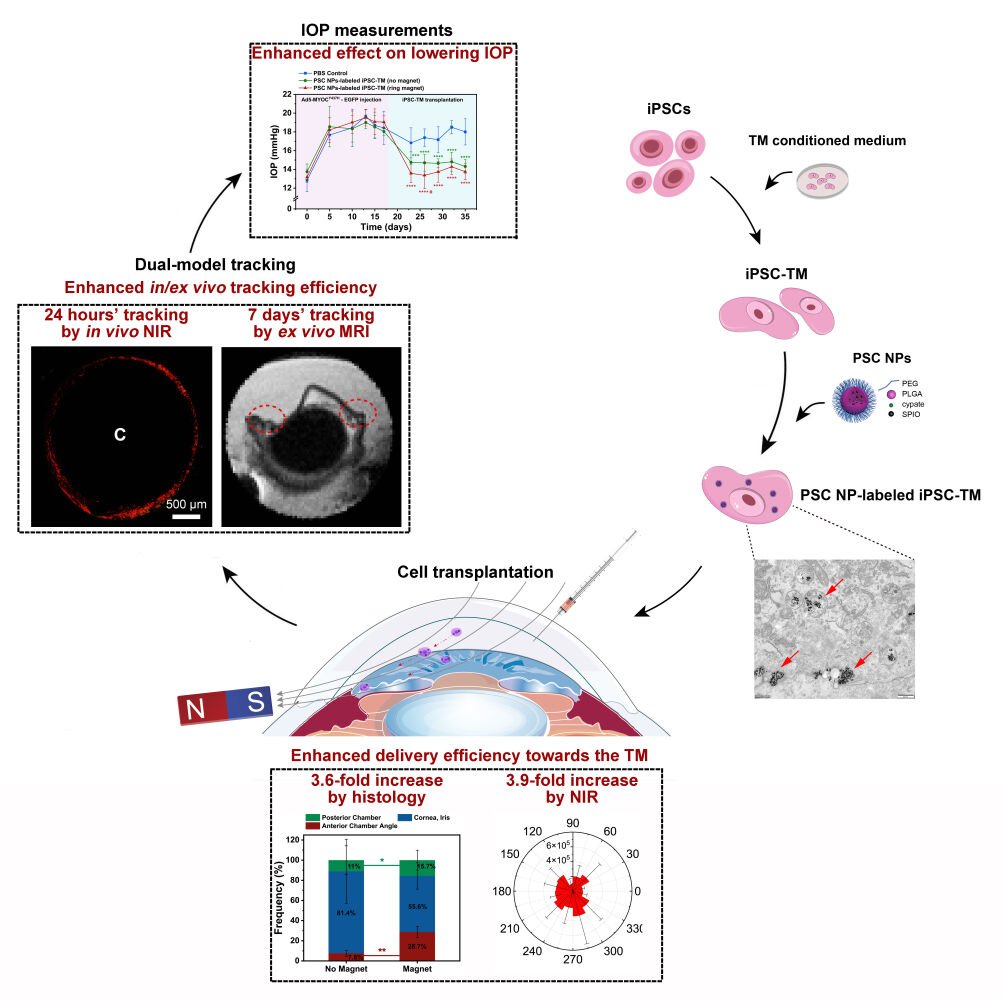
Purpose: Transplantation of stem cells to remodel the trabecular meshwork (TM) has become a new option for restoring aqueous humor dynamics and intraocular pressure homeostasis in glaucoma. In this study, we aimed to design a nanoparticle to label induced pluripotent stem cell (iPSC)-derived TM and improve the delivery accuracy and in vivo tracking efficiency.
Methods: PLGA-SPIO-Cypate (PSC) NPs were designed with polylactic acid-glycolic acid (PLGA) polymers as the backbone, superparamagnetic iron oxide (SPIO) nanoparticles, and near-infrared (NIR) dye cypate. In vitro assessment of cytotoxicity, iron content after NPs labeling, and the dual-model monitor was performed on mouse iPSC-derived TM (miPSC-TM) cells, as well as immortalized and primary human TM cells. Cell function after labeling, the delivery accuracy, in vivo tracking efficiency, and its effect on lowering IOP were evaluated following miPSC-TM transplantation in mice.
Results: Initial in vitro experiments showed that a single-time nanoparticles incubation was sufficient to label iPSC-derived TM and was not related to any change in both cell viability and fate. Subsequent in vivo evaluation revealed that the use of this nanoparticle not only improves the delivery accuracy of the transplanted cells in live animals but also benefits the dual-model tracking in the long term. More importantly, the use of the magnet triggers a temporary enhancement in the effectiveness of cell-based therapy in alleviating the pathologies associated with glaucoma.
Conclusion: This study provided a promising approach for enhancing both the delivery and in vivo tracking efficiency of the transplanted cells, which facilitates the clinical translation of stem cell-based therapy for glaucoma.
Keywords: magnetic fluorescent nanoparticle, induced pluripotent stem cell, trabecular meshwork, in vivo monitoring, specific targeting
Graphical Abstract:
Introduction
Glaucoma is the second leading cause of blindness worldwide and elevated intraocular pressure (IOP) is the major risk factor associated with the pathology.1 The conventional outflow pathway comprising of the trabecular meshwork and Schlemm’s canal accounts for most of the aqueous humor (AH) drainage from the eye. A sustained increase of AH outflow resistance in this pathway is the primary reason for the IOP elevation.2–5 Although the mechanism behind such increased resistance is not fully understood, a glaucoma-associated decrease in TM cellularity is proposed as a critical reason for abnormal AH outflow. While the drugs available for glaucoma are intended to lower the IOP, only some act through improving the TM function.6–8 Even with these drugs, an approach to repopulate the damaged TM is still limited.9
Stem cell-based therapy using mesenchymal stem cells (MSCs),10 trabecular meshwork stem cells,11–14 and induced pluripotent stem cells (iPSCs)15–18 has emerged, offering a promising regeneration of the TM and IOP reduction in some glaucoma models. More encouragingly, some mechanisms of stem cell-based therapy has been discovered, such as the cell replacement role of TMSCs11 and the recruitment function of MSCs.10 We have shown that the therapeutic effect of iPSC-derived TM cells on tissue regeneration in 4-mon-old Tg-MYOCY437H mice (early stage of glaucoma),15 6-mon-old Tg-MYOCY437H mice (advanced stage of glaucoma),17 C57BL/6 receiving adenovirus 5 (Ad5)-MYOCY437H-EGFP,19 sGC alpha1 knockout mice (Trabecular meshwork restoration in primary open-angle glaucoma using stem cells; ISSN: 2542–5595, Volume 3), and perfused human eyes,16 which relies on the endogenous TM cell division through a direct cell-to-cell contact.15,16,19 As such, the enhanced cell delivery accuracy to the TM is desirable, which may benefit the regeneration effectiveness of stem cells.
In the previous studies, the fluid mechanical forces of AH led to a passive delivery of the transplanted cells to the TM. Even though some of the cells could home to the TM, there is a significant number of unwanted attachments to some other tissues, such as the corneal endothelial layer, iris, and lens.10,15,20 In addition, the segmental flow through the conventional outflow pathway21 limits the cell delivery to the “inactive” sites of the TM, which is anticipated to reduce the beneficial effects of stem cell treatment. To improve the delivery accuracy, Snider et al used magnetical nanocubes to label MSCs before injection, and they showed that the use of a magnet allows the injected cells for more efficient and uniform delivery towards the TM based on the confocal observations and histological analyses.22 However, immunohistology following animal sacrifice is not suitable for the clinical translation of stem cell-based therapy. As for in vivo tracking techniques used in ophthalmology, optical coherence tomography (OCT), ultrasonic imaging, magnetic resonance imaging (MRI), positron emission tomography (PET), fluorescence imaging (FI) are the most common approaches.23–30 Recently, FI has been widely used in cell monitoring in the TM after labeling the transplanted cells with fluorescent proteins15–17 or cell trackers.20,31 However, this approach has several shortcomings, such as a chance of tumor formation due to chromosomal integration of fluorescent proteins,32,33 immune reaction due to viral infection,34 fluorescence signal attenuation because of cell proliferation,35 and autofluorescence of the TM.28 In addition, each technique described above has its own disadvantages in resolution, sensitivity, contrast, acquisition speed or safety, etc. As such, future cell-based therapy will not only demand efficient delivery of the transplanted cells but also request a powerful monitoring system.
In this study, we designed a new magnetic nanoparticle using a backbone of polylactic acid-glycolic acid (PLGA) polymer incorporated with superparamagnetic iron oxide (SPIO) nanoparticles and near-infrared fluorescent imaging reagent. Initial in vitro assessment of cytotoxicity, iron content, and fluorescence intensity was performed on mouse iPSC-derived TM (miPSC-TM) cells, as well as immortalized and primary human TM cells. Additionally, cell function after NPs labeling was evaluated to ensure that the use of NPs is safe and not associated with any change of cell fate. Final in vivo evaluation following miPSC-TM transplantation revealed that NP-labeled miPSC-TM could not only be effectively steered by a magnet towards the TM in live animals but also be monitored in the long term by a NIR/MRI dual-imaging model.
Materials and Methods
Animals
2-month-old male C57BL/6J mice were purchased from Beijing Vital River Laboratory Animal Technology Co, Ltd (Beijing, China) and housed under standard conditions with a 12 h/12 h day/night cycle (lights on at 7 am and off at 7 pm), at 23 ± 2 °C temperature and 50 ± 5% humidity. All experiments were conducted according to the ARVO (Association for Research in Vision and Ophthalmology) Statement for the Use of Animals in Ophthalmic and Vision Research and the laboratory animal care and use guidelines of Medical College of Qingdao University approved by the ethics committee of Qingdao University (Approval number: QDU-AEC-2021124).
TM Cells Isolation and Culture
Human TM cells (HTM) of donors 1 to 3 were obtained from the Iowa Lions Eye Bank (Iowa City, Iowa, USA), and donor 4 TM cells were received from Beijing Tongren Hospital (Beijing, China). Cells at passage 5 to 8 were maintained in Biopsy medium,15 and characterized through analyzing TM biomarker expression and dexamethasone-inducible myocilin secretion prior to experimentation. Cells of donors 1 to 3 were used for mouse iPSCs differentiation, and cells of donor 4 were applied for the magnetic nanoparticle labeling.
Immortalized human TM cells, denoted as iHTM, were provided by Dr. Xuejiao Yang (Affiliated Hospital of Qingdao University, Qingdao, China) and maintained in iHTM medium consisting Dulbecco’s Modified Eagle Medium/Nutrient Mixture F-12 (DMEM/F-12) (Gibco, Grand Island, New York), 15% fetal bovine serum and 1% penicillin-streptomycin (Gibco). Similar to HTM, iHTM was characterized by investigating TM biomarker expressions and DEX-inducible myocilin expression36–39 and were used for PSC NP-labeling experiments.
Based on the previous investigation,40 mouse TM cells with the phagocytic activity were isolated through a magnetic bead-based approach, as we described earlier,15 and purified using magnetic LD columns (Miltenyi Biotec, San Diego, CA). Cells at passages 3 to 8 were maintained in the Biopsy medium, characterized following the detection of TM biomarkers and Dex-inducible myocilin expression, and used for testing the role of mouse iPSC-TM in TM cell division. The use of human and mouse TM cells was approved by the ethics committee of Qingdao University following the use guidelines of Medical College of Qingdao University.
Mouse iPSC Differentiation and Purification
Mouse iPSCs were maintained in DMEM/F12 medium (Gibco) comprised of 15% FBS (Gibco), 1% non-essential amino acids (NEAA; Gibco), 1% L-glutamine (Gibco), 0.2% Primocin (Invivogen, San Diego, CA), 0.0008% β-Mercaptoethanol (β-ME; Sigma-Aldrich), and 0.02% fresh mouse Leukemia Inhibitory Factor (mLIF; Millipore, Billerica, MA, USA). 0.1% ROCK inhibitor Y-27632 (Millipore) was added for iPSC seeding, passaging, or cryo-preserving. Conditioned medium of HTM cells of donors 1 to 3 were collected, pooled, sterilized through mixed cellulose ester membrane filters (0.2 µm pore size; Millipore) and applied for mouse iPSCs differentiation for 14 days. As we described earlier,15 differentiated cells were then purified through a magnetic bead-based approach that exploits the SSEA-1 expression of undifferentiated cells, designated as miPSC-TM, and used for PSC NP-labeling experiments and intracameral injection. The use of mouse iPSCs and its derivatives were approved by the ethics committee of Qingdao University following the use guidelines of Medical College of Qingdao University.
Synthesis of PLGA-SPIO-Cypate (PSC) NPs
As previously described,41 PSC NPs were typically fabricated by an emulsion process (water-in-oil-in-water). Reagents used for PSC NPs synthesis were listed in Table S1. PLGA-PEG-COOH (25 mg) was dissolved in dichloromethane (CH2Cl2; 2 mL). After adding SPIO (200 μL) and Cypate (2 mg), the solution was emulsified by an ultrasonic probe (VibraCell, Sonics & Material, Danbury, Conn., USA).4% (wt/vol) Polyvinyl Alcohol (PVA) was then added for the 2nd emulsion process. To extract CH2Cl2, 2% (vol/vol) isopropyl alcohol was added to the above solution. After stirring in the dark for 6 hours and centrifugation at 11,000 rpm for 7 mins, the solution was collected and stored at 4 °C. Additionally, nanoparticles encapsulating either SPIO or Cypate were prepared and used as controls.
Characterization of PSC NPs
To test the stability, PSC NPs were incubated in three different solutions, 1×PBS solution (Gibco; pH 5.07), 1×PBS solution (Gibco; pH 7.45) and HTM culture medium, for 48 hours. The size and zeta potential of PSC NPs were measured using dynamic light scattering (Malvern Instruments Ltd., Malvern, UK). The structure and morphology of PSC NPs were obtained by a Hitachi H-7600 transmission electron microscope (Hitachi Ltd., Tokyo, Japan). The encapsulation efficiency of SPIO and Cypate in PSC NPs was measured through an ultraviolet spectrophotometry method and calculated according to:


Ultraviolet-Visible-NIR absorption spectra of PSC NPs were recorded with a UV-2600 spectrophotometer (Shimadzu Corp, Kyoto, Japan). A Nikon A1 confocal laser scanning microscope (Nikon Corp, Tokyo, Japan) and F-4600 Fluorescence spectrophotometry (Hitachi) were used to measure the fluorescence parameters of nanoparticles. The magnetic parameters of the nanoparticles were measured using a Lakeshore 7404 vibrating sample magnetometer (Lakeshore, USA).
PSC NP Labeling
HTM, iHTM, and miPSC-TM cells were maintained in their culturing medium until reaching the confluence of over 70%. Then they were incubated with PSC NPs at different concentrations (12.5, 25, 35, 50, 75, 100, 150 μg/mL) for different durations (2, 4, 6, 8, 10, 12, 24 hours) at 37 °C, 5% CO2.
Hemolysis Assay
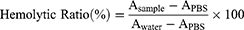
As described by Yallapu et al42 rabbit red blood cells (RBCs) were rinsed with 1×PBS (Gibco) and resuspended in 1×PBS (Gibco). After incubation with PSC NPs (12.5, 25, 50, 75, 100 μg/mL) for 10 hours, samples were centrifuged at 3000 rpm for 5 minutes. Hemoglobin released from RBCs in each sample was measured by determining the absorbance (A) at 550 nm using a microplate reader (SpectraMax® L, Molecular Devices, CA, USA). Data represent the average of three technical replicates. The hemolytic ratio was calculated as follows:
Cell Counting Kit-8 (CCK-8) Assay
iHTM, HTM, and miPSC-TM cell viability with or without the magnet (189 mT magnetic strength, 48 hours) were assessed through Cell Counting Kit-8 (CCK-8; Dojindo, Kumamoto, Japan; CK04). 5000 cells were seeded into each well of a 96-well plate (Thermo, MA, USA) and labeled with PSC NPs (12.5, 25, 50, 75, 100, 150 μg/mL) for 10 hours. CCK-8 solution (1:10) was added and incubated for 3 hours at 37 °C in the dark. The absorbance (A) at 450 nm wavelength was determined in each well by a microplate reader (SpectraMax® L, Molecular Devices, CA, USA). After subtracting the value of the blank sample, cell viability (%) was calculated by dividing A (450 nm) of samples incubated with CCK-8 by A (450 nm) of control samples (free of CCK-8 incubation). Presented data is the average of three replicates.
Prussian Blue Staining
PSC NP-labeled cells were fixed with 4% (wt/vol) paraformaldehyde (Sinopharm, Shanghai, China) for 30 minutes, incubated in iron staining solution (potassium ferrocyanide and hydrochloric acid) for 30 minutes following the manufacturer’s instructions for Prussian blue Iron Stain Kit (Solarbio, Beijing, China; G1424). It was followed by a 1× PBS (Gibco) rinse and Eosin staining. The images were captured by a microscope (Nikon, Japan).
Biological Transmission Electron Microscopy Detection
5,000,000 PSC NP-labeled cells were collected and fixed in 2% (wt/vol) glutaraldehyde (Electron Microscopy Services, Hatfield, PA) for 2 hours at 4°C. Samples were embedded in epoxy resin (Macklin), sectioned to 70–90 nm thickness, stained by uranyl acetate, and imaged by FEI Tecnai F20 transmission electron microscopy (FEI, Eindhoven, NL). 10–15 images were taken for each sample.
Flow Cytometry Analysis
PSC NP-labeled HTM and miPSC-TM were detected by fluorescence-activated single-cell sorting (FACS). The fluorescence-positive cell ratio was determined using BD FACSCalibur (Becton Dickinson). Unstained cells were used as a negative control. The Voltage and Amp Gain of the Forward scatter (FSC) was E00 and 1.00, and that of the side scatter (SSC) was 365 and 1.00. The voltage of fluorescence 2 (FL3) was 458.
Iron Content in PSC NP-Labeled Cells
As previously described,43,44 iron content was measured by a thiocyanate colorimetric assay. Cells were first quantified and lysed in a cell lysis buffer (Thermo) by an ultrasonic sonicator (Sonics & Material, Inc). After incubating with HCl (5 M; Sinopharm Chemical Reagent Co., Ltd) for 4 hours at 60°C, the detection solution consisted 0.08% K2S2O8, 8% KSCN, and 3.6% HCl were added to react with iron in cell lysate for 10 mins at room temperature. Absorbance at a wavelength of 492 nm was recorded by a microplate reader (SpectraMax® L, Molecular Devices, CA, USA). Iron content in each cell was calculated and represented as pg/cell.
Magnetic Characterization of PSC NP-Labeled Cell
200,000 miPSC-TM cells labeled with PSC NPs (35 μg/mL) for 10 hours were collected and resuspended in a 15 mL tube (ExCell Bio, Shanghai, China), a tissue culture-treated dish (ExCell Bio), or a custom-made chamber with two sterilized Poly-D-Lysine-treated slides (Servicebio, Wuhan, China) placed on the side and the bottom. A magnet was placed adjacent to the lateral treated slide to ensure cells were guided by different field strengths (389 and 143 mT measured by a Gauss meter). Cell aggregation was visualized as brown spots, and cells adhering to the slides were quantified using a hemocytometer.
Further, a Harvard syringe pump (Millis, MA, USA) was used to mimic the injection procedure. 9,000,000 PSC NP-labeled miPSC-TM cells were vertically perfused at a speed of 0.8 mL/min into a T-75 flask containing 1×PBS (Gibco). A magnet with a strength of 26 mT was placed on one side of the flask. Cell movement was imaged and visualized as a brown trace. Results were from three replicates.
The single-cell trajectory of PSC NP-labeled cells suspended in a dish was recorded by a confocal fluorescence microscope (20×; Nikon; Laser power: 10.0–15.0; PMT HV: 110–130; Acquisition times: within 30 seconds). A lateral magnet was placed on the side of the dish to ensure cells subjecting to a field strength of about 24 mT. The movements of cells without magnetic traction were recorded and used as a control. After subtracting the moving distance of PSC NP-labeled cells in control, the speed of PSC NP-labeled cell movement was calculated by dividing the mean distance of PSC NP-labeled cells by time (16 seconds). Ten cells in each group were analyzed, and the presented data was the average of three replicates.
Near-Infrared Imaging (NIR)
At in vitro level, cells were labeled with PSC NPs at a series of concentrations (12.5, 25, 50, 75, 100 μg/mL) for different periods (from 2 to 96 hours). Next, the cells were washed with 1×PBS (Gibco), fixed in 4% (wt/vol) paraformaldehyde (Sinopharm), stained with 4’,6-diamino-2-phenylindole (DAPI; Invitrogen, Carlsbad, CA), and imaged by an A1 confocal laser scanning microscope (40×; Nikon, Japan; Laser power: 10.0–15.0; PMT HV: 100–120; Acquisition times: within 2 minutes). Fluorescence intensity was quantified by Image J software (NIH image system).
In vivo, mice receiving PSC NP-labeled miPSC-TM cells were anesthetized with 5% chloral hydrate (0.2 mL/20 g). The eyes of living mice were held by a custom-made device (Figure S5) to ensure the eyes could be exposed to the air. The corneal margin, the white annular line around the eye, was used as a landmark to identify the TM. The eyes were then scanned by an A1 confocal laser scanning microscope (4×; Nikon, Japan; Laser power: 15.0–20.0; PMT HV: 110–138; Acquisition times: within 4 minutes) in a Z-stacking pattern with a depth of 200 μm (Figure S5). Images were stacked and analyzed by ImageJ software (NIH image system). The total fluorescence intensity in each 30° sector of the TM region was quantified and shown in a polar histogram.
Magnetic Resonance Imaging (MRI)
In vitro, PSC NP-labeled cells were collected and resuspended in 4% (wt/vol) Gelatin (Macklin). After solidification at 4°C, MRI was carried out by a Bruker BioSpec 94/20USR 9.4 T small-animal scanner (Bruker Biospin MRI GmbH) with a head coil (receive-only surface coil) and a magnetic field of 9.4 T. In T2-weighted imaging, repetition time (TR) was 3000 ms, echo time (TE) was 36 ms, and flip angle was 90°. Images were taken with a thickness of 1 mm and a field of view (FOV) of 63×36 mm. The signal intensity (SI) of the region of interest was measured. In favor of Paravision 6.0.1 software (Bruker, USA),45 the transverse relaxation rate (1/T2) was calculated. Three technical repeats were performed for each sample.
For in vivo experiments, mice receiving PSC NP-labeled miPSC-TM cells steered by a magnet were sacrificed. Eyes were enucleated, fixed in 4% paraformaldehyde, and scanned by 7.0 T horizontal bore small animal MRI scanner (Bruker Biospin, MA, USA). Two-dimensional (2D) fast spin-echo sequence images in axial, sagittal, and coronal positions were acquired (TR/TE = 3000/42 ms, FA = 180, 12 contiguous slices, Acquisition times: 10–15 minutes/eye). The grayscale value in the TM region was analyzed by ImageJ (NIH image system).
Immunocytochemical (IHC) Staining
Samples including fixed cells and cryosectioned tissues were rinsed with 1×PBS (Gibco), treated with 0.5% Triton X-100 (Thermo), and incubated in Superblock (Thermo) for 1 hour. Samples were incubated with the diluted primary antibodies (1:200) at 4°C overnight followed by the incubation of the corresponding secondary antibodies (1:200) at room temperature for 1 hour. Samples were mounted using ProLong Gold Antifade reagent with 4’,6-diamino-2-phenylindole (DAPI; Invitrogen) and imaged by confocal microscopy (40×; Nikon; Laser power: 15.0–20.0; PMT HV: 110–138; Acquisition times: within 6 minutes).
The primary antibodies include rabbit polyclonal anti-matrix metalloproteinase-3 (MMP3), rabbit polyclonal anti-tissue inhibitor of metalloproteinases (TIMP3), and rabbit polyclonal/mouse monoclonal anti-myocilin (MYOC). Details were listed in Table 1. The secondary antibody was Alexa Fluor® 568 goat anti-rabbit immunoglobulin G (IgG; Invitrogen).
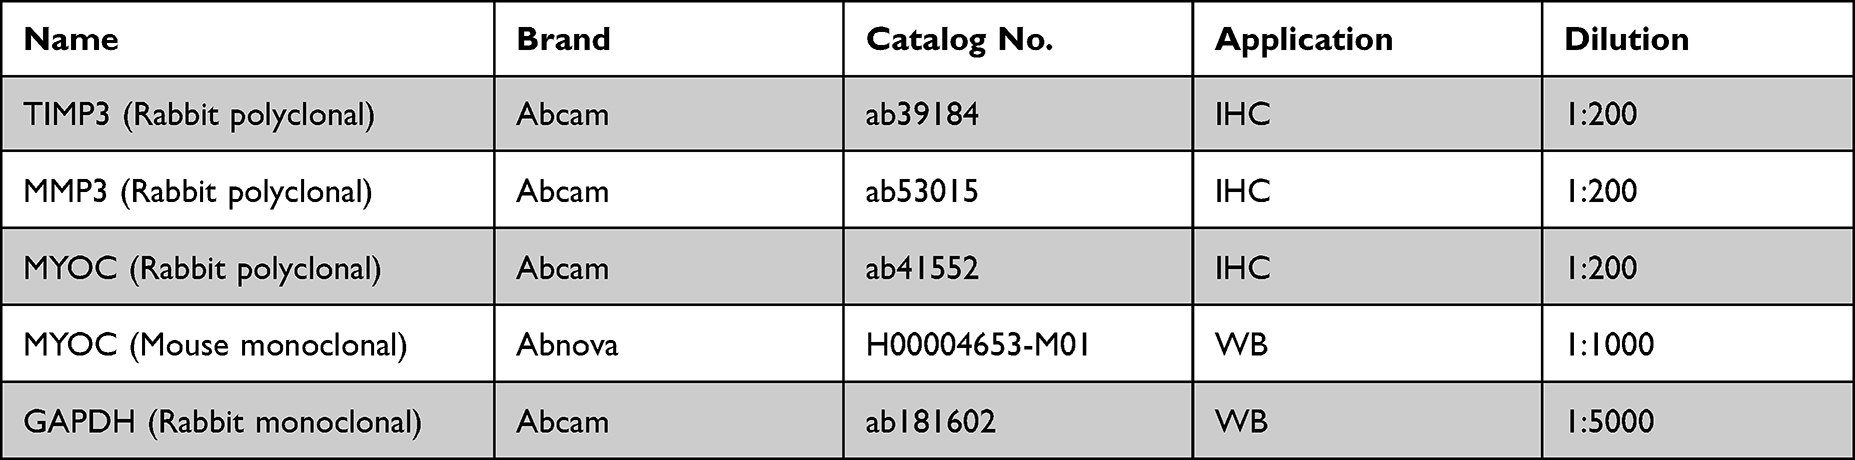 |
Table 1 Antibodies for IHC and WB |
Western Blotting (WB)
Proteins were extracted with M-PER lysis buffer (Thermo) and quantified with Protein DC kit (Bio-Rad Laboratories, Inc.). 30 μg proteins were added into NuPAGE-LDS sample buffer (Invitrogen), boiled for 5 minutes, and separated on a 10% sodium dodecyl sulfate (SDS)-acrylamide gel by electrophoresis. Proteins were transferred to a polyvinyl difluoride membrane (PVDF; Millipore) by Mini Trans-Blot Cell (Bio-Rad) at 150 mA current for 2 hours. After incubation with a blocking buffer (Tris-buffered Saline-Tween-20 (TBST) containing 5% non-fat milk powder) at room temperature for 1.5 hours, mouse monoclonal myocilin antibody (1:1000, catalog No. H00004653-M01; Abnova, Taipei City, Taiwan) or rabbit polyclonal GAPDH (1:10,000; Abcam, ab181602) overnight at 4 °C, membranes were rinsed with TBST three times and incubated with the secondary antibody conjugated to horseradish peroxidase (HRP; 1:10,000, catalog No. ab6721; Abcam, Cambridge, UK) at room temperature for 1 hour. Immunoreactive signals were visualized using the SuperSignal West Femto Substrate (Thermo) by chemo doc XRSplus imaging system (Bio-Rad). Band intensity of MYOC was analyzed using Image Lab software (Bio-Rad) and normalized to GAPDH. Experiments were carried out in triplicate.
Dexamethasone (DEX) Treatment
Cells were seeded on Poly-D-Lysine-coated coverslips and treated with fresh dexamethasone (Dex; 100 nM; Sigma-Aldrich, D4902) for 10 (for Dex-inducible MYOC expression detection) or 12 days (for Dex-inducible cross-linked actin networks formation assay). 0.1% ethanol (Eth) was used as vehicle control. Cells from three technical repeats were collected for different purposes.
Cross-Linked Actin Networks (CLANs) Assay
Cells were fixed with 4% paraformaldehyde (Sinopharm) and treated following IHC staining protocol. After blocking with Superblock (Thermo), cells were stained with Phalloidin-iFluor 488 (1:1000, Thermo, A12379) at room temperature for 1 hour and mounted using Anti-fade Prolong Gold with 4′,6-diamino-2-phenylindole (DAPI; Invitrogen). CLANs were imaged by confocal microscopy (Nikon) and identified as an actin geodesic dome structure with at least three hubs and spokes.
Co-Culture Experiment
As previously described,15 3000 PSC NP-labeled miPSC-TM were seeded on a borosilicate glass-bottom cell culture dish (NEST, Wuxi, China) for 12 hours and co-cultured with 3000 mTM cells pre-labeled with CellTracker Red CMTPX (5 μM for 30 mins; Invitrogen, C34552) for 48 hours. Cells were fixed in 4% paraformaldehyde (Sinopharm) for 20 minutes at room temperature, stained with DAPI (Santa Cruz, Dallas, TX), and imaged at 4× magnification by confocal microscopy (Nikon A1MP multiphoton confocal microscope, Tokyo, Japan). mTM cells visualized with red fluorescence were counted using ImageJ (NIH image system) and quantified. mTM cells without co-culture or mTM co-cultured with unlabeled miPSC-TM were used as controls. Data from three technical repeats were statistically analyzed.
Intracameral Injection
Mice were subjected to deep anesthesia using 5% chloral hydrate (0.2 mL/20 g). Ad5-MYOCY437H-EGFP (8×10⁷ PFU; 2.5 μL) gifted by Beijing Tongren Hospital (Beijing, China) was intracamerally injected. For cell transplantation, 75,000 PSC NP-labeled miPSC-TM cells were resuspended in 3 μL sterilized saline (Hamilton Co., Reno, Nevada) and injected into the anterior chamber of 2-mon-old C57BL/6J using a Hamilton syringe connected to a sterile needle (30-gauge, 1/2-inch length; Becton Dickenson). Mice were kept on a heated blanket at 37 °C until they recovered from the surgery. Eyes of 2-mon-old C57BL/6J without any injection were used as the control.
In vivo Magnetic Traction of PSC NP-Labeled Cells
As previously described by Snider et al, magnetic mesenchymal stem cells can be effectively steered towards the TM in a magnetic field.22 According to this protocol, a bar magnet (lateral magnetic field strength of approximately 100 mT) or a ring magnet with the strength of roughly 30 or 60 mT was placed adjacent to the eye for 15 or 45 mins. The magnetic field strength was calculated through Gauss meter (Senjie, Zhejiang, China), and the magnet was oriented parallel to the circumferential TM region.
Tissue Preparation and Histological Analysis
Enucleated mouse eyes were fixed immediately after magnetic traction through perfusing 4% (wt/vol) paraformaldehyde (Thermo) using a 30-gauge syringe needle (Becton Dickenson) for 2 hours at room temperature. After infiltration with 13.3%, 15.0%, and 16.7% (wt/vol) of sucrose solutions, eyes were embedded in Optimal Cutting Temperature compound (OCT; Sakura, Tokyo, Japan) and sectioned at a 10 µm thickness on a Leica CM1950 cryostat (Leica, Nussloch, Germany). As described in IHC staining, sections were stained with DAPI (Santa Cruz, Dallas, TX) and imaged at 20× magnification by confocal microscopy (Nikon) to track the PLGA-SPIO-Cypate NP-labeled miPSC-TM cells (red). Twelve cryosections from each eye and three eyes from each sample were collected. Cells (blue spots in the sections) located in the TM (the area between the pigmented ciliary body and Schlemm’s canal), posterior segment, cornea, and iris were counted and analyzed.
IOP Measurement
Mice were anesthetized with 2.5% isoflurane and 80% (vol/vol) oxygen (RWD Life Science Co., Ltd, Shenzhen, China) for 3 minutes. IOP was measured by rebound tonometry (TonoLab, Helsinki, Finland) as previously described.15 Measurements were taken between 7:00 and 10:00 pm, and data represent the average of three measurements.
Statistical Analysis
The Shapiro–Wilk test was used to test for normality. One-way ANOVA was performed for statistical analysis of in vitro and in vivo fluorescence and magnetic parameters of PLGA-SPIO-Cypate NP-labeled cells, the magnetic parameters, and the cell counts. A two-tailed t-test was applied to analyze characterizations of PSC NP-labeled cells in vitro. Tests were performed in OriginPro 2018 software (OriginLab Corporation, Northampton, MA, USA), and data were expressed as the mean ± SD. p values < 0.05 were considered to be statistically significant.
Results and Discussion
Design of PSC NPs
While multiple studies have reported the passive cell delivery to the TM as a potential therapeutic approach for glaucoma, the labeling method using magnetic nanoparticles developed by Snider et al is promising to enhance delivery efficiency and temporal cell tracking in an ex vivo model. However, clinical translation of stem cell-based glaucoma treatment has been hindered by the lack of in vivo data. To facilitate the cell delivery accuracy and monitor the cells in vivo for an extended time, we first designed magnetic fluorescent PLGA nanoparticles. The nano-platform consists of three elements (Figure 1): PLGA polymer, SPIO nanoparticles, and near-infrared fluorescent imaging reagent, cypate. PLGA polymer, as a carrier medium, can be used for the transfer of imaging agents due to its good biodegradability, extended cycle time, and simple surface modification.46 SPIO nanoparticles not only have magnetic properties as magnetic agents, such as magnetic targeting drugs, in the magnetic field but also can be used as an imaging agent for magnetic resonance imaging.47,48 Its excellent biocompatibility and lower toxicity, meeting the needs for application in vivo, have been approved.49,50 Cypate is an organic near-infrared imaging reagent with a high absorption coefficient and fluorescence quantum yield.51,52 Compared to the conventional trackers (400–700 nm), the implementation of NIR (cypate: 781 nm) allowed deep tissue imaging at a higher spatial resolution, which is crucial for monitoring accuracy. Overall, this solution integrates multiple biocompatible elements into a single nano-platform named PLGA-SPIO-Cypate NPs (PSC NPs) and aims to facilitate stem cell-based therapy controllability and versatility.
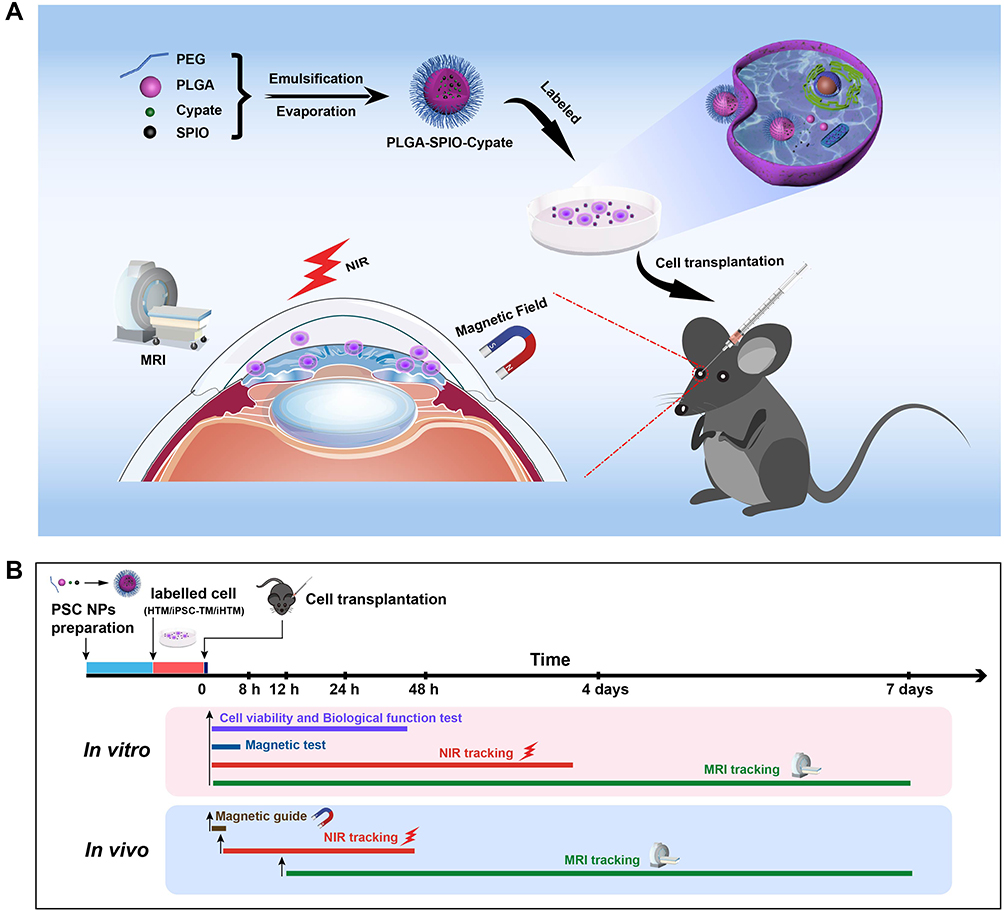 |
Figure 1 Schematic illustration of PLGA-SPIO-Cypate (PSC) NPs and the experimental design. (A). This design aims to position the injected cells (Purple) to the TM region through the magnetic field and track the transplanted cells by a NIR/MRI dual-model imaging. (B). Schematic diagram of timelines of NP synthesis, in vitro tests, and in vivo tracking. |
Synthesis of PSC NPs
We subsequently prepared and characterized PSC NPs through dynamic light scattering (DLS) and transmission electron microscope (TEM). As shown in Figure 2E, PSC NPs have a uniform particle size distribution with an average diameter of about 243 ± 1.3 nm, the optimized nanoparticle size reported by Snider et al22 without an agglomeration phenomenon after 48 hours’ incubation (Figure S1), and a stable surface charge of −25.3 ± 3.4 mV. TEM images showed that PSC NPs had a near-spherical structure with a smooth surface (Figure 2A–D). Compared to the PLGA capsule (Figure 2A) or SPIO alone (Figure 2B), PSC NPs were successfully incorporated with SPIO nanoparticles (Figure 2C and D). This observation was also evident in a magnified view (Figure 2D). UV-Vis absorption spectra results demonstrated that PSC NPs had a similar peak absorbance as the Cypate and PLGA-Cypate at about 781 nm (Figure 2F). PLGA-Cypate and PSC NPs displayed the same color in water under ambient light (Figure 2F insert image). The emission wavelength of PSC NPs was determined with a peak wavelength of about 815 nm using a fluorospectrophotometer. This peak emission was the same as Cypate and PLGA-Cypate, indicating that it is suitable for near-infrared fluorescence imaging (Figure 2G). In addition, the magnetic properties of PSC NPs were determined by vibration sample magnetometers. The hysteresis loop of PSC NPs, similar to the hysteresis loop of SPIO, indicating that PSC NPs were superparamagnetic (Figure 2H). The nanoparticles traveled through the media when exposed to a magnet (Figure 2H insert image).
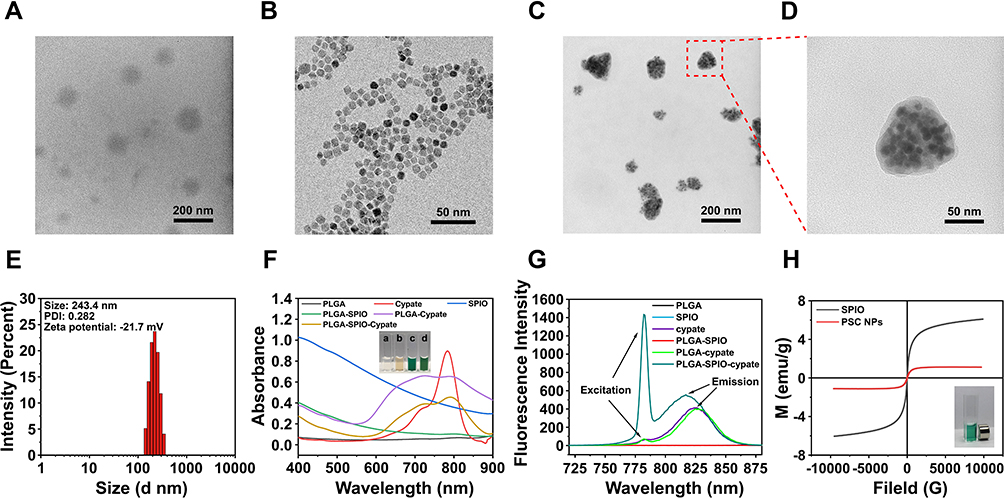 |
Figure 2 Characterizations of PSC NPs. (A–D). Transmission electron microscope (TEM) images of PLGA nanocarriers (A), SPIO (B), and PSC NPs (C–D) confirm that Fe3O4 nanoparticles, black spots, are embedded in the PLGA spherical shells. (E). The region in the red frame shows a magnified view of a single NP Size distribution of PSC NPs with an average diameter of 243.0 ± 1.3 nm. (F). Ultraviolet-Visible-NIR absorption spectra of the PLGA nanocarrier, Cypate, SPIO, PLGA-SPIO, PLGA-Cypate, and PLGA-SPIO-Cypate NPs. Like the absorption wavelength of Cypate and PLGA-Cypate, PSC NPs are determined with a peak wavelength of about 781 nm. Insert image shows different nanoparticles in water under ambient light (a: PLGA NPs, b: PLGA-SPIO NPs, c: PLGA-Cypate NPs, d: PLGA-SPIO-Cypate NPs). (G). Fluorescence spectra of PLGA, SPIO, cypate, PLGA-SPIO, PLGA-cypate, and PLGA-SPIO-Cypate NPs (excitation peak: 781nm; emission peak: 815 nm). (H). Magnetic hysteresis curves of PSC NPs and SPIO determined by vibrating sample magnetometer. Insert image shows the accumulation of PLGA-SPIO-Cypate NPs adjacent to the magnet. |
Endocytosis of PSC NPs
Cells used in this study include iHTM cells, HTM cells, and TM-like cells derived from mouse induced pluripotent stem cells (miPSC-TM) generated according to the previously described protocol.53 Through the endocytic activity for 10 hours, whether iHTM, HTM, and miPSC-TM could be labeled with PSC NPs was inspected through analyzing SPIO contents in cells by Prussian blue staining and biological transmission electron microscopy (TEM; Figure 3 and S2). Prussian blue staining analysis revealed that PSC NPs could be efficiently endocytosed by miPSC-TM with a rate of about 100% through counting the blue cells in five areas of each sample (Figure 3A), and the darkening was significantly associated with the PSC NPs concentration (Figure S2). TEM observations indicated that PSC NPs could be engulfed by miPSC-TM through a vesicular-based transport and stored in the cytoplasm, while the nucleus and other organelles were free of nanoparticle labeling (Figure 3B and C).
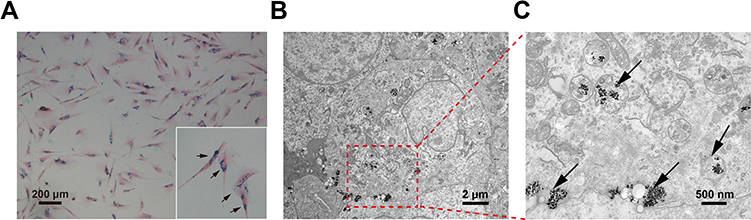 |
Figure 3 Endocytosis of PSC NPs by miPSC-TM. (A) Prussian blue staining of miPSC-TM cells. The cytoplasm of miPSC-TM is stained with Eosin (pink). Ferric ferricyanide formed after Prussian blue staining is shown in blue. (B) Biological transmission electron microscopy of PSC NP-labeled miPSC-TM cells. The region in the red frame is magnified in (C). In the high-magnification image, each arrow points at a single or cluster of PSC NPs. |
Cytotoxicity of PSC NPs
While Prussian blue staining showed an efficient uptake of PSC NPs by cells, we were still concerned about the undesirable effect of NPs, such as cytotoxicity. As PLGA and cypate have been shown to have excellent biocompatibility,54,55 SPIO is the only suspect of the undesirable effect. For instance, excessive SPIO particles may lead to an imbalance of intracellular iron concentration and osmotic pressure homeostasis, which leads to cellular damage. Long-term use of SPIOs can also cause an accumulation of iron in the metabolic organs.56–58 Additionally, oxidative stress induced by nanoparticle exposure plays a crucial role in regulating cell death in a dose- and time-dependent manner.59 We, therefore, performed CCK-8 and hemolysis assays to evaluate the biocompatibility of PSC NPs. CCK-8 assay revealed that incubation with PSC NPs ranging from 12.5–150 μg/mL could not influence cell viability (Figure 4A), and endocytosis of PSC NPs for 48 hours also could not lead to any change in cell viability (Figure S3). Hemolysis assay showed that hemolysis rates of PSC NPs at concentrations of 12.5–75 μg/mL were less than 5% (Figure 4B), indicating that it is safe for clinical usage.60–62 Moreover, NIR tracking of PSC NP-labeled iHTM indicated that PSC NPs were distributed in the cytoplasm until 48 hours of incubation (Figure S4), excluding the potential damage of NP exposure to the nucleus.
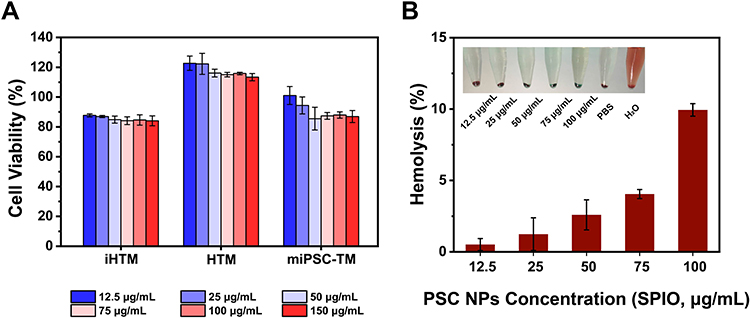 |
Figure 4 Good biocompatibility of PSC NPs. (A). CCK-8 assay of PSC NP (ranging from 12.5 to 150 μg/mL)-labeled iHTM, HTM, and miPSC-TM revealing a negligible effect of NPs on cell viability. (B). Images of red blood cells treated with PSC NPs at a series of concentrations (0, 12.5, 25, 50, 75, and 100 μg/mL). H2O and 1×PBS are used as positive and negative controls, respectively. PSC NPs at concentrations less than 75 μg/mL lead to a hemolysis rate of less than 5%, which is biocompatible and safe for practice.60–62 Data are expressed as the mean ± SD. |
NIR Tracking of PSC NP-Labeled Cells
Endocytosis efficiency was further analyzed with near-infrared imaging. iHTM was incubated with PSC NPs (35 μg/mL) for different durations (2, 4, 6, 8, 10, 12, and 24 hours) and fluorescent intensity was determined to peak at 10 hours (Figure 5A). A single-time incubation (10 hours) could persist the fluorescence signal in iHTM for 72 hours (Figure 5B). In addition to iHTM, labeling with PSC NPs (35 μg/mL) for 10 hours could be sufficient to aggregate PSC NPs in the cytoplasm of HTM and miPSC-TM cells (Figure 5C). Moreover, PSC NP-labeled iHTM cells were centrifuged, and luminous efficiency was detected using an IVIS Spectrum. As shown in Figure 5D and E, average radiant efficiency in iHTM cells increased proportionally to the concentration of PSC NPs (12.5 μg/mL: 1.3 a.u.; 25 μg/mL: 2.5 a.u.; 50 μg/mL: 2.7 a.u.; 75μg/mL: 2.8 a.u.; 100 μg/mL: 2.7 a.u.; mean value, n=3), and miPSC-TM had the highest luminous efficiency (p < 0.01, n=3; Figure 5E). Flow cytometric analysis of the fluorescence intensity further demonstrated that the labeling efficiencies in miPSC-TM and HTM were 97.6% and 99.1%, respectively (Figure 5F and G). As such, PSC NP-labeling (35 μg/mL, 10 hours incubation) is chosen as the optimized condition. We can potentially monitor the cell survival and behavior using NIR for 72 hours following in vivo transplantation.
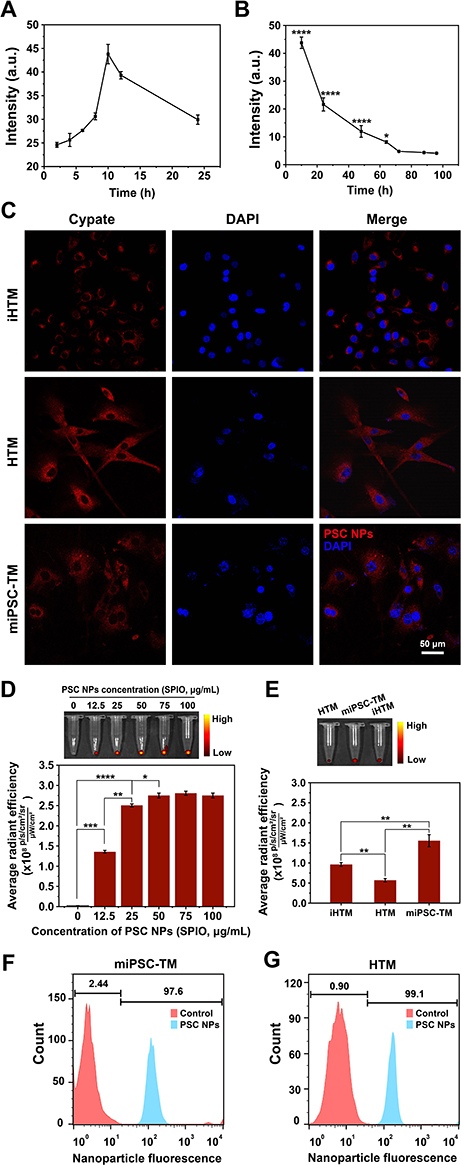 |
Figure 5 In vitro near-infrared imaging. (A). Quantification assay showing fluorescence intensities of PSC NP-labeled iHTM cells after labeling for different times. Signal peaks at 10 hours of incubation, which is the best for further in vivo tracking purposes. (B). Fluorescence signals in PSC NP-labeled iHTM cells diminish over time and vanish after 72 hours. 64 h vs 72 h: P < 0.05, 72 h vs 88 h: P > 0.05 by one-way ANOVA. (C). A confocal image of PSC NPs-labeled iHTM, HTM, and miPSC-TM. Nanoparticles accumulated in the cytoplasm are shown in red. Nuclei are labeled with DAPI (blue). (D). Upper panel: A representative image of the fluorescence intensities of iHTM pellets (500,000 cell number) labeled with PSC NPs at a series of concentrations (12.5, 25, 50, 75, 100 μg/mL). Unlabeled miPSC-TM is used as a control. Lower panel: The radiant efficiency of miPSC-TM labeled with PSC NPs is calculated with a significant increase as PSC NP concentration increased (12.5, 25, 50, 75, 100 μg/mL). *P < 0.05, **P < 0.01, ***P < 0.001, ****P < 0.0001 by one-way ANOVA. (E). Radiant efficiencies of iHTM, HTM, and miPSC-TM labeled with PSC NPs (35 μg/mL). Typical results from n=3 technical repeats are shown. **P < 0.01 by one-way ANOVA. Flow cytometric analysis of PSC NP-labeled miPSC-TM (F) and HTM (G). Compared to the fluorescence intensity of unlabeled cells, PSC NPs can be effectively endocytosed by 97.6% miPSC-TM and 99.1% HTM. Data are expressed as the mean ± SD. |
Magnetic Properties of PSC NP-Labeled Cells
We next tested the magnetic properties of PSC NPs (35 μg/mL, 10 hours incubation)-labeled miPSC-TM cells. We first determined that the magnet (189 mT magnetic strength, 48 hours) does not influence cell viability (Figure S3). Then, a simple design to attract the floating cells to a magnet positioned close to the tube (389 mT) was performed (Figure 6A). To quantify the results, we prototyped a chamber with two slides on either the lateral or bottom side with a magnet positioned on the side (Figure 6B and C). As shown in Figure 6D, magnetic attraction (24 mT) can significantly increase the number of cells adhering on the lateral slide (after vs before: 20.7% vs 5.6% of total seeded cells, p = 0.015, n = 3). In addition, cells infused at a rate of 0.8 mL/min were effectively steered towards the magnet (143 mT at a distance of 30 mm), while with gravity alone the cells experienced a free fall (Figure 6E and F). We also analyzed the single-cell steering trajectory using a confocal microscope (Figure 6G and H). When exposed to a magnet the cells did not show the Brownian motion observed in control and traveled toward the magnet at a speed of 0.66 μm/s (p < 0.01).
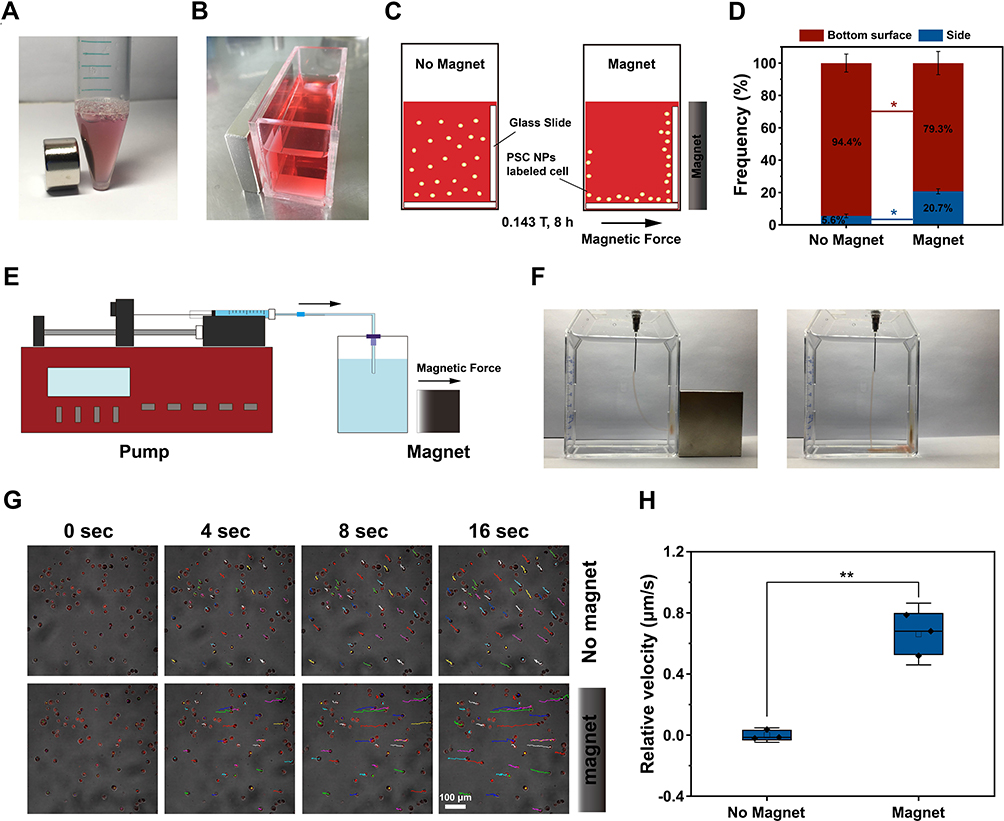 |
Figure 6 Movement of PSC NP-labeled miPSC-TM cells in the magnetic fields. (A). PSC NP-labeled miPSC-TM cells aggregate on the magnet side of a 15 mL tube. (B). Magnetic cell steering is quantified using a custom-made cell culture chamber loaded with floating miPSC-TM cells. (C). Schematic illustration of the experimental conditions, including control (no magnet) and in the presence of a magnet with 24 mT magnetic strength positioned on the lateral side of the chamber. (D). After 8 hours slides are analyzed using a light microscopy (Nikon) to quantify the adhering cells. The number of cells adhering to the lateral slide is significantly increased. N=3, *P < 0.05 by two-tailed t-test. (E). Schematic diagram of the apparatus that injects PSC NP-labeled miPSC-TM cells at an infusion rate of 0.8 mL/min. (F). Comparative images showing the trajectories of 9 million magnetically steered (left; 143 mT at a distance of 30 mm) versus free falling (right) PSC NP-labeled miPSC-TM cells. The magnetic force deflects the cells from a straight downward path experienced under gravitational force alone. (G). The confocal photographs of the trajectory of individual PSC NP-labeled miPSC-TM in a magnetic field (26 mT at a distance of 12 mm) at 0, 4, 8, 16 seconds. The motion of PSC NP-labeled miPSC-TM cells is recorded as the control. Compared to the Brownian motion of cells in control, the lateral magnet significantly attracts the cells. PSC NP-labeled miPSC-TM is shown in red fluorescence. N=3. (H). After subtracting the cell moving distance in control, the speed of single-cell movement in the magnetic field is calculated using the moving distance of ten PSC NP-labeled miPSC-TM cells after 16 seconds of exposure. Typical results from n=3 technical repeats are shown. **P < 0.01 by two-tailed t-test. Data are expressed as the mean ± SD. |
In vitro Tracking by MRI
We exploited superparamagnetic and T2 properties of PSC NPs to track cells in vitro by MRI and optimized the monitoring conditions. The transverse relaxation rate (R2) signal, referring to as 1/T2 (s−1) in Figure 7, enhanced linearly with PSC NPs concentration (Figure 7A–C). At NIR imaging level, PSC NP-labeled cells could be monitored for up to 48 hours (Figure 5). This temporal shortcoming is compensated by an extended tracking interval of 7 days using MRI imaging in vitro (Figure 7D). R2 signal in PSC NP-labeled iHTM was strengthened with the increased cellularity. Moreover, all cell types used in this study (iHTM, HTM and miPSC-TM) showed potential for MRI tracking (Figure 7F). Herein, the optimized condition for MRI tracking was determined (35 μg/mL, 10 hours of incubation), same as NIR tracking.
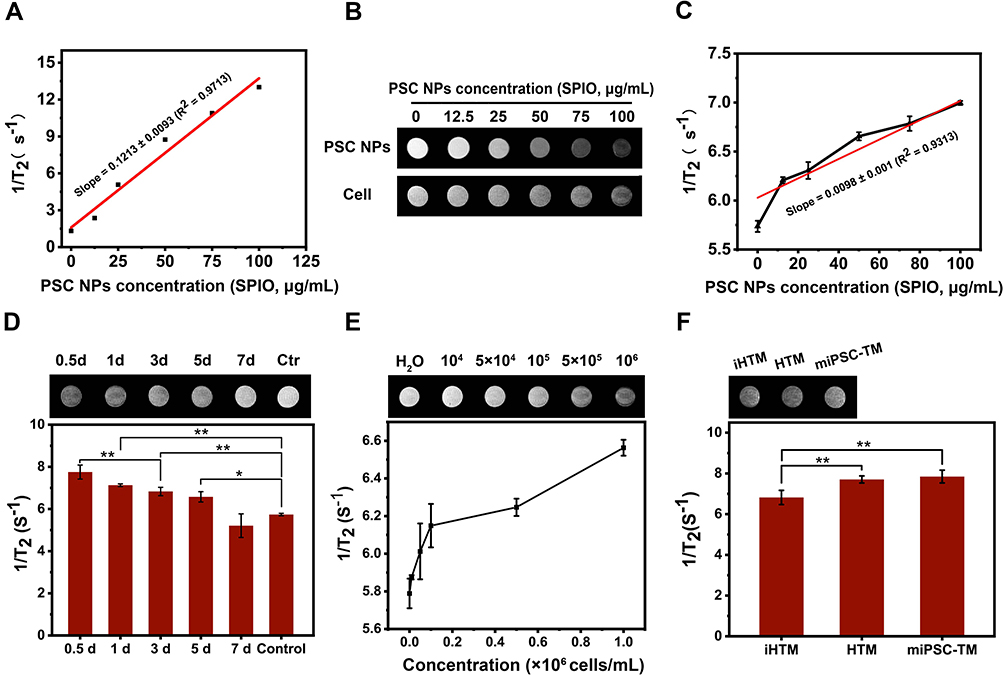 |
Figure 7 In vitro tracking by MRI. (A). The codependent relationship of R2 signal and the concentration of PSC NPs. (B). T2-weighted scans show iron-mediated darkening correlated to the increased PSC NP concentration. Upper panel: PSC NPs as the sample; Lower panel: PSC NP-labeled iHTM cells as the sample. (C). Relationship of R2 signal and PSC NP (12.5, 25, 50, 75, 100 μg/mL)-labeled iHTM. (D). Change of R2 signals in PSC NP-labeled iHTM cells over time. Upper panel: T2-weighted scans; Lower panel: Quantification of R2 signals. *P < 0.05, **P < 0.01 by one-way ANOVA. (E). Change of R2 signals in iHTM cells at different cell concentrations (F). R2 signals in PSC NP-labeled iHTM, HTM and miPSC-TM cells. Typical results from n = 3 technical repeats are shown. Data are expressed as the mean ± SD. |
Cell Fate of miPSC-TM After PSC NP-Labeling
To ensure biocompatibility and therapeutic fidelity, we do not desire to change the cell feature and fate by PSC NPs (35 μg/mL) labeling. Immunohistochemical staining showed a robust expression of matrix metallopeptidase 3 (MMP3), metallopeptidase inhibitor 3 (TIMP3), and myocilin (MYOC) in iHTM, HTM, and miPSC-TM cells (Figure 8A) as was shown in previous studies.53 Western blot analysis indicated that Dexamethasone-inducible (Dex; 100 nM) MYOC expression, a distinct feature of the TM cells, can be observed in all cell types after PSC NPs labeling (before vs after: iHTM: 242% vs 157%, p = 0.22; HTM: 184% vs 195%, p = 0.84; miPSC-TM: 290% vs 192%, p = 0.34; n = 3; Figure 8B), which was further confirmed by IHC (Figure 8C). Another well-acknowledged feature of TM cells is DEX-inducible cross-linked actin networks (CLANs) formation. Compared to the vehicle control (0.1% ethanol), CLANs could also be formed in PSC NP-labeled iHTM, HTM, and miPSC-TM (Figure 8D). In addition, we have previously shown that iPSC-derived TM cells can stimulate endogenous TM cell division15,16 in a co-culture. To evaluate this, we co-cultured PSC NP-labeled miPSC-TM and mTM pre-stained with CellTracker Red CMTPX. By comparing the count of CMTPX-positive cells in the co-culture, we found that PSC NP-labeled miPSC-TM cells preserved their ability to stimulate proliferation in mTM cells (p < 0.01; Figure 8F). These findings suggest that a single-time PSC NPs incubation is sufficient to label cells and does not trigger any changes in either cell viability or function, which has the potential for in vivo monitoring of the transplanted cells.
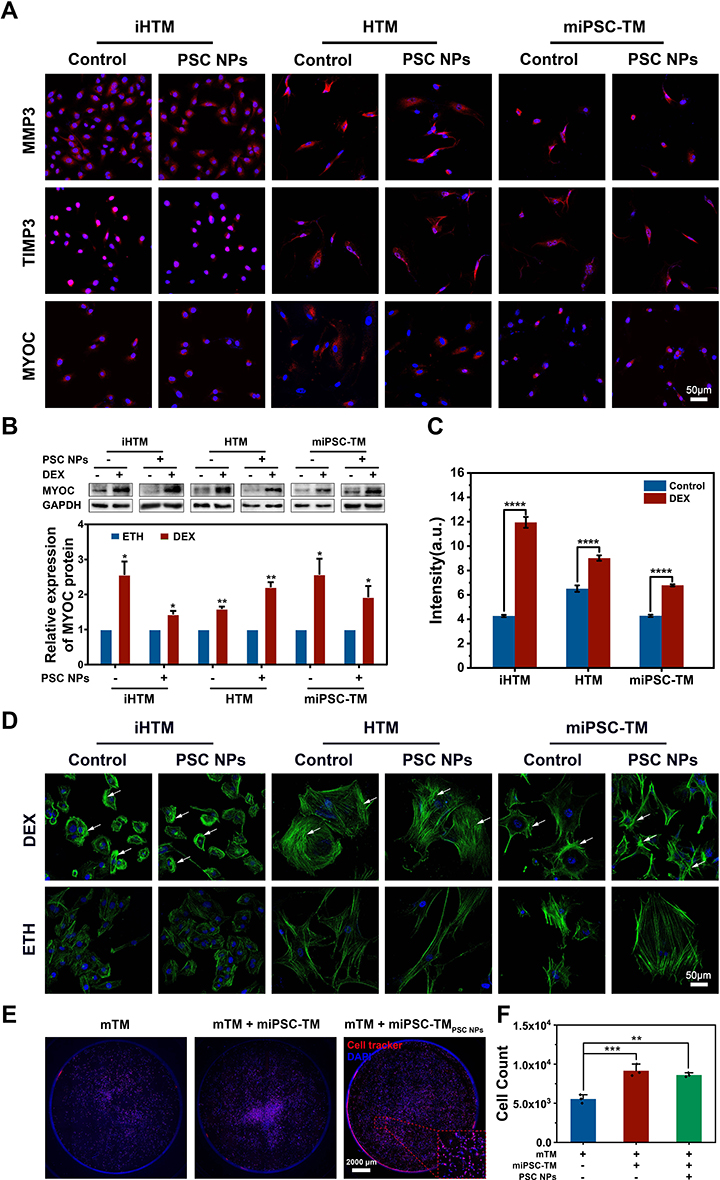 |
Figure 8 Cell fate of iHTM, HTM, and miPSC-TM after PSC NP-labeling. (A). Immunohistochemical staining of MMP3, TIMP3, and MYOC (all in red) in label-free or PSC NP-labeled iHTM, HTM, and miPSC-TM. Nuclei are labeled with DAPI (blue). (B). Upper panel: Western blot analysis of MYOC (top) or GAPDH (bottom) in normal or PSC NP-labeled iHTM, HTM, and miPSC-TM. Lower panel: Quantification of band intensities using Image Lab software (Bio-Rad). Controls of iHTM, HTM, and miPSC-TM are normalized to be 1. *P < 0.05. **P < 0.01 by two-tailed t-test. (C) Fluorescence intensity of MYOC from IHC images. ****P < 0.0001 by two-tailed t-test. (D). Representative IHC staining of F-actin (green) and nuclei (blue) shows the CLANs with hubs and spokes, pointed by the white arrows. (E). The role of PSC NP-labeled miPSC-TM in stimulating mTM cell division. Representative images of mTM pre-labeled with CellTracker Red CMTPX of control and co-cultured groups (48 hours). (F). Quantification of mTM cellularity in above conditions. Normal or PSC NP-labeled miPSC-TM cells significantly stimulate mTM division after 48 hours in co-culture. **P < 0.01. ***P < 0.001 by one-way ANOVA analysis. Typical results from n=3 technical repeats are shown. Data are expressed as the mean ± SD. |
In vivo Tracking of PSC NP-Labeled miPSC-TM by NIR
One goal of this study was to increase the accuracy of cell transplantation to the TM. 75,000 miPSC-TM labeled with PSC NPs (35 μg/mL) for 10 hours were collected and intracamerally injected into the eyes of 2-month-old C57BL/6J. After steering by a lateral or ring magnet, eyes were monitored in vivo by a confocal microscope. Eyes without injection or eyes receiving miPSC-TM without the magnetic guide were used as two controls. Given the TM locating in the root region of the anterior chamber angle can be distinguished as a white annular line around the eye (Figure S5), we scanned this white annular region using a confocal microscope by Z-stacking at a depth of 200 μm and analyzed the fluorescence in the stacked images. As shown in Figure 9, no fluorescence was detected in the TM region of eyes without injections, while few miPSC-TM could be passively steered towards the TM without the magnetic guide. Compared to these controls, the use of either a lateral or ring magnet can successfully direct the miPSC-TM to the TM (Figure 9C and D). The circumference of the TM was binned into 30° sections, and the intensity was shown in polar histograms to illustrate the uniformity of cell delivery to the TM (Figure 9E–H). Note that non-uniform distribution of PSC NP-labeled miPSC-TM with an apparent aggregation adjacent to the lateral magnet (Figure 9G). In contrast, cells distribute uniformly in the guide of the ring magnet (Figure 9H). The mean fluorescence intensity in these groups (n=3; Figure 9I) further demonstrated that the ring magnet significantly accumulated more miPSC-TM in the TM region compared to the no magnet control (2.7×10⁶ a.u. vs 0.7×10⁴ a.u., p < 0.05, 3.9-fold increase). One advantage is that the more efficient delivery can potentially increase the incidence rate of cell-to-cell contact between the transplanted cells and the endogenous TM cells,15,16 which might restore the function of the damaged TM more effectively. Moreover, the tracer-based approach63 has been applied to monitor the dynamic segmental outflow. Thus, PSC NP-labeling combined with tracer may steer miPSC-TM grafting towards either low flow or high flow regions,21 which provides insight into the TM restoration mechanism of stem cell-based therapy.
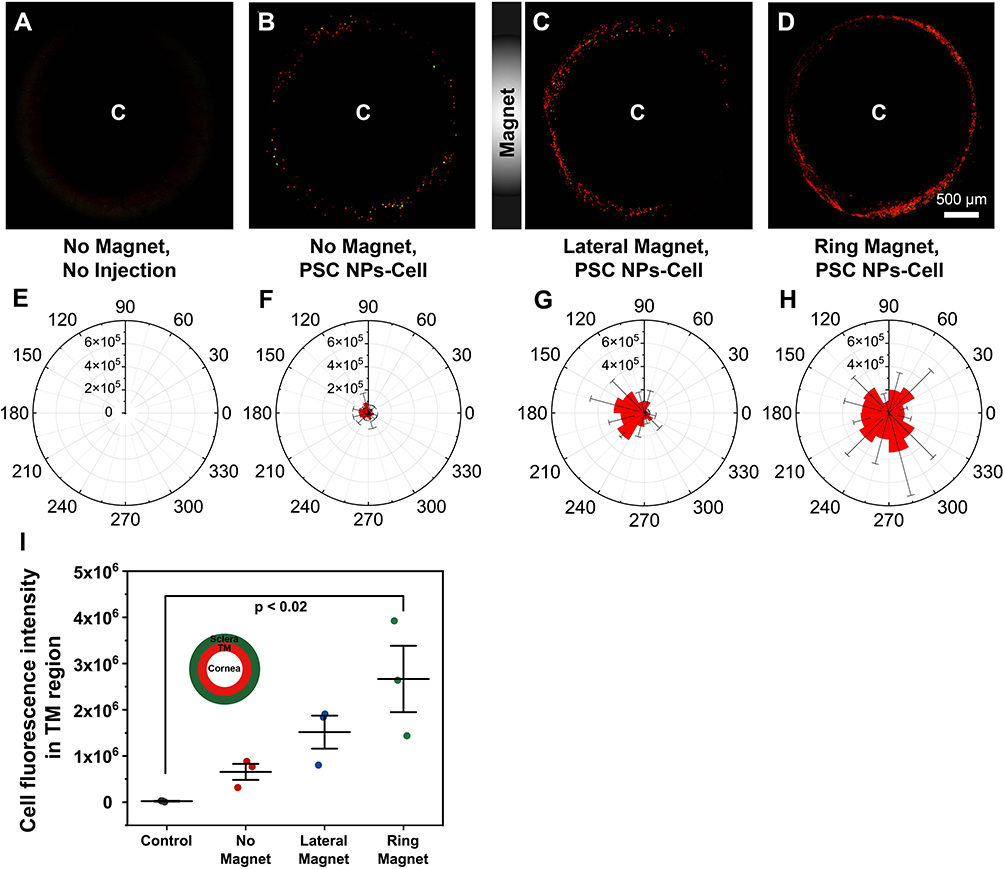 |
Figure 9 Delivery of PSC NP-labeled miPSC-TM towards the TM in living mice using either lateral or ring magnets. (A–D). Representative en face micrographs of the TM region in living mice under four conditions: no magnet without injections; no magnet with PSC NP-labeled miPSC-TM injection; a lateral magnet with PSC NP-labeled miPSC-TM injection; a ring magnet with PSC NP-labeled miPSC-TM injection. Magnets are placed adjacent to the limbus and the TM. Red represents the PSC NP-labeled miPSC-TM cells. “C” denotes the approximate center of the cornea. (E–H). The polar histograms show the total fluorescence intensity in the TM region for 30° sectors. Note that the lateral magnet leading to a non-uniform distribution of PSC NP-labeld miPSC-TM with an obvious cell aggregation adjacent to the lateral magnet (panel (G). (I). Quantification assay of the averaged fluorescence intensity in the TM region from three eyes. Data shown represent means ± SD. |
We next investigated the effect of magnetic field strength (30 and 60 mT) and the magnet exposure time (15 mins and 45 mins) on delivery efficiency (Figure 10). Compared to 30 mT, 60 mT magnet significantly increased the average fluorescence intensity in the TM region (3.3×10⁶ a.u. for 60 mT vs 9.6×10⁵ a.u. for 30 mT, p = 0.005, n = 3; Figure 10M). In the 60 mT magnetic field, 15 minutes had a higher delivery efficiency than 45 minutes (3.3×10⁶ a.u. for 15 min vs 1.0×10⁶ a.u. for 45 min, p = 0.006, n = 3; Figure 10M). After exposure to a 60 mT field for 15 minutes cells could be continuously monitored for 48 hours (Figure 10N), but, with a decayed fluorescent signal over time (15 minutes vs 12 hours: 3.3×10⁶ a.u. vs 1.1×10⁶ a.u., p = 0.04, n = 3) as we observed by NIR in vitro (Figure 5). Thus, the magnetic exposure with a strength of 60 mT for 15 minutes was determined with the highest efficiency to steer miPSC-TM cells towards the TM following transplantation. Although the mechanism is unclear, Snider et al similarly reported 15 min as the optimal time to drive nanoparticle-labeled MSCs in an organ culture porcine anterior segment model.22
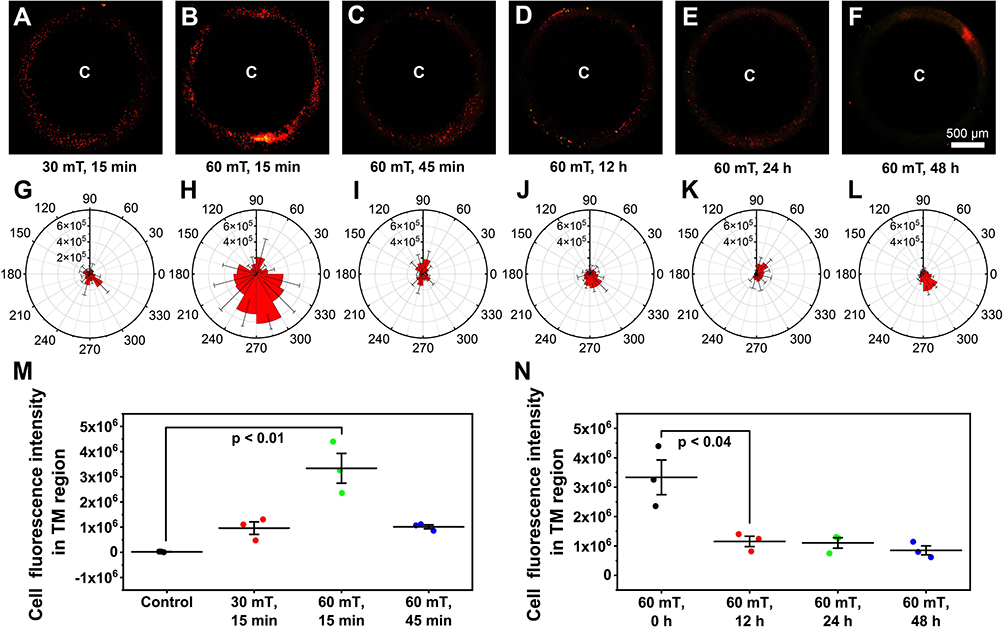 |
Figure 10 Optimized magnetic field strength and exposure time. (A–F). Representative en face micrographs of the TM regions in eyes exposed to two ring magnets (30 and 60 mT) for different durations (15 and 45 mins) followed by the transplantation of 0, 12, 24, 48 hours. (G–L). Polar histogram of the total fluorescence intensity in the TM region for 30° sectors. (M). Quantification of the fluorescent signal in the TM region exposed to two different field strengths (30 and 60 mT) for two different times (15 and 45 mins). (N). Quantification analysis of the fluorescence signals in the TM region after cell transplantation for 0, 12, 24, and 48 hours. Data shown represent means ± SD. |
In vivo Monitoring of PSC NP-Labeled miPSC-TM by MRI
Given our earlier observation of the relative long-term monitoring by MRI in vitro (Figure 7) we further investigated whether MRI can be used for long-term tracking in vivo. As reported,64–66 the magnetic accumulation in tissue could lead to a decreased MRI signal and consequently an increased darkening in T2-weighted scans. Accordingly, we evaluated T2-weighted darkening of the TM after receiving PSC NP-labeled miPSC-TM (75,000 cells/eye) guided by the magnet (60 mT, 15 mins, Figure 11A). Like the observation in Figure 10, the grayscale value in eyes receiving PLGA-SPIO-Cypate NP-labeled cells with the magnetic steering was significantly higher (7.78 ± 0.88 a.u., n=3) compared to either control (1.89 ± 0.40 a.u., p < 0.01, n=3) or eyes receiving PSC NP-labeled cells without the magnetic guide (2.74 ± 0.81 a.u., p < 0.01, n=3; Figure 11B). After seven days transplantation iron-associated darkening in T2-weighted scans was still detectable in the TM region (Day 1: 6.28 ± 1.08 a.u.; Day 3: 5.37 ± 0.79 a.u.; Day 7: 4.34 ± 1.71 a.u.; Figure 11C).
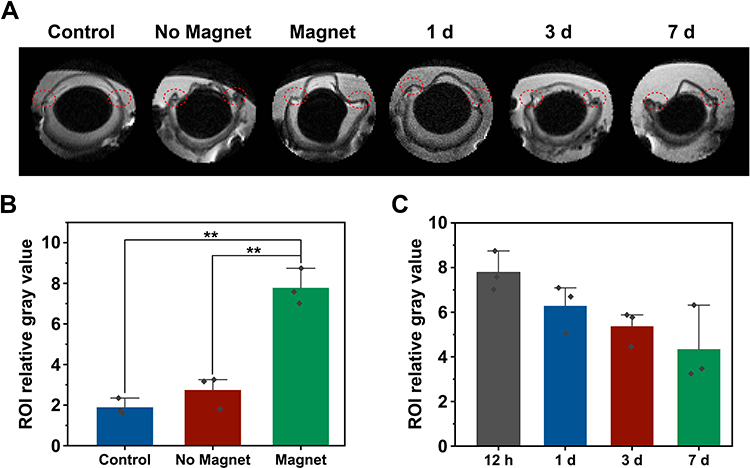 |
Figure 11 High-resolution of MRI tracking in vivo. (A). Representative images of eyes by MRI. Left-right: Control (no injection), No Magnet; 12 hour after receiving PSC NP-labeled miPSC-TM, Magnet; 12 hours, 1, 3, and 7 days after receiving PSC NP-labeled miPSC-TM cells. The grayscale values in the red circles are analyzed using ImageJ. (B). Quantification analysis of the grayscale values in the TM regions. The magnet facilitates the accumulation of PSC NP-labeled miPSC-TM cells at the TM. **P < 0.01 by one-way ANOVA. (C). Quantification analysis of the grayscale values in the TM region after receiving cells for 1, 3, 7 days. No significant difference is observed. Data shown represent means ± SD. |
The goal of this study was to monitor the transplanted miPSC-TM in a dual-imaging modal (NRI and MRI) that overcomes the temporal and spatial limitations imposed on in vivo stem cell tracking.15,20,22 While the time window shrank to 24 h for NIR imaging in vivo, the MRI signal was still viable after 7 days (Figures 9–11). Considering the risk of teratoma formation and our previous finding that iPSC-TMs enable endogenous TM cell proliferation for 48 hours after transplantation,15 the time required for in vivo tracking was defined as one week which is met by the MRI modality. Besides this improvement, the implementation of NIR (cypate: 781 nm: Figure 2) allowed deep tissue imaging at a higher spatial resolution than conventional trackers (400–700 nm), which is crucial for monitoring accuracy.
Throughout this study, we presented multiple advantages of our approach. However, some improvements are still necessary for the clinical translation of this method. One issue concerns the temporal attenuation of in vivo signals in the TM for NIR and MRI imaging. It can be due to the dilution of the tracking agent in daughter cells as a consequence of cell division, a common disadvantage of cell trackers,67–69 or cellular iron metabolism.70,71 Another possibility is cell death following transplantation, a typical observation of using either MSCs or iPSC-TM cells.72–75 Increased cell delivery efficiency and a fluorophore with higher fluorescence yield can help with this problem.
Histological Analysis of Cell Localization and Functional Test
To further confirm the transplanted cell localization, we eventually performed histological analysis of eyes receiving PSC NP-labeled miPSC-TM (75,000 cells/eye) guided by the magnet (60 mT, 15 mins) 12 hours after injection. The eye receiving PSC NP-labeled miPSC-TM without magnetic steering was used as a control. IHC (Figure 12A–C) and Prussian blue staining (Figure 12D–F) showed that transplanted cells were less likely to home to the TM without a magnet, as was previously reported.15,22,76 As shown in Figure 12G, a ring magnet can significantly improve cell delivery efficiency to the TM (28.7% vs 7.6%, p < 0.01, n=3), but also to the posterior segment (15.7% vs 11.0%, p < 0.05, n=3). As expected, it decreased the percentage of transplanted cells adhering to the cornea and iris (55.6% vs 81.4%, p=0.18, n=3). Even though our histological evaluation showed a significant improvement in the delivery accuracy, a large number of cells were still found to attach to off-target locations (71.3%). Our attempt to reduce this unwanted delivery by increasing the magnetic field strength can be accompanied by another magnet design to provide an uninterrupted path for the cells from the injection site to the TM.
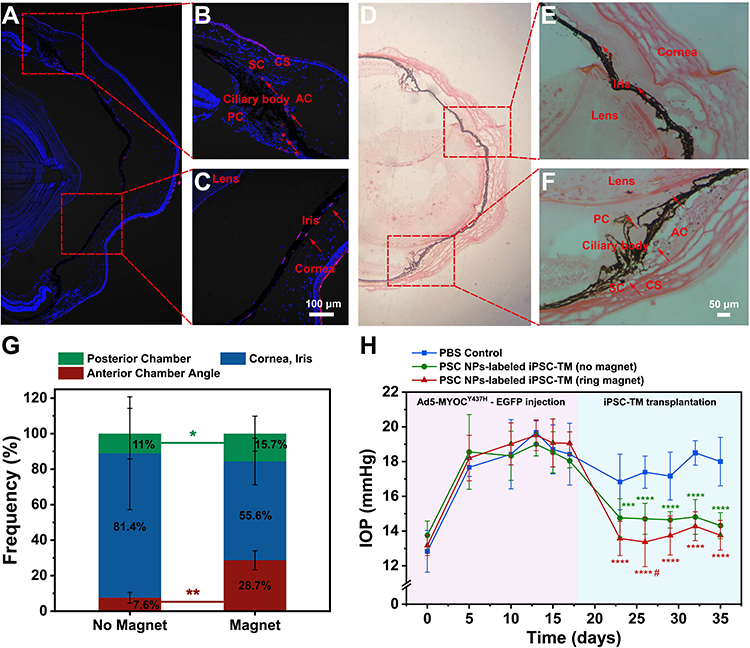 |
Figure 12 Histological assessment and functional test of PSC NP-labeled iPSC-TM in the eye. (A–C). Representative images of IHC staining using eyes 12 hours after receiving PSC NP-labeled miPSC-TM guided by the magnet (60 mT, 15 mins). Arrows point at the transplanted cells in red fluorescence and nuclei are labeled with DAPI (blue). The landmarks in the eye are labeled including schlemm’s canal (SC), anterior chamber (AC), posterior chamber (PC), cornea stroma (CS), ciliary body, cornea, and iris. (D–F). Representative images of Prussian blue staining 12 hours after the eyes received magnet-assisted (60 mT, 15 mins). PSC NP-labeled cells in blue are pointed by the arrows. The cytoplasm is stained with Eosin. The magnetic field steers the transplanted cells to both the anterior and posterior segments. (G). Quantitation of transplanted cells in the anterior chamber, posterior chamber, cornea, and iris with or without the magnetic guide. A ring magnet adjacent to the TM can significantly improve cell delivery efficiency to the anterior segment (28.7% vs 7.6%, *P < 0.01 in red) as well as the posterior segment (15.7% vs 11.0%, **P < 0.05 in green) and decrease the portion of cells delivered to the cornea and iris (55.6% vs 81.4%, P = 0.18). Three eyes (12 sections/eye) are analyzed in each group. *P < 0.05, **P < 0.01 by one-way ANOVA. Data are expressed as the mean ± SD. (H). IOP measurement in C57BL/6 mice receiving Ad5-MYOCY437H-EGFP and subsequently receiving injections of PBS, PSC NP-labeled iPSC-TM with or without the guide of a ring magnet (n=9 eyes for each group). #P < 0.05, **P < 0.01, ***P < 0.001, ****P < 0.0001 by two-way ANOVA (green asterisks: no magnet vs PBS control; red asterisks: ring magnet vs PBS control; red pound: ring magnet vs no magnet). |
Eventually, a glaucoma animal model, 2-mon-old C57BL/6 receiving Adenovirus 5 (Ad5)-MYOCY437H-EGFP (8×10⁷ PFU), was involved in determining the effect of NP-labeled iPSC-TM on lowering IOP. As shown in Figure 12H, the use of the magnet caused a dramatic increase in the effectiveness of cell-based therapy in lowering the IOPs immediately after cell transplantation (8 days: ring magnet: 13.4 ± 0.6 mmHg vs no magnet: 14.7 ± 1.3 mmHg, p = 0.04, n = 9 eyes for each group). However, the guide of the magnet, causing a 3.6-fold increase of cells immigrating to the TM (Figure 12G), did not lead to a long-term change in the therapeutic effect of iPSC-TM based on the diminished significance after 11 days (p = 0.23; Figure 12H). In summary, the magnetic strength used in our study could trigger a temporary enhancement in the effectiveness of cell-based therapy in alleviating the pathologies associated with glaucoma.
Conclusions
In conclusion, we showed that our custom-designed PLGA-SPIO-Cypate NPs are simple and safe for labeling miPSC-TM cells. PLGA-SPIO-Cypate NPs serves as a remarkable MRI contrast agent for both NIR/MRI imaging and magnetic guided cell therapy. To our knowledge, it is the first time to apply a dual-model imaging technique to track cells in the TM, which has high sensitivity similar to immunohistology. Its application significantly improved the monitoring efficiency (7 days with high-quality images by NIR/MRI tracking) and delivery accuracy to the TM (3.9-fold increase by in vivo NIR tracking/3.6-fold increase by immunohistology) compared to the passive delivery.
Abbreviations
TM, trabecular meshwork; NP, nanoparticle; iPSC, induced pluripotent stem cell; PLGA, polylactic acid-glycolic acid; SPIO, superparamagnetic iron oxide; PSC, PLGA-SPIO-Cypate; NIR, near-infrared imaging; miPSC-TM, mouse iPSC-derived TM; IOP, intraocular pressure; AH, aqueous humor; MSC, mesenchymal stem cell; MRI, magnetic resonance imaging; IHC staining, immunocytochemical staining; WB, Western blot; DEX, dexamethasone; CLAN, cross-linked actin network.
Acknowledgments
We thank Prof. Budd A. Tucker at the University of Iowa for providing mouse iPSCs and Dr. Xuejiao Yang (Affiliated Hospital of Qingdao University, Qingdao, China) for giving immortalized human TM cells. This study was supported by National Key Research and Development Program 2018YFA0109500, National Natural Science Foundation of China 81870653, Shandong Key Research and Development Program 2019GSF107075, and Taishan Scholar Youth Expert Program tsqn202103055.
Disclosure
Qilong Cao is affiliated with Qingdao Haier Biotech Co. Ltd. The authors report no other conflicts of interest in this work.
References
1. Jonas JB, Aung T, Bourne RR, Bron AM, Ritch R, Panda-Jonas S. Glaucoma. Lancet. 2017;390(10108):2183–2193. doi:10.1016/s0140-6736(17)31469-1
2. Goel M, Picciani RG, Lee RK, Bhattacharya SK. Aqueous humor dynamics: a review. Open Ophthalmol J. 2010;4:52–59. doi:10.2174/1874364101004010052
3. Fautsch MP, Johnson DH. Aqueous humor outflow: what do we know? Where will it lead us? Invest Ophthalmol Vis Sci. 2006;47(10):4181–4187. doi:10.1167/iovs.06-0830
4. Johnson M. What controls aqueous humour outflow resistance? Exp Eye Res. 2006;82(4):545–557. doi:10.1016/j.exer.2005.10.011
5. Jasien JV, Zohner YE, Asif SK, et al. Comparison of extraocular and intraocular pressure transducers for measurement of transient intraocular pressure fluctuations using continuous wireless telemetry. Sci Rep. 2020;10(1):20893. doi:10.1038/s41598-020-77880-8
6. Borghi V, Bastia E, Guzzetta M, et al. A novel nitric oxide releasing prostaglandin analog, NCX 125, reduces intraocular pressure in rabbit, dog, and primate models of glaucoma. J Ocul Pharmacol Ther. 2010;26(2):125–132. doi:10.1089/jop.2009.0120
7. Kaneko Y, Ohta M, Inoue T, et al. Effects of K-115 (Ripasudil), a novel ROCK inhibitor, on trabecular meshwork and Schlemm’s canal endothelial cells. Sci Rep. 2016;6:19640. doi:10.1038/srep19640
8. Chen W, Yang X, Fang J, Zhang Y, Yang X. Rho-associated protein kinase inhibitor treatment promotes proliferation and phagocytosis in trabecular meshwork cells. Front Pharmacol. 2020;11:302. doi:10.3389/fphar.2020.00302
9. Dikopf MS, Vajaranant TS, Edward DP. Topical treatment of glaucoma: established and emerging pharmacology. Expert Opin Pharmacother. 2017;18(9):885–898. doi:10.1080/14656566.2017.1328498
10. Manuguerra‐GagnÉ R, Boulos PR, Ammar A, et al. Transplantation of mesenchymal stem cells promotes tissue regeneration in a glaucoma model through laser-induced paracrine factor secretion and progenitor cell recruitment. Stem Cells. 2013;31(6):1136–1148.
11. Du Y, Roh DS, Mann MM, Funderburgh ML, Funderburgh JL, Schuman JS. Multipotent stem cells from trabecular meshwork become phagocytic TM cells. Invest Ophthalmol Vis Sci. 2012;53(3):1566–1575. doi:10.1167/iovs.11-9134
12. Yun H, Zhou Y, Wills A, Du Y. Stem cells in the trabecular meshwork for regulating intraocular pressure. J Ocul Pharmacol Ther. 2016;32(5):253–260. doi:10.1089/jop.2016.0005
13. Du Y, Yun H, Yang E, Schuman JS. Stem cells from trabecular meshwork home to TM tissue in vivo. Invest Ophthalmol Vis Sci. 2013;54(2):1450–1459. doi:10.1167/iovs.12-11056
14. Yun H, Wang Y, Zhou Y, et al. Human stem cells home to and repair laser-damaged trabecular meshwork in a mouse model. Commun Biol. 2018;1:216. doi:10.1038/s42003-018-0227-z
15. Zhu W, Gramlich OW, Laboissonniere L, et al. Transplantation of iPSC-derived TM cells rescues glaucoma phenotypes in vivo. Proc Natl Acad Sci U S A. 2016;113(25):E3492–E3500. doi:10.1073/pnas.1604153113
16. Zhu W, Godwin CR, Cheng L, Scheetz TE, Kuehn MH. Transplantation of iPSC-TM stimulates division of trabecular meshwork cells in human eyes. Sci Rep. 2020;10(1):2905. doi:10.1038/s41598-020-59941-0
17. Zhu W, Jain A, Gramlich OW, Tucker BA, Sheffield VC, Kuehn MH. Restoration of aqueous humor outflow following transplantation of ipsc-derived trabecular meshwork cells in a transgenic mouse model of glaucoma. Invest Ophthalmol Vis Sci. 2017;58(4):2054–2062. doi:10.1167/iovs.16-20672
18. Yu H, Miao Y, Chen W, et al. Expressional and functional involvement of gap junctions in aqueous humor outflow into the ocular trabecular meshwork of the anterior chamber. Mol Vis. 2019;25:255–265.
19. Sui S, Yu H, Wang X, et al. iPSC-derived trabecular meshwork cells stimulate endogenous TM cell division through gap junction in a mouse model of glaucoma. Invest Ophthalmol Vis Sci. 2021;62(10):28. doi:10.1167/iovs.62.10.28
20. Roubeix C, Godefroy D, Mias C, et al. Intraocular pressure reduction and neuroprotection conferred by bone marrow-derived mesenchymal stem cells in an animal model of glaucoma. Stem Cell Res Ther. 2015;6(1):177. doi:10.1186/s13287-015-0168-0
21. Swaminathan SS, Oh DJ, Kang MH, Rhee DJ. Aqueous outflow: segmental and distal flow. J Cataract Refract Surg. 2014;40(8):1263–1272. doi:10.1016/j.jcrs.2014.06.020
22. Snider EJ, Kubelick KP, Tweed K, et al. Improving stem cell delivery to the trabecular meshwork using magnetic nanoparticles. Sci Rep. 2018;8(1):12251. doi:10.1038/s41598-018-30834-7
23. Qian X, Kang H, Li R, et al. In vivo visualization of eye vasculature using super-resolution ultrasound microvessel imaging. IEEE Trans Biomed Eng. 2020;67:2870–2880. doi:10.1109/TBME.2020.2972514
24. Zhou L, Zhang X, Wang Q, et al. Molecular engineering of a TBET-based two-photon fluorescent probe for ratiometric imaging of living cells and tissues. J Am Chem Soc. 2014;136(28):9838–9841. doi:10.1021/ja504015t
25. Page MJ, Lourenço AL, David T, et al. Non-invasive imaging and cellular tracking of pulmonary emboli by near-infrared fluorescence and positron-emission tomography. Nat Commun. 2015;6:8448. doi:10.1038/ncomms9448
26. Schuman JS, Hee MR, Arya AV, et al. Optical coherence tomography: a new tool for glaucoma diagnosis. Curr Opin Ophthalmol. 1995;6(2):89–95. doi:10.1097/00055735-199504000-00014
27. Konstantopoulos A, Hossain P, Anderson DF. Recent advances in ophthalmic anterior segment imaging: a new era for ophthalmic diagnosis? Br J Ophthalmol. 2007;91(4):551–557. doi:10.1136/bjo.2006.103408
28. Chen G, Zhang Y, Li C, Huang D, Wang Q, Wang Q. Recent advances in tracking the transplanted stem cells using near‐infrared fluorescent nanoprobes: turning from the first to the second near‐infrared window. Adv Healthcare Mater. 2018;7(20):1800497. doi:10.1002/adhm.201800497
29. Fu Y, Kraitchman DL. Stem cell labeling for noninvasive delivery and tracking in cardiovascular regenerative therapy. Expert Rev Cardiovasc Ther. 2010;8(8):1149–1160. doi:10.1586/erc.10.106
30. Goodfellow F, Simchick GA, Mortensen LJ, Stice SL, Zhao Q. Tracking and quantification of magnetically labeled stem cells using magnetic resonance imaging. Adv Funct Mater. 2016;26(22):3899–3915. doi:10.1002/adfm.201504444
31. Xiong S, Kumar A, Tian S, Taher E, Yang E. Stem cell transplantation rescued a primary open-angle glaucoma mouse model. Elife. 2021;10:e63677. doi:10.7554/eLife.63677
32. Mandegar MA, Moralli D, Khoja S, et al. Functional human artificial chromosomes are generated and stably maintained in human embryonic stem cells. Hum Mol Genet. 2011;20(15):2905–2913. doi:10.1093/hmg/ddr144
33. Momeni A, Neelamegham S, Parashurama N. Current challenges for the targeted delivery and molecular imaging of stem cells in animal models. Bioengineered. 2016;8(4):316–324. doi:10.1080/21655979.2016.1233090
34. Naldini L, Blömer U, Gage FH, Trono D, Verma IM. Efficient transfer, integration, and sustained long-term expression of the transgene in adult rat brains injected with a lentiviral vector. Proc Natl Acad Sci U S A. 1996;93(21):11382–11388. doi:10.1073/pnas.93.21.11382
35. Wolfbeis OS. An overview of nanoparticles commonly used in fluorescent bioimaging. Chem Soc Rev. 2015;44(14):4743–4768. doi:10.1039/c4cs00392f
36. Mao W, Liu Y, Mody A, Montecchi-Palmer M, Wordinger RJ, Clark AF. Characterization of a spontaneously immortalized bovine trabecular meshwork cell line. Exp Eye Res. 2012;105:53–59. doi:10.1016/j.exer.2012.10.007
37. Clark AF, Wilson K, McCartney MD, Miggans ST, Kunkle M, Howe W. Glucocorticoid-induced formation of cross-linked actin networks in cultured human trabecular meshwork cells. Invest Ophthalmol Vis Sci. 1994;35(1):281–294.
38. Shepard AR, Jacobson N, Fingert JH, Stone EM, Sheffield VC, Clark AF. Delayed secondary glucocorticoid responsiveness of MYOC in human trabecular meshwork cells. Invest Ophthalmol Vis Sci. 2001;42(13):3173–3181.
39. Stamer WD, Clark AF. The many faces of the trabecular meshwork cell. Exp Eye Res. 2016;158:112–123. doi:10.1016/j.exer.2016.07.009
40. Mao W, Liu Y, Wordinger RJ, Clark AF. A magnetic bead-based method for mouse trabecular meshwork cell isolation. Invest Ophthalmol Vis Sci. 2013;54(5):3600–3606. doi:10.1167/iovs.13-12033
41. Niu C, Wang Z, Lu G, et al. Doxorubicin loaded superparamagnetic PLGA-iron oxide multifunctional microbubbles for dual-mode US/MR imaging and therapy of metastasis in lymph nodes. Biomaterials. 2013;34(9):2307–2317. doi:10.1016/j.biomaterials.2012.12.003
42. Yallapu MM, Chauhan N, Othman SF, et al. Implications of protein Corona on physico-chemical and biological properties of magnetic nanoparticles. Biomaterials. 2015;46:1–12. doi:10.1016/j.biomaterials.2014.12.045
43. Liu Y, Wang J. Effects of DMSA-coated Fe3O4 nanoparticles on the transcription of genes related to iron and osmosis homeostasis. Toxicol Sci. 2013;131(2):521–536. doi:10.1093/toxsci/kfs300
44. Rad AM, Janic B, Iskander A, Soltanian-Zadeh H, Arbab AS. Measurement of quantity of iron in magnetically labeled cells: comparison among different UV/VIS spectrometric methods. Biotechniques. 2007;43(5):627–636. doi:10.2144/000112599
45. Zhang L, Xue H, Gao C, et al. Imaging and cell targeting characteristics of magnetic nanoparticles modified by a functionalizable zwitterionic polymer with adhesive 3,4-dihydroxyphenyl-l-alanine linkages. Biomaterials. 2010;31(25):6582–6588. doi:10.1016/j.biomaterials.2010.05.018
46. Gao Y, Xie J, Chen H, et al. Nanotechnology-based intelligent drug design for cancer metastasis treatment. Biotechnol Adv. 2014;32(4):761–777. doi:10.1016/j.biotechadv.2013.10.013
47. Lee P-W, Hsu S-H, Wang -J-J, et al. The characteristics, biodistribution, magnetic resonance imaging and biodegradability of superparamagnetic core-shell nanoparticles. Biomaterials. 2010;31(6):1316–1324. doi:10.1016/j.biomaterials.2009.11.010
48. Wahajuddin AS. Superparamagnetic iron oxide nanoparticles: magnetic nanoplatforms as drug carriers. Int J Nanomedicine. 2012;7:3445–3471. doi:10.2147/IJN.S30320
49. Barrow M, Taylor A, Murray P, Rosseinsky MJ, Adams DJ. Design considerations for the synthesis of polymer coated iron oxide nanoparticles for stem cell labelling and tracking using MRI. Chem Soc Rev. 2015;44(19):6733–6748. doi:10.1039/c5cs00331h
50. Bulte JWM. Superparamagnetic iron oxides as MPI tracers: a primer and review of early applications. Adv Drug Deliv Rev. 2019;138:293–301. doi:10.1016/j.addr.2018.12.007
51. Cao J, Chen D, Huang S, Deng D, Tang L, Gu Y. Multifunctional near-infrared light-triggered biodegradable micelles for chemo- and photo-thermal combination therapy. Oncotarget. 2016;7(50):82170–82184. doi:10.18632/oncotarget.10320
52. Cao J, Huang S, Chen Y, et al. Near-infrared light-triggered micelles for fast controlled drug release in deep tissue. Biomaterials. 2013;34(26):6272–6283. doi:10.1016/j.biomaterials.2013.05.008
53. Ding QJ, Zhu W, Cook AC, Anfinson KR, Tucker BA, Kuehn MH. Induction of trabecular meshwork cells from induced pluripotent stem cells. Invest Ophthalmol Vis Sci. 2014;55(11):7065–7072. doi:10.1167/iovs.14-14800
54. Sharma S, Parmar A, Kori S, Sandhir R. PLGA-based nanoparticles: a new paradigm in biomedical applications. Trends Analyt Chem. 2016;80:30–40. doi:10.1016/j.trac.2015.06.014
55. Han Z, Lv L, Ma Y, et al. Cypate-mediated thermosensitive nanoliposome for tumor imaging and photothermal triggered drug release. J Biophotonics. 2017;10(12):1607–1616. doi:10.1002/jbio.201600270
56. Halamoda Kenzaoui B, Chapuis Bernasconi C, Guney-Ayra S, Juillerat-Jeanneret L. Induction of oxidative stress, lysosome activation and autophagy by nanoparticles in human brain-derived endothelial cells. Biochem J. 2012;441(3):813–821. doi:10.1042/BJ20111252
57. Calero M, Gutiérrez L, Salas G, et al. Efficient and safe internalization of magnetic iron oxide nanoparticles: two fundamental requirements for biomedical applications. Nanomedicine. 2014;10(4):733–743. doi:10.1016/j.nano.2013.11.010
58. Bellusci M, La Barbera A, Padella F, et al. Biodistribution and acute toxicity of a nanofluid containing manganese iron oxide nanoparticles produced by a mechanochemical process. Int J Nanomedicine. 2014;9:1919–1929. doi:10.2147/IJN.S56394
59. Yu Z, Li Q, Wang J, et al. Reactive oxygen species-related nanoparticle toxicity in the biomedical field. Nanoscale Res Lett. 2020;15(1):115. doi:10.1186/s11671-020-03344-7
60. Liu C, Lin Z, Qiao C, et al. Hemocompatibility assay of a micro-catheter using hydrophilic coating biomaterials. Biomed Mater Eng. 2019;30(1):1–9. doi:10.3233/BME-181028
61. Tsatsakis A, Stratidakis A, Goryachaya A, et al. In vitro blood compatibility and in vitro cytotoxicity of amphiphilic poly-N-vinylpyrrolidone nanoparticles. Food Chem Toxicol. 2019;127:42–52. doi:10.1016/j.fct.2019.02.041
62. Amin K, Dannenfelser RM. In vitro hemolysis: guidance for the pharmaceutical scientist. J Pharm Sci. 2006;95(6):1173–1176. doi:10.1002/jps.20627
63. Huang AS, Mohindroo C, Weinreb RN. Aqueous humor outflow structure and function imaging at the bench and bedside: a review. J Clin Exp Ophthalmol. 2016;7(4):578. doi:10.4172/2155-9570.1000578
64. Jun YW, Lee JH, Cheon J. Chemical design of nanoparticle probes for high-performance magnetic resonance imaging. Angew Chem Int Ed Engl. 2008;47(28):5122–5135. doi:10.1002/anie.200701674
65. Veiseh O, Gunn JW, Zhang M. Design and fabrication of magnetic nanoparticles for targeted drug delivery and imaging. Adv Drug Deliv Rev. 2010;62(3):284–304. doi:10.1016/j.addr.2009.11.002
66. Na HB, Song IC, Hyeon T. Inorganic nanoparticles for MRI contrast agents. Adv Mater. 2009;21(21):2133–2148. doi:10.1002/adma.200802366
67. Hossain ST, Mukherjee SK. CdO nanoparticle toxicity on growth, morphology, and cell division in Escherichia coli. Langmuir. 2012;28(48):16614–16622. doi:10.1021/la302872y
68. Salvati A, Åberg C, Dos Santos T, et al. Experimental and theoretical comparison of intracellular import of polymeric nanoparticles and small molecules: toward models of uptake kinetics. Nanomedicine. 2011;7(6):818–826. doi:10.1016/j.nano.2011.03.005
69. Bhargava-Shah A, Foygel K, Devulapally R, Paulmurugan R. Orlistat and antisense-miRNA-loaded PLGA-PEG nanoparticles for enhanced triple negative breast cancer therapy. Nanomedicine. 2016;11(3):235–247. doi:10.2217/nnm.15.193
70. Rojas JM, Sanz-Ortega L, Mulens-Arias V, Gutiérrez L, Pérez-Yagüe S, Barber DF. Superparamagnetic iron oxide nanoparticle uptake alters M2 macrophage phenotype, iron metabolism, migration and invasion. Nanomedicine. 2016;12(4):1127–1138. doi:10.1016/j.nano.2015.11.020
71. Petters C, Irrsack E, Koch M, Dringen R. Uptake and metabolism of iron oxide nanoparticles in brain cells. Neurochem Res. 2014;39(9):1648–1660. doi:10.1007/s11064-014-1380-5
72. Wang Y, Wang HH, Au D, Zou BS, Teng LS. Pitfalls in employing superparamagnetic iron oxide particles for stem cell labelling and in vivo MRI tracking. Br J Radiol. 2008;81(972):987–988. doi:10.1259/bjr/55991430
73. Schäfer R, Kehlbach R, Müller M, et al. Labeling of human mesenchymal stromal cells with superparamagnetic iron oxide leads to a decrease in migration capacity and colony formation ability. Cytotherapy. 2009;11(1):68–78. doi:10.1080/14653240802666043
74. Schäfer R, Bantleon R, Kehlbach R, et al. Functional investigations on human mesenchymal stem cells exposed to magnetic fields and labeled with clinically approved iron nanoparticles. BMC Cell Biol. 2010;11(1):22. doi:10.1186/1471-2121-11-22
75. Farrell E, Wielopolski P, Pavljasevic P, et al. Effects of iron oxide incorporation for long term cell tracking on MSC differentiation in vitro and in vivo. Biochem Biophys Res Commun. 2008;369(4):1076–1081. doi:10.1016/j.bbrc.2008.02.159
76. Kubelick KP, Snider EJ, Ethier CR, Emelianov S. Photoacoustic properties of anterior ocular tissues. J Biomed Opt. 2019;24(5):1–11. doi:10.1117/1.JBO.24.5.056004
 © 2022 The Author(s). This work is published and licensed by Dove Medical Press Limited. The full terms of this license are available at https://www.dovepress.com/terms.php and incorporate the Creative Commons Attribution - Non Commercial (unported, v3.0) License.
By accessing the work you hereby accept the Terms. Non-commercial uses of the work are permitted without any further permission from Dove Medical Press Limited, provided the work is properly attributed. For permission for commercial use of this work, please see paragraphs 4.2 and 5 of our Terms.
© 2022 The Author(s). This work is published and licensed by Dove Medical Press Limited. The full terms of this license are available at https://www.dovepress.com/terms.php and incorporate the Creative Commons Attribution - Non Commercial (unported, v3.0) License.
By accessing the work you hereby accept the Terms. Non-commercial uses of the work are permitted without any further permission from Dove Medical Press Limited, provided the work is properly attributed. For permission for commercial use of this work, please see paragraphs 4.2 and 5 of our Terms.