")
Back to Journals » Clinical Ophthalmology » Volume 13
Macular vascular density at the superficial capillary plexus using the optical coherence tomography angiography
Authors Hashmani N , Hashmani S, Murad A, Baig N
Received 2 October 2018
Accepted for publication 17 January 2019
Published 8 February 2019 Volume 2019:13 Pages 295—302
DOI https://doi.org/10.2147/OPTH.S189515
Checked for plagiarism Yes
Review by Single anonymous peer review
Peer reviewer comments 2
Editor who approved publication: Dr Scott Fraser
Nauman Hashmani, Sharif Hashmani, Asif Murad, Natasha Baig
Department of Ophthalmology and Visual Sciences, Hashmanis Hospital, Karachi, Pakistan
Purpose: The aim of this study was to assess the effects of age, gender, axial length and retinal thickness on the vascular density in a normal population using the Optovue optical coherence tomography angiography (OCT-A).
Methods: A total of 209 eyes of 209 healthy subjects were scanned using the OCT-A on an outpatient basis. Patients were 20–75 years of age. The built-in software covered a 3×3 mm circle centered at the macula. The circle was divided into five sectors: a 1 mm central foveal circle and an upper, lower, nasal and temporal sector each spanning 1–3 mm away from the central circle. The vascular density (VD) at the superficial capillary plexus was measured, which spanned from the inner limiting membrane to the inner plexiform layer.
Results: The fovea was the least dense area (32.5%±5.9%), and the temporal area was the densest (52.4%± 4.4%). Similarly, the fovea was the thinnest part of the retina (237.8±20.7 µm); however, the nasal sector was the thickest (308.5±15.1 µm). We found a correlation of the retinal thickness (r=0.541, P<0.001) with VD only at the fovea. Similarly, males had a greater density at the fovea (P=0.002). All regions significantly and negatively correlated with age even after adjusting for axial length. The age sees a decline in the density after the fifth decade where the variability also seems to increase.
Conclusion: This study provides normative data for the Pakistani population. Additionally, it demonstrates that VD is affected by the retinal thickness at the fovea and the density begins to decline after the fifth decade.
Keywords: retina, vasculature, normative, Pakistan, spectral domain, vessel density, vascular
Introduction
Spectral domain optical coherence tomography (SD-OCT) has revolutionized retinal imaging providing fine structural details in a matter of seconds. A refinement of this technology, the OCT angiography (OCT-A), provides detailed information of the vascular networks within the retina and choroid. The current gold standard to review vessel and capillary pathology is fluorescein angiography (FA); however, this technique has some key drawbacks when compared to the OCT-A.
The OCT-A is a non-contact and non-invasive method of detecting blood flow using amplitude or phase decorrelation.1 It can provide three-dimensional volumetric data of both blood flow and tissue structure, which help localize the exact depth and location of the lesion. The FA, on the other hand, is an invasive procedure that provides two-dimensional data without any depth resolution.2 Therefore, pathology can be obscured by dye leak, hemorrhage and opacities.3 Additionally, it can cause nausea, vomiting and anaphylactic shock. However, FA has two distinct advantages to the OCT-A; it provides dynamic visualization with a wide field of view, which can help locate lesions that can be missed with the newer modality.2
The Avanti RTvue XR (Optovue, Inc., Fremont, CA, USA) provides volumetric data that can be used to calculate the vascular density (VD): the percentage of area covered by the vessel in a particular area. These data can help quantify ischemic areas and neovascularization. However, for these data to be applicable, we must observe the normal vessels in non-pathologic eyes and view the effects of demographic variables. A limited number of studies have viewed this and, therefore, we wanted to observe the effects of age, sex, axial length and retinal thickness on VD. Additionally, no study has provided normative data in the Pakistani population. Previously, we have carried out similar studies in which we quantified the layers of the peripapillary retina4 and the epithelium of the cornea using wide 9 mm maps.5
Methods
We carried out a prospective and cross-sectional study at the two centers of the Hashmanis Hospital, Karachi, Pakistan. Written informed consent was obtained from each participant, and the study was approved by the ethics committee of the Hashmanis Hospital in agreement with the Declaration of Helsinki.
Inclusion/exclusion criteria
One eye of each healthy patient between the age of 20 and 75 years was included. We performed the following examinations: autorefraction (KR-800; Topcon Medical Systems, Inc., Fukuoka, Japan), best-corrected visual acuity (BCVA) with a Snellen chart, IOP with an air-puff tonometer (Reichert 7CR; Reichert Inc., Depew, NY, USA), dilated fundus and slit lamp examinations, axial length measurement (Wavelight OB-820; WaveLight, Erlangen, Germany) and an OCT-A (Optovue, Inc.).
Our inclusion criteria were as follows: refraction between 5 D and −6 D, BCVA >0.8 and IOP <22 mmHg. Our exclusion criteria were as follows: hypertensive patients or those on hypertensive therapy, diabetics or those on anti-diabetic drugs, any history of cataract, vitreoretinal disease, visual field loss as seen by the Donders test, glaucoma, ocular hypertension, amblyopia, evidence of systemic disease and lactation or pregnancy. Additionally, any patient on systemic or topical medications was excluded. Finally, images with a quality index of >7/10 were used, as recommended by the manufacturer; any scan with a low quality was repeated.
Each eye was dilated using 1% tropicamide and scanned by an experienced operator. All included eyes were screened for retinal or optic disc diseases by ophthalmologists using a dilated fundus examination. Additionally, an expert in glaucoma screened patients using color fundus photographs; patients with evidence of optic disc neuropathy, optic nerve abnormality or other retinal diseases were excluded.
Scan protocol
We used the Avanti RTVue XR machine with AngioAnalytics software version 2016.10 using the split-spectrum amplitude decorrelation angiography (SSADA) algorithm. The machine scans at 70,000 scans per second using an 840 nm superluminescent diode with an axial resolution of 5 μm.
The superficial capillary plexus (SCP) was measured, which spanned from the inner limiting membrane (ILM) to the lower border of the inner plexiform layer (IPL). The measurements were made in an Early Treatment Diabetic Retinopathy Study (ETDRS) circle measuring 3×3 mm centered at the fovea using an image size of 6×6 mm HD. The center was the fovea, and the outer circles were 1–3 mm apart in four zones. These zones were the superior, inferior, nasal and temporal as seen in Figure 1A. Figure 1B shows the measurement area with the signals produced by the vessels.
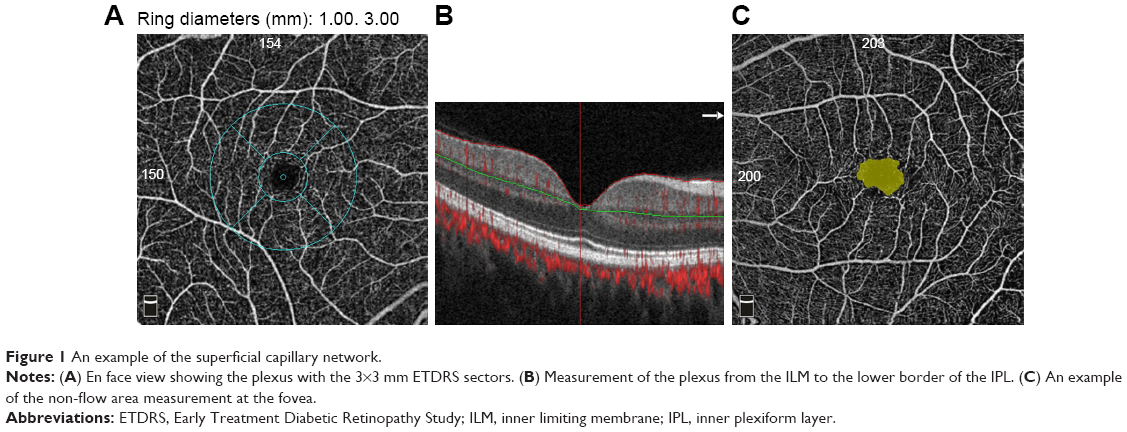 | Figure 1 An example of the superficial capillary network. |
VD can be defined as the percentage of a particular area that is occupied by vessels.6 The software takes a binary image of the vessels using an en face image from the eye and calculates the number of pixels occupied. Additionally, the non-flow area at the fovea was calculated, as shown in Figure 1C. Both VD and non-flow area were automatically provided by the AngioAnalytics software.
Terminologies
Several terminologies have been used to describe the different plexuses within the retina depending on the method used. This study used the term SCP to define the plexus spanning from the ILM to the lower border of IPL. The same terms define the deep capillary plexus (DCP) to span from the inner nuclear layer (INL) to the outer plexiform layer (OPL). However, recently a study published using the projection resolved OCT (PR-OCT) has proposed new terminologies for these plexuses due to advances in the algorithm.7 This study has managed to segment all four plexuses within the retina, as histologically proven.8,9 Therefore, they suggested a rename for the terms SCP and DCP to superficial and deep vascular complexes (SVC; DVC). The SVC is subdivided into the retinal peripapillary capillary plexus (RPCP) and the superficial vascular plexus (SVP). Likewise, the DVC is divided into the intermediate capillary plexus (ICP) and DCP.7 The studies discussed in this article use these terms and therefore required clarification.
Image artifacts
The machine takes two consecutive OCT-A volume scans centered at the fovea. These images are observed for differences using the SSADA algorithm (decorrelation), and a flow signal is produced in the areas of dissimilarity. Every B-scan contained 304 A-scans: two of these scans were taken in 3 seconds. The AngioVue software (Optovue, Inc.) with its built-in motion correction technology was used to reduce motion artifacts.
We looked for the following several types of motion artifacts: the characteristic straight white lines with a matching break in the en-face image, lateral displacement of fragments and duplication of the vasculature. Additionally, blink lines were observed, which were seen as straight dark lines across the image. We also looked for proof of image artifacts: this included segmentation errors and projection artifacts with vessels clearly appearing in a deeper location than expected. If any evidence of artifacts were found, the scan was repeated.
Optic nerve head protocol
The optic nerve head protocol was used to quantify the average retinal nerve fiber layer (RNFL) thickness, cup/disc ratio and the rim area. The scan utilized a circle with a diameter of 3.45 mm centered at the optic nerve head; 13 circular scans and 12 radial lines were obtained. The algorithm, then, quantifies these values automatically, which were used to exclude any subtle pathology. If there was a signal strength index of <40 or any evidence of misalignment, the eye was rescanned using the same protocol.
Statistical analyses
We used the SPSS v23 (SPSS Inc., Chicago, IL, USA) for all analyses. The graphs were produced using Microsoft Excel (Microsoft Corp., Redmond, WA, USA). First, the Shapiro–Wilk test was utilized to test for normality. We used descriptive statistics to calculate the mean and SDs. The Pearson correlation coefficient was used to observe a correlation between the VD and the retinal thickness; this was also used to correlate the foveal retinal thickness and the non-flow area. An independent t-test was used to observe difference in gender. A linear regression test was used to view the effects of age and axial length. Finally, a partial correlation was used to calculate an adjusted P-value. A P-value of <0.05 was considered significant.
Results
Patients
The OCT-A was performed on a total of 209 healthy patients (106 males and 103 females). The mean age for the population was 39.6±13.2 years. Parameters including spherical equivalent (SE), IOP, systolic blood pressure (BP), diastolic BP, disc area, rim area, cup/disc ratio and RNFL thickness were recorded (Table 1).
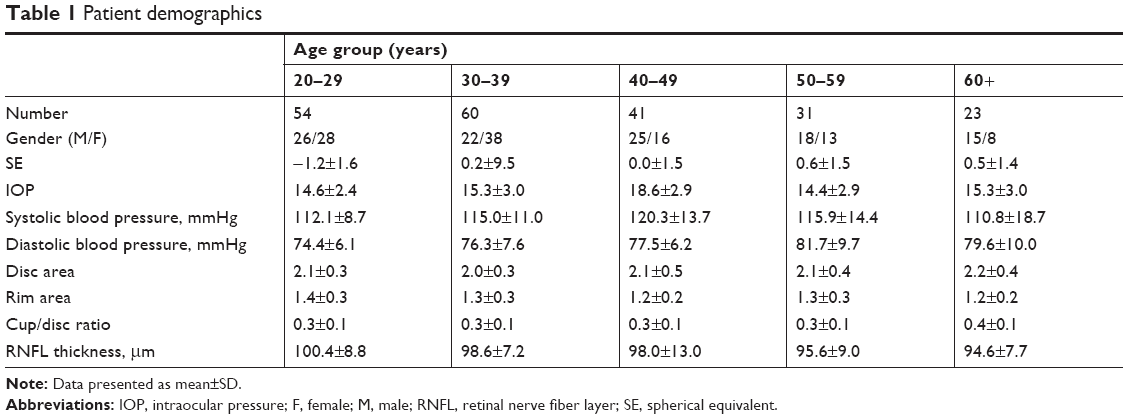 | Table 1 Patient demographics |
VD and retinal thickness
The VD and thickness were measured by sector, as outlined in Table 2. The density of the whole image was 48.7%±3.6%. The temporal sector had the highest density of 52.4%±4.4%, whereas the fovea had the lowest density of 32.5%±5.9%; the lowest density in the parafoveal area was the inferior sector with 50.9%±4.9%. The thickest area was the nasal sector with a thickness of 308.5±15.1μm, and the thinnest area was the fovea with a thickness of 237.8±20.7 μm; the thinnest location in the parafovea was temporally with 294.9±16.1 μm. A significant moderate positive correlation was seen of density and thickness at the fovea (r=0.541, P<0.001). There was no such correlation elsewhere.
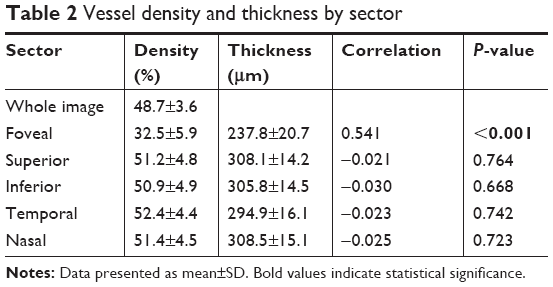 | Table 2 Vessel density and thickness by sector |
Foveal non-flow area
When evaluating the non-flow area at the fovea, females had a significantly larger zone (P<0.001). Females had a mean area of 0.3±0.1 mm2, whereas males had a mean area of 0.2±0.1 mm2. Additionally, there was a significant negative correlation with the foveal retinal thickness (r=−0.433, P<0.001) and foveal VD (r=−0.738, P<0.001). However, this area was not affected by age (r=0.120, P=0.133) or axial length (r=0.115, P=0.098).
Gender
We found no differences among the genders when evaluating age (P=0.222), IOP (P=0.342), axial length (P=0.353) and refractive error (P=0.632). Stratification of VD by gender showed statistical significance at the fovea (P=0.002). In males, the VD at the fovea was 33.8%±5.8%, and in females, it was 31.2%±5.8%. No significant differences were found in other sectors or in the whole image. All relevant data are available in Table 3.
 | Table 3 Stratifying vessel density by gender |
Age
A negative correlation of age with VD was found in the whole image (r=−0.302, P<0.001). Similarly, the effect of age on VD also negatively correlated with each sector: fovea (r=−0.215, P=0.004), superior (r=−0.233, P=0.008), inferior (r=−0.204, P=0.001), temporal (r=−0.175, P=0.028) and nasal (r=−0.145, P=0.003). Table 4 highlights the pertinent data. Figures 2 and 3 depict data supporting this negative correlation. The mean VD was seen to be steady till the age of 50 years after which a decline can be appreciated. Consistent with this, the SD was seen to increase after 50 years of age.
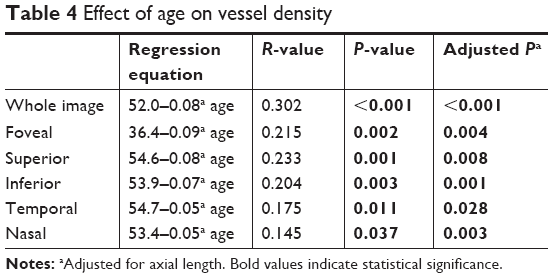 | Table 4 Effect of age on vessel density |
 | Figure 2 The effect of age on the mean vessel density. |
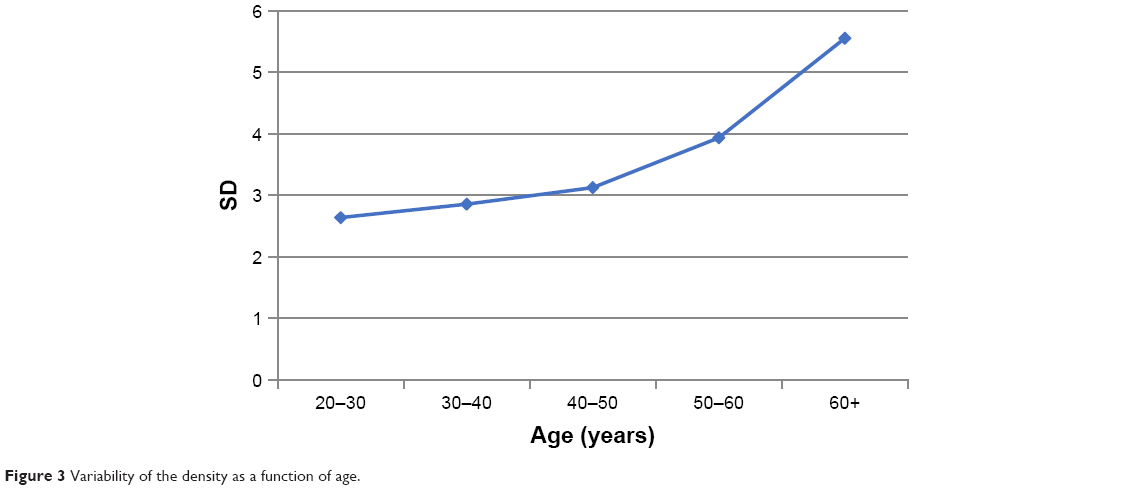 | Figure 3 Variability of the density as a function of age. |
Axial length
Table 5 summarizes the effect of axial length on VD. No significant correlation was found in the whole image or any of the five sectors.
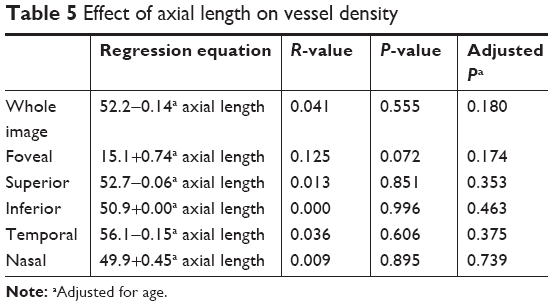 | Table 5 Effect of axial length on vessel density |
Discussion
The aim of this study was to evaluate the relationship between the effects of demographic variables and retinal thickness on VD. We focused on examining the macular VD at the SCP in the normal population of Pakistan and establish normative values in this group.
VD and retinal thickness
Our analysis concluded that there is a significant positive correlation of density and retinal thickness at the fovea. Previous studies have scrutinized the relationship between central retinal thickness and the foveal avascular zone (FAZ)10–12 and the relationship between FAZ and VD.13–16 However, only a few have reported a relationship between both entities.17–20 A study carried out by Fujiwara et al highlighted that retinal thickness has a stronger correlation with the FAZ as compared to VD.17 They discovered that the retinal VD shows only slight variation among individuals and, therefore, has little effect on the FAZ area when compared to the retinal thickness.15
We found the densest area to be the temporal sector, in contrast to the outcome of Coscas et al;16 they found the highest density in the superior and inferior sectors. Additionally, their mean VD for the whole image was 52.58%±3.22%,16 whereas ours was 48.7%±3.6%. Gadde et al14 also had similar contrasting findings, and their densest area at the level of the SCP was the inferior sector. Campbell et al7 explained that VD of the SCP decreases with distance from the optic nerve along the maculopapillary axis due to thinning of the surrounding ganglion cell layer. They further emphasized that it is histologically proven that the superficial vascular complex is densest in the peripapillary region.7 Further research is required to evaluate the variability of these measurements.
Moreover, on evaluating VD in glaucoma patients, Akil et al20 found a significant correlation between RNFL thickness and VD. Thus, they theorized that RNFL thickness proved to be a predictor of VD at the optic nerve head; they observed the entire capillary network from the ILM to the OPL.20 Similarly, Mase et al19 established an overall significant correlation between VD and thickness; they analyzed the density of the RPCP. This study suggested that due to the positive correlation between the RNFL thickness and the density of the RPCP, this network was responsible for nourishing the RNFL.19
In this study, the least dense area was calculated to be the fovea, conceivably because the centripetal branching arrangement of the SCP terminates around the FAZ.7
VD and gender
Upon stratification of VD by gender, our results showed statistical significance at the fovea. At par with our conclusion, Yu et al21 concluded in their study that parafoveal VD was not associated with gender. They proposed that the capillary-free zone is larger in females, which explains the statistical significance at the fovea;21 this study agrees with this theory. Some researchers disagree; however, Coscas et al16 found a higher VD in females, especially after the age of 60 years. They theorized that this finding was due to a delay in vascular aging in women. On the other hand, Wang et al22 found a higher density in males. This topic requires further evaluation before a definite conclusion can be made.
VD and age
Furthermore, this study shows a decrease in VD after the fifth decade of life with a corresponding increase in measurement variability. Supportive to this conclusion are studies carried out by Garrity et al and Iafe et al that reported a reduction of 0.22%15 and 0.26%23 in VD per year of age in the SCP, respectively. However, these studies also showed a corresponding increase in FAZ area with age;15 the present study does not show any correlation of these two variables. Yu et al21 discussed a similar relationship between VD and age, but their study only measured the vessel area density at the parafoveal area whereas our study takes into account all five sectors.
Coscas et al16 reiterated that there is indeed increased variability in VD with age and suggested that this may be in association with a decrease in the FAZ area due to age-related atrophic changes in macular vessels. Likewise, Wang et al22 discovered an association with greater density of the SCP at a younger age, corresponding to a physiologic loss in retinal vascularity with increasing age. Therefore, further research should be conducted to effectively study the reasoning behind this phenomenon.
VD and axial length
This study concluded that there is no significant effect of the axial length on the VD at the level of the SCP. Although previous studies have explored the relationship between thickness,4,24–26 macular volume27 and FAZ area11,12 with axial length, there is limited research regarding correlation of VD and axial length. A study by Wang et al22 discovered that macular VD was not dependent on axial length.
Advantages and limitations
Our sample size of 209 individual eyes was relatively larger than those of other studies. For example, Garrity et al15 included 152 eyes from 95 individuals, whereas Coscas et al16 used 135 eyes of 70 subjects. We selected a group of healthy individuals to emphasize the primary need to establish correlations of VD in non-diseased persons. Alongside, we used a wide range of age groups with a proportionate distribution of subjects per age group and gender.
Limitations of this study include a cross-sectional study design with people of limited ethnic backgrounds, belonging to only one city of Pakistan. Furthermore, we analyzed only the SCP. Also, the various artifacts associated with OCT-A7,28,29 may have affected the interpretation of our images due to the use of automated measurements.
Image magnification has been shown to significantly influence the foveal VD and the non-flow measurements.30 However, the parafoveal and whole image VD do not seem to be significantly affected by this phenomenon presumably due to a uniform network of vessels at this location. This study did not correct the magnification according to the AL, and this may have induced subtle errors and, therefore, the data within the fovea must be looked at with caution. It must be noted, however, that most of our data (164 eyes; 78.1%) were within an AL range of 22.28–24.71 mm, which does not seem to be significantly affected by image magnification.30
Conclusion
This study demonstrates that at the fovea, macular VD positively correlates with retinal thickness. Additionally, age and macular VD negatively correlate within every sector. Moreover, beyond the fifth decade of life, VD falls with a corresponding increase in variability. Therefore, these factors must be considered when assessing the effect of demographic variables on macular VD at the level of the SCP.
Acknowledgments
This study was presented as a poster at the congress of the Association for Research in Vision and Ophthalmology 2018, Honolulu, Hawaii. We would like to thank Dr Sami Memon for reviewing the manuscript and the OCT-A scans. Additionally, we would like to recognize the work of Mr Faisal Ahmed, Ms Samreen Jahangir and Mr Faraz Haroon for their immense contribution in data collection. The research was funded by the Hashmanis Foundation.
Disclosure
The authors report no conflicts of interest in this work.
References
Tokayer J, Jia Y, Dhalla AH, Huang D. Blood flow velocity quantification using split-spectrum amplitude-decorrelation angiography with optical coherence tomography. Biomed Opt Express. 2013;4(10):1909–1924. | ||
de Carlo TE, Romano A, Waheed NK, Duker JS. A review of optical coherence tomography angiography (OCTA). Int J Retina Vitreous. 2015;1:5. | ||
Johnson R, Fu A, McDonald H, et al. Fluorescein Angiography: Basic Principles and Interpretation. Ryan S, Sadda S, Hinton D, editors. London: Elsevier Saunders; 2013. | ||
Hashmani N, Hashmani S. Three-dimensional mapping of peripapillary retinal layers using a spectral domain optical coherence tomography. Clin Ophthalmol. 2017;11:2191–2198. | ||
Hashmani N, Hashmani S, Saad CM. Wide corneal epithelial mapping using an optical coherence tomography. Invest Ophthalmol Vis Sci. 2018;59(3):1652–1658. | ||
Lumbroso B, Huang D, Rispoli M. Angio OCT in Everyday Ophthalmic Practice. New Delhi: Jaypee Brothers Medical Publishers Ltd; 2017. | ||
Campbell JP, Zhang M, Hwang TS, et al. Detailed vascular anatomy of the human retina by Projection-Resolved optical coherence tomography angiography. Sci Rep. 2017;7:42201. | ||
Snodderly DM, Weinhaus RS, Choi JC. Neural-vascular relationships in central retina of macaque monkeys (Macaca fascicularis). J Neurosci. 1992;12(4):1169–1193. | ||
Henkind P. Radial peripapillary capillaries of the retina. I. Anatomy: human and comparative. Br J Ophthalmol. 1967;51(2):115–123. | ||
Tick S, Rossant F, Ghorbel I, et al. Foveal shape and structure in a normal population. Invest Ophthalmol Vis Sci. 2011;52(8):5105–5110. | ||
Chui TY, Vannasdale DA, Elsner AE, Burns SA. The association between the foveal avascular zone and retinal thickness. Invest Ophthalmol Vis Sci. 2014;55(10):6870–6877. | ||
Tan CS, Lim LW, Chow VS, et al. Optical coherence tomography angiography evaluation of the parafoveal vasculature and its relationship with ocular factors. Invest Ophthalmol Vis Sci. 2016;57(9):OCT224–OCT234. | ||
Kuehlewein L, Tepelus TC, An L, Durbin MK, Srinivas S, Sadda SR. Noninvasive visualization and analysis of the human parafoveal capillary network using swept source OCT optical microangiography. Invest Ophthalmol Vis Sci. 2015;56(6):3984–3988. | ||
Gadde SG, Anegondi N, Bhanushali D, et al. Quantification of vessel density in retinal optical coherence tomography angiography images using local fractal dimension. Invest Ophthalmol Vis Sci. 2016;57(1):246–252. | ||
Garrity ST, Iafe NA, Phasukkijwatana N, Chen X, Sarraf D. Quantitative analysis of three distinct retinal capillary plexuses in healthy eyes using optical coherence tomography angiography. Invest Ophthalmol Vis Sci. 2017;58(12):5548–5555. | ||
Coscas F, Sellam A, Glacet-Bernard A, et al. Normative data for vascular density in superficial and deep capillary plexuses of healthy adults assessed by optical coherence tomography angiography. Invest Ophthalmol Vis Sci. 2016;57(9):OCT211–OCT223. | ||
Fujiwara A, Morizane Y, Hosokawa M, et al. Factors affecting foveal avascular zone in healthy eyes: an examination using swept-source optical coherence tomography angiography. PLoS One. 2017;12(11):e0188572. | ||
Mastropasqua R, Borrelli E, Agnifili L, et al. Radial peripapillary capillary network in patients with retinitis pigmentosa: an optical coherence tomography angiography study. Front Neurol. 2017;8:572. | ||
Mase T, Ishibazawa A, Nagaoka T, Yokota H, Yoshida A. Radial peripapillary capillary network visualized using wide-field montage optical coherence tomography angiography. Invest Ophthalmol Vis Sci. 2016;57(9):OCT504–OCT510. | ||
Akil H, Huang AS, Francis BA, Sadda SR, Chopra V. Retinal vessel density from optical coherence tomography angiography to differentiate early glaucoma, pre-perimetric glaucoma and normal eyes. PLoS One. 2017;12(2):e0170476. | ||
Yu J, Jiang C, Wang X, et al. Macular perfusion in healthy Chinese: an optical coherence tomography angiogram study. Invest Ophthalmol Vis Sci. 2015;56(5):3212–3217. | ||
Wang Q, Chan S, Yang JY, et al. Vascular density in retina and Choriocapillaris as measured by optical coherence tomography angiography. Am J Ophthalmol. 2016;168:95–109. | ||
Iafe NA, Phasukkijwatana N, Chen X, Sarraf D. Retinal capillary density and foveal avascular zone area are age-dependent: quantitative analysis using optical coherence tomography angiography. Invest Ophthalmol Vis Sci. 2016;57(13):5780–5787. | ||
Lam DS, Leung KS, Mohamed S, et al. Regional variations in the relationship between macular thickness measurements and myopia. Invest Ophthalmol Vis Sci. 2007;48(1):376–382. | ||
Knight OJ, Girkin CA, Budenz DL, Durbin MK, Feuer WJ, Cirrus O; Cirrus OCT Normative Database Study Group. Effect of race, age, and axial length on optic nerve head parameters and retinal nerve fiber layer thickness measured by Cirrus HD-OCT. Arch Ophthalmol. 2012;130(3):312–318. | ||
Wong AC, Chan CW, Hui SP. Relationship of gender, body mass index, and axial length with central retinal thickness using optical coherence tomography. Eye. 2005;19(3):292–297. | ||
Luo HD, Gazzard G, Fong A, et al. Myopia, axial length, and OCT characteristics of the Macula in Singaporean children. Invest Ophthalmol Vis Sci. 2006;47(7):2773–2781. | ||
Hagag AM, Gao SS, Jia Y, Huang D. Optical coherence tomography angiography: technical principles and clinical applications in ophthalmology. Taiwan J Ophthalmol. 2017;7(3):115–129. | ||
Spaide RF, Fujimoto JG, Waheed NK. Image artifacts in optical coherence tomography angiography. Retina. 2015;35(11):2163–2180. | ||
Sampson DM, Gong P, An D, et al. Axial length variation impacts on superficial retinal vessel density and foveal avascular zone area measurements using optical coherence tomography angiography. Invest Ophthalmol Vis Sci. 2017;58(7):3065–3072. |
 © 2019 The Author(s). This work is published and licensed by Dove Medical Press Limited. The full terms of this license are available at https://www.dovepress.com/terms.php and incorporate the Creative Commons Attribution - Non Commercial (unported, v3.0) License.
By accessing the work you hereby accept the Terms. Non-commercial uses of the work are permitted without any further permission from Dove Medical Press Limited, provided the work is properly attributed. For permission for commercial use of this work, please see paragraphs 4.2 and 5 of our Terms.
© 2019 The Author(s). This work is published and licensed by Dove Medical Press Limited. The full terms of this license are available at https://www.dovepress.com/terms.php and incorporate the Creative Commons Attribution - Non Commercial (unported, v3.0) License.
By accessing the work you hereby accept the Terms. Non-commercial uses of the work are permitted without any further permission from Dove Medical Press Limited, provided the work is properly attributed. For permission for commercial use of this work, please see paragraphs 4.2 and 5 of our Terms.