")
Back to Journals » Journal of Inflammation Research » Volume 15
Macrophage-Specific Cathepsin as a Marker Correlated with Prognosis and Tumor Microenvironmental Characteristics of Clear Cell Renal Cell Carcinoma
Authors Zhang F, Liang J, Lu Y, Tang Y, Liu S, Wu K, Zhang F , Lu Y, Liu Z, Wang X
Received 28 May 2022
Accepted for publication 3 November 2022
Published 11 November 2022 Volume 2022:15 Pages 6275—6292
DOI https://doi.org/10.2147/JIR.S375250
Checked for plagiarism Yes
Review by Single anonymous peer review
Peer reviewer comments 2
Editor who approved publication: Dr Adam D Bachstetter
Fan Zhang,1,* Jiayu Liang,1 You Lu,2,* Yongquan Tang,3 Shengzhuo Liu,1 Kan Wu,1 Fuxun Zhang,1 Yiping Lu,1 Zhihong Liu,1 Xianding Wang1
1Department of Urology, Institute of Urology, West China Hospital, Sichuan University, Chengdu, 610041, People’s Republic of China; 2Department of Pediatrics, West China Second University Hospital, Chengdu, Sichuan University, Chengdu, 610041, People’s Republic of China; 3Department of Pediatric Urology, West China Hospital, Sichuan University, Chengdu, 610041, People’s Republic of China
*These authors contributed equally to this work
Correspondence: Xianding Wang; Jiayu Liang, Email [email protected]; [email protected]
Background: Cathepsin Z (CTSZ) is a cathepsin family member that plays a dual role in the adhesion and migration of immune and tumor cells.
Methods: The expression pattern of CTSZ in clear cell renal cell carcinoma (ccRCC) was observed by immunohistochemistry and validated by using double-labeling immunofluorescence. Publicly available single-cell sequencing data was used to further define the cell type-specific CTSZ expression in ccRCC. Methylation modification, immune infiltration, and tumor-related signaling enrichment analyses involving CTSZ were performed using multi-omics data. Data from two independent cohorts of anti-programmed death-1 (PD-1) therapeutic clinical trials were used to investigate correlations between CTSZ levels and treatment responses.
Results: CTSZ was upregulated in ccRCC tissues compared with adjacent normal tissues at the RNA but not in ccRCC cells. Immunohistochemistry indicated that CTSZ was expressed in tumors infiltrated with lymphocytes. Double immunofluorescence demonstrated that CTSZ was co-expressed with CD68 but not CD8. Single-cell transcriptome data showed macrophage-specific expression of CTSZ in ccRCC. High CTSZ expression was significantly correlated with the enrichment of interferon-γ, epithelial‐to‐mesenchymal transition, cell cycle, apoptosis pathways, and B cell, macrophage, neutrophil, and dendritic cell infiltrations, as well as the expression of immune checkpoints CTLA4, LAG3, HAVCR2, PDCD1LG2, PDCD1, TIGIT, and SIGLEC15. Hypomethylation modification of cg02744249, cg02744249, and cg22145559 were negatively correlated with CTSZ expression, suggesting an epigenetic mechanism for the regulation of CTSZ expression. Clinically, CTSZ levels were associated with the prognosis of patients with ccRCC (hazard ratio=1.5, P=0.007). Notably, patients with higher CTSZ expression had a worse prognosis with anti-PD-1 monotherapy (hazard ratio=1.51, P=0.039).
Conclusion: Macrophage-specific CTSZ was associated with activation of epithelial‐to‐mesenchymal transition, cell cycle signatures, and a higher infiltration level of B cells, macrophages, neutrophils, and dendritic cells in the tumor microenvironment. High expression of CTSZ could be considered as a prognostic and treatment response biomarker for patients with ccRCC receiving anti-PD-1 immunotherapy.
Keywords: ccRCC, CTSZ, macrophage, single-cell, prognosis
Introduction
Kidney cancer is a frequently diagnosed malignant tumor included in for the top ten types of cancer with the most associated deaths worldwide. It was predicted that more than 430,000 confirmed cases and 180,000 deaths from kidney cancer are expected each year.1 Clear cell renal cell carcinoma (ccRCC) is the most common subtype of kidney cancer, accounting for approximately 70% of kidney cancer cases.2 For patients with local ccRCC, complete resection is the first choice of treatment, and many of these patients have a prolonged survival. However, approximately 20–40% of patients experience repeated tumor progression, leading to significant mortality.3,4 Recently, immunotherapy has become the standard management for recurrent or metastatic ccRCC because of its antitumor activity in patients with advanced malignant tumors.5 Large-scale genome projects have found that the prevalence of germline mutations is higher in patients with ccRCC compared with normal cases, but how these genome alterations contribute to the pathogenesis of the ccRCC, tumor immune microenvironment, and drug resistance remains unresolved.6,7 Hence, an in-depth understanding of the heterogeneity of immune cell infiltrates and identifying more potential immune-related predictive and prognostic biomarkers for ccRCC may be of great significance for personalized immunotherapy management and improving prognosis.
Cathepsin Z (CTSZ, also named cathepsin P or cathepsin X) is a member of the cathepsin family comprising 11 members in humans.8 CTSZ contains an Arg‐Gly‐Asp motif responsible for binding to the cell surface, and mediating cell adhesion and migration after activation.9 Previous studies have found that CTSZ regulates the adhesion and migration of both immune and tumor cells. Targeted RNAi silencing of CTSZ in T cells significantly reduced cell migration, indicating that CTSZ plays a significant role in the infiltration of T cells.10 CTSZ can enhance the infiltration of T cells through blood vessels, coordinating the tumor microenvironment and promoting the level of CD8A T cells in certain kinds of tumors.11 Also, CTSZ is reported to enhance the metastasis and migration of various cancers,12,13 and the upregulation of CTSZ was observed in several types of tumors, including colorectal, gastric, liver, prostate, melanoma, and pancreatic neuroendocrine tumors.14,15
The current research performed a comprehensive analysis of the impact of CTSZ on ccRCC, as well as its correlation with clinicopathological parameters and the prognosis of ccRCC. Furthermore, this study analyzed the methylation levels of CTSZ and chemotherapy resistance induced by CTSZ. We also investigated the potential mechanisms of CTSZ actions in ccRCC from the aspects of immune infiltration, biomarker correlations with immune checkpoint (IC) inhibitors, and the functional regulation network of CTSZ in ccRCC. In general, the present results indicated that CTSZ may provide a significant prognostic biomarker and a potential immunotherapy target.
Methods
Gene Expression Data
The genome location of CTSZ was analyzed utilizing the “Genome Data viewer” function (https://www.ncbi.nlm.nih.gov/genome/gdv/) of the National Center for Biotechnology Information. Gene Expression Profiling Interactive Analysis (GEPIA) was used to explore CTSZ expression levels in ccRCC and normal kidney tissues.16 Thirteen datasets based on the Oncomine database (https://www.oncomine.org/resource/login.html) were pooled to investigate CTSZ levels difference in normal and tumor tissues. The expression pattern of CTSZ in various types of tumors was investigated using The Tumor Immune Estimation Resource 2 (TIMER2) tool (http://timer.cistrome.org/).17
Survival Analysis
The GEPIA database was applied to calculate the survival curves, including overall survival (OS) and disease-free survival (DFS) according to CTSZ levels, and to investigate its correlation with pathologic stage.16 Using the HTSeq-FPKM format RNAseq data in The Cancer Genome Atlas (TCGA) database, the correlations between CTSZ levels and clinicopathological features were analyzed via the R system.
Expression Levels of CTSZ in Different Cell Types
The expression level of CTSZ in different cell types of ccRCC was first calculated through the GEPIA2021 webserver.18 The EPIC, CIBERSORT, and quanTIseq algorithms were utilized to calculate CTSZ levels in different cell types and are presented in the bar chart. Immunohistochemical staining of CTSZ, CD69, and CD163 in normal and ccRCC tissue was acquired from the Human Protein Atlas database (https://www.proteinatlas.org/). Double-labeling immunofluorescence (IF) staining was performed on ccRCC tissue sections for CTSZ (1:100, Santa Cruz, sc-376976), CD68 (1:1,000, Abcam, ab213363), CD8A (1:100, BioLegend, 372,902), and PD-1 (1:100, Cell Signaling Technology, 86,163). The stained cells were then visualized through a confocal microscope. Human ccRCC tissues were pathologically diagnosed as derived ccRCC cases after surgical resection at West China Hospital, Sichuan University. The study was conducted following the ethical guidelines of the Declaration of Helsinki. The Ethics Committee of West China Hospital approved this research and written informed consent was acquired from all patients. Single-cell sequencing data from ccRCC, including 34,326 cells, were obtained from the Single Cell Portal (https://singlecell.broadinstitute.org/single_cell)19 to examine CTSZ expression in macrophages.
Methylation Analysis
This study applied the Shiny Methylation Analysis Resource Tool (http://www.bioinfo-zs.com/smartapp/) to explore the impact of the methylation status of CTSZ on gene expression levels and survival rates. DNA methylation status is presented as beta values from the range of 0–1 (unmethylated to fully methylated). The correlation between CTSZ methylation level and clinicopathological parameters was then explored by UALCAN (http://ualcan.path.uab.edu/index.html).20 Furthermore, methylation status of CTSZ was calculated and visualized in the form of a waterfall plot using the MethSurv tool (https://biit.cs.ut.ee/methsurv/).21
Immune Infiltration Analysis
The correlation between CTSZ levels and immune cell infiltrates was investigated in the “Gene” module using TIMER (https://cistrome.shinyapps.io/timer/).22,23 In the “correlation” module, analysis of the association of CTSZ levels and gene biomarkers of immune cells followed that reported in previous studies.24–26 Using the data from TCGA-ccRCC, this study estimated immune cell infiltrates using the xCell algorithm, with findings visualized in the form of a heatmap. The “pheatmap” and “ggplot2” R packages were used to explore and visualize the expression levels of checkpoint-related genes including CTLA4, CD274, LAG3, HAVCR2, PDCD1LG2, PDCD1, SIGLEC15 and TIGIT based on CTSZ levels. In addition, GSCAlite27 was utilized to explore the association between the tumor microenvironment and CTSZ expression, CTSZ copy number variation or methylation levels. These results were visualized in the form of a correlation heatmap by applying the “ggplot2” R package.
CTSZ-Associated Gene Enrichment Analysis
The CancerSEA webserver (http://biocc.hrbmu.edu.cn/CancerSEA/)28 was used to show the correlation between CTSZ levels and functional states of ccRCC. Data of ccRCC gene expression levels in HTSeq-TPM were acquired from the TCGA database, and high or low CTSZ levels were defined by a 75% or 25% cutoff, respectively. This study utilized the “DESeq2” R package to analyze CTSZ-correlated genes and applied the “ggplot2” R package to visualize the results of positively- and negatively-correlated genes. Furthermore, the “clusterProfiler” and “org.Hs.e.g.db” R packages were applied to make Gene Ontology (GO)/Kyoto Encyclopedia of Genes and Genomes (KEGG) analysis, and the outcomes were visualized through the “ggplot2” and “GOplot” R packages. The adjusted p value and the cutoff values of log2FoldChange and were chosen at 0.05 and 1.5, respectively.
The pathway activation/inhibition analyses and gene set enrichment analysis were performed by the “clusterProfiler” and “ggplot” R packages. A Joy plot showed pathways with the top 10 normalized enrichment scores.
The Protein-Protein Interaction (PPI) Network Construction and Drug Sensitivity Analysis
GeneMANIA was utilized to construct CTSZ-related PPI networks. This online tool can use several bioinformatics methods (ie, pathways, protein, and genetic interactions, colocalization, co-expression, and protein domain similarity) to construct networks of certain genes. Based on data from TCGA and Genomics of Drug Sensitivity in Cancer (GDSC) databases, the chemotherapeutic response of each sample was predicted by the “pRRophetic” R package. The correlation between CTSZ levels and drug sensitivity was investigated using the GSCAlite tool27 based on data from the Cancer Therapeutics Response Portal (CTRP) and GDSC. The correlation was determined by Spearman correlation methods with the drug sensitivity/small molecule (half-inhibitory concentration, IC50). To determine the correlation between CTSZ expression and therapy, RNA-seq and survival data were obtained from previous clinical trials and analyzed; NCT01668784 (a Phase III clinical study comparing everolimus vs nivolumab in previously treated cases with metastatic ccRCC, CheckMate025), and NCT01354431 (a Phase II study of nivolumab in cases with metastatic ccRCC, CheckMate 010).29
Results
High CTSZ mRNA Expression
This research mainly focused on the role of CTSZ (located on chromosome 20, Supplementary Material 1A) in ccRCC. The TCGA database was utilized to explore CTSZ mRNA expression in ccRCC and peritumor tissues. As shown in Figure 1A, CTSZ was overexpressed in tumor tissues of ccRCC and kidney renal papillary cell carcinoma (KIRP) compared with normal peritumor tissues. However, in kidney chromophobe (KICH) tissues, no significant difference was observed between CTSZ expression in tumor and peritumor tissues. The matched samples between tumor and normal tissues showed similar trends (Figure 1B). Receiver operating characteristic (ROC) curves were generated to investigate the diagnostic values of CTSZ for ccRCC, KIRP, and KICH, and the area under the curves (AUCs) were 0.905, 0.881, and 0.597, respectively (Supplementary Material 1B).
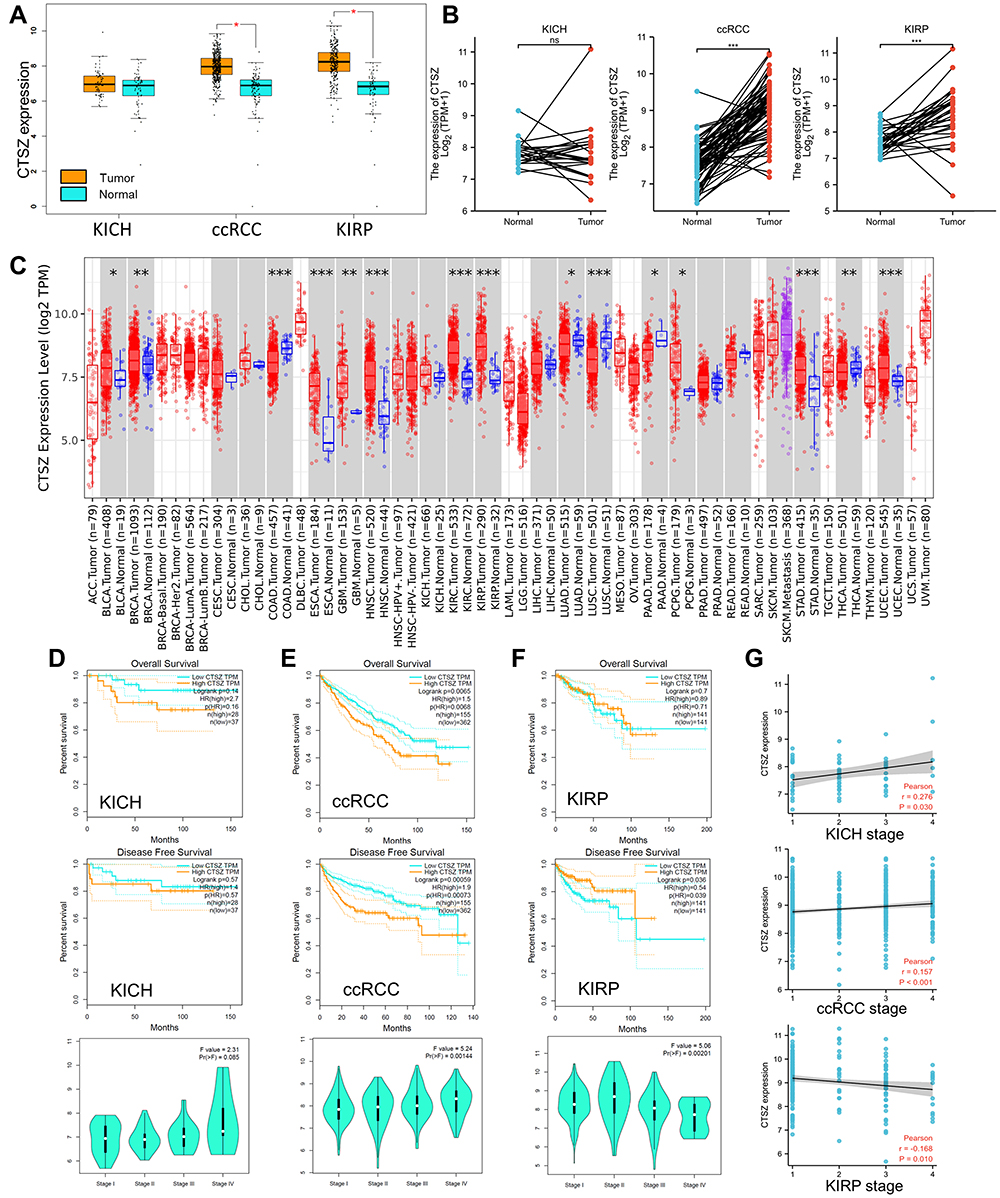 |
Figure 1 CTSZ expression and the prognostic value of CTSZ in KICH, ccRCC, and KIRP. (A) CTSZ expression difference between cancer and normal tissues in KICH, ccRCC, and KIRP. (B) Higher CTSZ expression level in matched samples of ccRCC and KIRP compared to normal tissues. (C) Expression of the CTSZ gene across different cancers, where red and blue represent tumor and normal tissue, respectively. The statistical significance computed by the Wilcoxon test is annotated by the number of stars. Survival curves of patients with high or low CTSZ expression levels and the correlation between CTSZ levels and pathological stages in KICH (D), ccRCC (E), and KIRP (F). (G) Correlation analysis between tumor stage and CTSZ expression. KICH, kidney Chromophobe. ccRCC, kidney renal clear cell carcinoma. KIRP, kidney renal papillary cell carcinoma. *p value < 0.05; **p value <0.01; ***p value <0.001. |
The pooled analysis of thirteen Oncomine datasets showed that CTSZ was overexpressed in kidney cancer tissues compared with normal tissues (Supplementary Material 1C, P<0.001). CTSZ was also overexpressed in other tumors compared with peritumor tissues (Figure 1C).
Survival Analysis
Based on TCGA and GTEx datasets, OS and DFS analyses were conducted using the GEPIA tool to investigate the correlation of CTSZ levels with the prognosis of kidney cancer. Significantly worse OS and DFS was observed in cases with high CTSZ levels in the pathological type of ccRCC but not in KICH or KIRP (Figure 1D–F). The expression level of CTSZ in different pathological stages was further explored, and the correlation between CTSZ levels and tumor stages was identified (Figure 1G). A positive correlation between CTSZ levels and tumor stages, including ccRCC (Cor: 0.157, P<0.001) and KICH (Cor: 0.276, P=0.030), was observed. However, the tumor stage of KIRP was negatively correlated with CTSZ levels (Cor: −0.168, P=0.010). The CTSZ level was also an independent prognostic risk factor in ccRCC (HR: 1.308, 95% CI: 1.058–1.617, P=0.013, Supplementary Material 2A) and KICH (HR: 3.593, 95% CI: 1.169–-11.558, P=0.032, Supplementary Material 2B) after adjustment for age and sex. These findings indicated that the overexpression of CTSZ may predict a worse prognosis and advanced pathological stages for cases with ccRCC cases.
Clinicopathological parameters of patients with high or low CTSZ levels were compared with the data from TCGA cohorts. Relatively advanced ccRCC stage (P=0.036), metastasis stage (P=0.003), and pathologic stage (P=0.010) were observed in cases with ccRCC and exhibiting CTSZ overexpression (Table 1). In addition, the CTSZ expression level was also correlated with sex and age, and a higher proportion of males (P<0.001) and younger ages (P=0.016) were found in patients with ccRCC and high CTSZ expression.
 |
Table 1 Clinicopathological Parameters of Patients with High or Low CTSZ Level from TCGA Cohorts |
CTSZ Overexpressed in Macrophages
The protein level of CTSZ in ccRCC was explored by immunohistochemical staining. Despite the finding that CTSZ mRNA expression was upregulated in ccRCC, the expression level of CTSZ protein was relatively low in tumor cells. However, CTSZ had a punctate or clustered expression pattern, similar to the expression pattern of biomarkers on immune cells, such as T cells and macrophages. It was also found that cases of ccRCC and with CTSZ overexpression also had relatively high levels of CD68 and CD163 (Figure 2A), which serve as specific markers of macrophages, suggesting that CTSZ may serve as a macrophage-specific marker.
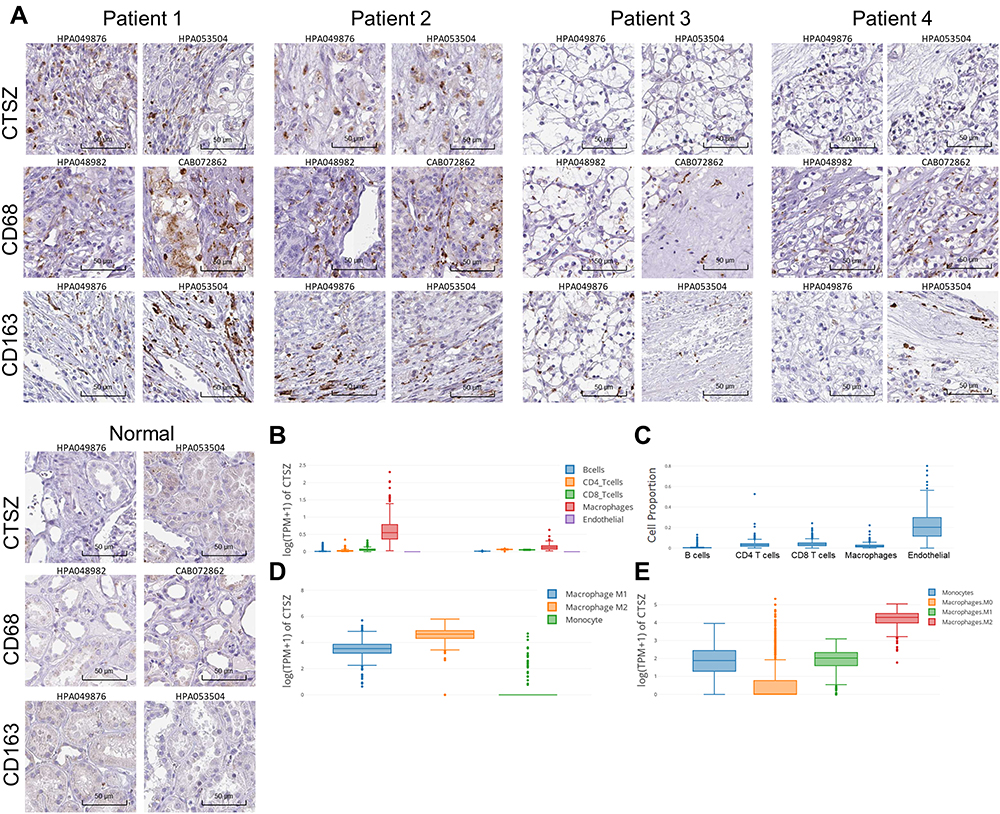 |
Figure 2 Immunohistochemical staining and CTSZ expression levels in different cell types in ccRCC tissues. (A) Immunohistochemical staining of CTSZ, CD68 and CD163 expression levels in ccRCC and normal tissues according to the Human Protein Atlas database. (B) CTSZ expression levels in ccRCC and normal tissues in B cells, CD4+ T cells, CD8+ T cells, macrophages, and endothelial cells. (C) Cell proportion in ccRCC based on the data from TCGA. CTSZ expression levels in macrophage subclasses calculated by the CIBERSORT (D) and quanTIseq (E) algorithms. |
Furthermore, based on the TCGA database, CTSZ levels in different cells were calculated by the EPIC algorithm via the online tool GEPIA 2021. As shown in Figure 2B, CTSZ was more highly expressed in macrophages of ccRCC tissue compared with macrophages of normal cells or other cells in tumor tissue. Epidermal cells occupied a larger proportion of cell types in tumor tissue than macrophages, indicating that the high level of CTSZ expression in macrophages was not attributed to the high proportion of macrophages (Figure 2C). The CTSZ levels in subtypes of macrophages were then explored by CIBERSORT (Figure 2D) and the quanTIseq algorithm (Figure 2E).
The expression level of CTSZ in macrophages was further explored in ccRCC using UMAP (uniform manifold approximation and projection) plots (Figure 3A–D) according to a single-cell database. This analysis found that CD68, CD163, CD86, and CD4 were co-expressed with CTSZ (Figure 3E). The expression levels of CD68, CD163, CD86, CD4, and CD8A were examined using UMAP plots (Figure 3F), and co-expression correlations were examined between CTSZ and CD68, CD163, CD86, CD4, or CD8A in single cells (Supplementary Material 2C). A significant trend was found in the co-expression of CD68, CD163, CD86, and CD4 with CSTZ compared with CD8A, which was used as a negative control group. Following cell clustering and annotation in ccRCC, CTSZ expression in different cell types was examined in the form of a violin plot (Figure 3G), which suggested that CTSZ was specifically expressed in macrophages.
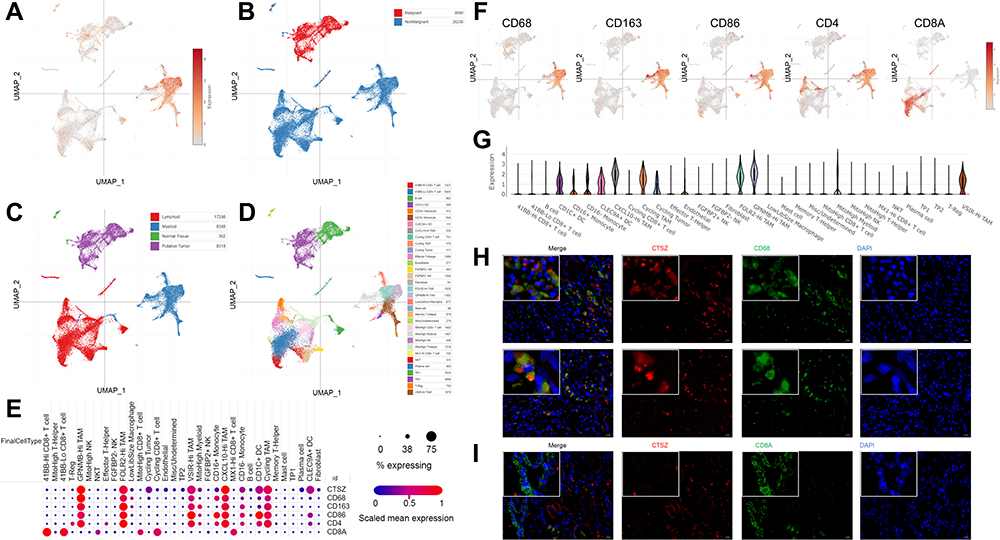 |
Figure 3 Single-cell analysis and immunofluorescent staining revealing CTSZ levels in different cell types of ccRCC tissues. UMAP plot showing CTSZ expression levels (A) and the different clusters including malignant and nonmalignant cells (B), tumor cells, lymphoid cells, myeloid cells, and normal tissues (C), and different cell types (D) in ccRCC tissues. (E) The expression levels of CTSZ, CD68, CD163, CD86, CD4, and CD8A in different cell types, CTSZ was co-expressed with CD68, CD163, CD86, and CD4, but not in CD8A. (F) UMAP plot showing CD68, CD163, CD86, CD4 and CD8A in different clusters. (G) CTSZ expression pattern in different cell types in the form of violin plots. (H) Immunofluorescent staining of CTSZ (red) and CD68 (green) in ccRCC tissues, indicating the expression of CTSZ was macrophage specific. (I) Immunofluorescent staining of CTSZ (red) and CD8A (green) in ccRCC tissues. Abbreviation: UMAP, uniform manifold approximation and projection. |
The potential macrophage-specific marker CTSZ was then investigated by double-labeling IF staining. The IF assay showed that CTSZ and CD68 were colocalized, indicating that CTSZ was specifically overexpressed in macrophages (Figure 3H). The IF assay of CTSZ and CD8A was conducted as a negative control group, and no correlation between CTSZ and CD8A was observed (Figure 3I).
Immune Infiltration Analysis
We explored the role of CTSZ in immune infiltrates of ccRCC (Figure 4A) through the TIMER database. We observed a significant correlation between the CTSZ levels and the abundance of B cells (cor=0.347, P<0.001), macrophages (cor=0.407, P<0.001), neutrophils (cor=0.389, P<0.001), and dendritic cells (cor=0.461, P<0.001). To further identify the impact of CTSZ on tumor immune cell infiltrates, two groups were classified according to CTSZ levels, and significant immune microenvironment differences were found between these two groups (Figure 4B). The group with high CTSZ levels had higher infiltrated levels of M1 and M2 macrophages, monocytes, myeloid, and plasmacytoid dendritic cells, CD8+ central memory T cells, CD4+ effector memory T cells, CD4+ Th1 T cells, CD4+ Th2 T cells, CD8+ effector memory T cells, naïve B cells, memory B cells, plasma B cells, and class-switched memory B cells. Higher immune and microenvironment scores were also observed in the high CTSZ group, indicating that the CTSZ expression level was closely correlated with immune infiltrates and affected the immune microenvironment of ccRCC.
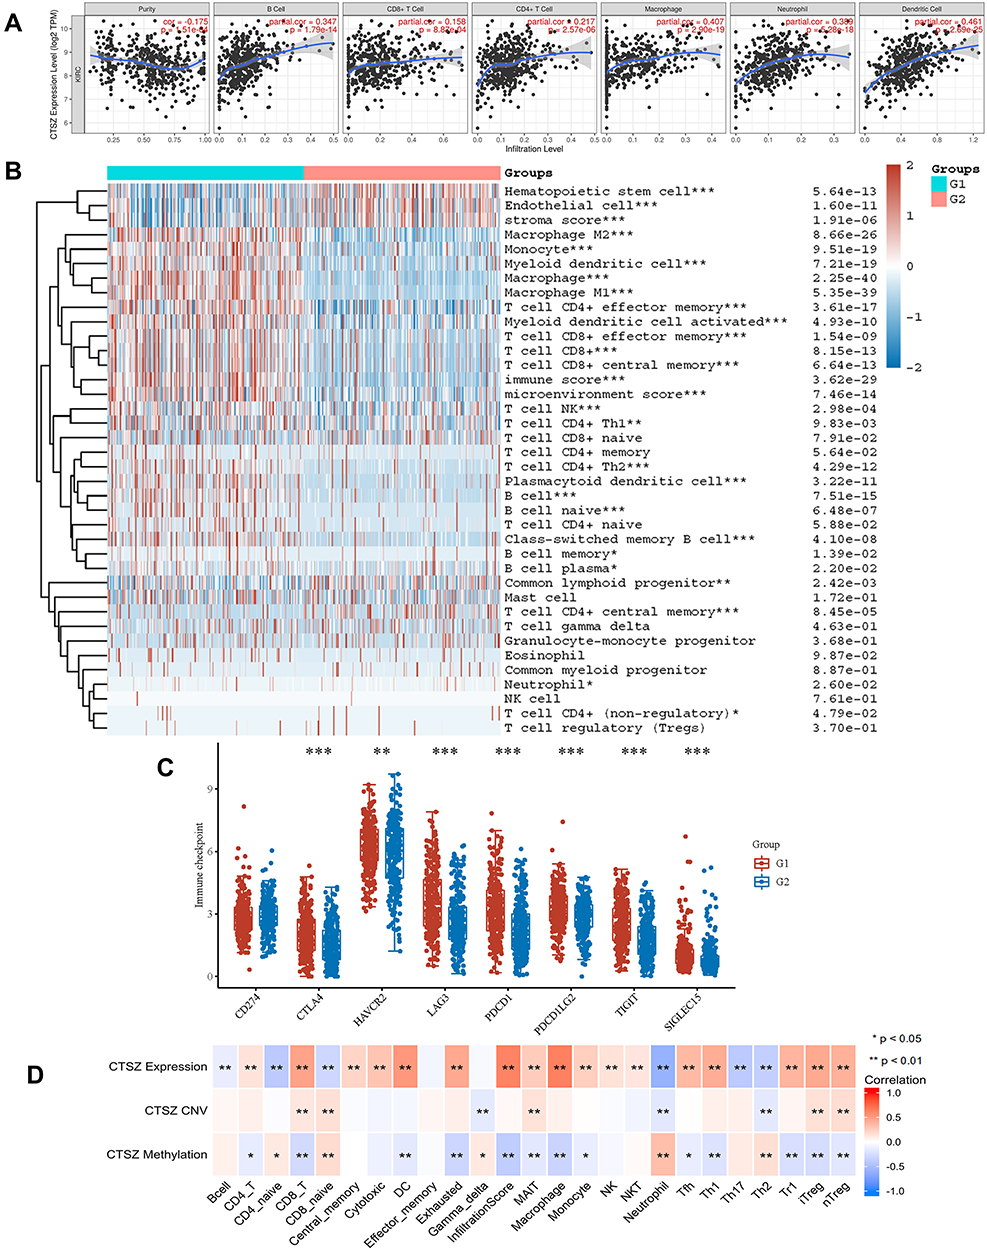 |
Figure 4 CTSZ expression and immune cell infiltration status in KRIC. (A) The correlation between CTSZ expression and the abundance of infiltrating immune cells (TIMER). (B) Immune cell score heatmap. Different colors indicate the expression trend in different samples. (C) The immune checkpoint-related gene expression in groups classified by CTSZ expression. The Wilcoxon test was utilized to analyze the significant difference between the two groups. (D) The correlation between immune cell subtype immersion and CTSZ expression, CTSZ CNV, or CTSZ methylation levels in ccRCC (GSCAlite). ccRCC, kidney renal clear cell carcinoma. CNV, copy number variations. Group 1: High CTSZ expression. Group 2: Low CTSZ expression. *p < 0.05, **p < 0.01, ***p < 0.001. Abbreviation: CNV, copy number variations. |
The association between CTSZ and IC-related gene expression in ccRCC was examined for the abovementioned two groups (defined according to CTSZ expression levels). In the high CTSZ expression group, a higher expression of IC-related genes, including CTLA4, LAG3, HAVCR2, PDCD1LG2, PDCD1, TIGIT, and SIGLEC15 (Figure 4C), were observed. The association of CTSZ with other immune cell gene biomarkers reported in previous studies was explored (Table 2). The biomarkers of T cells (CD3D, CD3E, and CD2), CD8+ T cells (CD8A and CD8B), monocytes (CD86 and CD115), B cells (CD19 and CD79A), and tumor-associated macrophages (CD68 and IL10) showed a significant correlation with CTSZ levels in KIRD. Biomarkers of M1 macrophages, M2 macrophages and neutrophils, including CD163, IRF5, MS4A4A, VSIG4, CCR7, and CD11b, showed a positive correlation with CTSZ expression. The case of ccRCC with a high CTSZ expression level also exhibited high levels of KIR2DL4, HLA-DPB1, HLA-DRA, and BDCA-1, which are biomarkers of natural killer or dendritic cells. All markers of T helper 1 cells, T helper 17-cells and T-cell exhaustion were significantly correlated with CTSZ expression. Thus, CTSZ levels were significantly associated with IC-related biomarkers, suggesting CTSZ may play a critical role in immunological treatment of ccRCC.
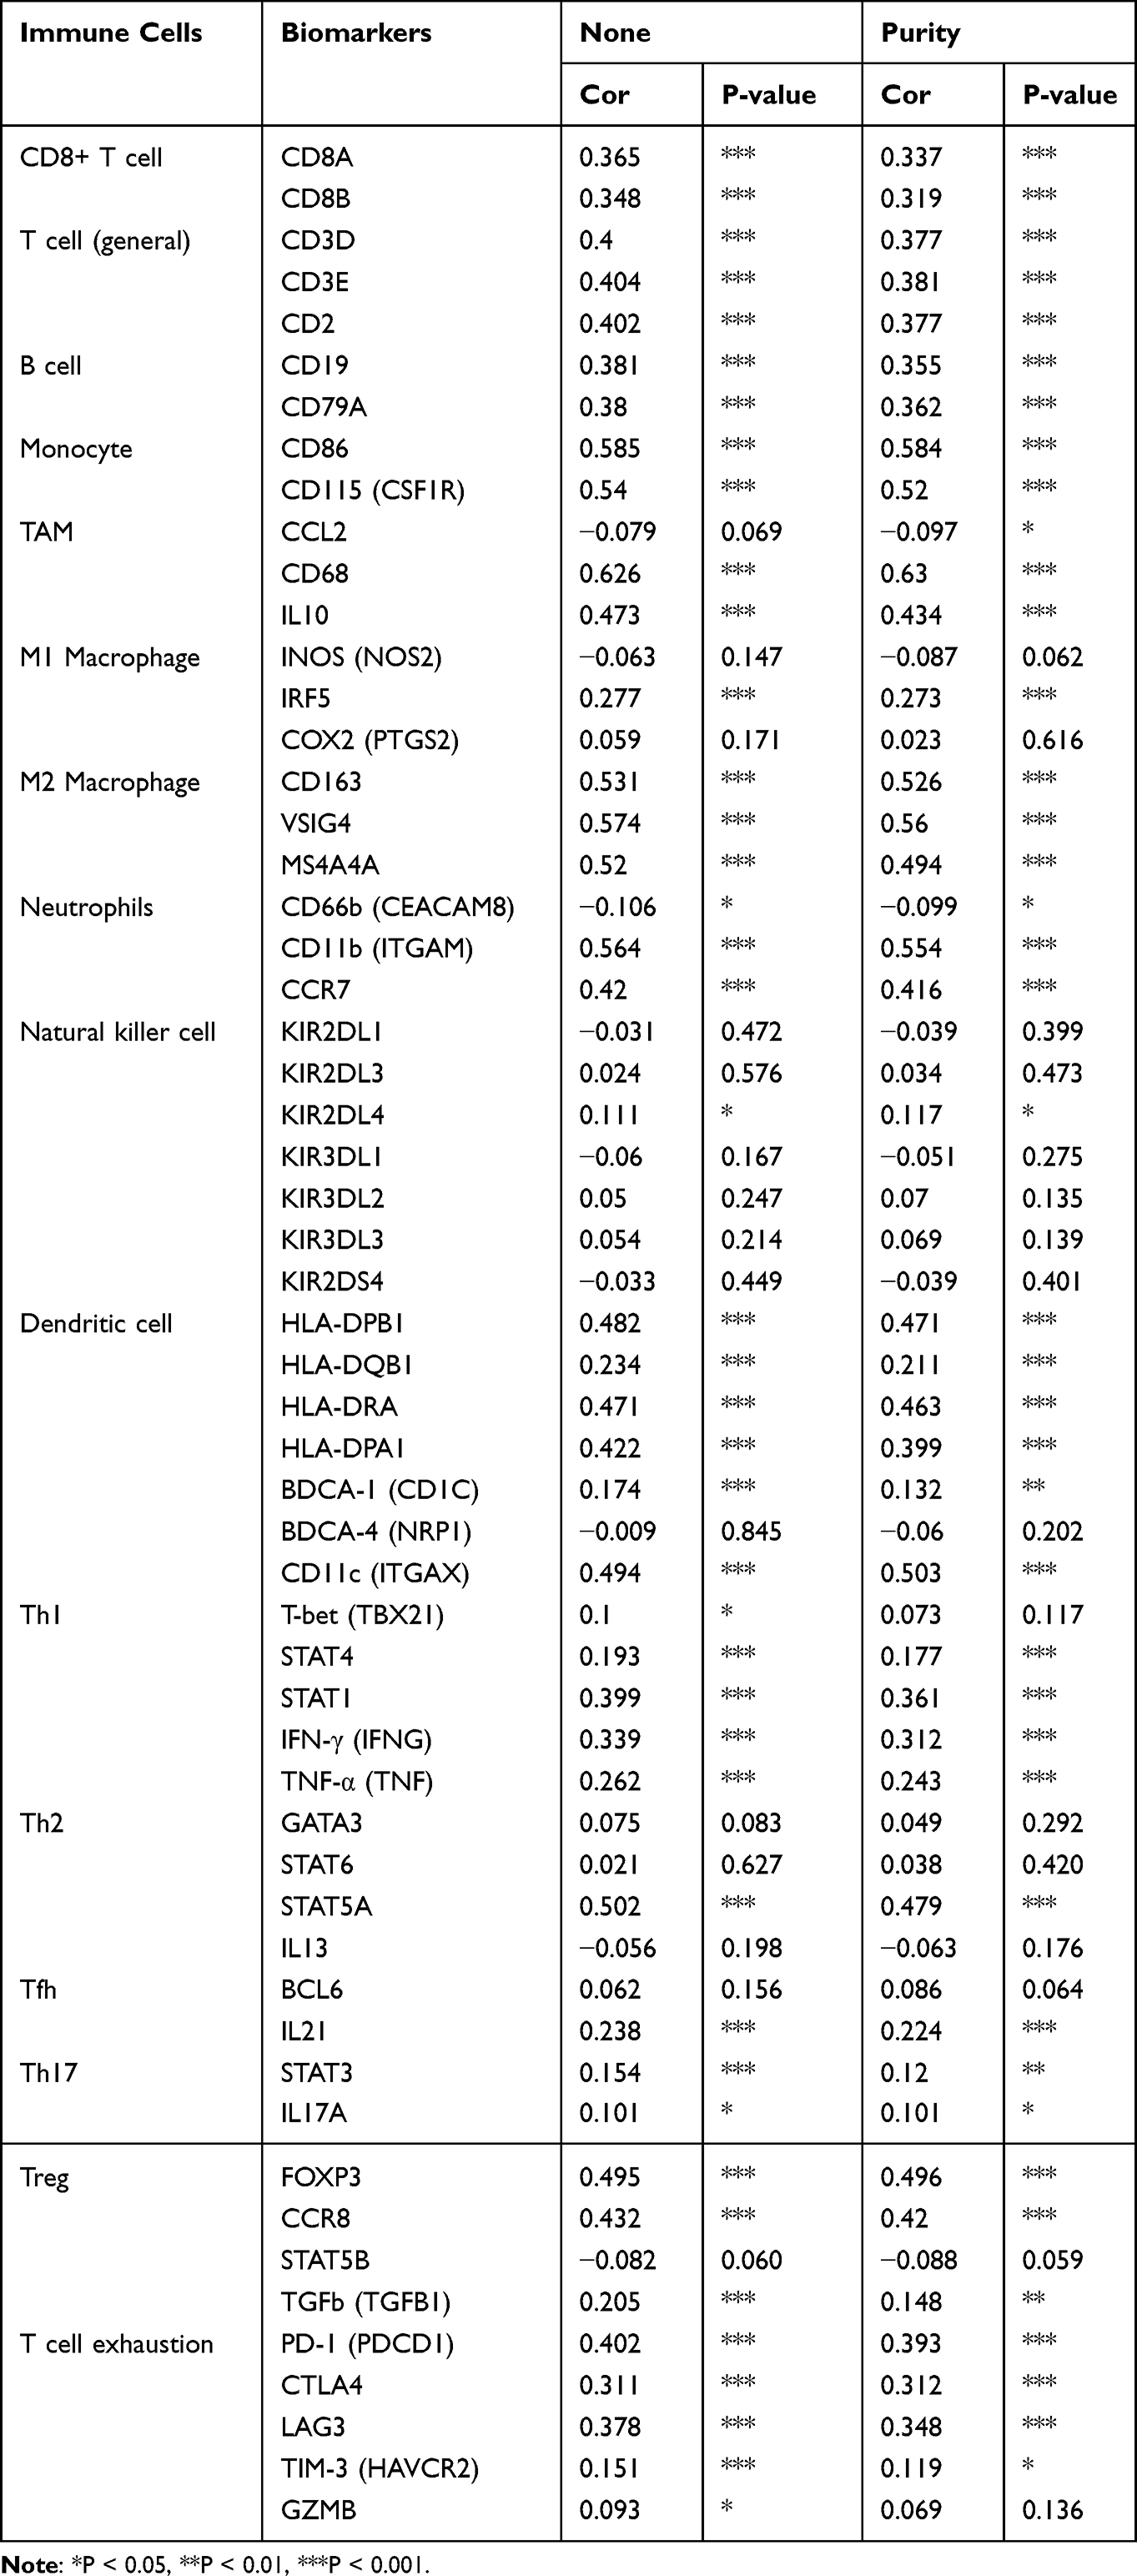 |
Table 2 Association of CTSZ Level with Immune Cell Gene Biomarkers |
Similar trends for immune infiltrates in ccRCC were also found through the GSCAlite tool. The expression level of CTSZ was positively correlated with the infiltration of 17 immune cell subtypes and negatively correlated with the infiltration of 6 subtypes (Figure 4D). Remarkably, exhausted T cells were significantly associated with CTSZ expression, whereas there was no correlation between gamma delta T cells and CTSZ levels. In addition, CTSZ copy number variation and methylation status was also significantly associated with certain types of immune cell infiltrates (Figure 4D).
Enrichment Analysis of CTSZ-Associated Genes
This study first investigated the functional states of different cancers according to CTSZ expression levels (Figure 5A). The expression level of CTSZ was positively associated with stemness (correlation: 0.34, P<0.05) and angiogenesis (correlation: 0.31, P<0.05) of ccRCC (Figure 5B–D), whereas ccRCC apoptosis (correlation: −0.49, P<0.05) was significantly and negatively associated with CTSZ levels (Figure 5E and F), consistent with the observation that cases with high CTSZ levels had a worse prognosis.
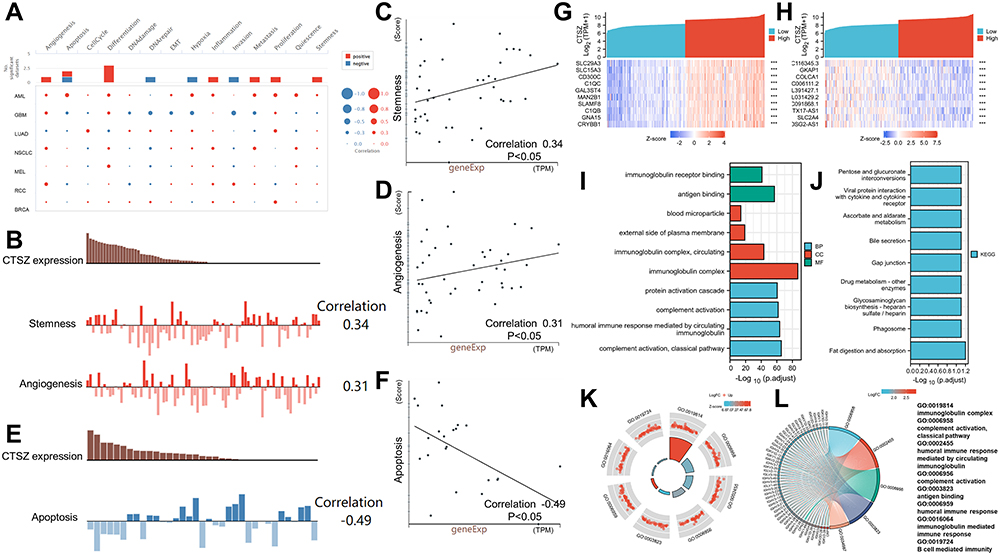 |
Figure 5 Functional states of CTSZ and enrichment analysis. (A) The functional states of CTSZ across nine types of cancer by CancerSEA. The red plots indicate that CTSZ was positively correlated with the functional states, while the blue plots indicate that CTSZ was negatively correlated with the functional states. (B) CTSZ expression level and the corresponding tumor stemness score and tumor angiogenesis score of each patient with ccRCC. (C) Scatterplots of correlations between CTSZ expression and stemness of ccRCC. (D) Scatterplots of correlations between CTSZ expression and angiogenesis of ccRCC. (E) CTSZ expression level and the corresponding tumor angiogenesis score of each patient with ccRCC. (F) Scatterplots of correlations between CTSZ expression and apoptosis of ccRCC. The top 10 positively (G) and negatively (H) related genes. GO analysis (I) and KEGG pathway enrichment analysis (J) of CTSZ coexpressed genes. Immune-related results of GO enrichment analysis were visualized in chord (K) and GOCircle plots (L). ***P < 0.001. |
To understand the potential molecular mechanism of CTSZ expression levels impacting immune infiltration in ccRCC, this study identified and enriched CTSZ-correlated genes. A total of 1738 CTSZ-correlated genes were screened through TCGA-ccRCC cohorts. As shown in Figure 5G and H, the top 10 positively or negatively co-expressed genes of CTSZ were plotted in the form of a heatmap. Further GO analysis revealed that CTSZ-positively co-expressed genes were mainly involved in classical pathway, complement activation, immunoglobulin complex, humoral immune response mediated by circulating immunoglobulin, and immunoglobulin complex pathways (Figure 5I). KEGG enrichment analysis indicated that CTSZ co-expressed genes were primarily enriched in fat digestion and absorption and phagosome pathways (Figure 5J). Immune-related terms are presented in the form of a GO Circle (Figure 5K) and chord plots (Figure 5L).
Gene set enrichment analysis also revealed immune-associated gene sets, including FceRI-mediated NF KB activation, immunoregulatory interactions in nonlymphoid and lymphoid cells, initial triggering of complement, creation of c4 and c2 activators, signaling by the B-cell receptor BCR, complement cascade, type II interferon (IFN) signaling IFNG regulation of IFNG signaling, and IRF3-mediated induction of type I IFN (Supplementary Materials 3 and 4).
CTSZ Methylation Analysis
Analysis of CTSZ methylation status in ccRCC using data from TCGA-ccRCC found significantly different methylation levels of the CTSZ promoter between ccRCC and normal tissues (Figure 6A). Moreover, the CTSZ promoter methylation level was negatively associated with tumor grade (Figure 6B) and CTSZ expression (Figure 6C). There was no association between the CTSZ methylation level and patients’ parameters, including race, sex, and age, however, nodal metastasis status was negatively associated with the CTSZ methylation level (Supplementary Material 5A). In addition, CTSZ hypomethylation of multiple probes and corresponding CTSZ overexpression was observed (Figure 6D, Supplementary Material 5B). The probes most negatively associated with CTSZ expression were cg02744249 (R=−0.55, P<0.001), cg02744249 (R=−0.55, P<0.001), and cg22145559 (R=−0.54, P<0.001), which are located on CPG islands, indicating that CTSZ expression in ccRCC tissues may be regulated by methylation modification-related mechanisms. Some probes (cg18563860, cg08545593, cg13795831, cg00539174, cg06942450, cg20278790, cg12831034, cg17398227, cg01623438, cg21331324, and cg22145559) also exhibited a correlation between poor OS of ccRCC and CTSZ hypomethylation (Figure 6E, Supplementary Material 6).
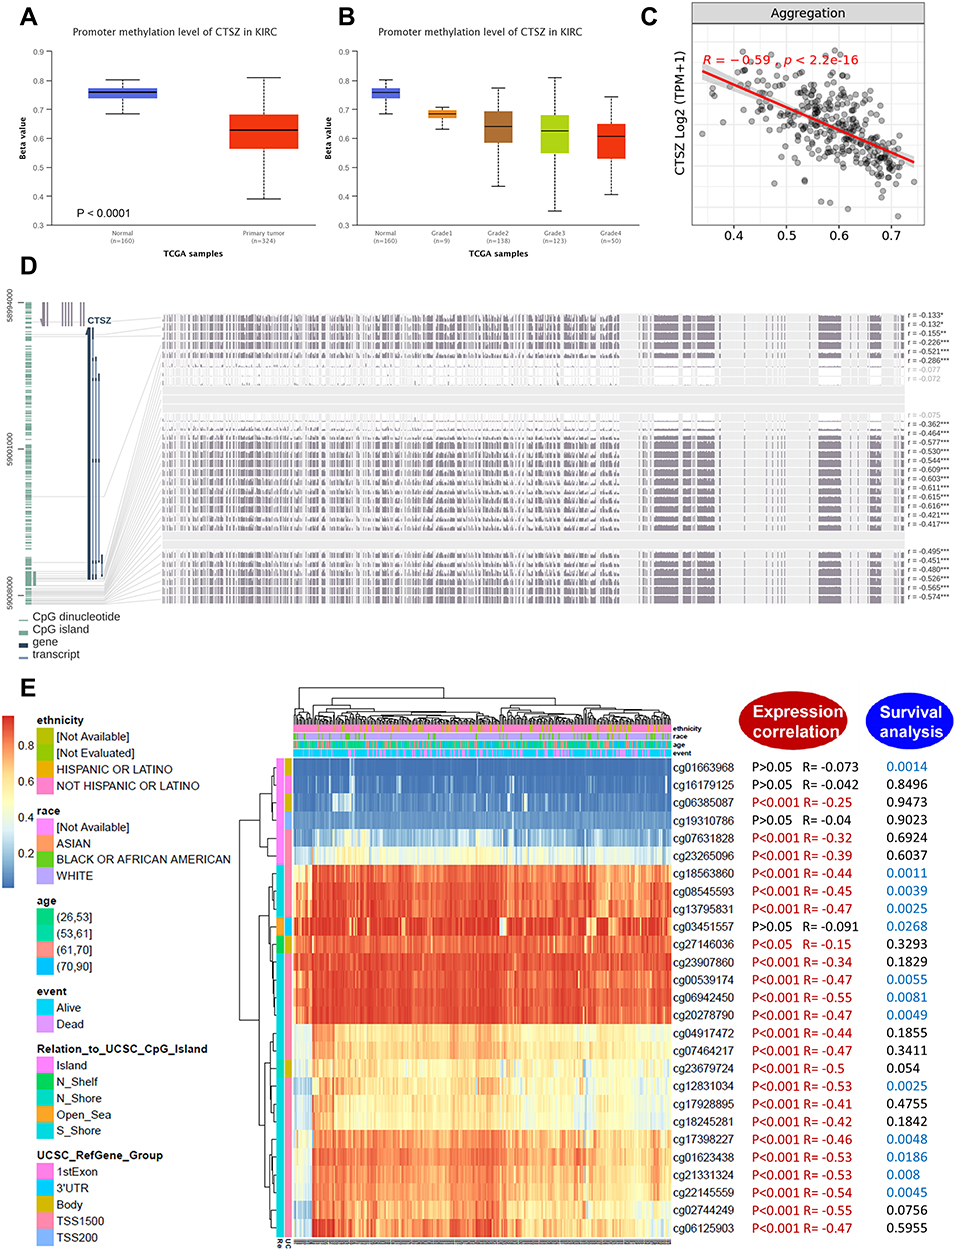 |
Figure 6 DNA methylation analysis of the CTSZ gene in ccRCC patients. (A) CTSZ promoter methylation level between ccRCC and normal tissue. (B) CTSZ promoter methylation profile based on ccRCC tumor grade. (C) Correlation between CTSZ expression level and methylation in ccRCC. (D) The correlation between CTSZ expression in ccRCC and the methylation status of different sites. (E) Waterfall plot of potential methylation probes targeting the CTSZ gene in ccRCC. The correlations between CTSZ methylation and gene expression level or survival rate were also analyzed. P<0.05 was considered statistically significant and is marked red for expression correlation and blue for survival analysis. |
PPI Networks, Pathway, and Drug Sensitivity Analysis
A PPI network was constructed through GeneMANIA to define the genes correlated with CTSZ (Figure 7A). Analysis of common cancer-related pathways, including cell cycle, apoptosis, epithelial‐to‐mesenchymal transition (EMT), DNA damage response, androgen receptor, estrogen receptor, RAS/mitogen-activated protein kinase (MAPK), phosphatidylinositol-3-kinase/AKT, tuberous sclerosis complex (TSC)/mammalian target of rapamycin (mTOR), and receptor tyrosine kinase, found that CTSZ was involved in cell cycle, apoptosis, estrogen receptor, EMT, RAS/MAPK and TSC/mTOR pathway activities (Supplementary material 7A).
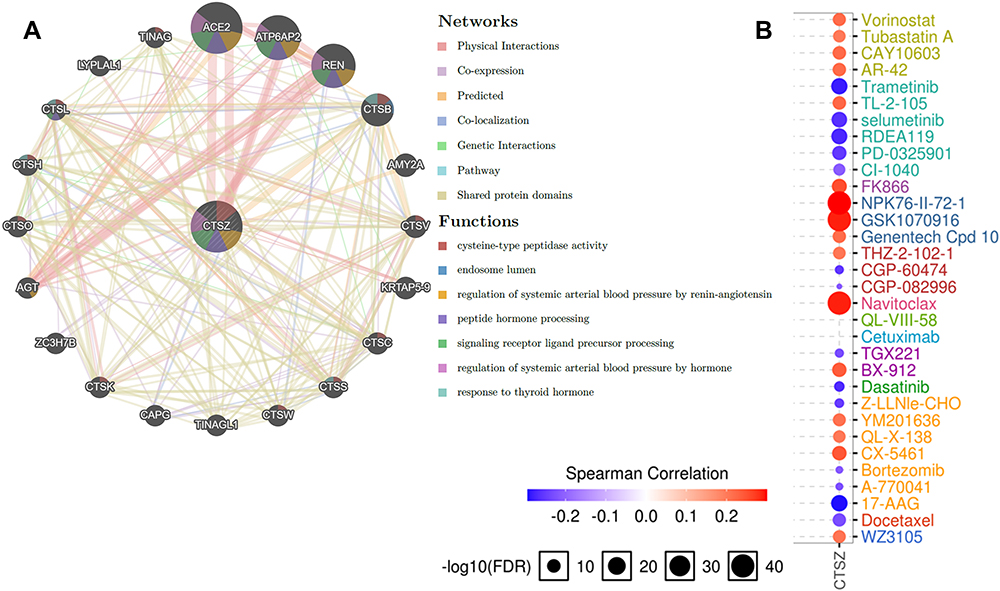 |
Figure 7 Protein–protein interaction (PPI) network and drug sensitivity analysis of CTSZ. (A) PPI network and functional analysis of CTSZ and its neighboring genes. Different colors of the network edge indicate the bioinformatics methods applied: physical interaction, coexpression, website prediction, colocalization, pathway and genetic interactions, and shared protein domains. The different colors of network nodes indicate the enrichment results of the gene set. The size of each circle represents the rank of gene that correlated with CTSZ. The width of each line represents the weight of the corresponding individual data source in the composite network. (B) Correlation between CTSZ expression and small molecule/drug sensitivity (IC50) based on the GDSC database. Abbreviations: IC50, half-inhibitory concentration; GDSC, Genomics of drug Sensitivity in Cancer. |
Next, the role of CTSZ in drug sensitivity was evaluated. Supplementary Material 7B shows that CTSZ expression was correlated with the IC50 scores of several common drugs used for ccRCC. High expression levels of CTSZ were correlated with resistance to axitinib and pazopanib, while low CTSZ levels were correlated with resistance to erlotinib, temsirolimus, and sunitinib. Online databases of drug sensitivity analysis were further used to investigate the impact of CTSZ levels on drug sensitivity. As shown in Figure 7B, drug sensitivity analysis according to the GDSC database indicated that high CTSZ expression levels were related to the resistance of 16 small molecules or drugs, whereas low CTSZ expression was related to resistance of 14 drugs or small molecules. In addition, Supplementary Material 8 presents the correlation between high CTSZ expression and resistance to 102 drugs or small molecules based on data from CTRP. These results may indicate that CTSZ is a potential biomarker for drug screening.
The correlation of CTSZ with immunological therapies was then explored by analyzing the data from clinical trials. According to tumor shrinkage after therapies, patients were divided into no clinical benefit (NCB), intermediate clinical benefit (ICB), and clinical benefit (CB) groups. The ICB cases were included in the CB group for subsequent analysis. Significantly prolonged OS (HR 1.51, 95% CI 1.02–2.23, P=0.039) was observed in patients with low CTSZ levels and treated with nivolumab (Figure 8A). However, the distribution of patients (P=0.274) and the survival analysis of progress free survival (PFS, P=0.25) between high and low CTSZ expression levels were not statistically different. In contrast, the proportion with NCB in high and low CTSZ expression patients who received everolimus (P=0.022) was significantly different, indicating that patients with low CTSZ levels may have a better response to everolimus and a better PFS, whereas the OS was not prolonged (Figure 8B). Double-labeling IF staining also revealed that CTSZ and PD-1 were co-expressed in ccRCC tumor tissues (Figure 8C).
 |
Figure 8 Response to nivolumab and everolimus in high and low CTSZ expression patients. (A) Proportion of nivolumab response and survival analysis of OS and PFS in high and low CTSZ expression patients who received nivolumab. (B) Proportion of everolimus response and survival analysis of OS and PFS in high and low CTSZ expression patients who received everolimus. (C) Immunofluorescent staining of CTSZ (red) and PD1 (green) in ccRCC tissues. The cut-off values of grouping is determined by the grouping with the lowest P-value. |
Discussion
The CTSZ gene has been found to regulate the migration and adhesion of both tumor and immune cells. CTSZ is considered to participate in the migration process not by ECM degradation, but through its nonproteolytic functions related to integrin-mediated adhesion, which is a prerequisite for the migration course.30 Previous studies have reported the clinical predictive values of CTSZ in various tumors.31,32 However, the impact of CTSZ in ccRCC has not yet been clarified. Thus, the current bioinformatics analysis was conducted to explore the role of CTSZ in the tumor immune microenvironment and immunotherapy, as well as its expression levels, diagnostic and prognostic value, methylation status, and functional regulation networks in renal cancer.
In the current study, expression analysis indicated that CTSZ mRNA was upregulated in ccRCC compared with normal tissues. Also, CTSZ was found to act as a prognostic marker for cases with ccRCC, as high CTSZ levels were significantly correlated with worse OS and DFS. Likewise, CTSZ was also overexpressed in KIRP samples compared with normal tissues. However, the current study found no difference in the overall survival of patients with different CTSZ levels, and the KICH dataset was relatively small. Thus, this study mainly focused on ccRCC, the prognosis of which was significantly correlated to the level of CTSZ expression. Previous studies have reported the predictive value of CTSZ in various types of cancer. Vizin et al found that CTSZ was upregulated in colorectal cancer, and its total serum level served as a powerful predictive prognostic marker for patients with colorectal cancer.33 In another study, Nägler et al showed differences in CTSZ expression in prostate cancer and peritumor tissues at the protein level, indicating its function in prostate cancer tumorigenesis.34
Methylation is an essential epigenetic mechanism involved in many basic biological processes. Gene promoter methylation is usually related to transcriptional silencing, and methylation of the gene is often a sign of transcriptional activity.35 The present study found that the hypomethylation status of multiple sites (including cg18563860, cg08545593, cg13795831, cg00539174, cg06942450, cg20278790, cg12831034, cg17398227, cg01623438, cg21331324, and cg22145559) in CTSZ was significantly related to CTSZ overexpression and a clinically worse survival of cases with ccRCC. It is of great significance to further explore the impact of different CTSZ methylation sites on CTSZ expression and survival outcomes of patients with ccRCC.
The co-expression of CTSZ and immune cells markers were further explored. CTSZ was initially found to be associated with immune cell activities, including the regulation of maturation, proliferation, adhesion, migration, phagocytosis, and signal transduction.36 The current study revealed a significant correlation between CTSZ expression and the abundance of CD8+ T cells, CD4+ T cells, B cells, neutrophils, macrophages, and dendritic cells. Single-cell database analysis and double immunofluorescence localization showed that CTSZ was specifically expressed in macrophages. The present study also revealed that CTSZ levels were associated with the expression of most IC inhibitor-related markers, which serve as IC inhibitors, or involved in the progression and tumorigenesis of ccRCC.37 This result may indicate that CTSZ affects the tumor microenvironment through macrophages and other immune cell infiltrates and further regulates ccRCC tumorigenesis and may play a critical role in the resistance and sensitivity of immune-based therapy. The significant correlation found between CTSZ and exhausted T cells may explain the contradiction between the enhancement of immune infiltration and the relatively poorer prognosis of patients with ccRCC, whereas no significant association between CTSZ levels and gamma delta T cells was found.
Enrichment analysis to identify the enrichment terms of CTSZ in ccRCC indicated that CTSZ was associated with FceRI-mediated NFKB activation, immunoregulatory interactions in nonlymphoid and lymphoid cells, the initial triggering of complement, the creation of c4 and c2 activators, signaling by the B-cell receptor BCR, and the complement cascade. These findings are consistent with the abovementioned results showing that CTSZ was correlated with immune reactions. In addition, cancer hallmarks indicated that CTSZ was involved in cell cycle, apoptosis, EMT, estrogen receptor, RAS/MAPK, and TSC/mTOR pathway activities. Previous studies have also reported correlations between CTSZ and these pathways. Tuo et al found that CTSZ expression promoted cancer metastasis and invasion by affecting EMT in colorectal cancer.38 Teller et al demonstrated that carcinogenesis of gastric cancer was affected by CTSZ expression through the dysregulation of apoptotic signaling pathways.31 Drug sensitivity analysis revealed that cells with CTSZ overexpression were resistant to most drugs in the GDSC and CTRP databases. These findings were then supported by sequencing and survival data from clinical trials, indicating that CTSZ may act as a predictive marker for the diagnosis and prognosis of ccRCC, and provide a therapy target. The activation of TSC/mTOR pathway activities in patients with high CTSZ levels may help explain the potential mechanism of sensitivity to temsirolimus in those patients.
This study is not without limitations, in particular analyses involving sequencing data at the level of mRNA. Therefore, further research should perform protein level analysis. In addition, the outcomes of this research were based mainly on data from TCGA. Even though the large number of cases in the TCGA database may decrease any bias, the current findings should be further investigated through other independent cohorts.
In conclusion, this study has revealed that CTSZ is overexpressed in ccRCC with infiltrating lymphocytes and exhibited macrophage-specific expression. Macrophage-specific CTSZ was associated with activation of the epithelial‐to‐mesenchymal transition, cell cycle signatures and higher infiltration level of B cells, macrophages, neutrophils, and dendritic cells in the tumor microenvironment. High expression levels of CTSZ may be regarded as a prognostic and treatment response biomarker in patients with ccRCC and receiving anti-PD-1 immunotherapy.
Abbreviations
CTSZ, Cathepsin Z; ccRCC, Clear cell renal cell carcinoma;RGD, Arg‐Gly‐Asp; ICIs, Immune checkpoint inhibitors; GEPIA, Gene Expression Profiling Interactive Analysis; TIMER, Tumor Immune Estimation Resource; OS, Overall survival; DFS, Disease-free survival; TCGA, The Cancer Genome Atlas; HPA, Human Protein Atlas; IF, Immunofluorescence; CNV, Copy number variations; GSEA, Gene set enrichment analysis; NESs, Normalized enrichment scores; GDSC, Genomics of Drug Sensitivity in Cancer; CTRP, Cancer Therapeutics Response Portal; UMAP, Uniform manifold approximation and projection; IC, Immune checkpoint; TAM, Tumor-associated macrophages; IC50, Half-inhibitory concentration; NCB, No clinical benefit; ICB, Intermediate clinical benefit; CB, Clinical benefit; HR, Hazard ratios; EMT, Epithelial‐to‐mesenchymal transition; ER, Estrogen receptor; AR, Androgen receptor; MAPK, Mitogen-activated protein kinase; PI3K, Phosphatidylinositol-3-kinase; TSC, Tuberous sclerosis complex; mTOR, Mammalian target of rapamycin; RTK, Receptor tyrosine kinase.
Data Sharing Statement
The data used and/or analyzed during the current study are available from the corresponding author on reasonable request.
Ethics Approval and Consent to Participate
The Ethics Committee of West China Hospital approved this research and written informed consents were acquired from involved patients.
Acknowledgments
We thank Charles Allan, PhD, from Liwen Bianji (Edanz) (www.liwenbianji.cn/), for editing the English text of a draft of this manuscript.
Disclosure
The authors report no conflicts of interest in this work.
References
1. Sung H, Ferlay J, Siegel RL, et al. Global Cancer Statistics 2020: GLOBOCAN Estimates of incidence and mortality worldwide for 36 cancers in 185 countries. CA Cancer J Clin. 2021;71(3):209–249. doi:10.3322/caac.21660
2. Capitanio U, Bensalah K, Bex A, et al. Epidemiology of renal cell carcinoma. Eur Urol. 2019;75(1):74–84. doi:10.1016/j.eururo.2018.08.036
3. MacLennan S, Imamura M, Lapitan MC, et al. Systematic review of oncological outcomes following surgical management of localised renal cancer. Eur Urol. 2012;61(5):972–993. doi:10.1016/j.eururo.2012.02.039
4. Yin X, Wang Z, Wang J, Xu Y, Kong W, Zhang J. Development of a novel gene signature to predict prognosis and response to PD-1 blockade in clear cell renal cell carcinoma. Oncoimmunology. 2021;10(1):1933332. doi:10.1080/2162402X.2021.1933332
5. Barata PC, Rini BI. Treatment of renal cell carcinoma: current status and future directions. CA Cancer J Clin. 2017;67(6):507–524. doi:10.3322/caac.21411
6. Peña-Llopis S, Vega-Rubín-de-Celis S, Liao A, et al. BAP1 loss defines a new class of renal cell carcinoma. Nat Genet. 2012;44(7):751–759. doi:10.1038/ng.2323
7. Creighton CJ. Comprehensive molecular characterization of clear cell renal cell carcinoma. Nature. 2013;499(7456):43–49. doi:10.1038/nature12222
8. Kramer L, Turk D, Turk B. The future of cysteine cathepsins in disease management. Trends Pharmacol Sci. 2017;38(10):873–898. doi:10.1016/j.tips.2017.06.003
9. Akkari L, Gocheva V, Kester JC, et al. Distinct functions of macrophage-derived and cancer cell-derived cathepsin Z combine to promote tumor malignancy via interactions with the extracellular matrix. Genes Dev. 2014;28(19):2134–2150. doi:10.1101/gad.249599.114
10. Jevnikar Z, Obermajer N, Doljak B, et al. Cathepsin X cleavage of the beta2 integrin regulates talin-binding and LFA-1 affinity in T cells. J Leukoc Biol. 2011;90(1):99–109. doi:10.1189/jlb.1110622
11. Fisher DT, Chen Q, Appenheimer MM, et al. Hurdles to lymphocyte trafficking in the tumor microenvironment: implications for effective immunotherapy. Immunol Invest. 2006;35(3–4):251–277. doi:10.1080/08820130600745430
12. Hidaka S, Yasutake T, Takeshita H, et al. Differences in 20q13.2 copy number between colorectal cancers with and without liver metastasis. Clin Cancer Res. 2000;6(7):2712–2717.
13. Li W, Yu X, Ma X, et al. Deguelin attenuates non-small cell lung cancer cell metastasis through inhibiting the CtsZ/FAK signaling pathway. Cell Signal. 2018;50:131–141. doi:10.1016/j.cellsig.2018.07.001
14. Batista AAS, Franco BM, Perez MM, et al. Decreased levels of cathepsin Z mRNA expressed by immune blood cells: diagnostic and prognostic implications in prostate cancer. Braz J Med Biol Res. 2021;54(10):e11439. doi:10.1590/1414-431x2021e11439
15. Olson OC, Joyce JA. Cysteine cathepsin proteases: regulators of cancer progression and therapeutic response. Nat Rev Cancer. 2015;15(12):712–729. doi:10.1038/nrc4027
16. Tang Z, Li C, Kang B, Gao G, Li C, Zhang Z. GEPIA: a web server for cancer and normal gene expression profiling and interactive analyses. Nucleic Acids Res. 2017;45(W1):W98–W102. doi:10.1093/nar/gkx247
17. Li T, Fu J, Zeng Z, et al. TIMER2.0 for analysis of tumor-infiltrating immune cells. Nucleic Acids Res. 2020;48(W1):W509–W514. doi:10.1093/nar/gkaa407
18. Li C, Tang Z, Zhang W, Ye Z, Liu F. GEPIA2021: integrating multiple deconvolution-based analysis into GEPIA. Nucleic Acids Res. 2021;49(W1):W242–W246. doi:10.1093/nar/gkab418
19. Bi K, He MX, Bakouny Z, et al. Tumor and immune reprogramming during immunotherapy in advanced renal cell carcinoma. Cancer Cell. 2021;39(5):649–661.e5. doi:10.1016/j.ccell.2021.02.015
20. Chandrashekar DS, Bashel B, Balasubramanya SAH, et al. UALCAN: a portal for facilitating tumor subgroup gene expression and survival analyses. Neoplasia. 2017;19(8):649–658. doi:10.1016/j.neo.2017.05.002
21. Modhukur V, Iljasenko T, Metsalu T, Lokk K, Laisk-Podar T, Vilo J. MethSurv: a web tool to perform multivariable survival analysis using DNA methylation data. Epigenomics. 2018;10(3):277–288. doi:10.2217/epi-2017-0118
22. Li T, Fan J, Wang B, et al. TIMER: a web server for comprehensive analysis of tumor-infiltrating immune cells. Cancer Res. 2017;77(21):e108–e110. doi:10.1158/0008-5472.CAN-17-0307
23. Li B, Severson E, Pignon JC, et al. Comprehensive analyses of tumor immunity: implications for cancer immunotherapy. Genome Biol. 2016;17(1):174. doi:10.1186/s13059-016-1028-7
24. Danaher P, Warren S, Dennis L, et al. Gene expression markers of tumor infiltrating leukocytes. J Immunother Cancer. 2017;5:18. doi:10.1186/s40425-017-0215-8
25. Sousa S, Määttä J. The role of tumour-associated macrophages in bone metastasis. J Bone Oncol. 2016;5(3):135–138. doi:10.1016/j.jbo.2016.03.004
26. Guo L, Fang T, Jiang Y, Liu D. Identification of immune checkpoint inhibitors and biomarkers among STAT family in stomach adenocarcinoma. Am J Transl Res. 2020;12(9):4977–4997.
27. Liu CJ, Hu FF, Xia MX, Han L, Zhang Q, Guo AY. GSCALite: a web server for gene set cancer analysis. Bioinformatics. 2018;34(21):3771–3772. doi:10.1093/bioinformatics/bty411
28. Yuan H, Yan M, Zhang G, et al. CancerSEA: a cancer single-cell state atlas. Nucleic Acids Res. 2019;47(D1):D900–D908. doi:10.1093/nar/gky939
29. Braun DA, Hou Y, Bakouny Z, et al. Interplay of somatic alterations and immune infiltration modulates response to PD-1 blockade in advanced clear cell renal cell carcinoma. Nat Med. 2020;26(6):909–918. doi:10.1038/s41591-020-0839-y
30. Lechner AM, Assfalg-Machleidt I, Zahler S, et al. RGD-dependent binding of procathepsin X to integrin alphavbeta3 mediates cell-adhesive properties. J Biol Chem. 2006;281(51):39588–39597. doi:10.1074/jbc.M513439200
31. Teller A, Jechorek D, Hartig R, et al. Dysregulation of apoptotic signaling pathways by interaction of RPLP0 and cathepsin X/Z in gastric cancer. Pathol Res Pract. 2015;211(1):62–70. doi:10.1016/j.prp.2014.09.005
32. Breznik B, Limbaeck Stokin C, Kos J, et al. Cysteine cathepsins B, X and K expression in peri-arteriolar glioblastoma stem cell niches. J Mol Histol. 2018;49(5):481–497. doi:10.1007/s10735-018-9787-y
33. Vizin T, Christensen IJ, Nielsen HJ, Cathepsin KJ. X in serum from patients with colorectal cancer: relation to prognosis. Radiol Oncol. 2012;46(3):207–212. doi:10.2478/v10019-012-0040-0
34. Nägler DK, Krüger S, Kellner A, et al. Up-regulation of cathepsin X in prostate cancer and prostatic intraepithelial neoplasia. Prostate. 2004;60(2):109–119. doi:10.1002/pros.20046
35. Jones PA. Functions of DNA methylation: islands, start sites, gene bodies and beyond. Nat Rev Genet. 2012;13(7):484–492. doi:10.1038/nrg3230
36. Kos J, Jevnikar Z, Obermajer N. The role of cathepsin X in cell signaling. Cell Adh Migr. 2009;3(2):164–166. doi:10.4161/cam.3.2.7403
37. Zeng Q, Zhang W, Li X, Lai J, Li Z. Bioinformatic identification of renal cell carcinoma microenvironment-associated biomarkers with therapeutic and prognostic value. Life Sci. 2020;243:117273. doi:10.1016/j.lfs.2020.117273
38. Tuo H, Shu F, She S, et al. Sorcin induces gastric cancer cell migration and invasion contributing to STAT3 activation. Oncotarget. 2017;8(61):104258–104271. doi:10.18632/oncotarget.22208
 © 2022 The Author(s). This work is published and licensed by Dove Medical Press Limited. The full terms of this license are available at https://www.dovepress.com/terms.php and incorporate the Creative Commons Attribution - Non Commercial (unported, v3.0) License.
By accessing the work you hereby accept the Terms. Non-commercial uses of the work are permitted without any further permission from Dove Medical Press Limited, provided the work is properly attributed. For permission for commercial use of this work, please see paragraphs 4.2 and 5 of our Terms.
© 2022 The Author(s). This work is published and licensed by Dove Medical Press Limited. The full terms of this license are available at https://www.dovepress.com/terms.php and incorporate the Creative Commons Attribution - Non Commercial (unported, v3.0) License.
By accessing the work you hereby accept the Terms. Non-commercial uses of the work are permitted without any further permission from Dove Medical Press Limited, provided the work is properly attributed. For permission for commercial use of this work, please see paragraphs 4.2 and 5 of our Terms.