")
Back to Journals » Cancer Management and Research » Volume 13
Machine Learning Models to Improve the Differentiation Between Benign and Malignant Breast Lesions on Ultrasound: A Multicenter External Validation Study
Authors Huo L, Tan Y, Wang S , Geng C, Li Y, Ma X, Wang B , He Y, Yao C , Ouyang T
Received 23 December 2020
Accepted for publication 23 March 2021
Published 16 April 2021 Volume 2021:13 Pages 3367—3379
DOI https://doi.org/10.2147/CMAR.S297794
Checked for plagiarism Yes
Review by Single anonymous peer review
Peer reviewer comments 2
Editor who approved publication: Professor Seema Singh
Ling Huo,1,* Yao Tan,2,* Shu Wang,3 Cuizhi Geng,4 Yi Li,5 XiangJun Ma,6 Bin Wang,2 YingJian He,1 Chen Yao,2,7 Tao Ouyang1
1Key Laboratory of Carcinogenesis and Translational Research (Ministry of Education/Beijing), Breast Center, Peking University Cancer Hospital & Institute, Beijing, People’s Republic of China; 2Department of Biostatistics, Peking University First Hospital, Beijing, People’s Republic of China; 3Department of Breast Center, Peking University People’s Hospital, Beijing, People’s Republic of China; 4The Fourth Hospital of Hebei Medical University, Shijiazhuang, People’s Republic of China; 5Shunyi District Health Care Hospital for Women and Children of Beijing, Beijing, People’s Republic of China; 6Haidian Maternal and Child Health Hospital, Beijing, People’s Republic of China; 7Peking University Clinical Research Institute, Peking University Health Science Center, Beijing, People’s Republic of China
*These authors contributed equally to this work
Correspondence: Chen Yao
Peking University First Hospital, Xicheng District, Beijing, 100034, People’s Republic of China
Tel +86 18610640562
Email [email protected]
Tao Ouyang
Peking University Cancer Hospital & Institute, Haidian District, Beijing, 100142, People’s Republic of China
Tel +86 010 88121122
Email [email protected]
Purpose: This study aimed to establish and evaluate the usefulness of a simple, practical, and easy-to-promote machine learning model based on ultrasound imaging features for diagnosing breast cancer (BC).
Materials and Methods: Logistic regression, random forest, extra trees, support vector, multilayer perceptron, and XG Boost models were developed. The modeling data set of 1345 cases was from a tertiary class A hospital in China. The external validation data set of 1965 cases were from 3 tertiary class A hospitals and 2 primary hospitals. The area under the receiver operating characteristic curve (AUC) was used as the main evaluation index, and pathological biopsy was used as the gold standard for evaluating each model. Diagnostic capability was also compared with that of clinicians.
Results: Among the six models, the logistic model showed superior diagnostic efficiency, with an AUC of 0.771 and 0.906 and Brier scores of 0.181 and 0.165 in the test and validation sets, respectively. The AUCs of the clinician diagnosis and the logistic model were 0.913 and 0.906. Their AUCs in the tertiary class A hospitals were 0.915 and 0.915, respectively, and were 0.894 and 0.873 in primary hospitals, respectively.
Conclusion: The externally validated logical model can be used to distinguish between malignant and benign breast lesions in ultrasound images. Compared with clinician diagnosis, the logistic model has better diagnostic efficiency, making it potentially useful to assist in screening, particularly in lower level medical institutions.
Trial Registration: http://www.clinicaltrials.gov. ClinicalTrials.gov ID: NCT03080623.
Keywords: breast cancer, machine learning, diagnostic accuracy, patient stratification, screening modalities, ultrasound imaging
Introduction
Breast cancer (BC) is the most common malignancy among women worldwide.1 However, most BC patients in China are diagnosed at the advanced stage.2 BC screening for early diagnosis is crucial for improving treatment efficacy and survival.3 BC screening currently includes breast self-examination, mammography, ultrasonography, exfoliative cytology, carcinoembryonic antigen, and a carbohydrate antigen 153 test.4 However, these traditional methods have limited application value in early diagnosis due to their lack of sensitivity and/or specificity. The emergence of new biomarkers, such as MicroRNAs,5–9 lipocalin-1,10 APC gene promoter aberrant methylation,11 14-3-3 sigma (σ) promoter methylation,12 and circulating tumor DNA, makes early BC screening promising.13,14 A recent study on the diagnostic accuracy of seven BC markers found that miRNA has better diagnostic accuracy than do other markers.5 However, although liquid biopsy for tracking new markers is promising, it is not suitable for large-scale screening in areas with scarce medical resources because of its invasiveness and cost. In Beijing, the primary method of BC screening is breast ultrasound imaging examination. However, given that the accuracy of conventional ultrasound imaging is highly dependent on the clinicians’ expertise and experience, the results of BC screening and diagnosis in primary hospitals are suboptimal.
In oncology, machine learning models play an important role in developing new auxiliary tools for clinicians.15–17 Therefore, a model for diagnosing breast lesions based on the characteristics of large samples of ultrasound images may be helpful for lowering subjectivity and improving the accuracy of screening. Computer-aided recognition methods based on technologies such as image segmentation and machine learning have been found to improve the diagnosis of BC.18–23 However, these advanced auxiliary screening technologies and the use of artificial intelligence medical ultrasound equipment are still in the early phase of development.
This study aimed to establish a simple, practical, and easy-to-promote clinical model for BC diagnosis and evaluate its usefulness in primary hospitals. Towards this goal, we screened out meaningful predictors based on the data collected by tertiary class A hospitals and established diagnostic models. Population data, including from primary hospitals, were used as an external verification data set to validate the effectiveness of the model and explore its applicability and clinical potential. We ultimately aimed to extend the BC screening experience of skilled clinicians to lower level medical institutions in the form of predictive models, so as to improve the overall quality of screening across the country.
Patients and Methods
Data Sets
The modeling data set was a cumulative collection of data from 1345 patients admitted to a tertiary class A hospital (Beijing Cancer Hospital) between November 2010 and May 2016. We used the automated breast ultrasound screening (ABUS) in this study. Data on ultrasound findings and histopathological diagnosis were collected. For early tumor detection, we selected T1 BC patients. T1 was defined as tumor lesions smaller than 2 cm, and thus the maximum diameter of the ultrasound image of the lesion was set to be less than 2 cm. Two-dimensional images were collected, and the coronal image was reconstructed. After re-evaluation by professional clinicians from Beijing People’s Hospital, the cases with consistent findings were selected as the final modeling data set. In total, data from 1125 patients were included; of them, 732 patients had malignant tumors.
Given that our model was aimed to assist clinicians in primary hospitals in tumor screening, we included some primary hospitals in the selection of the external validation set to test the generalizability of the model. The external validation data set was from 3 tertiary class A hospitals (Beijing Cancer Hospital, Beijing People’s Hospital, Fourth Hospital of Hebei Medical University) and 2 primary hospitals (Beijing Shunyi District Maternity and Child Health Hospital, and Beijing Haidian District Maternity and Child Health Hospital). The data were cumulatively collected from August 2017 to December 2019 and comprised pathological results of 1981 biopsy (n=1094) or follow-up (n=890) cases. After data cleaning, 1965 cases were included in the verification data set.
The dependent variable of the machine model was the diagnosis result (benign or malignant) of biopsy cases with pathological biopsy classification or follow-up cases with disease classification. The independent variable was the expert group and modeling working group classification from Peking University Cancer Hospital and Peking University People’s Hospital. This working group extracted and clarified the definitions of ultrasound imaging terminology based on the interpretation of ultrasound images in a blinded manner. We have previously published relevant literature24 using the full model strategy, logistic model strategy, and random forest model strategy to screen independent variables and establish models (Table 1).
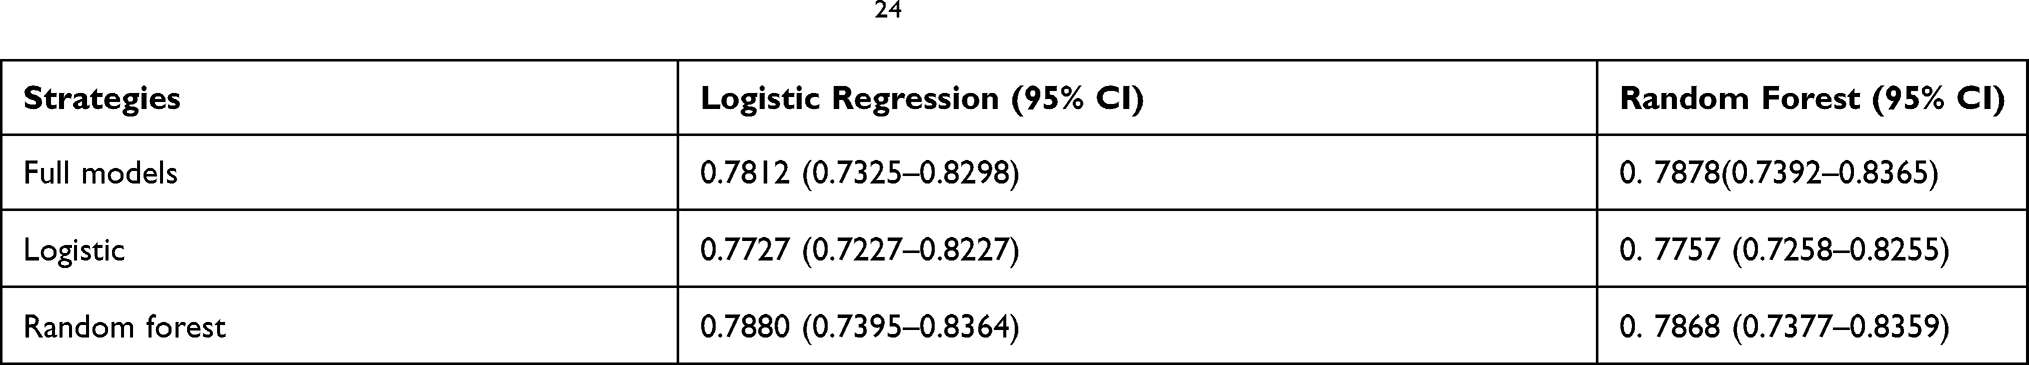 |
Table 1 AUC of the Two Models in Our Previous Study24 |
The external validation data set comprised only part of the screening independent variables that need to be validated based on the previous models. The identifiable information of the boundary was classified into 4 features when the boundary was not identifiable. The specific variable assignments are shown in Table 2.
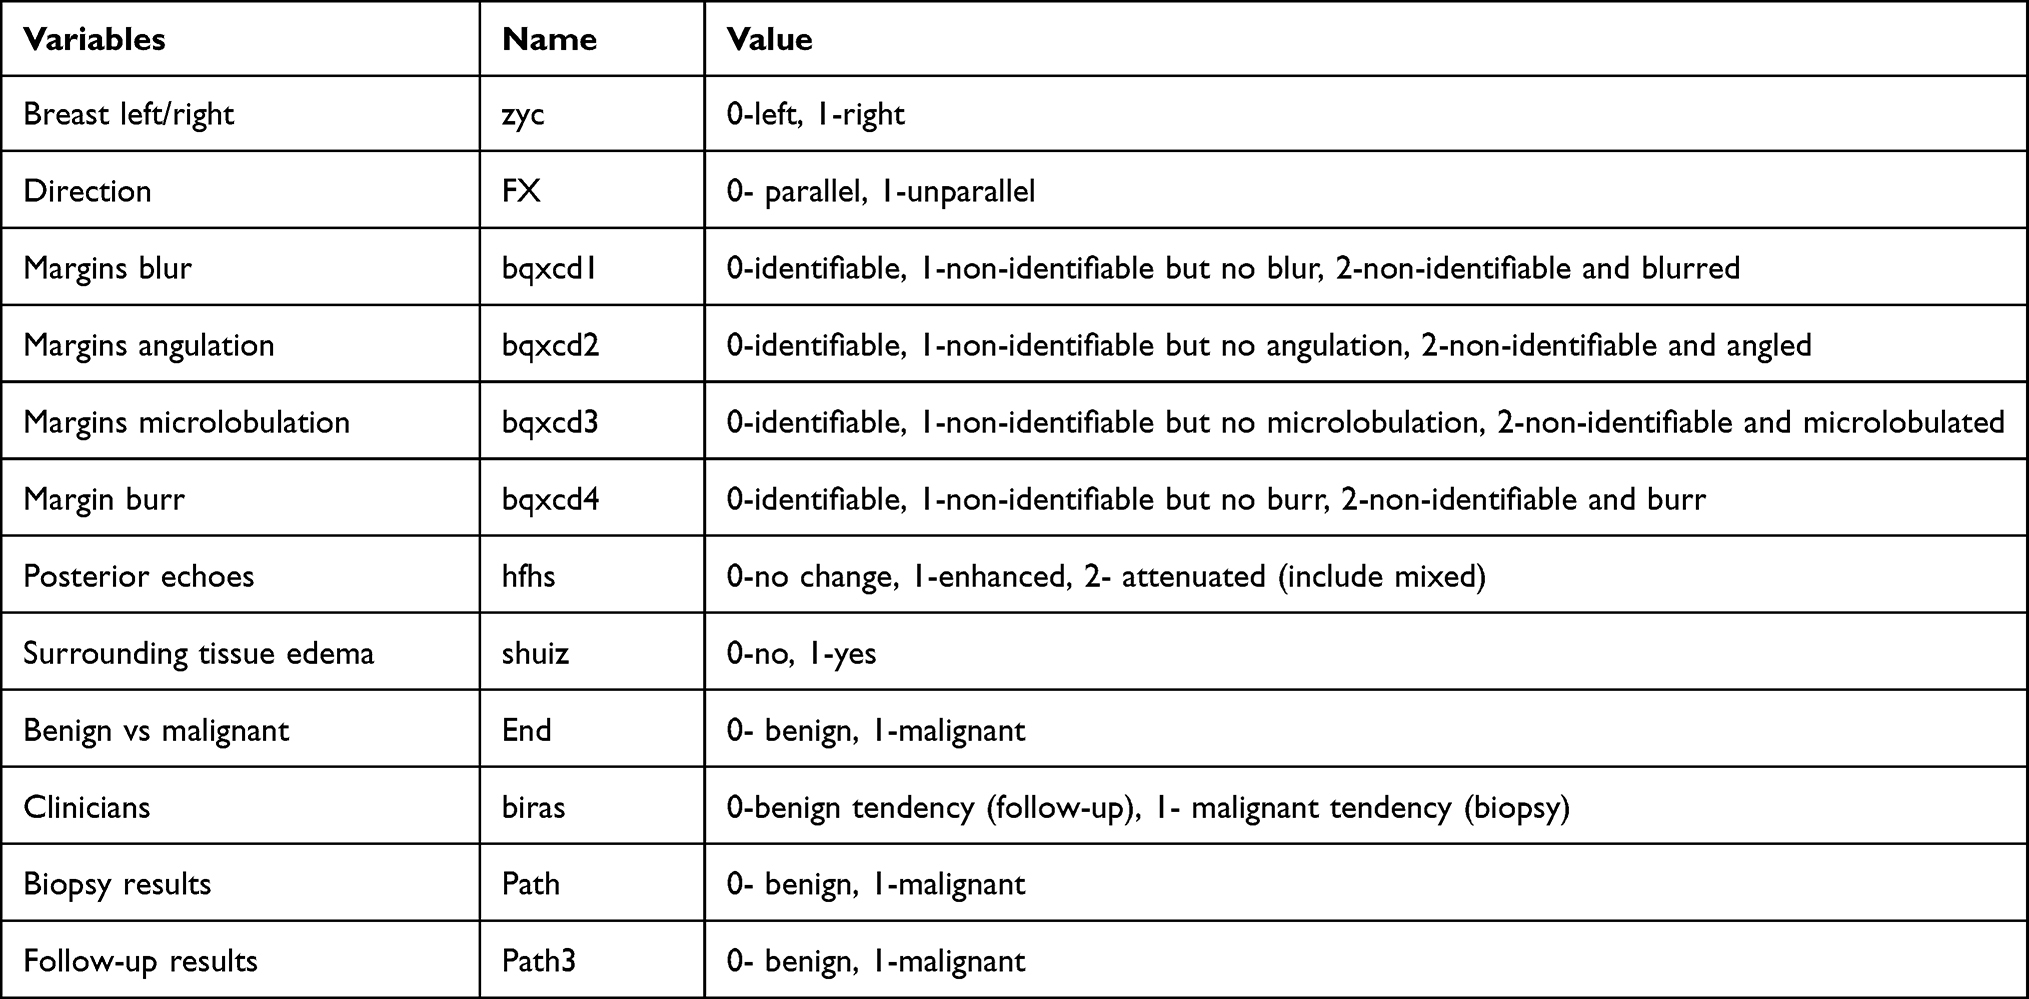 |
Table 2 Variable Assignment |
This study was approved by the Ethics Committee of Beijing Cancer Hospital (Approval Number: 2016KT14) in Beijing, China and was conducted according to the tenets of the Declaration of Helsinki. All patients provided written informed consent to participate.
Model Development
The data set was divided into a modeling data set and an external verification dataset. We selected 75% of the samples from the modeling data set as the training set. The variable selection, one-hot encoding, and basic model were assembled into a pipeline, which was entered into the grid search, using the 10-fold cross validation technique. In this technique, the data set was divided 10 folds, and each fold was used for internal verification. The remaining 90% was used for the training of the development model. The hyperparameter adjustment was used for establishing the model. Otherwise, we validated the models with the remaining 25% of the samples and external validation data sets. Cross-validation and hyperparameter adjustments for internal validation are considered robust methods of model evaluation before external validation on a separate data set. This could maximize the potential performance of machine learning models.
We validated each model through an external verification data set. The discriminative capability of each model was validated using the area under the receiver operating characteristic (ROC) curve. Meanwhile, the Brier score was calculated to quantify the calibration degree of the model, and a calibration degree scatter diagram was created thereafter. We then evaluated the consistency of the actual observations and models according to the comparison between the scattered point distribution and the reference line.
The verification data were stratified according to primary hospitals and tertiary class A hospitals to compare between each model and the results determined by clinicians.
Statistical Analysis
Raw data were cleaned using SAS v.9.4 (SAS Institute, Cary, NC), and a single factor analysis was performed. The categorical independent and dependent variables were evaluated using chi-square test. P values less than 0.05 on both sides were considered statistically significant. The verification process was mainly based on the “sklearn” package (version 0.22.2.post1) of Python (version 3.7.7). The model’s discriminative capability was evaluated according to the area under the curve (AUC). The AUC value ranges from 0.5 to 1, and the closer the AUC is to 1, the better the discriminative capability of the model. An AUC of 0.5 indicates that the model is not predictive and has no practical application. We evaluated the model calibration using the Brier score and calibration curve. The Brier score is calculated using the formula (Y-p)2, where Y is the actually observed outcome variable (0 or 1), and p is the predicted probability based on the prediction model. The Brier score ranges from 0 to 0.25, and the smaller the score, the better the calibration of the model. A Brier score of 0.25 indicates that the model has no predictive capability.
Results
Basic Information
The modeling data set included data from 732 cases of malignant tumors (65.07%) and 393 cases of benign tumors (34.93%). Meanwhile, the validation data set included data from 498 cases of malignant tumors (25.34%) and 1467 cases of benign tumors (74.66%). With respect to clinician findings in the validation data set, 1354 follow-up cases (68.91%) and 611 biopsy cases (31.09%) were determined to be malignant, respectively. Pathological examination of the biopsy cases revealed 498 malignant tumors (45.69%) and 592 benign tumors (54.31%). All follow-up cases were benign tumors (100%) on pathological examination. Comparison of the predictive variables between the modeling data set and validation data set showed a significant difference in the distribution of these predictors (P<0.001, Table 3).
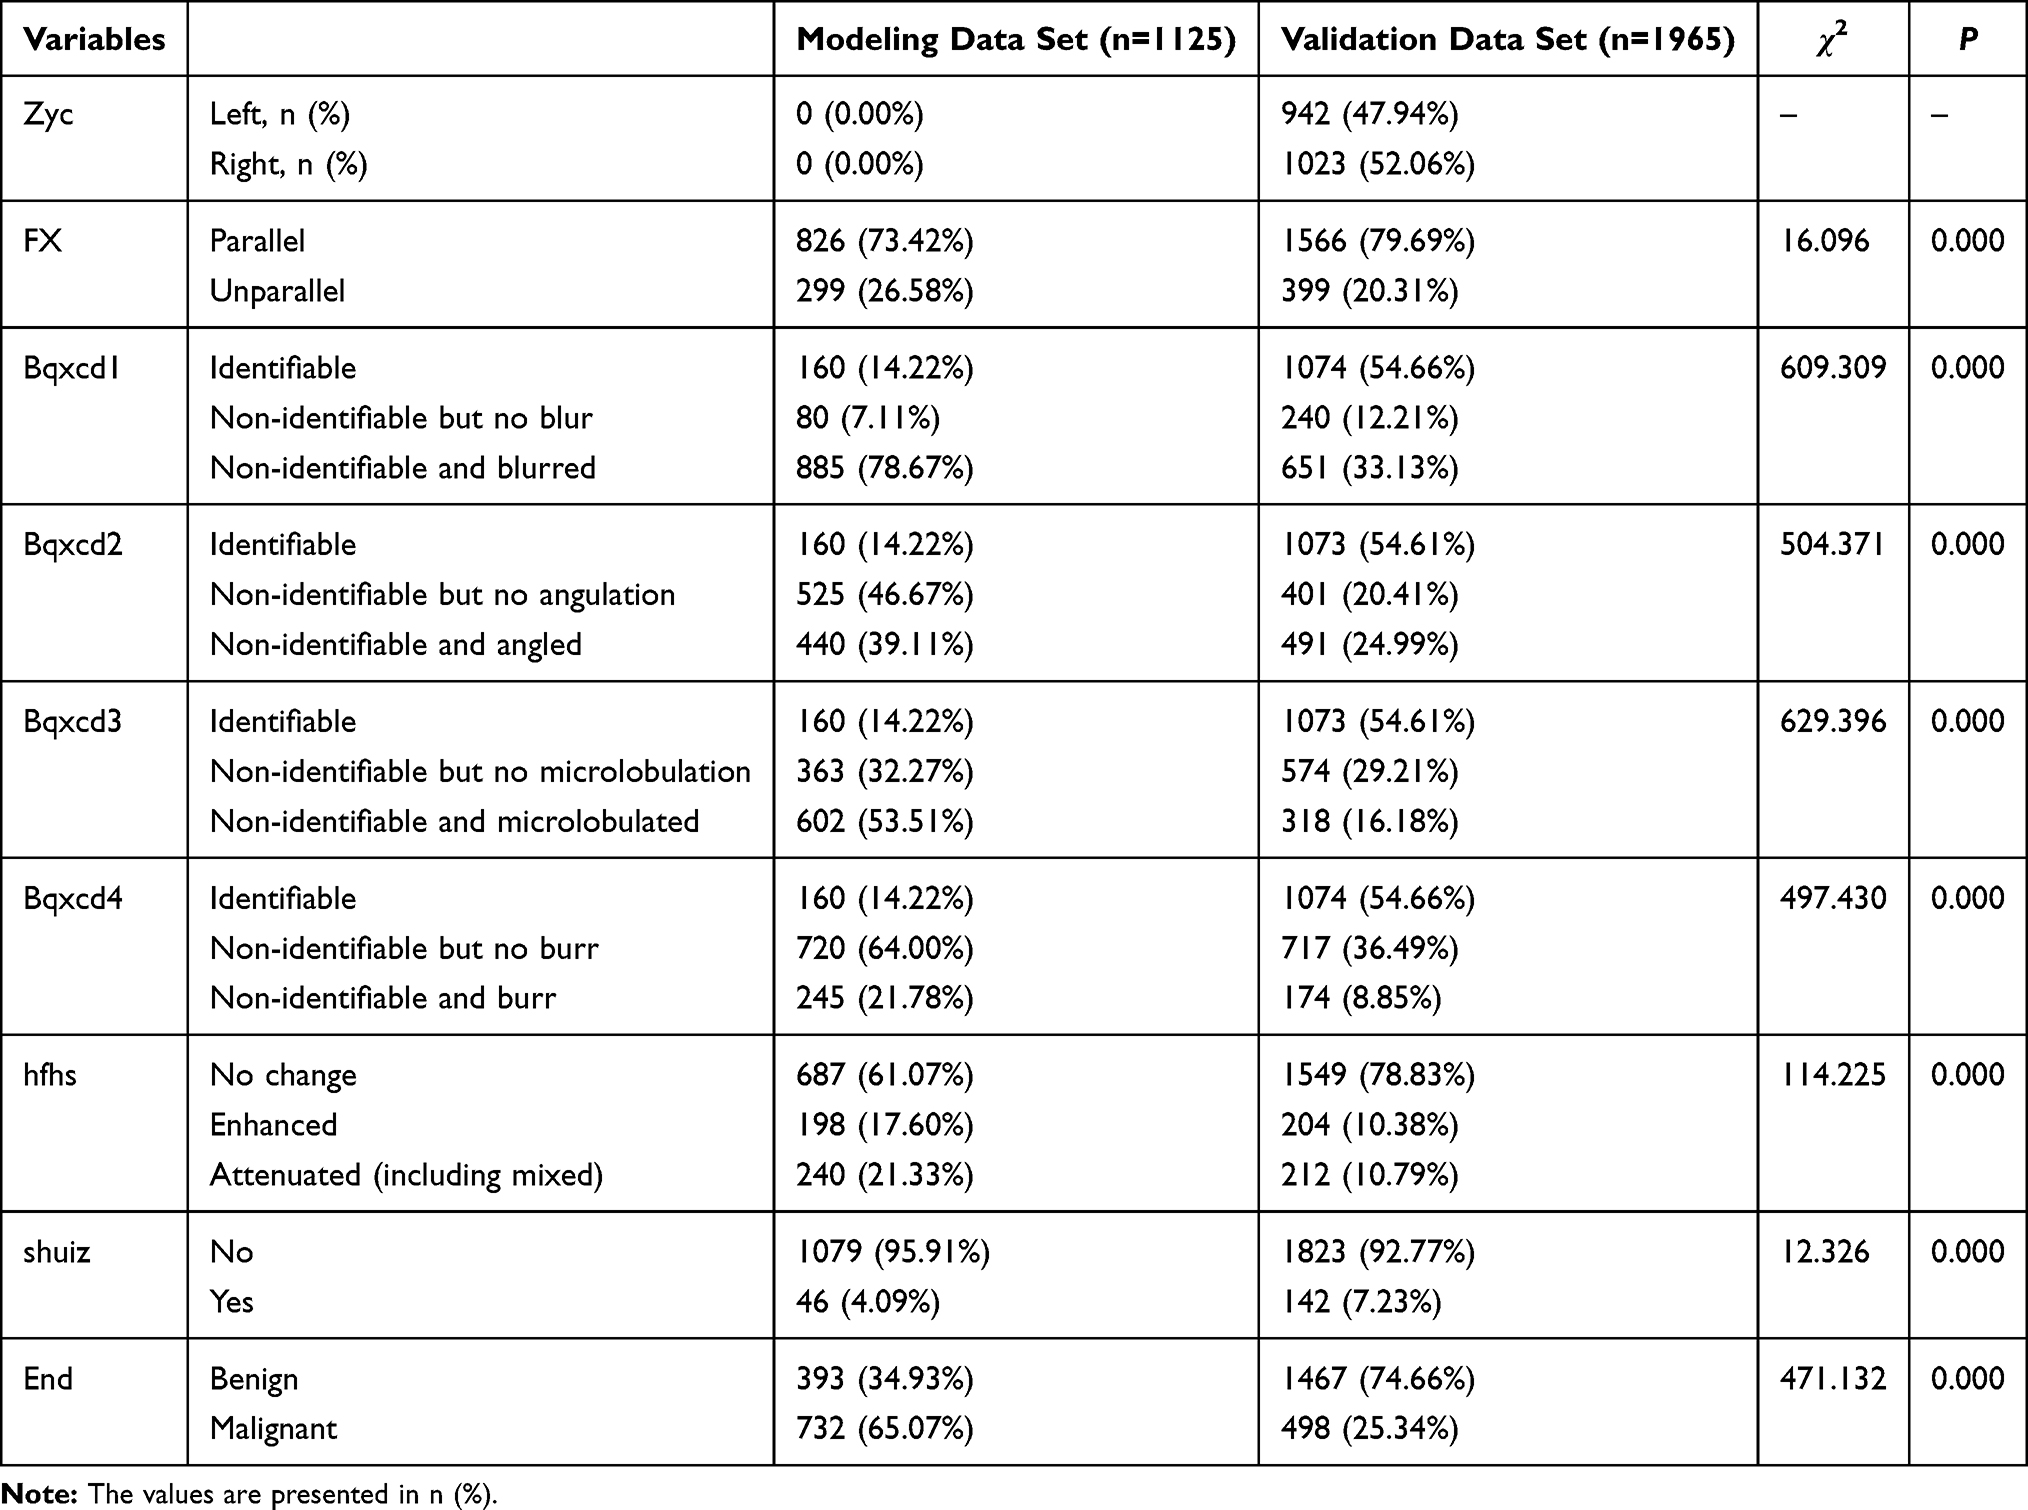 |
Table 3 Comparison Between the Modeling Data Set and the Validation Data Set |
Comparison Between Benign and Malignant Tumors
Univariate analysis of the independent variables in the validation data set identified seven predictors, namely, direction, margin blur, margin angulation, margin microlobulation, margin burr, posterior echoes, and surrounding tissue edema. Further, their distribution was significantly different between the benign and malignant groups (P<0.001, Table 4). Representative ultrasound images showing malignant breast lesions are shown in Figure 1.
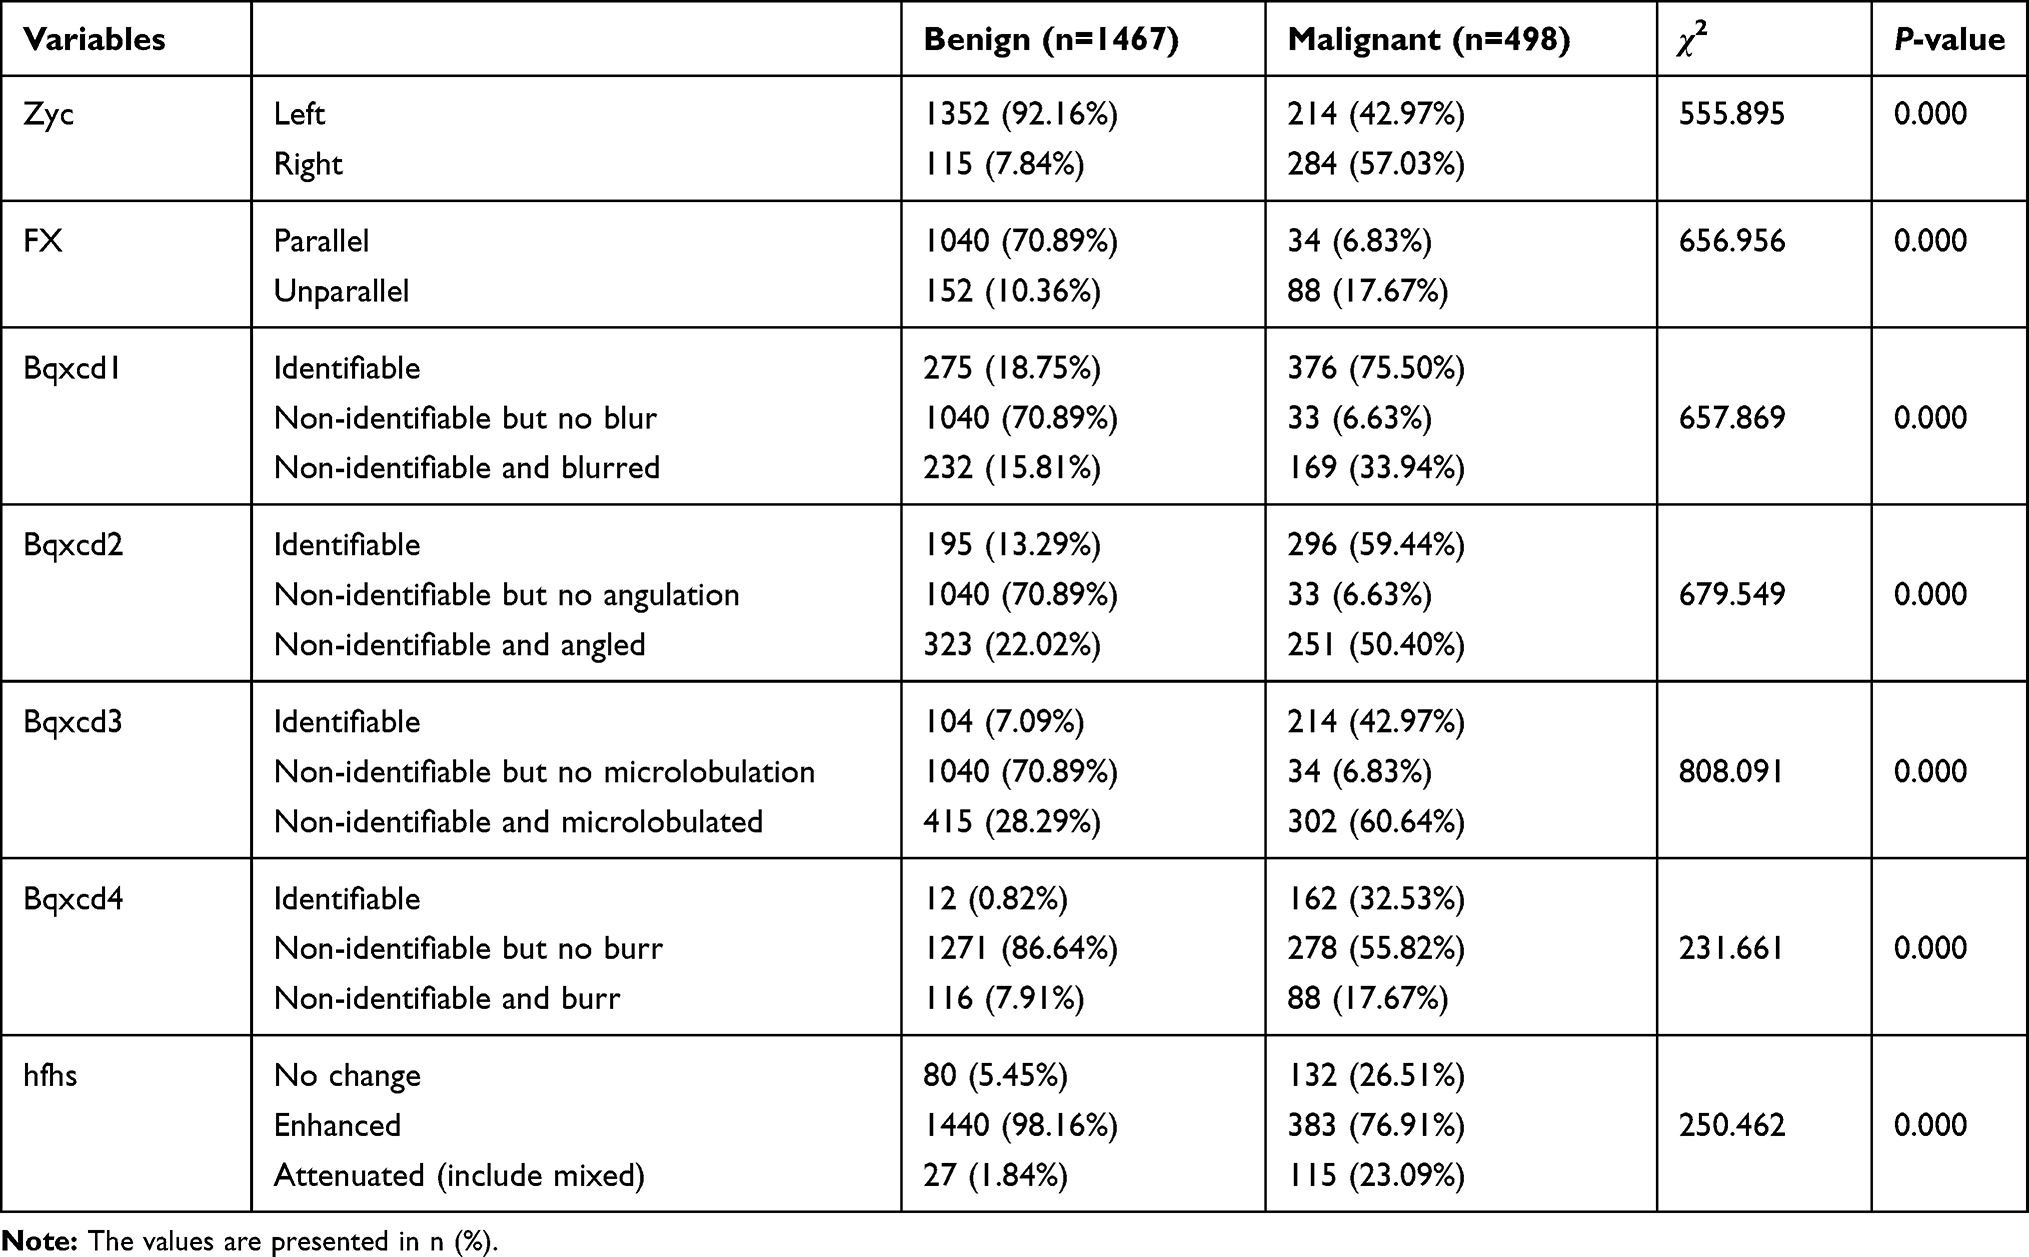 |
Table 4 Comparison Between the Benign and Malignant Groups in the Validation Set |
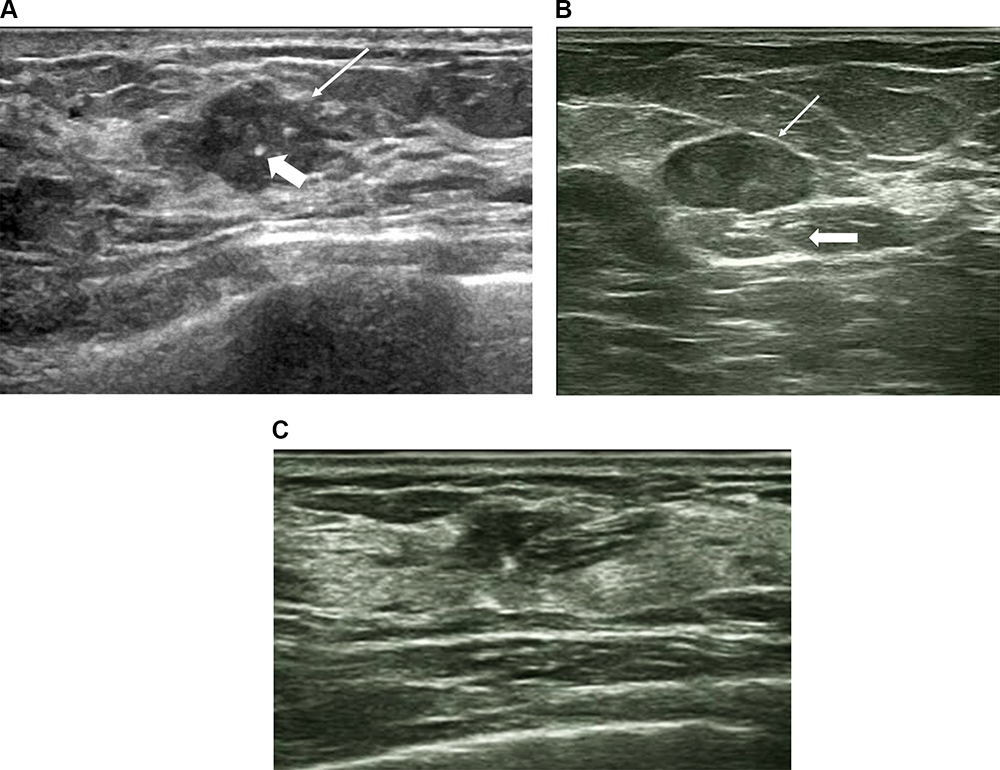 |
Figure 1 Representative ultrasound images showing malignant breast lesions. (A) A hypoechoic malignant lesion with irregular shape, calcification (thick arrow), and not circumscribed margin thin arrow). (B) A hypoechoic lesion with an oval shape, circumscribed margins (thin arrow), and enhancement posterior features (thick arrow). (C) A heterogeneous, hypoechoic structural disordered area with irregular shape and parallel orientation characteristic. |
Discriminative Capability of the Machine Learning Models
The degree of discrimination was used to evaluate the discriminative and ranking capabilities of the model, which indicate the model’s capability to distinguish between individuals with and without the end-point events. In the internal verification, there were no significant differences in the results of several models after hyperparameter adjustment. The multilayer perceptron model performed best, with an AUC (95% CI) of 0.775 (0.719–0.832). In the external verification, the logistic regression model performed best after hyperparameter adjustment, with an AUC (95% CI) of 0.906 (0.892–0.921). The model performance in the verification set was generally better than that in the test set. The indicators of each model are shown in Table 5, and the ROC curves are shown in Figure 2.
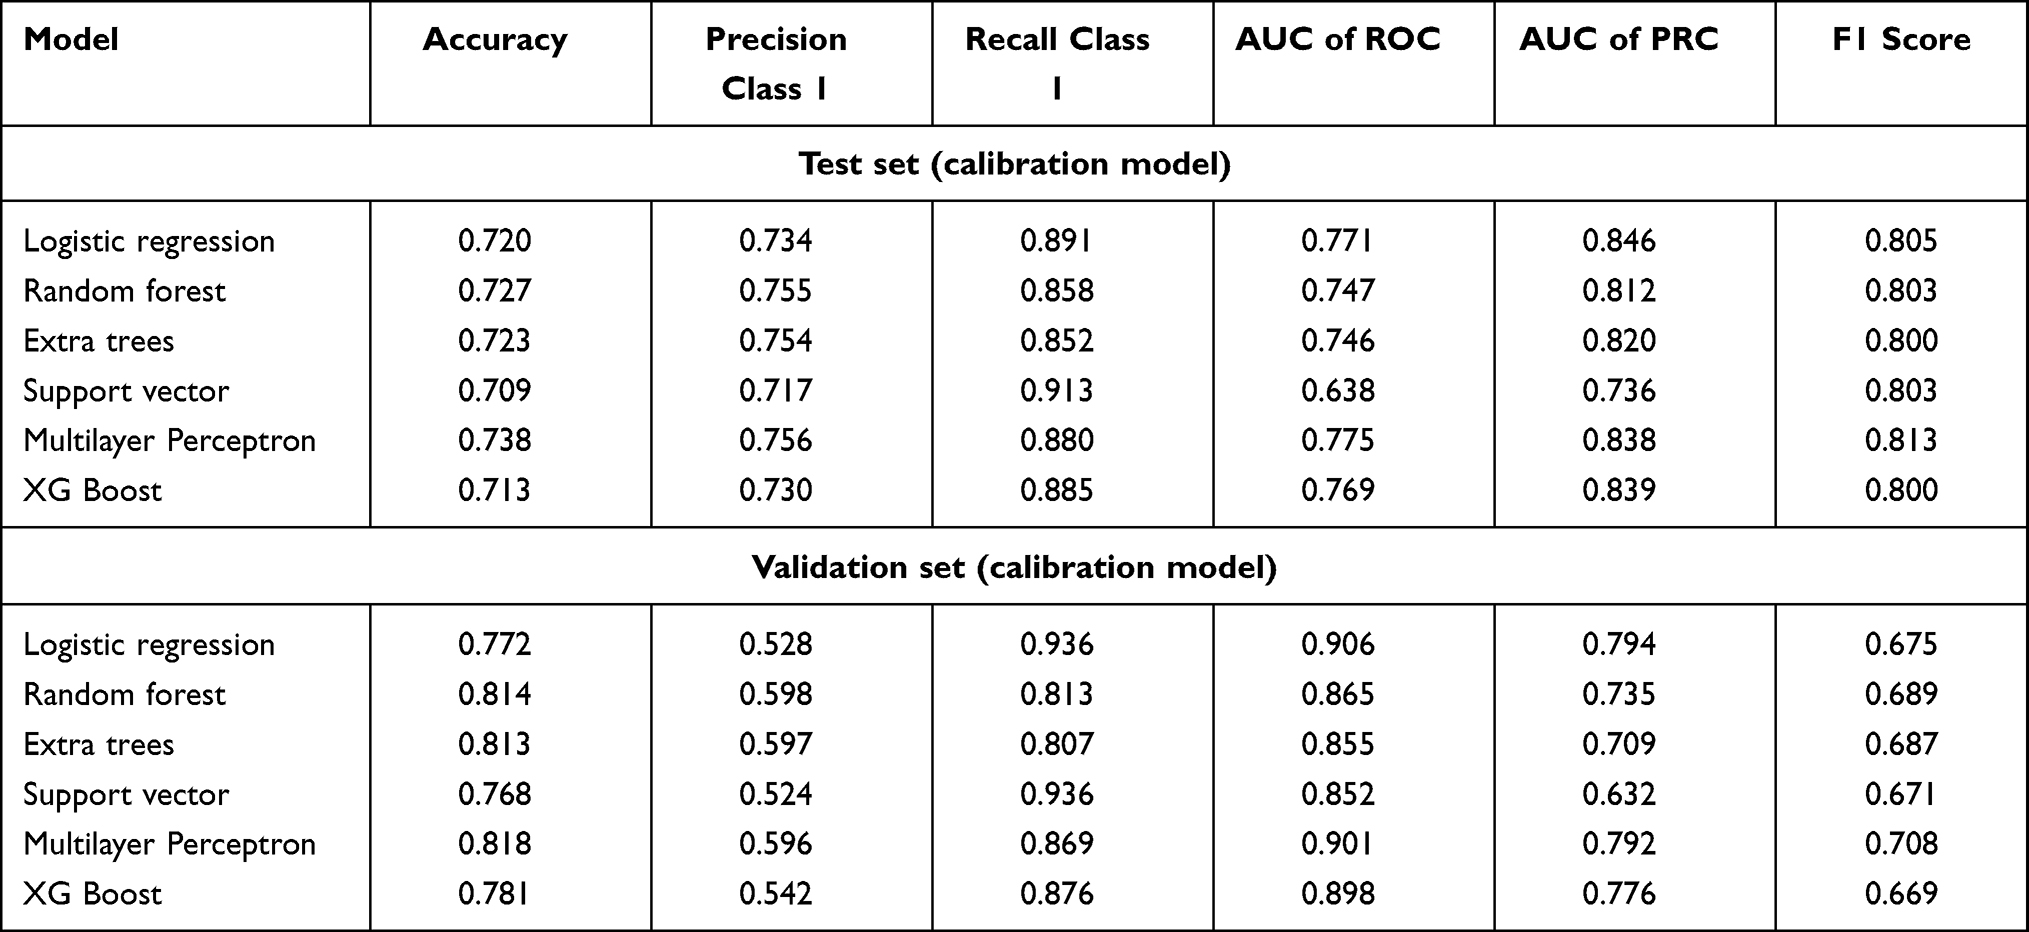 |
Table 5 Performance Evaluation of the Different Models |
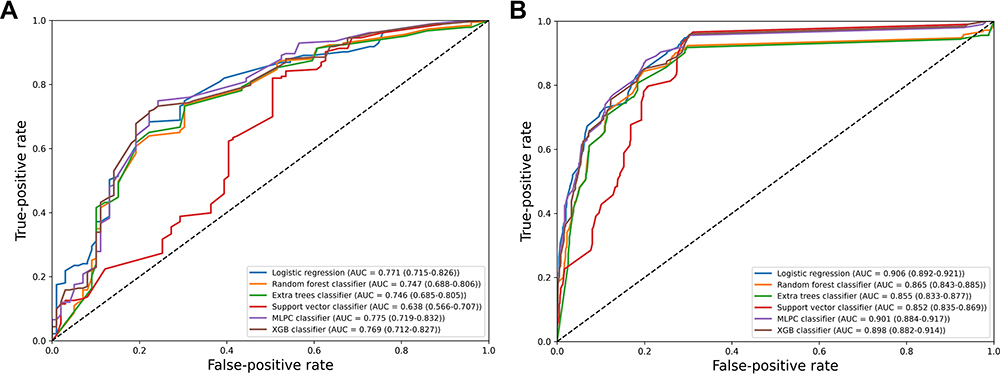 |
Figure 2 ROC plots of the calibrated model in the test set (A) and validation set (B). |
Calibration of the Machine Learning Models
Compared with discrimination, calibration pays more attention to the accuracy of the absolute risk prediction value of the model, that is, the consistency between the probability of the outcome predicted by the model and the probability of the actual outcome. In the internal verification, the Brier scores of the logistic regression, random forest, extra trees, support vector, multilayer perceptron, and XGBoost were 0.181, 0.189, 0.196, 0.199, 0.177, and 0.179, respectively. In the external verification, logistic regression, random forest, extra trees, support vector, multilayer perceptron, and XGBoost were 0.165, 0.163, 0.170, 0.178, 0.146, and 0.161, respectively. The calibration curves are shown in Figure 3.
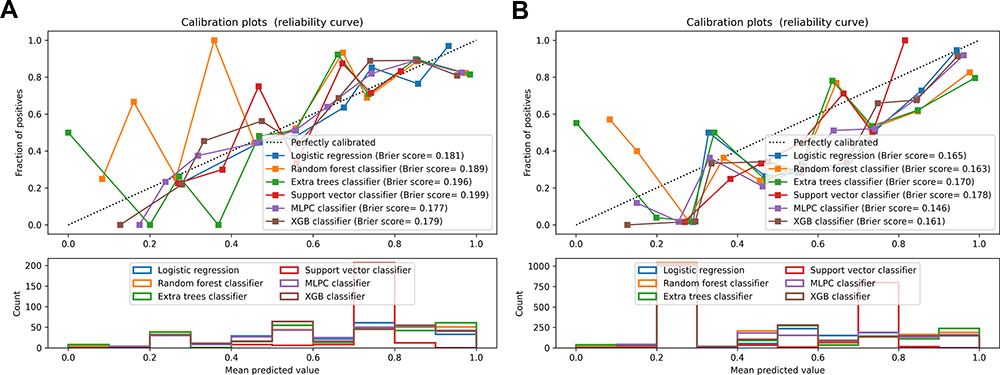 |
Figure 3 Calibration plots of the calibrated model in the test set (A) and validation set (B). |
Comparison of Outcomes Between Clinician and Models
We compared the predicted outcome of the models with those determined by clinicians according to the center stratification (Table 6). Overall, clinician diagnosis showed a higher accuracy than did model diagnosis. The clinician diagnosis had an accuracy of 0.906; sensitivity, 0.928; specificity, 0.898; and AUC, 0.913. Meanwhile, the accuracy of clinician diagnosis in primary hospitals was 0.905; the AUC was 0.894, respectively. The accuracy of clinician diagnosis in the tertiary class A hospitals was 0.906; the AUC was 0.915. When comparing clinician diagnosis between primary and tertiary class A hospitals, the sensitivity was higher in the tertiary class A hospitals, while the accuracy, specificity, and AUC were lower than those in the primary hospitals. Further, we found that each model had a better predictive performance among patients in primary hospitals than those in tertiary class A hospitals (Logistic regression model AUC: 0.915 vs 0.873, Table 7). The performance of the logistic regression model is shown in Table 8.
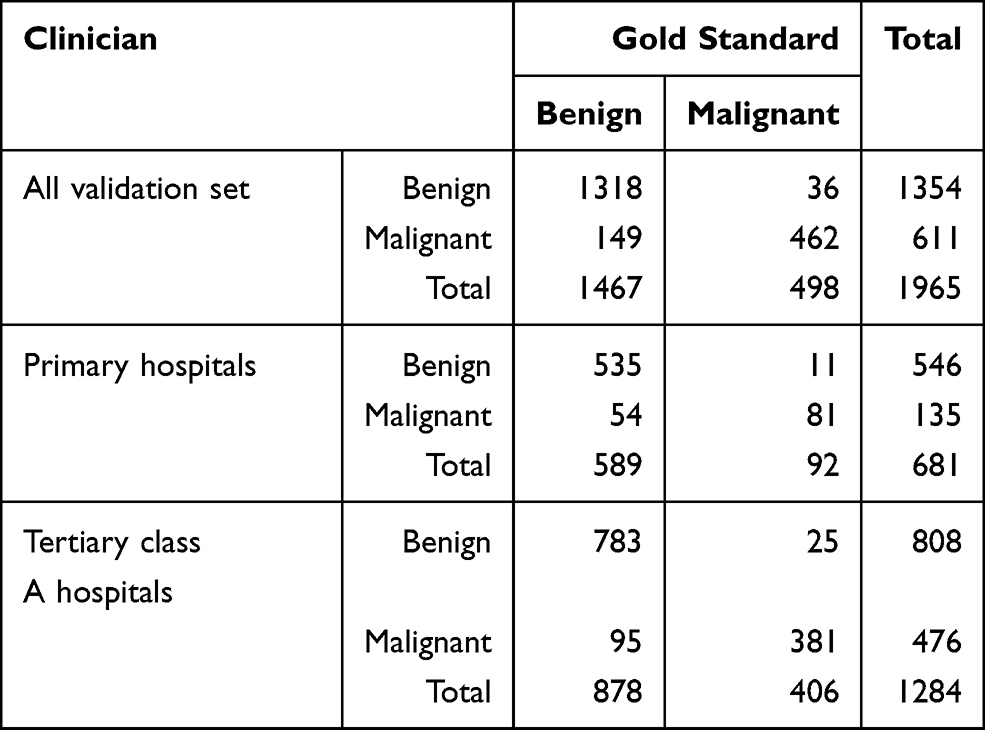 |
Table 6 Comparison Between Clinician Diagnosis and Gold Standard Diagnosis |
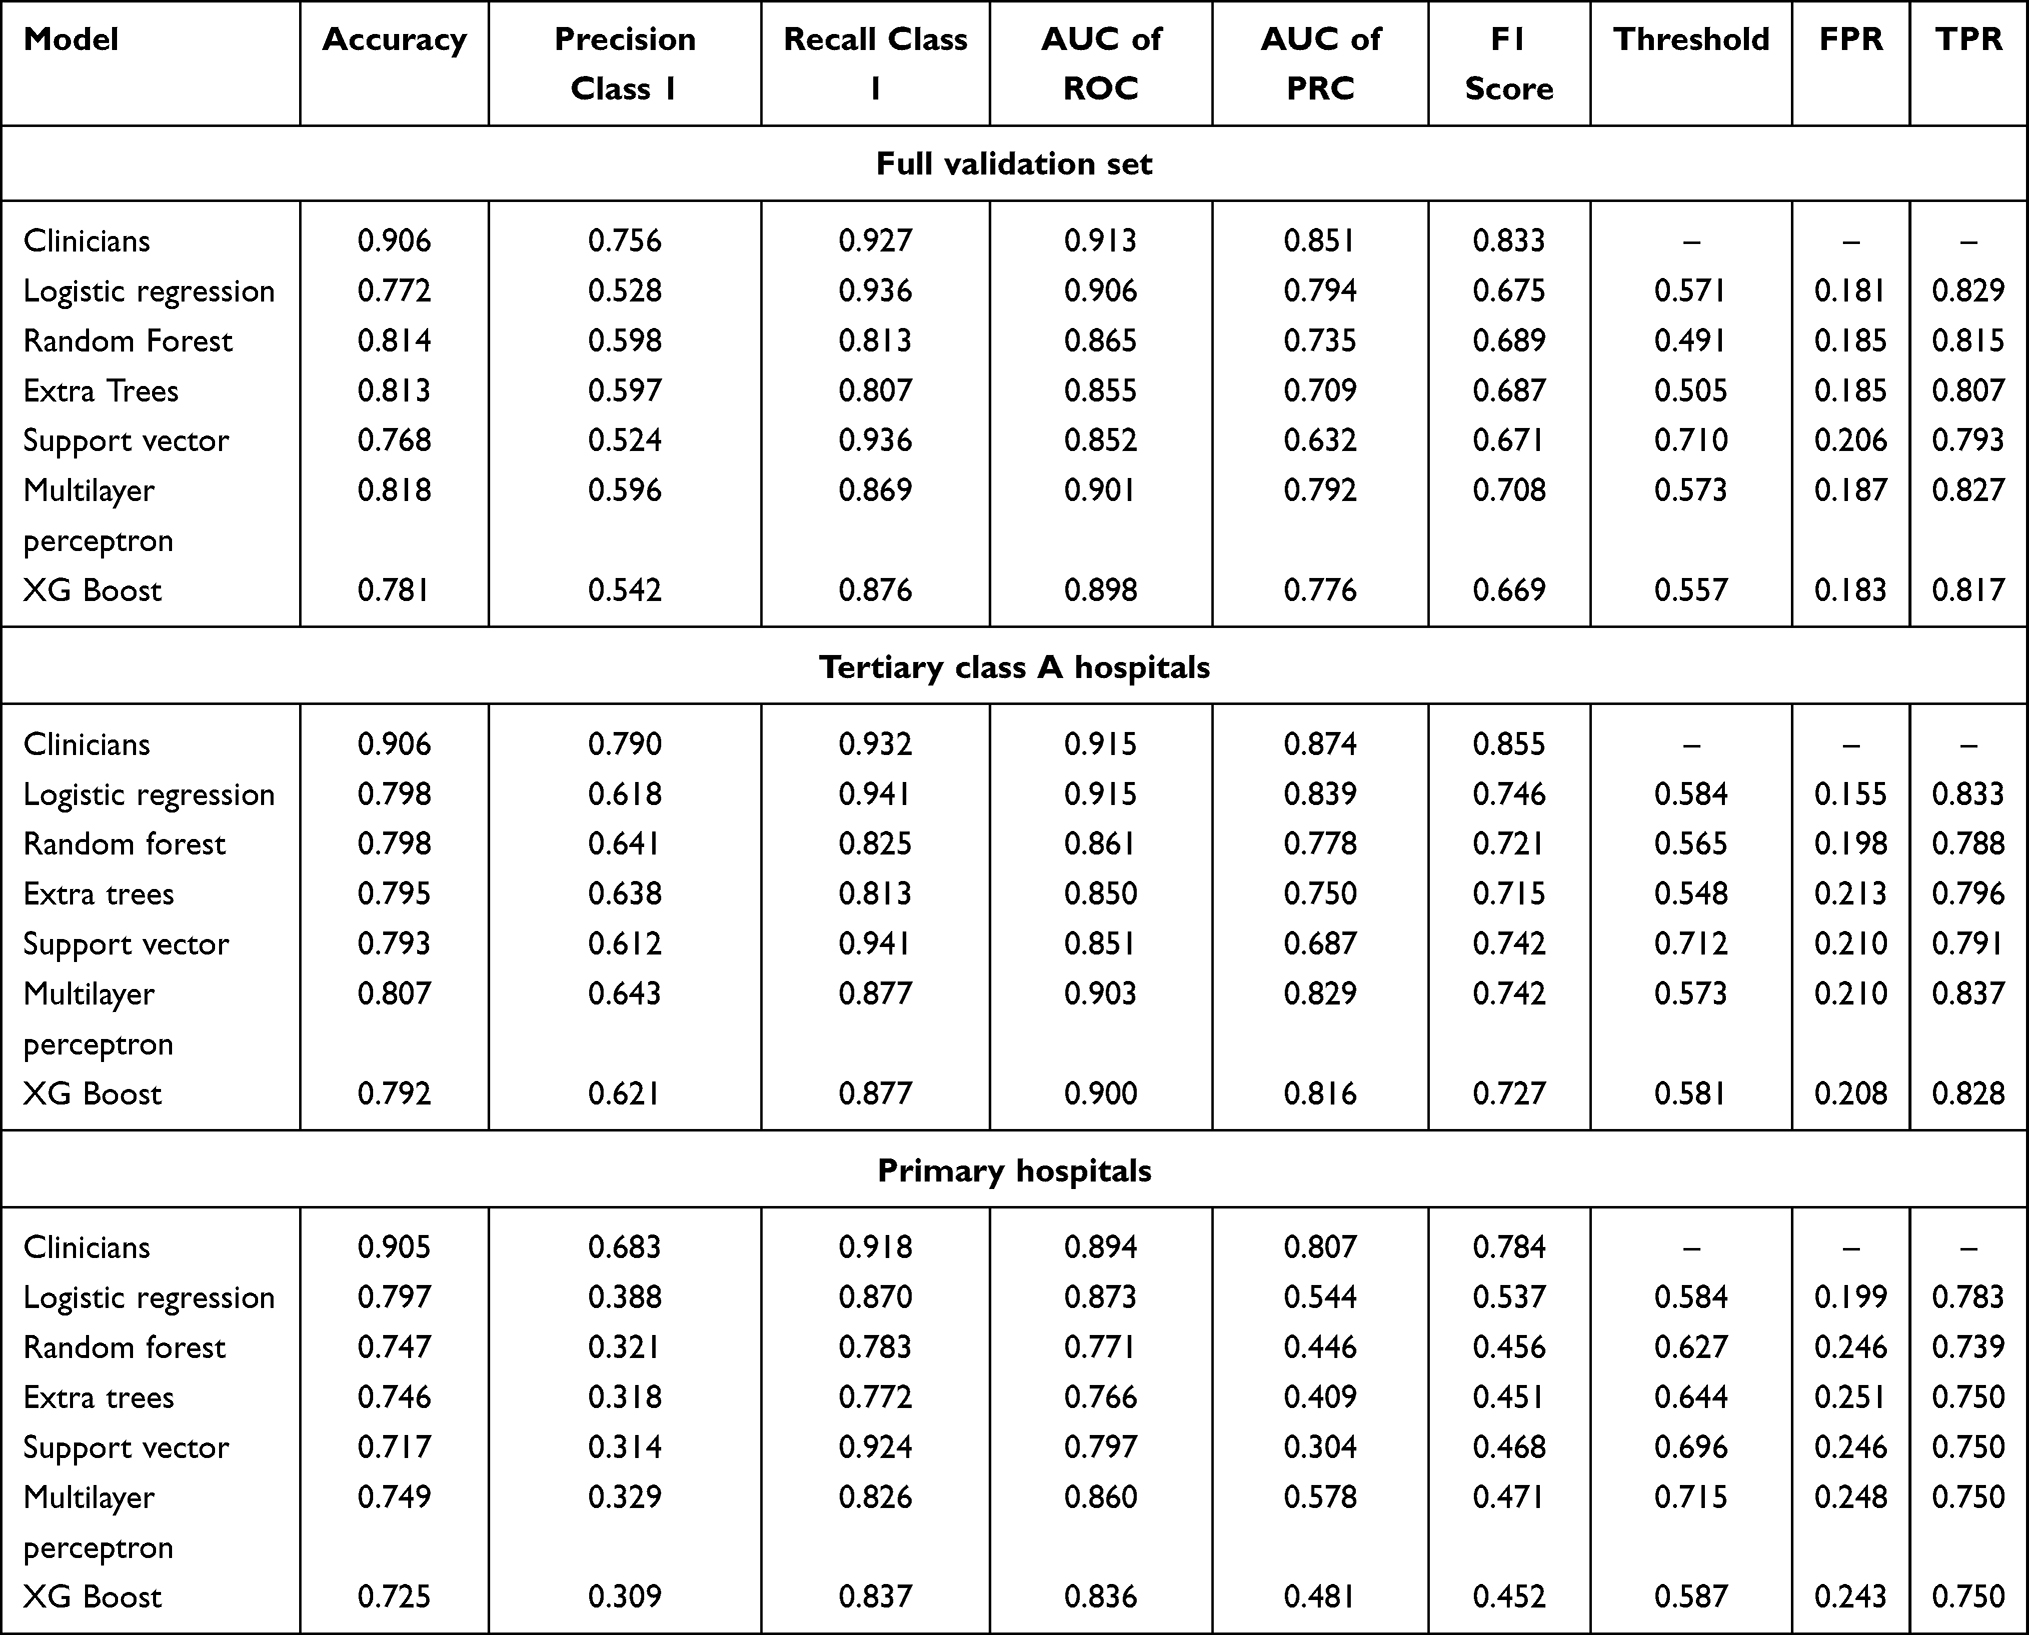 |
Table 7 Comparison Between Clinician and Model Diagnosis |
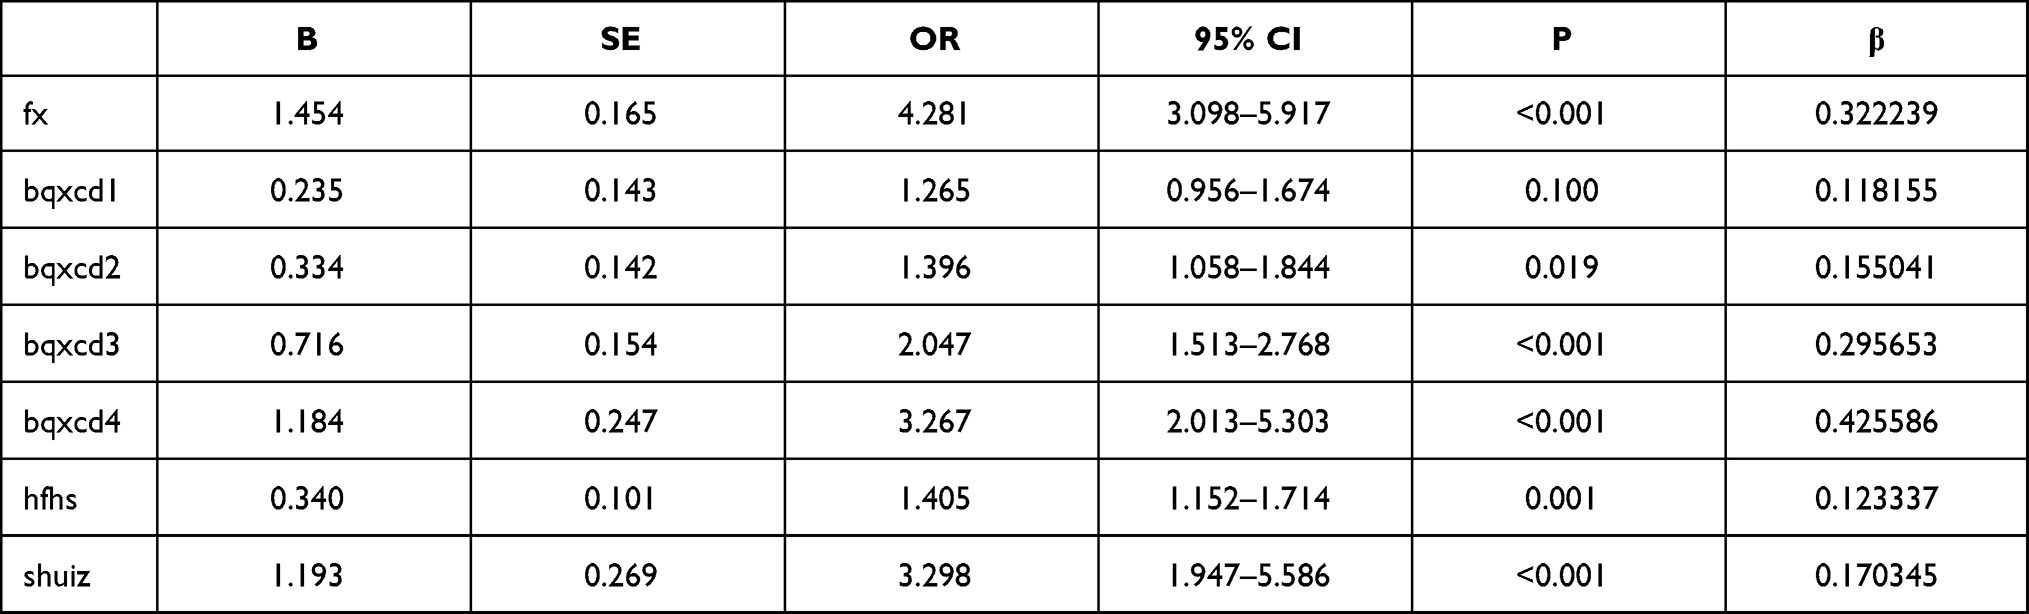 |
Table 8 Performance of the Logistic Regression Model |
Model Risk Probability Distribution
Our models enabled the prediction of BC and can thus be used by clinicians to make appropriate patient management decisions. As shown in Figure 4, the predictive capability of the models ranged from 0.2 to 0.4. We analyzed the model prediction probabilities according to 1%, 2%, 5%, 10%, 50%, 90%, 95%, 98%, and 99% and applied the logistic model in the clinic for preliminary evaluation of BC (Table 9).
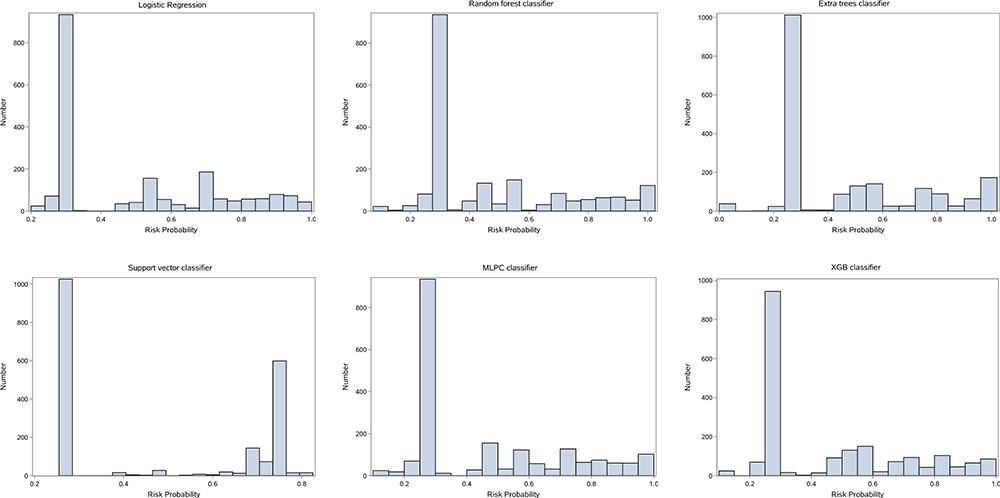 |
Figure 4 Probability distribution by model. |
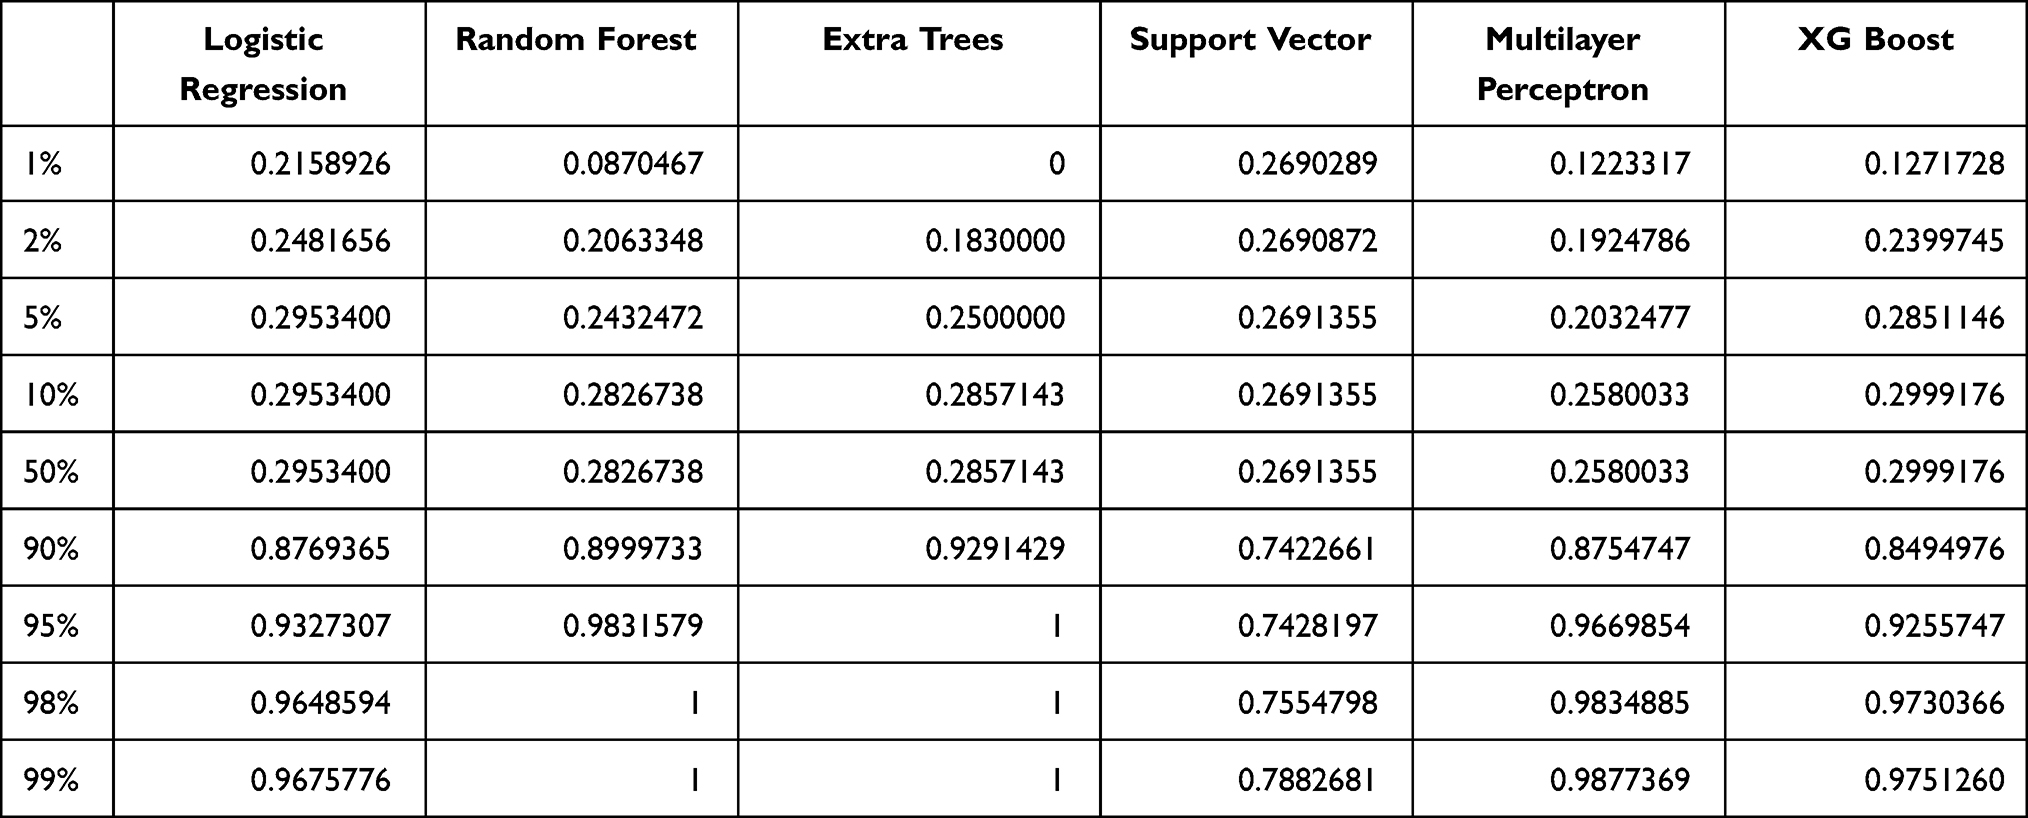 |
Table 9 Predicted Probability of Different Proportions of People by Model |
Discussion
Breast Cancer Screening Deficits
The increasing incidence of BC, which is primarily related to overdiagnosis and treatment, and the possibility of cancer omissions indicate the need for changes in BC screening procedures. Harkness’s review provides a detailed overview of risk-based BC screening strategies for women.25 Most cancer screening strategies primarily use mammography. However, its sensitivity in women with dense breast tissue is only 47.8–64.4%,26 limiting its benefit in this population. ABUS examination is an important screening method due to its safety and relatively low cost, especially in women with dense breast tissue. However, it is limited by its reliance on operators and high recall rates. High-level evidence on supplemental ultrasound is currently scarce.27 In a previous population-based cancer screening program in China, the overall proportion of positive ultrasound examinations was only 13.51% for high-risk women with BC.28
Advantages of Our Study
Many studies have reported advances in BC prediction models.29–33 However, previous predictive models based on the features of conventional ultrasound images of breast tumors provided limited value due to the small sample size used for modeling and lack of external verification.34–36 To the best of our knowledge, this is the first large-sample, multi-center, externally validated predictive model study that focuses on the use of ultrasound image features for BC screening.
Predictors of Breast Cancer
Based on our previous study that initially identified 27 independent variables,24 we selected 7 independent variables to develop six machine learning models for BC diagnosis. In our logistic regression model, tumor margin burr and the direction of tumor growth had a relatively profound impact on the differentiation between benign and malignant tumors. The odds ratio (OR) were 3.267 (2.013–5.303) and 4.281 (3.098–5.917), respectively (Table 8). This is consistent with the findings reported by Chhatwal et al37 that the most important predictors associated with BC as identified by this model were spiculated mass margins. Direction of tumor growth, non-identifiable and burr at the margins, and edema of the surrounding tissue showed the highest OR values. This indicated that non-parallel growth, non-identifiable margin burr, and edema of the surrounding tissue are the most important factors for predicting malignant BC. Wang et al also showed that axillary lymphadenopathy is indicative of the probability of metastasis in BC.38
Performance of the Predictive Models Compared to Those in Previous Studies
he average AUCs of the models in the test and validation sets were 0.741±0.052 and 0.880±0.025, respectively. At a threshold of 0.571, the logistic model achieved 82.9% sensitivity and 81.9% specificity in the validation set. The overall performance of the model in the validation set was better than that in the test set. Compared with internal verification, external verification is more concerned with model transportability and generalizability. Thus, we believe that the predictive model can be applied generally across population samples and has good promotion significance. Guo et al used 4 ultrasound image features to develop a logistic model of BC recurrence risk, with an AUC of 0.801.34 Gao et al conducted a multi-center study in China that combined the Gail model and the Breast Imaging Reporting and Data System (BI-RADS) category to differentiate malignant and benign breast lesions. The results showed that their combination achieved higher accuracy than did each model alone.39
Comparison of Outcomes Between Clinician and Models
When compared with clinician diagnosis, the logistic regression model showed lower accuracy (0.906 vs 0.772) and AUC (0.913 vs 0.906). When model performance was evaluated by type of hospital (tertiary class A hospitals and primary hospitals), the model performed better in primary hospitals than it did in tertiary class A hospitals. This may be due to the different distribution of benign and malignant tumors in both groups. The proportion of benign tumor patients was significantly higher in primary hospitals (n=892, 85.93%) than that in tertiary class A hospitals (n=575, 62.02%). For complex malignant tumors, predictions based on models alone is more likely to be biased. In primary hospitals, the accuracy of clinician diagnosis was higher than that of the logistic model (0.929 vs 0.806), and the AUC of clinician diagnosis was also slightly higher (0.913 vs 0.906). Similarly, the accuracy of clinician diagnosis in tertiary class A hospitals was higher than that of the logistic model (0.880 vs 0.734). The AUC of clinician diagnosis was also slightly higher than that of the logistic model (0.890 vs 0.875). The high sensitivity of clinician diagnosis in tertiary class A hospitals indicates that clinicians have a greater probability of accurately diagnosing malignant tumors, and the possibility of missed diagnosis is lower. Meanwhile, the high specificity of clinician diagnosis in primary hospitals indicates that clinicians in these hospitals can accurately diagnose benign tumors, and the possibility of misdiagnosis is lower.
Difference in AUC and Accuracy According to Model Performance Indicators
Although there was no significant difference in AUC between the model and clinician diagnosis, the accuracy seems markedly different. The imbalance in the classification between benign and malignant in the external validation set is an important reason for the low accuracy. The external validation set of 1965 cases included 498 cases of malignant tumors and 1467 cases of benign tumors. For example, this means that by simply all cases are benign, we can already achieve good accuracy: 1467/(1467 +498) = 74.7%. The 77.2% accuracy of the logistic model was calculated at a default threshold of 0.5 in the validation set. When the threshold was 0.571, the logistic model achieved 82.1% accuracy. Thus, we cannot compare the accuracy (a performance at one threshold) with the AUC (an average performance on all possible thresholds). Improper scoring rules such as proportion classified correctly, sensitivity, and specificity are not only arbitrary (in choice of threshold) but are improper. Appropriate scoring rules (Brier score) and c-index (semi-correct scoring rule area under the ROC curve; consistent probability) make us more confident in the correct scoring rules. The AUC is computed by adding all the “accuracies” computed for all the possible threshold values. Meanwhile, ROC is an average (expected value) of those accuracies when they are computed for all threshold values.
Explanation of Logistic Model Performance
Model performance was evaluated according to the AUC. Therefore, increasing the number of samples to obtain a more balanced data set may help improve the accuracy of the model. However, it has little contribution to improving the AUC. In addition, there is an imbalance in the distribution of benign and malignant samples in the real world due to several influencing factors such as tumor prevalence. An external validation of the model enables evaluation under conditions closer to the real world, thus determining its generalizability. Therefore, we did not choose to use a more balanced scale data set for external verification. Considering the shortcomings of the logistic model as a shallow learning, the model based on deep learning with better optimization capabilities for imbalanced categories may easily surpass the logistic model with respect to prediction accuracy to a certain extent. Finally, the diagnostic process involves the consideration of several data and not only on ultrasound images. Our model uses only very limited ultrasound features. Therefore, in theory, the model cannot achieve the high diagnostic efficiency of physicians from tertiary medical centers. However, the AUCs support a similar diagnostic accuracy of our model to that of physician diagnosis, and thus it can be used to distinguish between benign and malignant tumors.
Limitations
This study has some limitations. First, this study was mainly an external verification of the previous model. The independent variable in the model population is different from the verification population, which may cause a selection bias. Second, this study did not modify and improve the model because of the imbalance in the distribution of the predictor variables and classification, and thus the model has low accuracy. Future research should pay attention to selecting some complex models that can optimize the imbalance of sample proportions, such as deep learning, when constructing predictive models. Third, this study did not collect demographic information and baseline patient data, It was difficult to balance the patient baseline in the pre-modeling stage. This may have affected the performance of the model and introduced confounding factors. Future research can consider adding characteristic variables such as demography or building a compound model to improve predictive performance.
Conclusion
Of the six machine learning models, the logistic regression model showed the highest AUC and generalizability, indicating its potential for application in primary hospitals. Compared with clinician diagnosis, the logistic model showed better diagnostic efficiency, supporting its potential for application in BC screening in lower level medical centers.
Expert Recommendations
If the predicted probability in our logistic model was lower than 1% of the population (corresponding to a predicted probability of 0.2158926), it is highly likely that patients do not have to undergo pathological biopsy. Malignancy can be largely ruled out, and the patient can undergo regular follow-up. When the predicted probability is higher than 90% of the population (corresponding to a predicted probability of 0.8769365), it is highly indicative of malignant lesions, and clinicians are required to intervene. Patients should immediately undergo a pathological biopsy to confirm malignancy. For patients whose predicted probabilities are in between these values, a short-term follow-up (within 1 year, preferably 3 to 6 months) can be recommended.40 The clinicians can further use the models to assist in decision-making according to the follow-up outcomes. However, the cut-off value of the predictive probability needs to be verified and calculated in studies with a larger sample size.
Abbreviations
AUC, area under the receiver operating characteristic curve; BC, breast cancer; OR, odds ratio; ROC, receiver operating characteristic; ABUS, automated breast ultrasound screening.
Data Sharing Statement
The datasets used and/or analyzed during the current study are available from the corresponding author on reasonable request.
Acknowledgments
We are grateful to all patients and would also like to thank all of the staff involved in the study at the participating study sites.
Funding
This research was supported by Beijing Municipal Science and Technology Project (NO: D161100000816006).
Disclosure
The authors report no conflicts of interest in this work.
References
1. Bray F, Ferlay J, Soerjomataram I, et al. Global cancer statistics 2018: GLOBOCAN estimates of incidence and mortality worldwide for 36 cancers in 185 countries. CA Cancer J Clin. 2018;68:394–424. doi:10.3322/caac.21492
2. Fan L, Strasser-Weippl K, Li JJ, et al. Breast cancer in China. Lancet Oncol. 2014;15:e279–e289. doi:10.1016/s1470-2045(13)70567-9
3. Ma J, Jemal A, Fedewa SA, et al. The American Cancer Society 2035 challenge goal on cancer mortality reduction. CA Cancer J Clin. 2019;69:351–362. doi:10.3322/caac.21564
4. Chen W, Zheng R, Baade PD, et al. Cancer statistics in China, 2015. CA Cancer J Clin. 2016;66(2):115–132. doi:10.3322/caac.21338
5. Gao Y, Liu M, Shi S, et al. Diagnostic value of seven biomarkers for breast cancer: an overview with evidence mapping and indirect comparisons of diagnostic test accuracy. Clin Exp Med. 2020;20:97–108. doi:10.1007/s10238-019-00598-z
6. Yan C, Hu J, Yang Y, et al. Plasma extracellular vesicle‑packaged microRNAs as candidate diagnostic biomarkers for early‑stage breast cancer. Mol Med Rep. 2019;20:3991–4002. doi:10.3892/mmr.2019.10669
7. Kahraman M, Röske A, Laufer T, et al. MicroRNA in diagnosis and therapy monitoring of early-stage triple-negative breast cancer. Sci Rep. 2018;8:11584. doi:10.1038/s41598-018-29917-2
8. Nassar FJ, Nasr R, Talhouk R. MicroRNAs as biomarkers for early breast cancer diagnosis, prognosis and therapy prediction. Pharmacol Ther. 2017;172:34–49. doi:10.1016/j.pharmthera.2016.11.012
9. Loke SY, Munusamy P, Koh GL, et al. A circulating miRNA signature for stratification of breast lesions among women with abnormal screening mammograms. Cancers (Basel). 2019;11:1872. doi:10.3390/cancers11121872
10. Yang Y, Li F, Luo X, et al. Identification of LCN1 as a potential biomarker for breast cancer by bioinformatic analysis. DNA Cell Biol. 2019;38:1088–1099. doi:10.1089/dna.2019.4843
11. Qian X, Ruan L. APC gene promoter aberrant methylation in serum as a biomarker for breast cancer diagnosis: a meta-analysis. Thorac Cancer. 2018;9:284–290. doi:10.1111/1759-7714.12580
12. Ye M, Huang T, Ying Y, et al. Detection of 14-3-3 sigma (σ) promoter methylation as a noninvasive biomarker using blood samples for breast cancer diagnosis. Oncotarget. 2017;8:9230–9242. doi:10.18632/oncotarget.13992
13. Crigna AT, Samec M, Koklesova L, et al. Cell-free nucleic acid patterns in disease prediction and monitoring-hype or hope? EPMA J. 2020;11:1–25. doi:10.1007/s13167-020-00226-x
14. Phallen J, Sausen M, Adleff V, et al. Direct detection of early-stage cancers using circulating tumor DNA. Sci Transl Med. 2017;9:eaan2415. doi:10.1126/scitranslmed.aan2415
15. Goldstein E, Yeghiazaryan K, Ahmad A, et al. Optimal multiparametric set-up modelled for best survival outcomes in palliative treatment of liver malignancies: unsupervised machine learning and 3 PM recommendations. EPMA J. 2020;11:505–515. doi:10.1007/s13167-020-00221-2
16. Qian S, Golubnitschaja O, Zhan X. Chronic inflammation: key player and biomarker-set to predict and prevent cancer development and progression based on individualized patient profiles. EPMA J. 2019;10:365–381. doi:10.1007/s13167-019-00194-x
17. Samec M, Liskova A, Koklesova L, et al. Flavonoids against the Warburg phenotype-concepts of predictive, preventive and personalised medicine to cut the Gordian knot of cancer cell metabolism. EPMA J. 2020;11:377–398. doi:10.1007/s13167-020-00217-y
18. Yap MH, Pons G, Martí J, et al. Automated breast ultrasound lesions detection using convolutional neural networks. IEEE J Biomed Health Inform. 2018;22:1218–1226. doi:10.1109/JBHI.2017.2731873
19. Han S, Kang H-K, Jeong J-Y, et al. A deep learning framework for supporting the classification of breast lesions in ultrasound images. Phys Med Biol. 2017;62:7714. doi:10.1088/1361-6560/aa82ec
20. Fujioka T, Kubota K, Mori M, et al. Efficient anomaly detection with generative adversarial network for breast ultrasound imaging. Diagnostics. 2020;10:456. doi:10.3390/diagnostics10070456
21. Zhu Y-C, AlZoubi A, Jassim S, et al. A generic deep learning framework to classify thyroid and breast lesions in ultrasound images. Ultrasonics. 2021;110:106300. doi:10.1016/j.ultras.2020.106300
22. Fujioka T, Kubota K, Mori M, et al. Distinction between benign and malignant breast masses at breast ultrasound using deep learning method with convolutional neural network. Jpn J Radiol. 2019;37:466–472. doi:10.1007/s11604-019-00831-5
23. Yap MH, Goyal M, Osman FM, et al. Breast ultrasound lesions recognition: end-to-end deep learning approaches. J Med Imaging. 2018;6:011007.
24. Zhao Z, He YJOT. Application value of random forest and support vector machine in diagnosing breast lesions by using ultrasonic image features. Chin J Health Stat. 2018;35:684–688.
25. Harkness EF, Astley SM, Evans DG. Risk-based breast cancer screening strategies in women. Best Pract Res Clin Obstet Gynaecol. 2020;65:3–17. doi:10.1016/j.bpobgyn.2019.11.005
26. Kolb TM, Lichy J, Newhouse JH. Comparison of the performance of screening mammography, physical examination, and breast US and evaluation of factors that influence them: an analysis of 27,825 patient evaluations. Radiology. 2002;225:165–175. doi:10.1148/radiol.2251011667
27. Melnikow J, Fenton JJ, Whitlock EP, et al. Supplemental screening for breast cancer in women with dense breasts: a systematic review for the U.S. Preventive Services Task Force. Ann Intern Med. 2016;164(4):268–278. doi:10.7326/M15-1789
28. Wang Y, Chen H, Li N, et al. Ultrasound for breast cancer screening in high-risk women: results from a population-based cancer screening program in China. Front Oncol. 2019;9:286. doi:10.3389/fonc.2019.00286
29. Islam MM, Haque MR, Iqbal H, et al. Breast cancer prediction: a comparative study using machine learning techniques. SN Comp Sci. 2020;1(5):290. doi:10.1007/s42979-020-00305-w
30. Salod Z, Singh Y. A five-year (2015 to 2019) analysis of studies focused on breast cancer prediction using machine learning: a systematic review and bibliometric analysis. J Public Health Res. 2020;9:1792. doi:10.4081/jphr.2020.1772
31. Nindrea RD, Aryandono T, Lazuardi L, et al. Diagnostic accuracy of different machine learning algorithms for breast cancer risk calculation: a meta-analysis. Asian Pac J Cancer Prev. 2018;19:1747.
32. Yassin NIR, Omran S, El Houby EMF, Allam H. Machine learning techniques for breast cancer computer aided diagnosis using different image modalities: a systematic review. Comput Methods Programs Biomed. 2018;156:25–45. doi:10.1016/j.cmpb.2017.12.012
33. Kumar M, Khatri SK, Mohammadian M. Breast cancer identification and prognosis with machine learning techniques - an elucidative review. J Interdiscip Math. 2020;23:503–521. doi:10.1080/09720502.2020.1731963
34. Guo Q, Zhang L, Di Z, et al. Assessing risk category of breast cancer by ultrasound imaging characteristics. Ultrasound Med Biol. 2018;44:815–824. doi:10.1016/j.ultrasmedbio.2017.12.001
35. Niu Z, Tian JW, Ran HT, et al. Risk-predicted dual nomograms consisting of clinical and ultrasound factors for downgrading BI-RADS category 4a breast lesions - a multiple centre study. J Cancer. 2021;12:292–304. doi:10.7150/jca.51302
36. Luo WQ, Huang QX, Huang XW, et al. Predicting breast cancer in Breast Imaging Reporting and Data System (BI-RADS) ultrasound category 4 or 5 Lesions: a nomogram combining radiomics and BI-RADS. Sci Rep. 2019;9:11921. doi:10.1038/s41598-019-48488-4
37. Chhatwal J, Alagoz O, Lindstrom MJ, et al. A logistic regression model based on the national mammography database format to aid breast cancer diagnosis. Am J Roentgenol. 2009;192:1117–1127. doi:10.2214/AJR.07.3345
38. Wang ZL, Li JL, Li M, et al. Study of quantitative elastography with supersonic shear imaging in the diagnosis of breast tumours. Radiol Med. 2013;118:583–590. doi:10.1007/s11547-012-0903-x
39. Gao LY, Gu Y, Tian JW, et al. Gail model improves the diagnostic performance of the fifth edition of Ultrasound BI-RADS for Predicting Breast Cancer: a multicenter prospective study. Acad Radiol. 2020. doi:10.1016/j.acra.2020.12.002
40. Liberman L, Menell JH. Breast imaging reporting and data system (BI-RADS). Radiol Clin North Am. 2002;40:409–430. doi:10.1016/S0033-8389(01)00017-3
 © 2021 The Author(s). This work is published and licensed by Dove Medical Press Limited. The full terms of this license are available at https://www.dovepress.com/terms.php and incorporate the Creative Commons Attribution - Non Commercial (unported, v3.0) License.
By accessing the work you hereby accept the Terms. Non-commercial uses of the work are permitted without any further permission from Dove Medical Press Limited, provided the work is properly attributed. For permission for commercial use of this work, please see paragraphs 4.2 and 5 of our Terms.
© 2021 The Author(s). This work is published and licensed by Dove Medical Press Limited. The full terms of this license are available at https://www.dovepress.com/terms.php and incorporate the Creative Commons Attribution - Non Commercial (unported, v3.0) License.
By accessing the work you hereby accept the Terms. Non-commercial uses of the work are permitted without any further permission from Dove Medical Press Limited, provided the work is properly attributed. For permission for commercial use of this work, please see paragraphs 4.2 and 5 of our Terms.