")
Back to Journals » Risk Management and Healthcare Policy » Volume 12
Machine Learning For Tuning, Selection, And Ensemble Of Multiple Risk Scores For Predicting Type 2 Diabetes
Authors Liu Y, Ye S , Xiao X, Sun C , Wang G, Wang G, Zhang B
Received 2 August 2019
Accepted for publication 8 October 2019
Published 5 November 2019 Volume 2019:12 Pages 189—198
DOI https://doi.org/10.2147/RMHP.S225762
Checked for plagiarism Yes
Review by Single anonymous peer review
Peer reviewer comments 2
Editor who approved publication: Professor Marco Carotenuto
Yujia Liu,1 Shangyuan Ye,2 Xianchao Xiao,1 Chenglin Sun,1 Gang Wang,1 Guixia Wang,1 Bo Zhang3
1Department of Endocrinology and Metabolism, The First Hospital of Jilin University, Changchun, Jilin 130021, People’s Republic of China; 2Department of Population Medicine, Harvard Pilgrim Health Care and Harvard Medical School, Boston, MA, USA; 3Department of Neurology and ICCTR Biostatistics and Research Design Center, Boston Children’s Hospital and Harvard Medical School, Boston, MA, USA
Correspondence: Bo Zhang
Department of Neurology and ICCTR Biostatistics and Research Design Center, Boston Children’s Hospital and Harvard Medical School, 21 Autumn Street, Boston, MA 02115, USA
Email [email protected]
Guixia Wang
Department of Endocrinology and Metabolism, The First Hospital of Jilin University, 71 Xinmin Street, Changchun, Jilin 130021, People’s Republic of China
Email [email protected]
Background: This study proposes the use of machine learning algorithms to improve the accuracy of type 2 diabetes predictions using non-invasive risk score systems.
Methods: We evaluated and compared the prediction accuracies of existing non-invasive risk score systems using the data from the REACTION study (Risk Evaluation of Cancers in Chinese Diabetic Individuals: A Longitudinal Study). Two simple risk scores were established on the bases of logistic regression. Machine learning techniques (ensemble methods) were used to improve prediction accuracies by combining the individual score systems.
Results: Existing score systems from Western populations performed worse than the scores from Eastern populations in general. The two newly established score systems performed better than most existing scores systems but a little worse than the Chinese score system. Using ensemble methods with model selection algorithms yielded better prediction accuracy than all the simple score systems.
Conclusion: Our proposed machine learning methods can be used to improve the accuracy of screening the undiagnosed type 2 diabetes and identifying the high-risk patients.
Keywords: type 2 diabetes, risk score, machine learning, voting, stacking, prediction
Introduction
A variety of clinical studies have shown that the occurrence of diabetes is closely related to lifestyle,1–3 and active lifestyle interventions for groups at high risk for developing diabetes can reduce the incidence of the desease.2,4,5 Therefore, using non-invasive diabetes risk assessment tools for the early detection of high-risk individuals followed by implementing active interventions is of great importance to prevent the occurrence and development of such chronic epidemics. These assessment tools can save human and financial resources and have good compliance. Thus, non-invasive diabetes risk assessment tools can improve public health education and health awareness, which are especially important in areas that lack health resources.
Due to the heterogeneity in lifestyles and genetics, the characteristics of the type 2 diabetes (T2D) epidemic in the Asian population, including Chinese, are significantly different from those in the Western population.6 There are also differences in ethnicity, region, and economic status between Western and Asian populations. However, most of the reported T2D risk prediction models or scoring tools are based on Western populations,7 and they may not be applicable to other races. Therefore, the performance of existing T2D assessment tools has varied when applied to other populations, and research efforts are needed to establish corresponding new forecasting models or assessment tools that are based on different characteristics.8,9 For the Chinese population, in 2013, Zhou et al10 established a simple clinical scoring tool for screening undiagnosed T2D patients using cross-sectional survey data on diabetes prevalence in China. The scoring system included gender, age, body mass index (BMI), waist circumference (WC), family history of diabetes, and systolic blood pressure as risk factors. Ye et al11 established another risk prediction model for Shanghai and Beijing population: the model’s risk factors included gender, hypertension, body mass index, fasting blood glucose, glycosylated hemoglobin, and C-reactive protein (CRP). Several other T2D risk prediction models or scoring tools based on Chinese population data have been reported.12,13 The validation data indicate that these scoring tools are significantly better than other Western-based scoring tools.
Previous studies have shown that differences in population characteristics may be a reason for the unsatisfactory performance of diabetes risk assessment tools when one risk score system that was developed in a region is applied to other different regions. We compared the risk score systems developed from Asian populations,8,13 with the ones developed from Western populations.14,15 and concluded that these risk scores were constructed with largely different risk factors and different score categories in each risk factor. For example, body mass index (BMI) and waist circumference (WC) are two common risk factors for both Western and Asian population. For Asian population, a male with BMI >28 kg/ or WC >05 cm is classified in high-risk group, but only the males with BMI >30 kg/
 or WC >102 cm will be considered as high-risk for Western population. These deviations in performance are attributed to differences in ethnicity, environmental factors, eating habits, and social development, all of which can vary among different populations. In addition, if only the cut off values in the relevant reports are used, the sensitivity and specificity of the models may not be optimal when using a new dataset. Therefore, risk score systems developed for other populations may not necessarily apply to the domestic population. It has been suggested that when introducing foreign assessment tools, the applicability should first be verified, or adjusted according to the characteristics of the population in the region. The adjustment should be based on the basic characteristics of the population in the region, and the basic characteristics in the database should be further explored.
Data mining and machine learning techniques has been widely applied to diabetes related research. Kavakiotis et al16 conducted a systematic review in this area and concluded that “prediction and diagnosis” was one of the main purpose of applying machine learning techniques in diabetes research. Support vector machine,17 tree-based methods (e.g. decision tree and random forest),18 and neural network19 were three commonly used machine learning techniques for diabetes risk prediction. However, combination algorithms20,21 have not yet been applied to diabetes risk prediction in the literature. In this article, we proposed to use combination algorithms to combine multiple existing non-invasive risk score systems.
There were two goals of this study. Firstly, we developed two new simple and non-invasive diabetes risk score systems for Chinese adults living in Northeastern China. Secondly, we investigated the performance of different combination algorithms, which combined the prediction results of existing simple score systems. The new methods can be used to automatically build risk prediction models that perform similarly to or even better than the best simple score system.
Materials And Methods
Study Population
The data were collected from a detailed personal survey completed by long-term residents of Changchun City who were aged 40 and over and participated in the 2011 REACTION study22 [Risk Evaluation of Cancers in Chinese Diabetic Individuals: A Longitudinal Study]. Blood samples were also provided for relevant laboratory testing and were eventually included in the study analysis. Personal questionnaires were used to gather information related to smoking, drinking, tea, diet, sports, watching TV and other lifestyles, sleep status, emotional scale, female menarche age, menopausal age, number of births, etc. The data collected also include detailed demographic parameters, fasting and postprandial 2 hr blood glucose and insulin levels, HbA1C levels, liver and kidney function, and lipid metabolism levels.
This is a cross-sectional study that used a stratified random sampling method, and the following were randomly selected: 6 community health service centers in Changchun City, 3 communities within each community health service center, 560 individuals in each community. Long-term residents aged 40 and over are the subject of this research. According to the above sampling scheme, the sample population should comprise a total of 10,080 subjects, and the actual number of screened individuals was 9571 for a response rate of 94.95%. Ultimately, we enrolled a total of 5481 subjects who met the criteria of having a complete medical history and no other self-reported types of diabetes.
Clinical Evaluation And Laboratory Measurements
The subject’s informed consent was obtained on the day prior to their evaluation, and the time of the on-site investigation was reserved. The subject was confirmed to be in a fasting state. On-site questionnaires were conducted by 4—6 trained doctors and medical students. The questionnaire includes general information, medical history, family history, birth history, eating habits, exercise habits, smoking history, drinking history, and sleep status; general information includes name, gender, date of birth, contact information, etc.; medical history includes the existence of diabetes, cardiovascular and cerebrovascular diseases, tumors, and liver and kidney diseases. Family history mainly refers to the family history of diabetes; reproductive history is mainly for female research subjects; diet habits include the type of food, as well as the amount and frequency of intake; and exercise habits include exercise patterns and timing. Questionnaires were written in strict accordance with the uniform format.
When measuring height and weight, the subjects wore only light and thin clothing, except for shoes and socks, standing upright on the scale, and the height and weight values were read to 0.1cm and 0.1 kg respectively. The waist circumference and hip circumference were measured using a soft ruler. Blood pressure and pulse were measured by an OMRON electronic sphygmomanometer after the patient had been sitting for 5 mins. Blood pressure and pulse were recorded and kept to 1 mmHg and 1 time/min, respectively. The average of 3 consecutive measurements was taken, with 1 min intervals between measurements. With subjects in the fasting state, two nurses collected venous blood in an EDTA anticoagulation tube, sodium fluoride anticoagulant tube, and procoagulant tube for glycated hemoglobin, blood glucose, and insulin; blood lipids; and makers of liver and kidney function, respectively. After completing the above physical examination, a nurse put 75 g of anhydrous glucose into about 300 mL of glucose solution, and the subject consumed the entire volume of the syrup within 5 mins, timed from the beginning of drinking. The nurse then tended to the patient for 2 hrs. Hypertension is defined as a systolic blood pressure of ≥140 mmHg, and/or a diastolic blood pressure of ≥90 mmHg; BMI is calculated by weight (kg) divided by height squared (m2). A subject is diagnosed with Type 2 diabetes if either 1) fasting blood glucose is greater than or equal to 7.0 mmol/L or 2) two-hour post-meal blood glucose is greater than or equal to 11.0 mmol/L. The study has been approved by the ethics committee of The First Hospital of Jilin University, and was conducted in accordance with the Declaration of Helsinki. The participant consent of the study was written informed consent that was signed by and obtained from the study participants.”
Statistical Analysis
Statistical analysis was performed in the statistical environment R. In this analysis, we restricted our study to 5,481 subjects with complete medical histories and no other self-reported types of diabetes. The baselines were set separately for men/women and non-diabetics/diabetics. Means and standard deviations (SD) are reported for continuous random variables, and counts (N) and percentage (%) are reported for categorical random variables.
Because of the rich demographic information included in our dataset, we applied three penalized likelihood methods, the least absolute shrinkage and selection operator23 (LASSO), smoothed clipped absolute deviation24 (SCAD), and minimax concave penalized likelihood25 (MCP), which are commonly used on selecting variables for high-dimensional models,26 were used to automatically select significant non-invasive risk factors for Type 2 diabetes. A more conservative model selection method for ultrahigh-dimensional model, the iterative sure independence screening (ISIS)27 procedure for variable selection in logistic regression and the traditional stepwise logistic regression were also applied to this dataset. Penalized likelihood methods add a penalty term to the log-likelihood function when fitting a logistic regression model, and the penalty term is used to regulate the fitted model. All parameters are shrunk towards 0, and parameters that are weakly associated with the response variable will automatically assigned 0. The ISIS procedure, in our case, iteratively applies the penalized likelihood method to select important variables. For the stepwise logistic regression, we first fitted the full parameter logistic regression model, and then logistic regressions were fitted while parameters were dropped sequentially. The Akaike information criterion (AIC) determined the final variables to include in the model. A total of thirty-one candidate variables were included in the model selection step, and only the variables with positive coefficients and clinical relevance variables were retained in the final models. The final models were built on the selected variables using logistic regression.
Two simple point systems were derived from the fitted models following the process described by Sullivan and his colleagues.28 Continuous random variables were first categorized, and median values were used as reference values for each category. The reference values for categorical random variables were zeros and ones. The distances of each category from the base category in regression units were calculated by the product of the corresponding regression coefficients and the difference between reference values for each category and the reference value for the base category. The point scores for each category can be considered as the weighted integers that represent these distances.
Combination methods were used to combine the classification results of several different score systems. Two types of ensemble algorithms were applied to our dataset: voting and stacking. Majority voting, also known as the basic ensemble method, is one of the most fundamental ensemble methods used for classification.21 Every score system classified one object, and the final decision was the one that received more than half of the votes. One possible improvement, called performance weighting,29 marks each score system proportional to its performance (the sum of sensitivity and specificity in our case) on the validation dataset. Because of the possible correlation between different classifiers, the necessity of classifier selection for voting methods were discussed by several articles,21,30,31 and we also applied penalized regression model selection methods to the voting methods. Voting methods typically work well if the base-classifiers (score systems) perform the same task and have comparable success.32
The stacking method,33,34 one of the most well-known meta-learning methods, was used to combine the classification results of several different score systems, which are called first-level learners in stacking, by using another learning model called the second-level learner or meta-learner. Van der Laan35 introduced the super learner, which trained the meta-learner with a cross-validation algorithm that proved to be asymptotically optimal. Based on K-fold cross-validation scheme (K = 10 in our case), the training dataset was split into K equally sized groups, that were stratified by the response variable (diabetes). We put the k-th group into the validation dataset, built first-level learners using the remaining data, and collected the prediction values from the validation data as the covariates of the meta-leaner. The above procedure was repeated for every fold, along with the original response variable, to generate a complete dataset (called “leave-one data”) for training the meta-learner. Several studies33,34,36 have proposed using logistic regressions with a positive constraint on the coefficients as the meta-learner, and Debray and colleagues36 suggested performing model selection. We used different penalized likelihood methods (LASSO, SCAD, MCP) on the meta-learner to automatically select the best-fitted model.
Prediction results for our new models were compared with other non-invasive score systems derived from other populations. The original dataset was randomly divided into 70% (n = 3,837) training data and 30% (n = 1,644) testing data, stratified by diabetes status. The training data were used to determine the cutoff points for each score system by maximizing the sum of sensitivity and specificity, and the testing data were used to evaluate the classification performance. The accuracy was assessed by the area under the receiver operating characteristic curve (AUC) for each risk score. Sensitivity, specificity, positive predictive value (+PV), negative predictive value (-PV), positive likelihood ratio (+LR), negative likelihood ratio (-LR), and Youden index (sum of sensitivity and specificity minus one) were also calculated. P-values were determined by the Hosmer-Lemeshow test, where significant p-values (<0.05) indicates good fit of the corresponding model.
Results
The baseline characteristics are summarized in Table 1. Of the 5,481 participants, 66.9% were women, 22.7% identified as diabetic, 16% were current smokers, 4% were cancer patients, 13% had a family history of diabetes, and 12% were hypertensive. Compare with men, women had higher means of BMI (body mass index), HDL (high-density lipoprotein), LDL (low-density lipoprotein), and cholesterol, but they had lower means on all other variables. P-values showed that the differences between men and women were statistically significant at the 0.05 level for all variables except hypertension. Compared with non-diabetes, diabetes had higher overall means (or percentages) for most baseline characteristics, and the differences were significant at the 0.05 level for all variables except current smoker and tumor. More information can be found in Supplementary material, Table S13.
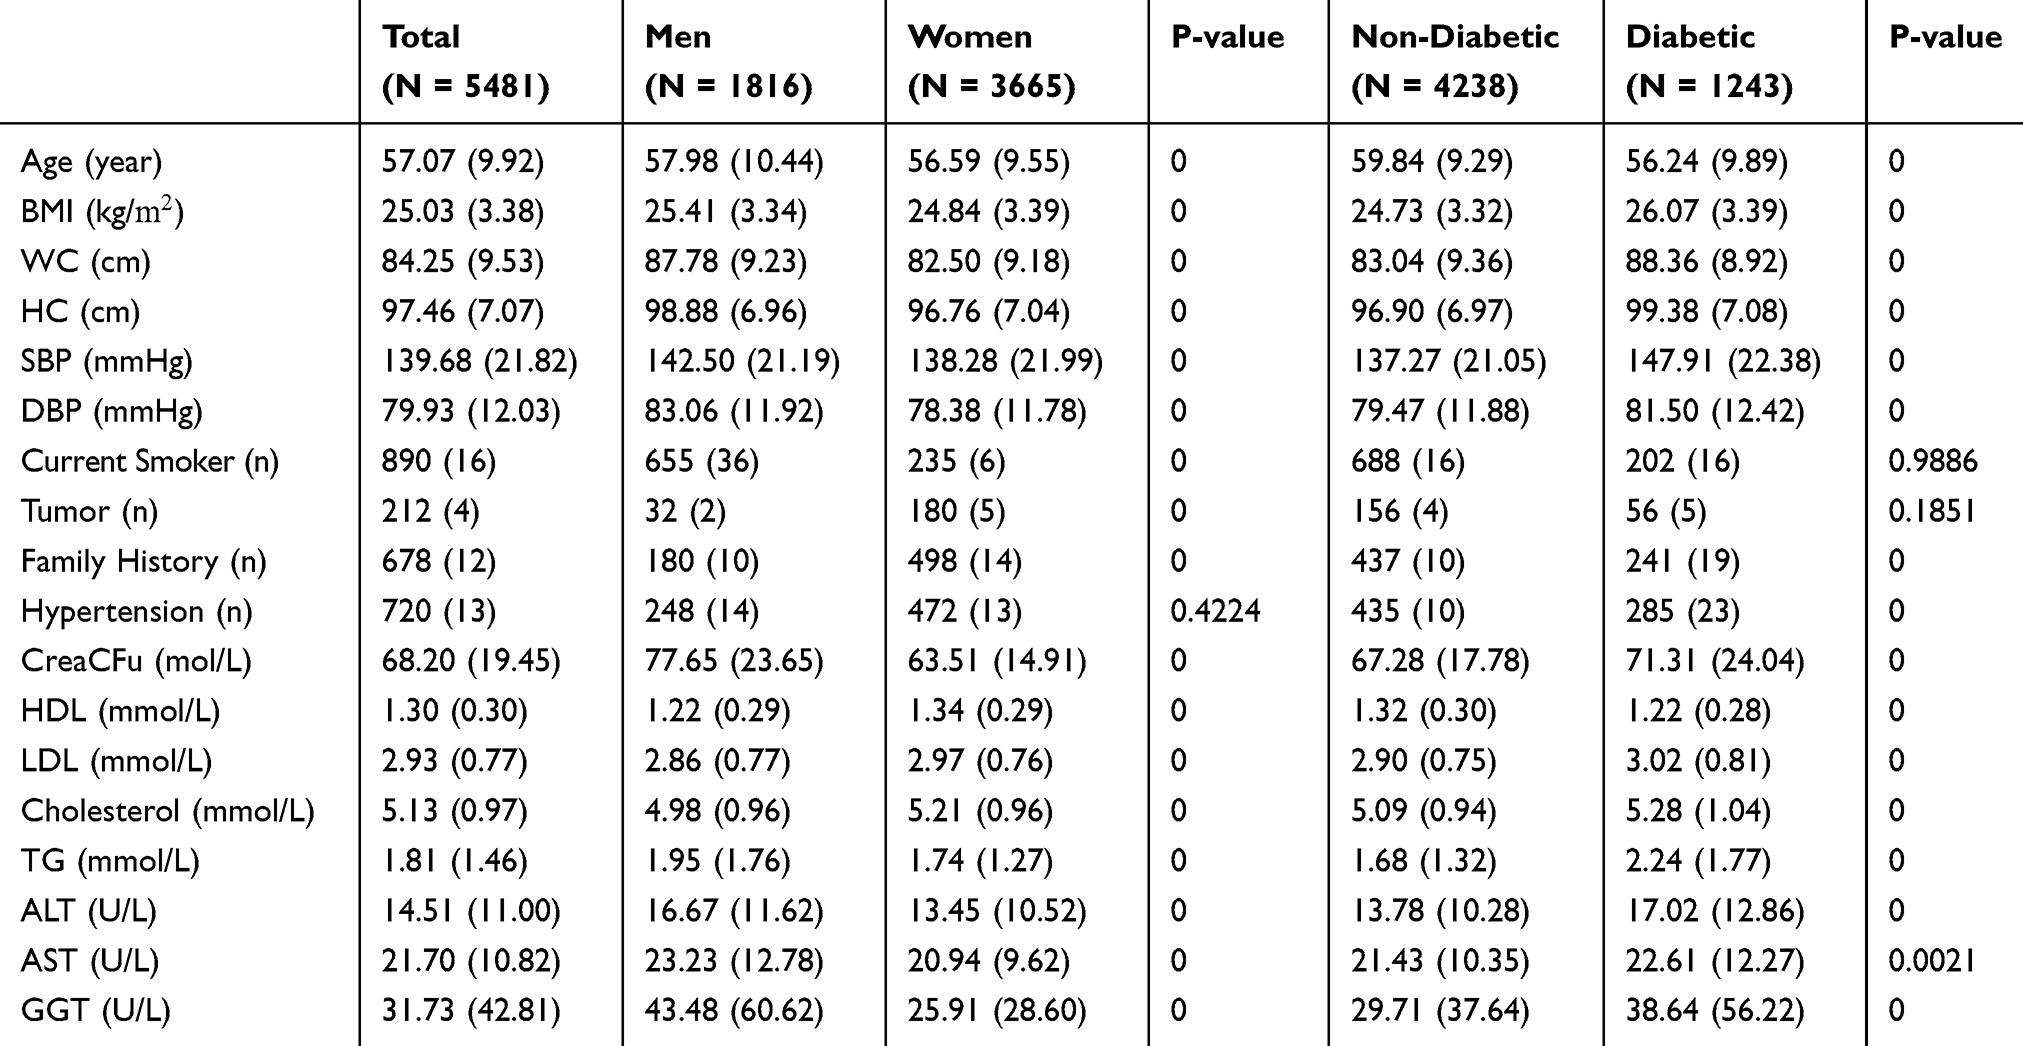 |
Table 1 Baseline Characteristics Of The 5,481 Participants |
The variable selection results on the training dataset for LASSO, SCAD, MCP, stepwise logistic regression, and ISIS are summarized in Table 2. All the medical history variables included in the models were self-reported except for hypertension, which is defined as a systolic blood pressure of ≥140 mmHg and/or a diastolic blood pressure of ≥90 mmHg. The three penalized likelihood selectors (LASSO, SCAD, MCP) selected similar variables. Age, waist circumference, hypertension, family history of diabetes, MI, chronic gastroenteritis, and high cholesterol were commonly selected variables. Of these variables, we excluded chronic gastroenteritis from our final model because its estimated coefficient was negative in all of the models. Two more variables—gallstones and fatty liver—were selected by LASSO. We also excluded these variables since they are clinically irrelevant to diabetes. Stepwise logistic regression selected more variables than the penalized likelihood selectors. However, since those extra variables either had negative coefficients (stomach ulcer, chronic bronchitis) or are clinically irrelevant to diabetes (tumor), we also excluded these variables from the final model. Thus, six common risk factors from the first four models were selected for our new score system. Of these six, four variables—age, waist circumference, family history of diabetes, and high cholesterol—were selected by the more conservative model selection algorithm ISIS. Since the other two variables were positive and included in the other models, we built another score system by using only the four risk factors selected by the ISIS model.
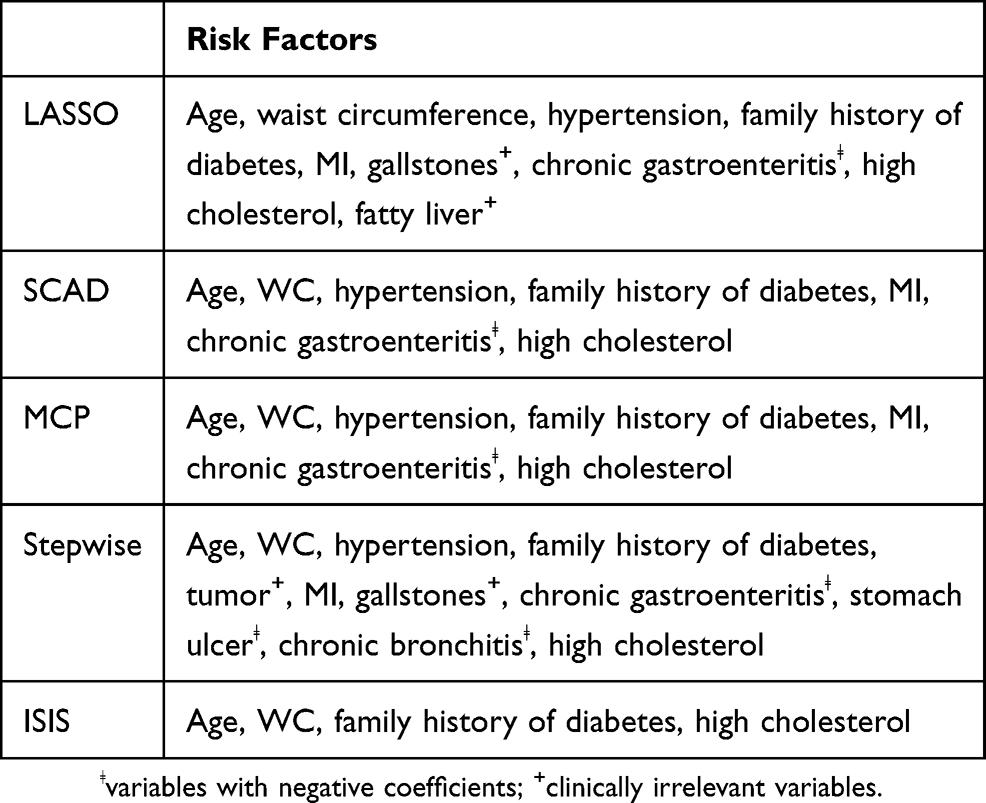 |
Table 2 Variable Selection Results For LASSO, SCAD, MCP, Stepwise Logistic Regression, And ISIS |
Two logistic regressions were fitted on the training dataset using the two sets of selected variables, and simple score systems were developed using the regression coefficients and reference values. The scores are shown in Supplementary material, Tables S1 and S2. The first non-invasive score system included age (3 points), waist circumference (5 points), hypertension (2 points), family history of diabetes (3 points), high cholesterol (2 points), and MI (3 points). The score range was from 0 to 18 points. The points distribution of the four variables in the second non-invasive score system was the same as that of the first system, and the score ranged from 0 to 13 points.
Many non-invasive score systems have been derived from other populations in Eastern Asian8,10,12,13,37 and Western countries.9,14,15,38 The score systems were summarized in Supplementary material Tables S4–S12. The risk factors often included in these score systems are age, sex, BMI, WC, family history of diabetes, hypertension, antihypertension medicine, physical activities, and smoking. These models were applied in our dataset; the training data were used to determine the cutoff value, and the testing data were used to evaluate the models. The resulting predictions using the testing data are summarized in Supplementary material, Table S3. With an optimal cutoff value of 32, the Chinese diabetes risk score had the highest AUC (0.714) and Youden index (0.316). The prediction results for our new score systems are also summarized in Table S3. The optimal cutoff values were 8 and 4, respectively. The AUCs and Youden indexes were a little worse than the Chinese diabetes risk score but better than all other score systems. However, by comparing the AUCs of our new score systems with that of the Chinese diabetes risk score using a bootstrap test, we found that the differences were not significant at a significance level of 0.05 (p-values equal to 0.4742 and 0.2359, respectively). Similarly, by comparing the Youden indexes of our new score systems with that of the Chinese diabetes risk score using the statistical test proposed by Chen and colleagues,39 we found that the differences were also not significant at a significance level of 0.05 (p-values equal to 0.3331 and 0.3896, respectively). Hence, our new score systems are compatible with all other existing score systems in our dataset. Comparison of sensitivities and specificities for these scores can be found in Supplementary material Figure S1.
Different combination methods—voting and stacking—were applied to the 11 non-invasive score systems. For voting methods, we applied majority voting and weighted voting with or without model selection to our dataset. All model selection algorithms (LASSO, SCAD, MCP, stepwise logistic regression) selected the same classifiers in the final model. For stacking methods, we used logistic regression with a positive coefficient constraint, along with different model selection methods (LASSO, SCAD, MCP, and stepwise logistic regression) as our meta-learner. The results are summarized in Table 3. A comparison of the Youden indexes and AUCs revealed that voting methods with model selection performed not only the best but also significantly better than all the individual score systems. Also, all these models outperformed most of the original score systems (8 out of 11). Comparisons between different combination methods showed that all voting methods performed better than stacking. Voting typically works well if the base classifiers (score systems) perform the same task and have comparable success, although stacking works well for different types of first-level classifiers.32 Using the statistical tests specified above (AUC test and Youden index test), the performance of the voting method with model selection was compared with that of the Chinese risk score, which performed the best among all the first-level classifiers according to the AUC and Youden index. Both tests showed that the differences were statistically significant at a significance level of 0.05 (p-value = 0 for the AUC test and p-value = 0.0319 for the Youden index test). To further investigate the performance of the combination methods, we also applied these models using 9 risk scores that were established in previous studies, as listed in Table S3 (FINDRISC, AYSDRISK, French, Cambridge, rural Chinese, Thai, Chinese, Qingdao, Japanese), and the results are summarized in Table 4. Comparing the Youden index and AUC indicated that all of these combination methods produced better classification results than the 2 newly established score systems, and the four voting methods gave better results than all of the original score systems. Again, voting with model selection performed best. Similar to above, the performance of the voting method with model selection was compared with that of the Chinese risk score using statistical tests, and both tests showed that the differences were statistically significant at a significance level of 0.05 (p-value = 0 for the AUC test and p-value = 0 for the Youden index test). Therefore, we can conclude that the results in both Tables 3 and 4 suggest that voting is the preferred method for combining risk score systems, and the method can significantly enhance the performance of risk prediction. With stacking methods, model selections had very minor impacts on the performance of the meta-learner. Comparison of sensitivities and specificities for different ensemble methods can be found in Supplementary material Figures S3 and S5.
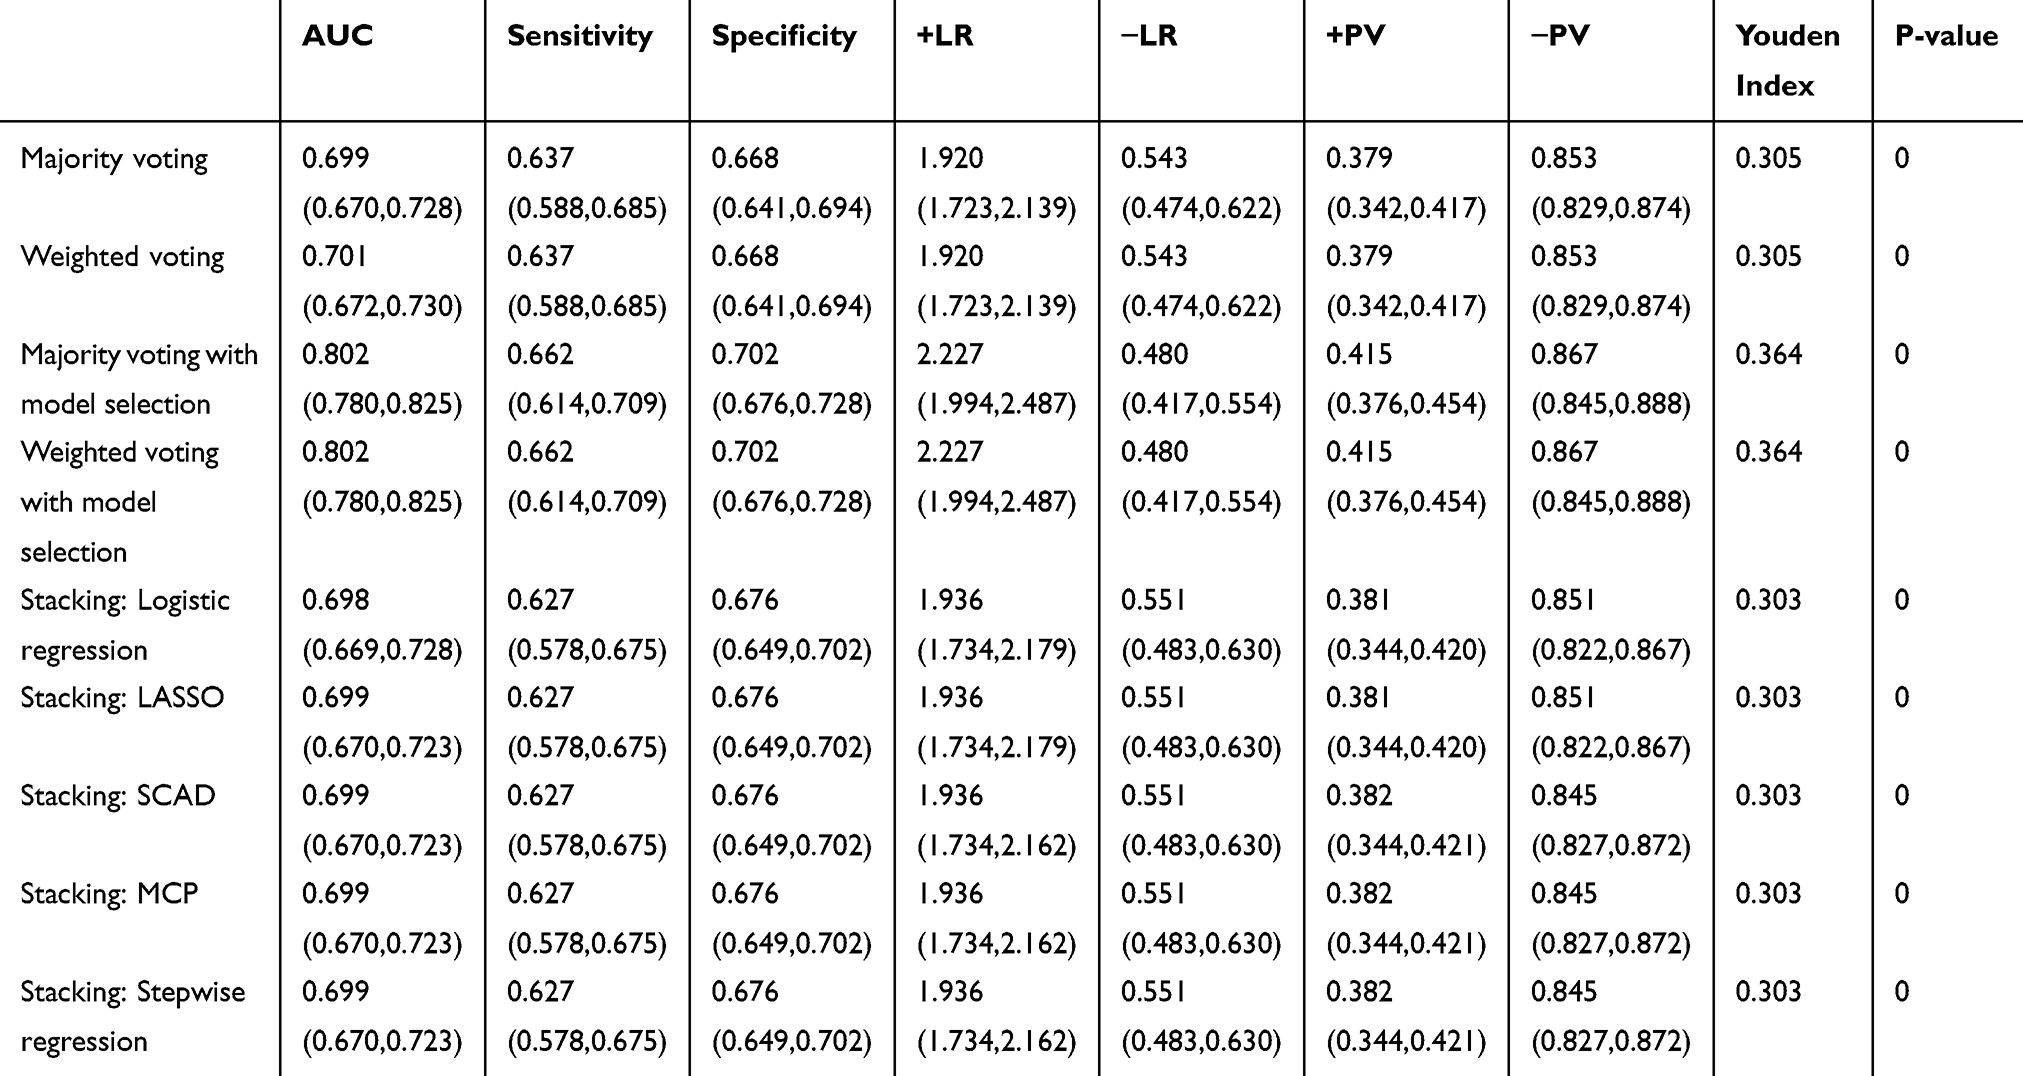 |
Table 3 Performance Of Different Combination Methods Using The 11 Non-Invasive Score Systems In The Testing Population (n = 1,644) |
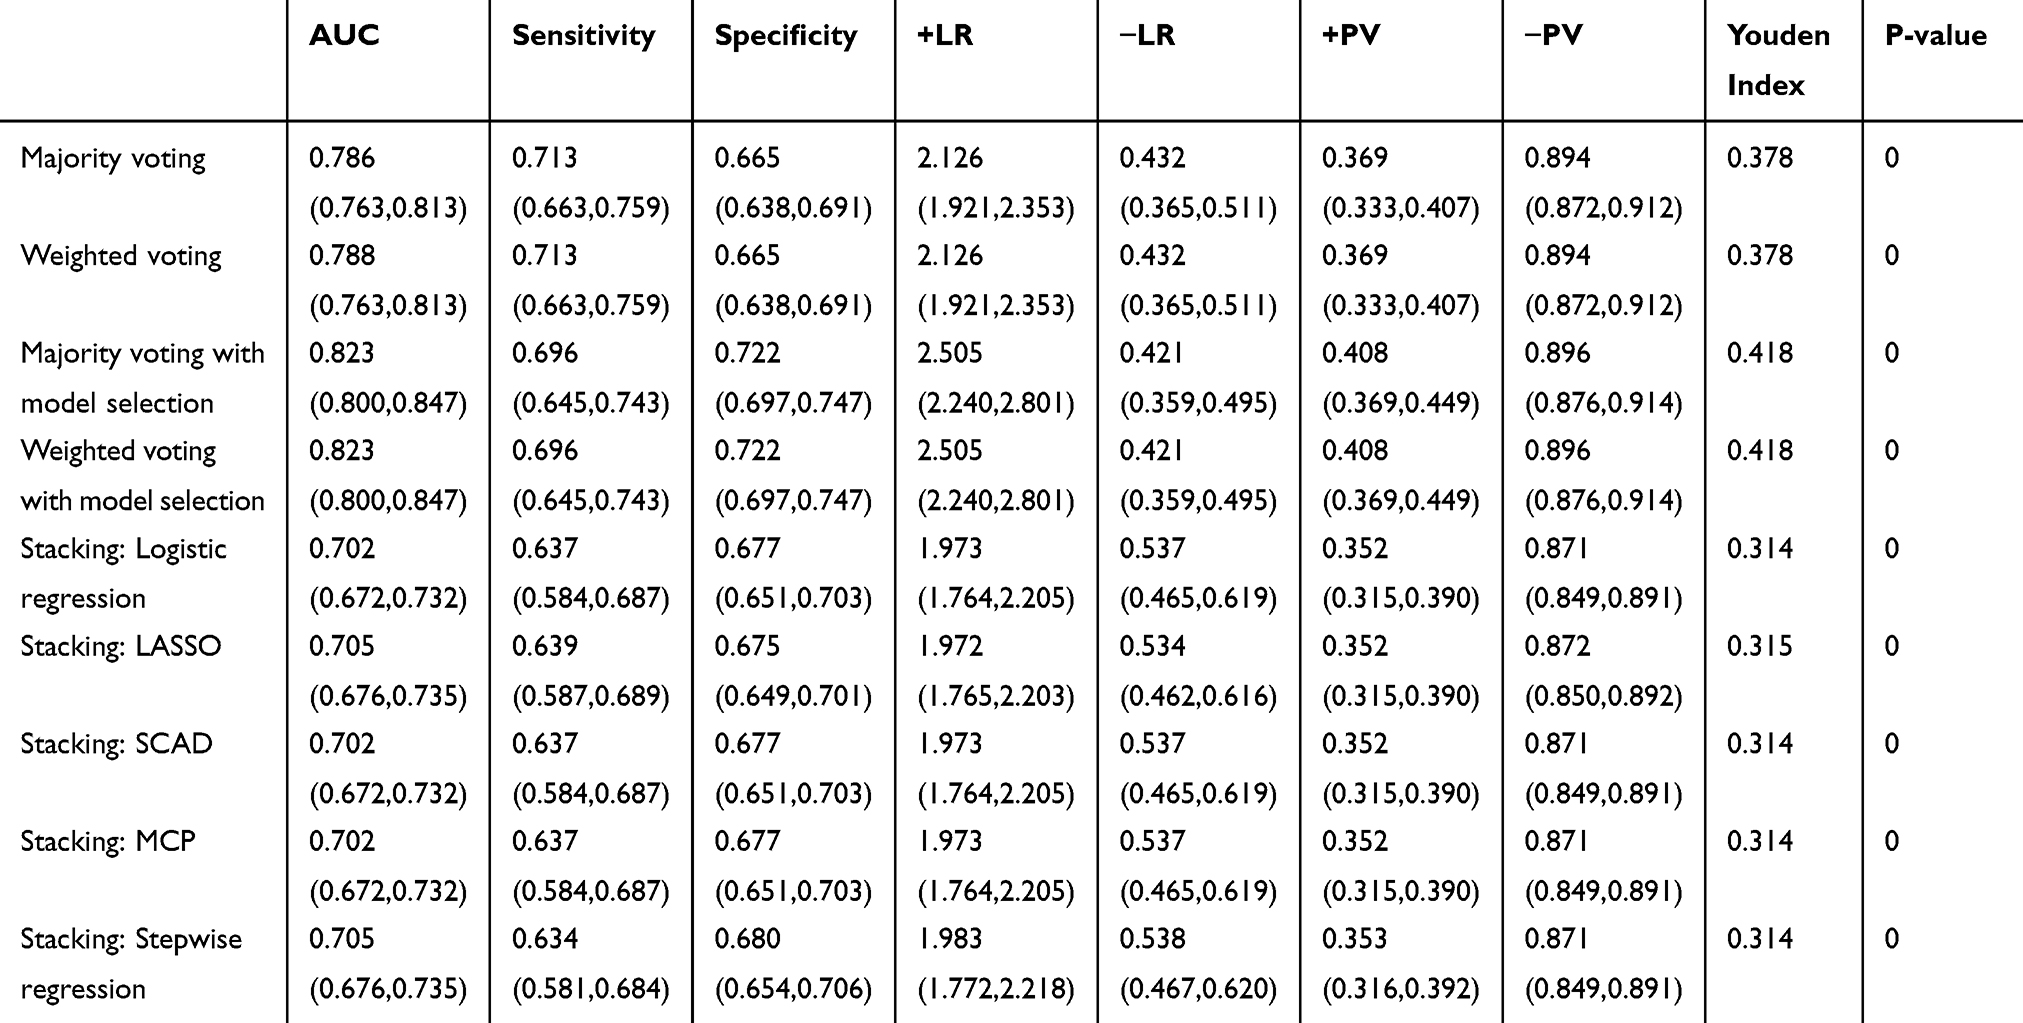 |
Table 4 Performance Of Different Combination Methods Using 9 Non-Invasive Score Systems Developed By Other Studies In The Testing Population (n = 1,644) |
The receiver operating characteristic (ROC) curves for the score systems are summarized in Figures 1–3, and the comparison of areas under ROC (AUC) were shown in Supplementary material Figures S2, S4, and S6. For the combination methods, we only included the majority voting algorithms with model selection since it produced the best performance in all cases, and the results of other combination methods were similar. Figures 1 and 3 compare the majority voting algorithms with the two proposed scores and the score systems derived from Western countries. Figure 3 compares the majority voting and stacking algorithms with the two proposed scores and the Chinese score system, which produced the best prediction result among individual score systems. The ROC curves produced by the voting algorithms are above the others in the three figures. Figure 1 illustrates that the two new score systems performed similarly to each other and better than other Western country scores at all points; Figures 2 and 3 reveal that the two new scores performed similarly to the Chinese score system and stacking methods but better than all other Asian population scores. The areas under the curves (AUC) were tested by bootstrap testing as stated above, and the results showed that the voting algorithms with model selection were significantly better than all individual score systems at the 0.05 level. Furthermore, of 11 score systems, the two new score systems were significantly better than 6 of them (Cambridge, Japanese, FINDRISC, French, Thai, and Qingdao) at the 0.05 level (p-values ranging from 0 to 0.0361) and were comparable to other existing score systems (p-values ranging from 0.1045 to 0.4742).
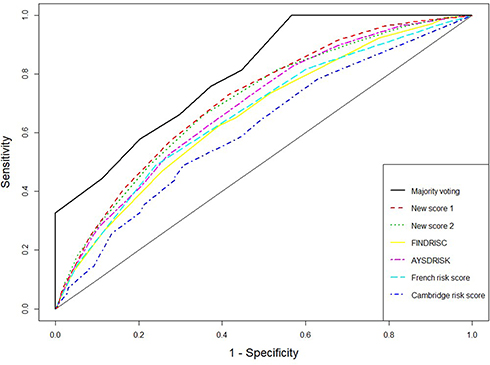 |
Figure 1 Receiver operating characteristic curves for weighted voting, new score systems, and Western countries’ score systems. |
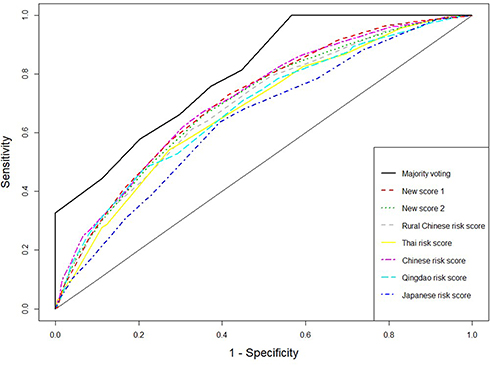 |
Figure 2 Receiver operating characteristic curves for weighted voting, new score systems, and Eastern Asian score systems. |
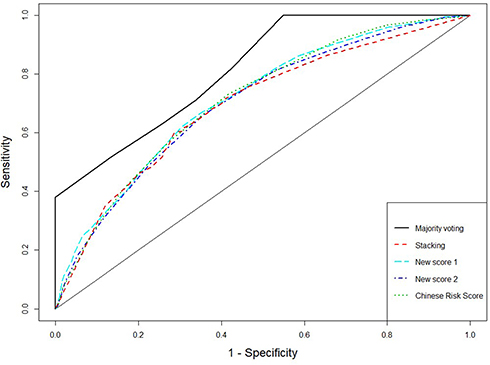 |
Figure 3 Receiver operating characteristic curves for majority voting and stacking using 9 existing score systems, new score systems, and Chinese score system. |
Discussion
Non-invasive risk score systems have proved to be an effective tool to assess the risk of T2D. Most existing score systems were developed in Western populations, and Kengne et al40 showed that both the overall and cross-country performances of these models are acceptable for use in Western populations. However, several studies showed that non-invasive risk score systems built from Western populations perform poorly when applied to Asian populations.6,10
Because the existing non-invasive risk score systems were built using particular populations, their performance is likely unsatisfactory when applied to other populations. Although the sensitivity and specificity of two new risk scores systems were not largely better than others (Table S3), data-adaptive new risk scores, if combined with other existing ones, may improve the performance of the ensemble methods.
To overcome these issues, we proposed the ensemble methods, voting and stacking, that can automatically build a combined reliable T2D risk assessment system. In this study, we applied different ensemble algorithms to our dataset that automatically combined different existing non-invasive score systems to predict the risk of T2D. Our empirical study showed that all combination algorithms could produce prediction results that are significantly better than those of most existing simple score systems, and the voting method with model selection could significantly increase the predictability relative to any simple individual score system. Also, a comparison of the results between Tables 3 and 4 reveals that including new score systems in the combination algorithms did not improve the performance of the algorithms.
Thus, based on our empirical results, which are shown in the previous section, we can conclude that ensemble methods are useful tools for predicting type 2 diabetes. Our proposed methods can be summarized by the following steps: 1. Dividing the dataset into a training dataset and validation dataset on the basis of stratified sampling (all of the models in the following steps are built on the training dataset); 2. Selecting optimal cutoff points by maximizing the sum of sensitivity and specificity on the training dataset for the existing score systems; 3. Combining all the score systems by either voting or stacking methods with model selection. Model selections are also performed by either LASSO, SCAD, or MCP. The selection models use the predicted outcomes from each score system as the independent variables and the true diabetes status as the response variable. Voting methods are the recommended approach to combining T2D risk scores.
One limitation of our research is the use of a cross-sectional data from the REACTION study. Both the non-invasive conventional risk scores and our proposed ensemble risk score algorithms should be taken as a useful tool for identifying those patients with a high risk to develop T2D in the future, and then lifestyle or medication interventions can be implemented to these patients to prevent and delay the future onset of T2B.
Conclusion
In this study, we developed two non-invasive risk score systems for predicting T2D using data from the REACTION study. We also evaluated the performance of different combination algorithms according to their ability to predict T2D. We hope that our new algorithm can be used to improve the accuracy of early detection and prevention of T2D.
Disclosure
The authors declare that they have no conflicts of interest in this work.
References
1. Pan XR, Li GW, Hu YH, et al. Effects of diet and exercise in preventing NIDDM in people with impaired glucose tolerance: the Da Qing IGT and diabetes study. Diabetes Care. 1997. doi:10.2337/diacare.20.4.537
2. Knowler WC, Barrett-Connor E, Fowler SE, et al. Reduction in the incidence of type 2 diabetes with lifestyle intervention or metformin. N Engl J Med. 2002. doi:10.1056/NEJMoa012512
3. Gillies CL, Abrams KR, Lambert PC, et al. Pharmacological and lifestyle interventions to prevent or delay type 2 diabetes in people with impaired glucose tolerance: systematic review and meta-analysis. BMJ Br Med J. 2007;334:299. doi:10.1136/bmj.39063.689375.55
4. Gillies CL, Lambert PC, Abrams KR, et al. Different strategies for screening and prevention of type 2 diabetes in adults: cost effectiveness analysis. BMJ. 2008;336:1180–1185. doi:10.1136/bmj.39545.585289.25
5. Li G, Zhang P, Wang J, et al. The long-term effect of lifestyle interventions to prevent diabetes in the China Da Qing diabetes prevention study: a 20-year follow-up study. Lancet. 2008;371:1783–1789. doi:10.1016/S0140-6736(08)60766-7
6. Glümer C, Vistisen D, Borch-Johnsen K, Colagiuri S. Risk scores for type 2 diabetes can be applied in some populations but not all. Diabetes Care. 2006;29:410–414. doi:10.2337/diacare.29.02.06.dc05-0945
7. Noble D, Mathur R, Dent T, Meads C, Greenhalgh T. Risk models and scores for type 2 diabetes: systematic review. BMJ. 2011;343:d7163–d7163. doi:10.1136/bmj.d7163
8. Aekplakorn W, Bunnag P, Woodward M, et al. A risk score for predicting incident diabetes in the Thai population. Diabetes Care. 2006;29:1872–1877. doi:10.2337/dc05-2141
9. Balkau B, Lange C, Fezeu L, et al. Predicting diabetes: clinical, biological, and genetic approaches: Data from the Epidemiological Study on the Insulin Resistance Syndrome (DESIR). Diabetes Care. 2008;31:2056–2061. doi:10.2337/dc08-0368
10. Zhou X, Qiao Q, Ji L, et al. Nonlaboratory-based risk assessment algorithm for undiagnosed type 2 diabetes developed on a nation-wide diabetes survey. Diabetes Care. 2013. doi:10.2337/dc13-0593
11. Ye X, Zong G, Liu X, et al. Development of a new risk score for incident type 2 diabetes using updated diagnostic criteria in middle-aged and older Chinese. PLoS One. 2014. doi:10.1371/journal.pone.0097042
12. Gao WG, Dong YH, Pang ZC, et al. A simple Chinese risk score for undiagnosed diabetes. Diabet Med. 2010. doi:10.1111/j.1464-5491.2010.02943.x
13. Wen J, Hao J, Liang Y, et al. A non-invasive risk score for predicting incident diabetes among rural Chinese people: a village-based cohort study. PLoS One. 2017. doi:10.1371/journal.pone.0186172
14. Lindstrom J, Tuomilehto J. The diabetes risk score: a practical tool to predict type 2 diabetes risk. Diabetes Care. 2003. doi:10.2337/diacare.26.3.725
15. Chen L, Magliano DJ, Balkau B, et al. AUSDRISK: an Australian type 2 diabetes risk assessment tool based on demographic, lifestyle and simple anthropometric measures. Med J Aust. 2010. doi:10.5694/j.1326-5377.2010.tb03478.x
16. Kavakiotis I, Tsave O, Salifoglou A, Maglaveras N, Vlahavas I, Chouvarda I. Machine learning and data mining methods in diabetes research. Comput Struct Biotechnol J. 2017. doi:10.1016/j.csbj.2016.12.005
17. Yu W, Liu T, Valdez R, Gwinn M, Khoury MJ. Application of support vector machine modeling for prediction of common diseases: the case of diabetes and pre-diabetes. BMC Med Inform Decis Mak. 2010. doi:10.1186/1472-6947-10-16
18. Zou Q, Qu K, Luo Y, Yin D, Ju Y, Tang H. Predicting diabetes mellitus with machine learning techniques. Front Genet. 2018. doi:10.3389/fgene.2018.00515
19. Pappada SM, Cameron BD, Rosman PM. Development of a neural network for prediction of glucose concentration in type 1 diabetes patients. J Diabetes Sci Technol. 2008. doi:10.1177/193229680800200507
20. Zhou Z-H. Ensemble Methods: Foundations and Algorithms. Chapman and Hall/CRC; 2012.
21. Ruta D, Gabrys B. Classifier selection for majority voting. Inf Fusion. 2005. doi:10.1016/j.inffus.2004.04.008
22. Bi Y, Lu J, Wang W, et al. Cohort profile: risk evaluation of cancers in Chinese diabetic individuals: a longitudinal (REACTION) study. J Diabetes. 2014. doi:10.1111/1753-0407.12108
23. Tibshirani R. Regression selection and shrinkage via the Lasso. J R Stat Soc B. 1996. doi:10.2307/2346178
24. Fan J, Li R. Variable selection via nonconcave penalized likelihood and its oracle properties. J Am Stat Assoc. 2001. doi:10.1198/016214501753382273
25. Zhang CH. Nearly unbiased variable selection under minimax concave penalty. Ann Stat. 2010. doi:10.1214/09-AOS729
26. Fan J, Lv J. A selective overview of variable selection in high dimensional feature space. Stat Sin. 2010. doi:10.1063/1.3520482
27. Fan J, Lv J. Sure independence screening for ultrahigh dimensional feature space. J R Stat Soc Ser B Stat Methodol. 2008;70:849–911. doi:10.1111/j.1467-9868.2008.00674.x
28. Sullivan LM, Massaro JM, D’Agostino RB. Presentation of multivariate data for clinical use: the Framingham study risk score functions. Stat Med. 2004;23:1631–1660. doi:10.1002/sim.1742
29. Opitz DW, Shavlik JW. Generating accurate and diverse members of a neural-network ensemble. Adv Neural Inf Process Syst. 1996.
30. Ruta D, Gabrys B Analysis of the correlation between majority voting error and the diversity measures in multiple classifier systems.
31. Windeatt T. Diversity measures for multiple classifier system analysis and design. Inf Fusion. 2005;6:21–36. doi:10.1016/j.inffus.2004.04.002
32. Rokach L. Ensemble-based classifiers. Artif Intell Rev. 2010;33:1–39. doi:10.1007/s10462-009-9124-7
33. Wolpert DH. Stacked generalization. Neural Networks. 1992;5:241–259. doi:10.1016/S0893-6080(05)80023-1
34. Breiman L. Stacked regressions. Mach Learn. 1996;24:49–64. doi:10.1007/BF00117832
35. van der Laan MJ, Polley EC, Hubbard AE. Super Learner. Stat Appl Genet Mol Biol. 2007;6. doi:10.2202/1544-6115.1309
36. Debray TPA, Koffijberg H, Nieboer D, Vergouwe Y, Steyerberg EW, Moons KGM. Meta-analysis and aggregation of multiple published prediction models. Stat Med. 2014;33:2341–2362. doi:10.1002/sim.6080
37. Heianza Y, Arase Y, Hsieh SD, et al. Development of a new scoring system for predicting the 5 year incidence of type 2 diabetes in Japan: the Toranomon Hospital Health Management Center Study 6 (TOPICS 6). Diabetologia. 2012;55:3213–3223. doi:10.1007/s00125-012-2712-0
38. Griffin SJ, Little PS, Hales CN, Kinmonth AL, Wareham NJ. Diabetes risk score: towards earlier detection of type 2 diabetes in general practice. Diabetes Metab Res Rev. 2000;16:164–171. doi:10.1002/1520-7560(200005/06)16:3<164::aid-dmrr103>3.0.co;2-r
39. Chen F, Xue Y, Tan MT, Chen P. Efficient statistical tests to compare Youden index: accounting for contingency correlation. Stat Med. 2015;34:1560–1576. doi:10.1002/sim.6432
40. Kengne AP, Beulens JWJ, Peelen LM, et al. Non-invasive risk scores for prediction of type 2 diabetes (EPIC-InterAct): a validation of existing models. Lancet Diabetes Endocrinol. 2014;2:19–29. doi:10.1016/S2213-8587(13)70103-7
 © 2019 The Author(s). This work is published and licensed by Dove Medical Press Limited. The full terms of this license are available at https://www.dovepress.com/terms.php and incorporate the Creative Commons Attribution - Non Commercial (unported, v3.0) License.
By accessing the work you hereby accept the Terms. Non-commercial uses of the work are permitted without any further permission from Dove Medical Press Limited, provided the work is properly attributed. For permission for commercial use of this work, please see paragraphs 4.2 and 5 of our Terms.
© 2019 The Author(s). This work is published and licensed by Dove Medical Press Limited. The full terms of this license are available at https://www.dovepress.com/terms.php and incorporate the Creative Commons Attribution - Non Commercial (unported, v3.0) License.
By accessing the work you hereby accept the Terms. Non-commercial uses of the work are permitted without any further permission from Dove Medical Press Limited, provided the work is properly attributed. For permission for commercial use of this work, please see paragraphs 4.2 and 5 of our Terms.