")
Back to Journals » Cancer Management and Research » Volume 14
Machine Learning-Based Prognostic Prediction Models of Non-Metastatic Colon Cancer: Analyses Based on Surveillance, Epidemiology and End Results Database and a Chinese Cohort
Authors Tang M, Gao L, He B, Yang Y
Received 23 September 2021
Accepted for publication 1 December 2021
Published 4 January 2022 Volume 2022:14 Pages 25—35
DOI https://doi.org/10.2147/CMAR.S340739
Checked for plagiarism Yes
Review by Single anonymous peer review
Peer reviewer comments 2
Editor who approved publication: Dr Chien-Feng Li
Mo Tang,1 Lihao Gao,2 Bin He,1 Yufei Yang1
1Oncology Department, Xiyuan Hospital of China Academy of Chinese Medical Sciences, Beijing, People’s Republic of China; 2Smart City Business Unit, Baidu Inc., Beijing, People’s Republic of China
Correspondence: Yufei Yang
Xiyuan Hospital of China Academy of Chinese Medical Sciences, No. 1 Xiyuan Caochang Road, Haidian District, Beijing, 100091, People’s Republic of China
Email [email protected]
Lihao Gao
Smart City Business Unit, Baidu Inc., No. 51 Dezhen Road, Haidian District, Beijing, 100091, People’s Republic of China
Email [email protected]
Purpose: The present study aimed to develop prognostic prediction models based on machine learning (ML) for non-metastatic colon cancer (CRC), which can provide a precise quantitative risk assessment and serve as an assistive method for treatment strategy development. The possibility of improving prediction accuracy using nonlinear methods compared to linear methods was investigated.
Patients and Methods: A cancer-specific survival (CSS) model constructed using logistic regression, extreme gradient boosting (XGBoost), and random forest algorithms was trained on the Surveillance, Epidemiology, and End Results datasets for 15,254 patients with non-metastatic CRC (split into training [70%] and internal validation [30%] datasets) and externally validated with an outpatient cohort of 311 cases from Xiyuan Hospital in China. A Chinese cohort was also used to develop recurrence and metastasis (R&M) models for CRC patients. The experiments for each model were performed 100 times to obtain average scores and 95% confidence intervals. The model performance was evaluated using the area under the receiver operating characteristic curve (AUC) values.
Results: The XGBoost approach showed the highest AUC values of 0.86 (0.84– 0.88), 0.82 (0.81– 0.83), and 0.81 (0.79– 0.82) for one-, three-, and five-year CSS cohorts, respectively, along with a relatively high generalization ability. The XGBoost approach also performed best for the R&M model, with the AUC values of 0.71 (0.64– 0.79), 0.79 (0.74– 0.86), and 0.89 (0.82– 0.95) for one-, three-, and five-year R&M cohorts, respectively. The rankings of predictor importance for the CSS and R&M models were different, and the higher model accuracy was associated with more prognostic predictors.
Conclusion: Three different ML algorithms for developing prognostic prediction models for non-metastatic CRC were compared. The predictive performance results showed that the nonlinear XGBoost approach performed best, suggesting that it can be used for quantifying the prognostic risk. It was also demonstrated that the model performance can be improved when more prognostic predictors are considered.
Keywords: colon cancer, machine learning, extreme gradient boosting, prognostic prediction models
Introduction
Colon cancer (CRC) is a common gastrointestinal tumor, ranking fifth in both morbidity and mortality worldwide in 2020.1 Although CRC incidence and mortality can be mitigated through appropriate screening and surveillance,2 the societal burden associated with CRC remains heavy3 because these advanced methods are typically reserved for younger patients who are unencumbered by comorbidities compared to their counterparts of advanced age.4 Non-metastatic CRC patients are recommended standard radical surgery with or without adjuvant chemotherapy.5 However, up to 30%–50% of CRC patients under optimal treatment still experienced recurrence or metastasis (R&M), and the five-year survival rate for advanced CRC remains disappointing at approximately 10%.6 Prognostic prediction in terms of overall survival and R&M can help clinicians to develop personalized treatment strategies and prolong survival.
A widely used prognostic tool in clinical practice is tumor, lymph node, and presence of metastasis staging system, which includes only three factors. However, it is not effective enough to reflect the actual patient prognosis,7 since it neglects other proven prognostic factors, such as molecular markers8 and immunological indicators.9 Thus, several prediction models based on the Cox proportional hazards regression10 and logistic regression (LR)11 have been developed in order to address the multivariable issues. However, the clinical outcomes and multiple predictors may have a nonlinear correlation. These linear approaches may cause a phenomenon known as the “survival paradox”: T4N0 CRC had a significantly worse outcome than T1-2N1 cancer regardless of adjuvant chemotherapy,12 which may mislead clinicians into over- or underestimating the disease prognosis.13
To deal with these challenges, methods based on machine learning (ML), a subfield of artificial intelligence with the goal of developing algorithms capable of learning from data automatically,14 were used in the present study. ML is able to use complex algorithms for large datasets with multidimensional variables to capture high-dimensional, nonlinear relationships among clinical features to make data-driven outcome predictions.15 ML is devoted to the study of how to improve the performance of the system itself through computational means by using “experience”, which is usually in the form of data.16 ML methods have already supplemented clinical decision making with the goal of reducing the workload of health workers.17 This offers great promise in the clinic and has influenced the area of clinical research by underscoring the value of large datasets.18 Many studies have provided evidence that ML-based models have a higher predictive accuracy in prognosis probability of rectal cancer,19 lung cancer,20 and acute coronary syndrome.21 However, to the best of our knowledge, studies on prognosis prediction of non-metastatic CRC have been confined to linear methods, such as Cox proportional hazards regression,10 whereas LR11 has been used for cancer-specific survival (CSS) prediction, and a clinical calculator with only six predictors22 has been used for R&M prediction. Whether a nonlinear method can provide a higher accuracy remains unknown and needs to be investigated.
A linear-based approach and two nonlinear-based approaches were used for comparison and optimal model exploration. Prognostic factors were incorporated into the ML models as much as possible in order to precisely quantify the prognosis risk. The importance of these prognostic factors for CSS and R&M models were analyzed and compared. Reported prognosis predictors from prior studies were selected to identify candidates.23 Because some variables confirmed as prognostic factors of CRC were not present in the Surveillance, Epidemiology, and End Results (SEER) database, which was widely used in the model studies, a Chinese cohort including additional prognostic factors was utilized. The influence of these factors on the R&M model performance was analyzed.
Materials and Methods
Data Collection
Data used for constructing the CSS model were obtained from the SEER database (www.seer.cancer.gov) of the National Cancer Institute (approval number: 11801-Nov2020). SEER*Stat software (version 8.3.9) was used to extract information from the database. The 8th edition of the American Joint Committee (AJCC) was released in 2018, but the latest SEER data were also from 2018 and the preview showed no change in classification of non-metastatic patients. Thus, the 8th edition of the AJCC staging system was used, which was available for patients with CRC diagnosed between 2010 and 2013 via histopathological examination. Ultimately, a total of 94,035 patients from the SEER database were identified, of which 15,254 met the inclusion criteria and were included in the study.
According to the above criteria, CRC patients from the outpatient department of Xiyuan Hospital in Beijing, China between February 2008 and June 2021 were used for external validation of the CSS model. The data were collected based on previous outpatient records, and the corresponding clinical characteristics were obtained via telephone or outpatient follow-up. This dataset was also used to construct and internally validate the R&M model. Figure 1 shows the flow chart of the study design.
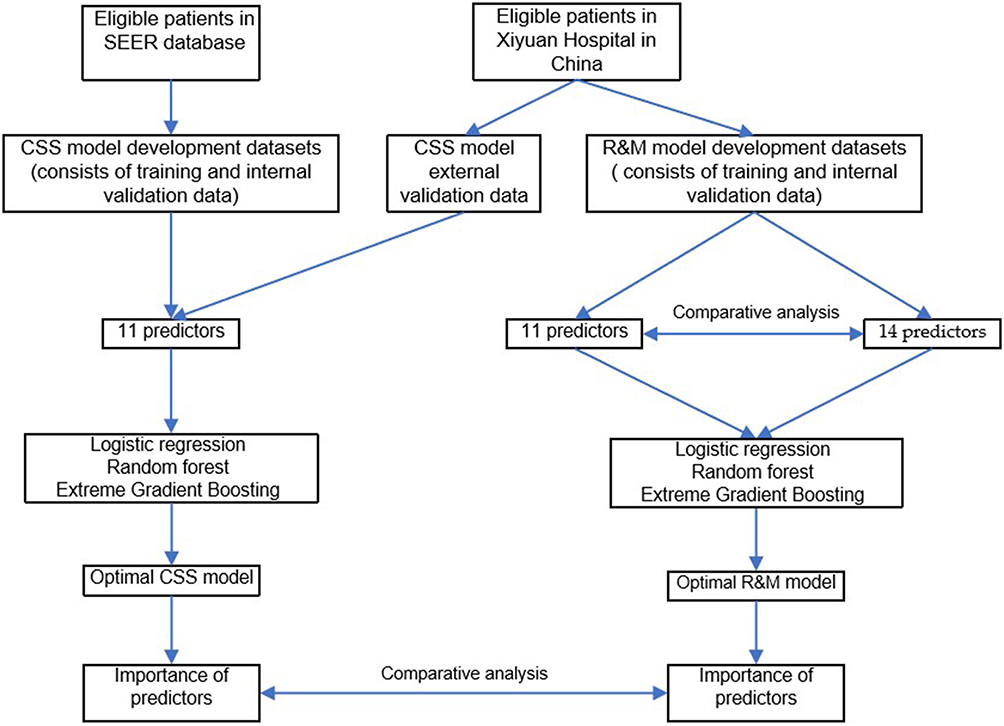 |
Figure 1 Flow chart of study design. |
Variables and Data Characteristics
CSS Model
The following 11 clinicopathologic variables were used in the analysis. Categorical variables included gender, tumor site, grade, primary site, invasive tumor depth (T), regional nodes examined (>12 or ≤12), perineural invasion, carcinoembryonic antigen (CEA) level, and adjuvant chemotherapy. Continuous variables included age at diagnosis and regional positive nodes. Many model studies convert age into a categorization variable by age 65 or by using X-tile software as a cut-off value.24 However, keeping variables continuous is preferable since much more predictive information is retained in this manner.25 Tumor sites were categorized as right-sided CRC (RCC) or left-sided CRC (LCC). RCC included cancers of the cecum, ascending colon, hepatic colon, and transverse colon, while LCC included cancers of the splenic colon flexure, descending colon, and sigmoid colon. The present study focused on one-, three- and five-year CSS, defined as the interval between diagnosis and death due to cancer or last follow-up. “Survival months” and “death status” outcome variables were also extracted.
R&M Model
Individuals with pathogenic mutation susceptibility genes have a higher risk of CRC.26 Vascular cancer embolus and microsatellite instability (MSI) also show definite predictive and prognostic values.27 Thus, MSI status, vascular cancer embolus, and family tumor history were added to the above 11 predictors. Similar to the CSS model, one-, three-, and five-year risk of R&M, defined as the interval between diagnosis and R&M or time to final follow-up, was the focus of the study. Disease-free survival (DFS) was the extracted outcome variable.
Model Development and Feature Importance
The datasets were randomly split into training (70%) and internal validation (30%) cohorts. An additional external validation was further performed using Chinese datasets for the CSS model. Average scores and 95% confidence intervals (CIs) were calculated by performing experiments 100 times. Python was used for implementation because it is an open-source library with access to ML algorithms.28 LR,29 extreme gradient boosting (XGBoost),30 and random forest (RF) regression31 were employed to develop prediction models. The LR algorithm is the most commonly used supervised algorithm in medical classification.32 LR has been widely applied for predicting survival of new cases.33 A layer of function mapping was added to the LR for target mapping, such that the model performed a linear summation first and was then used as the hypothesis function to predict the target. RF regression is a widely used ML method, which is an ensemble learning method that can handle nonlinear problems. The bagging integration strategy uses the decision tree as a basic unit (submodel). The RF model output is the integration of multiple decision tree model outputs. XGBoost is an optimized distributed gradient-boosting library designed to be efficient, flexible, and portable. It implements ML algorithms under the framework of gradient boosting that solve many data science problems in a fast and accurate way.34 Model performance was evaluated using the area under the receiver operating characteristic curve (AUC),35 and the 95% CIs were obtained using 5% and 95% AUCs for 100 experiments. The built-in importance property feature was used to investigate the importance of predictors in the RF and XGboost models. It was computed as the normalized total reduction of the criterion suggested by that feature.
Results
Clinical Outcomes and Patient Characteristics
A total of 15,254 patients met the inclusion criteria for the CSS model. Different left-censored cases were excluded before analysis. Final analysis included 14,791 patients for the one-year cohort (90 left-censored samples), 13,414 patients for the three-year cohort (287 left-censored samples), and 11,977 patients for the five-year cohort (898 left-censored samples) (Table 1). Categorical variables were reported as counts (%) and continuous variables as means or medians. The means for CSS were 72.2 (standard deviation (SD) = 24.3), 72.8 (SD = 23.8), and 73.6 (SD = 24.0) months for one-, three-, and five-year cohorts, respectively. A total of 311 cases from the Chinese cohort were used for external validation of the CSS model and construction of the R&M model: (1) for external validation of the CSS model: CSS means were 45.7 (SD = 24.3), 55.7 (SD = 24.1), and 59.5 (SD = 27.8) months for one-year (11 left-censored samples), three-year (114 left-censored samples), and five-year (175 left-censored samples) cohorts, respectively (Table 1); (2) for the R&M model: DFS means were 31.8 (SD = 25.2), 33.6 (SD = 28.4), and 31.8 (SD = 29.8) months for one-year (three left-censored samples), three-year (75 left-censored samples), and five-year (104 left-censored samples) cohorts, respectively (Table 2). Patient selection flow chart is shown in Figure 2A and B.
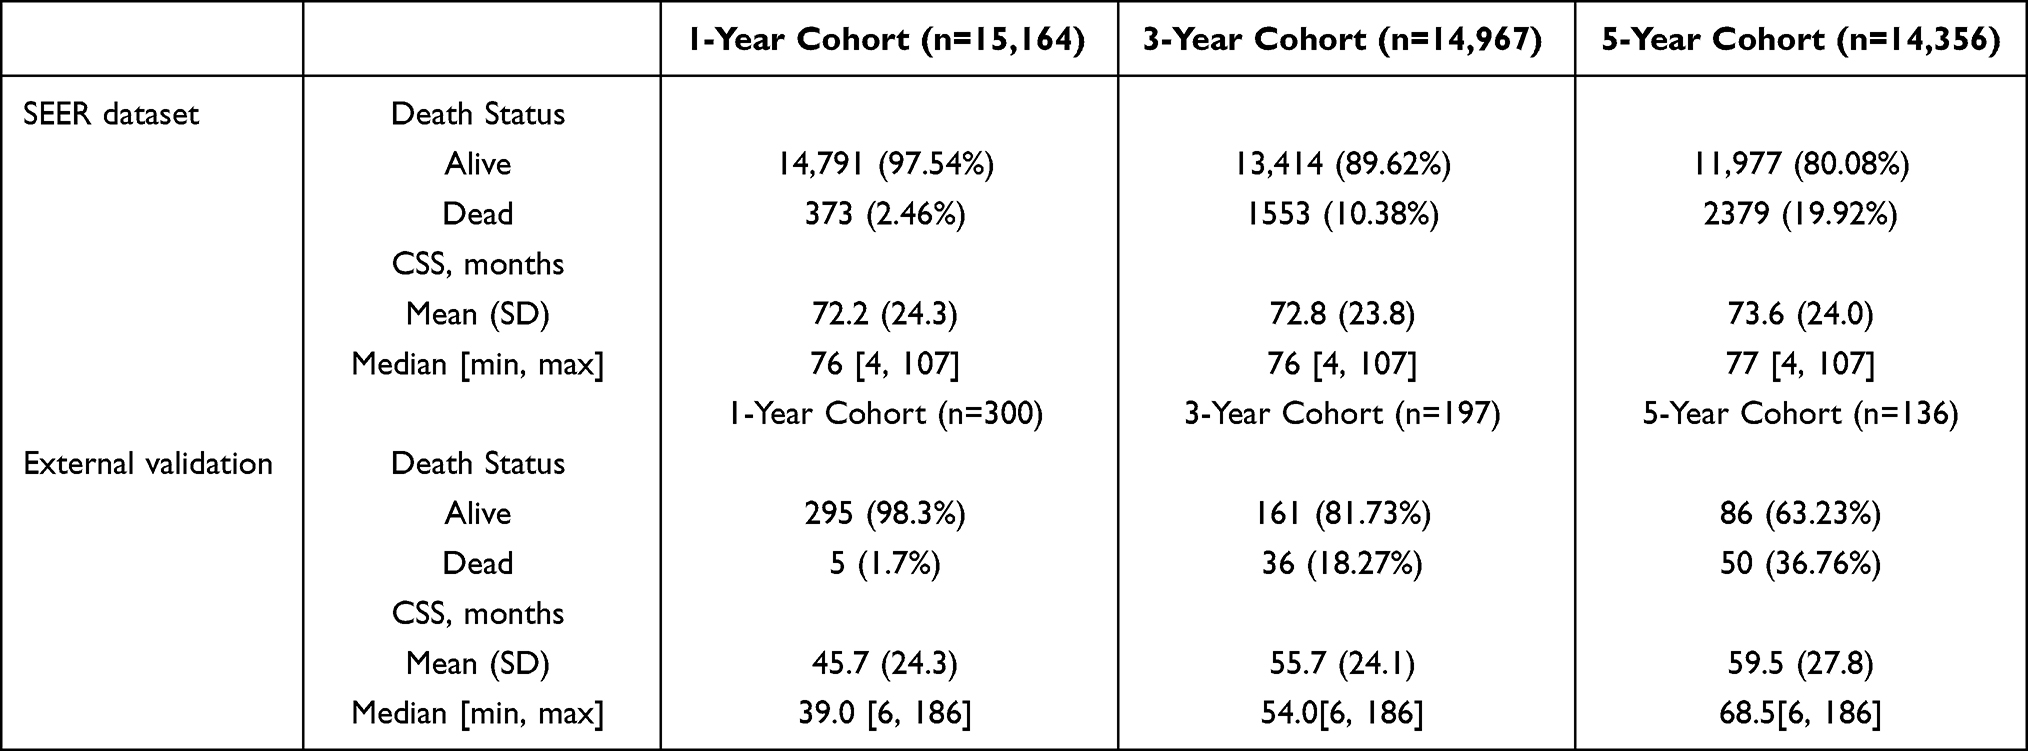 |
Table 1 Study Outcomes of the CSS Model |
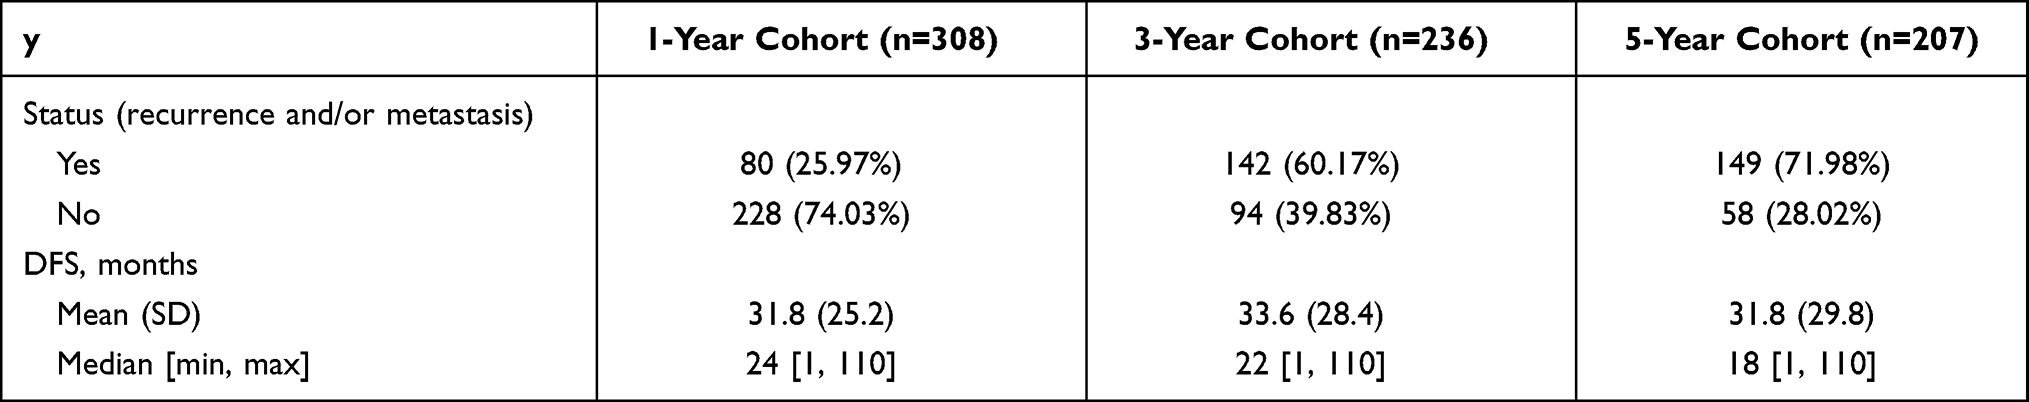 |
Table 2 Study Outcome of the R&M Model |
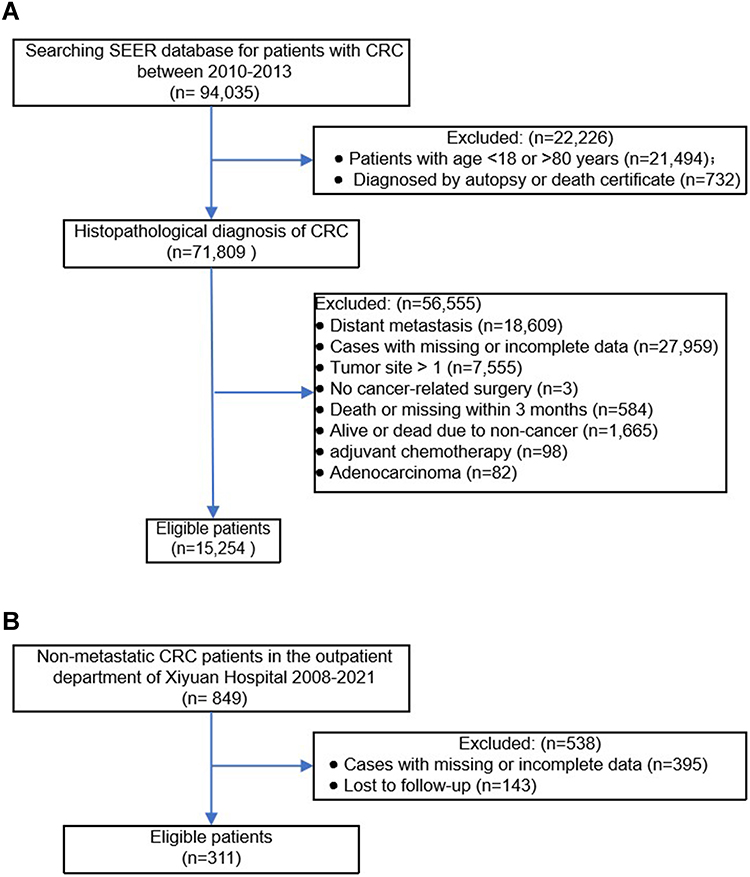 |
Figure 2 (A) Flow chart of included patients (SEER database). (B) Flow chart of included patients (Xiyuan Hospital in Beijing, China). |
CSS Models
A comparison of the three different ML approaches for the CSS model is shown in Figure 3. AUCs for one-year CSS were 0.86 (0.83–0.88), 0.86 (0.84–0.88), and 0.82 (0.80–0.85) for LR, XGBoost, and RF, respectively. The numbers in parentheses indicate 95% CIs. The AUC values for the three-year cohort were: 0.82 (0.81–0.83) for XGBoost, 0.81 (0.80–0.83) for RF, and 0.81 (0.80–0.82) for LR. Similar results were found for the five-year cohort, where XGBoost yielded the highest AUC value of 0.81 (0.79–0.82), followed by 0.80 (0.79–0.81) for RF, and 0.80 (0.79–0.81) for LR. Overall, performance of the XGBoost model was slightly better than that of the other two models.
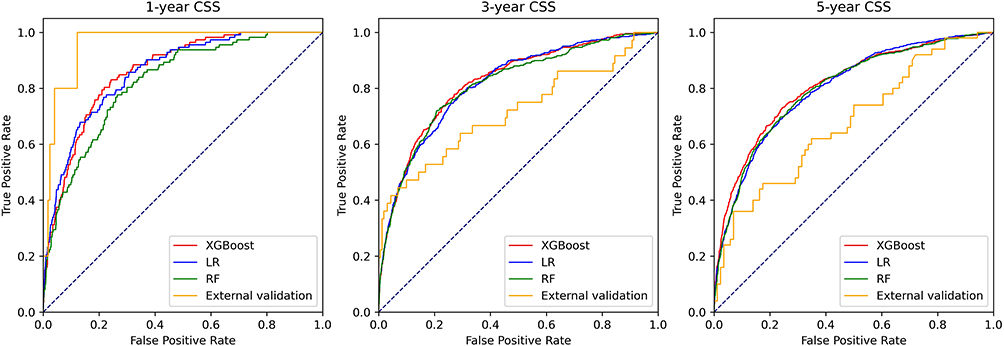 |
Figure 3 Model AUCs for one-, three-, and five-year CSS. The curves for models (logistic regression (LR), extreme gradient boosting (XGBoost), random forest (RF) regression and external validation based on XGBoost)) in cancer-specific survival (CSS) of non-metastatic colon cancer. The 45-degree straight line represents that the model has similar chances of correctly classifying patients with vs patients without events. AUC=area under the receiver operating characteristic curve. |
External Validation
Based on the above results, the prognostic performance of the XGBoost model was assessed using the external validation cohort. The one-, three-, and five-year AUCs were 0.96 (0.93–0.97), 0.71 (0.70–0.73), and 0.68 (0.65–0.70), respectively (yellow line in Figure 3).
R&M Models
AUCs for the one-year cohort in the R&M model with 11 predictors were 0.68 (0.59–0.79), 0.71 (0.64–0.79), and 0.68 (0.61–0.75) for LR, XGBoost, and RF, respectively (Figure 4). For the three-year cohort, XGBoost was still the highest at 0.79 (0.74–0.86), followed by RF at 0.78 (0.72–0.85) and LR at 0.75 (0.66–0.83). For the five-year cohort, XGBoost at 0.89 (0.82–0.95) and RF at 0.88 (0.82–0.95) had the best AUCs, followed by 0.81 (0.72–0.90) for LR. The impact of prognostic factors on model performance was analyzed next. Thus, 11 (the same factors as those in the CSS model) and 14 (adding family history, vascular cancer embolus, and MSI status) predictors were used to construct the R&M model and for comparison. The results showed that the AUC values increased slightly when more variables were included, suggesting that using more predictors may improve the accuracy of the prognostic prediction (Table 3).
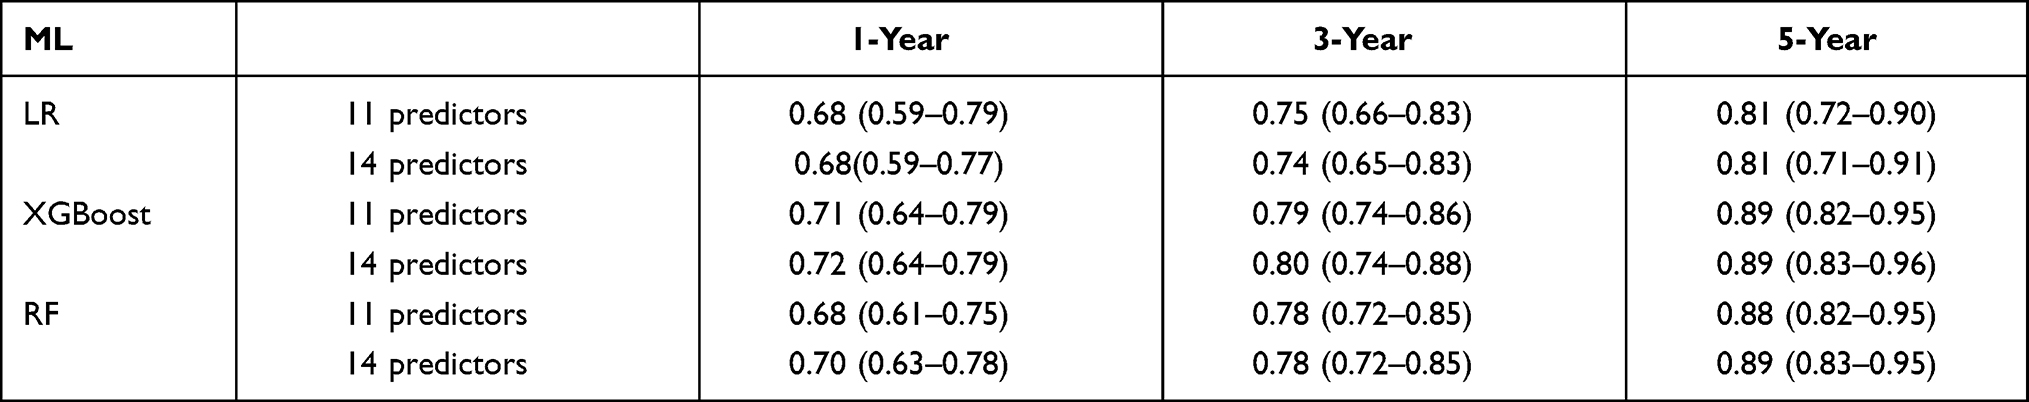 |
Table 3 AUCs of Various Predictors in R&M Model |
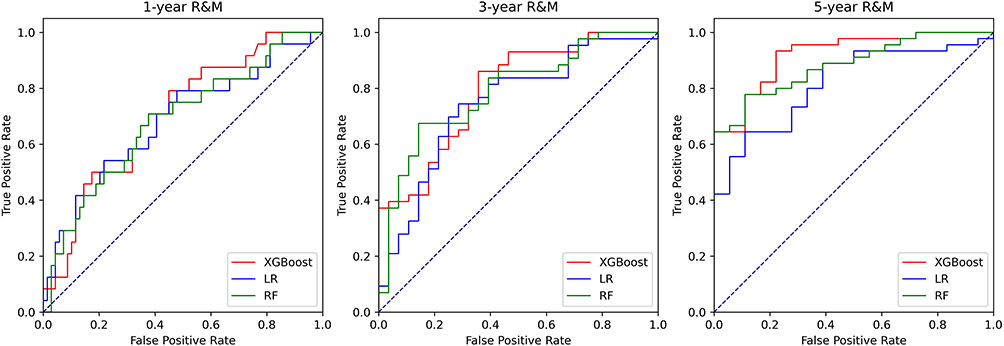 |
Figure 4 Model AUCs for one-, three-, and five-year R&M model with 11 predictors. The curves for models (logistic regression (LR), extreme gradient boosting (XGBoost), random forest (RF) regression) in recurrence and metastasis (R&M) of non-metastatic colon cancer. The 45-degree straight line represents that the model has similar chances of correctly classifying patients with vs patients without events. Abbreviation: AUC, area under the receiver operating characteristic curve. |
Importance of Predictors
The importance of 11 predictors was different between the CSS and R&M models (Figure 5). For the CSS model, T stage, regional positive nodes, and CEA level were the top three predictors of importance for the one-, three-, and five-year cohorts. For the R&M model with 11 predictors, the importance of histological type was the highest, followed by that for the CEA level. The rest of the predictors were only slightly different. For the R&M model with 14 predictors, the most important predictors were histological type, perineural invasion, and CEA level (Figure 6), which showed little difference from the R&M model with 11 predictors.
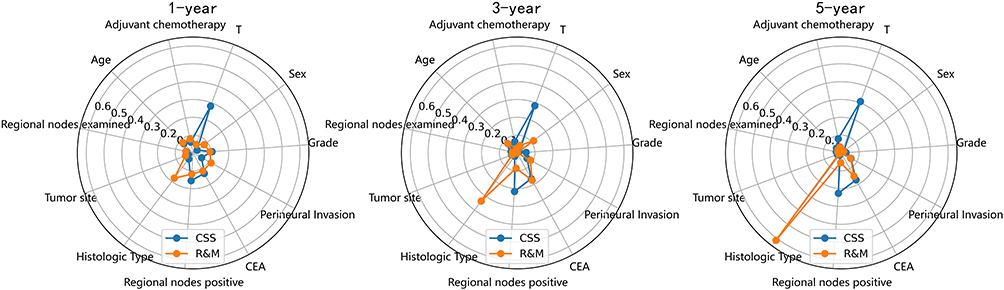 |
Figure 5 Radar plot for importance of predictors in CSS and R&M models with 11 predictors. Abbreviations: T, tumor; CEA, carcinoembryonic antigen; CSS, cancer-specific survival; R&M, recurrence and metastasis. |
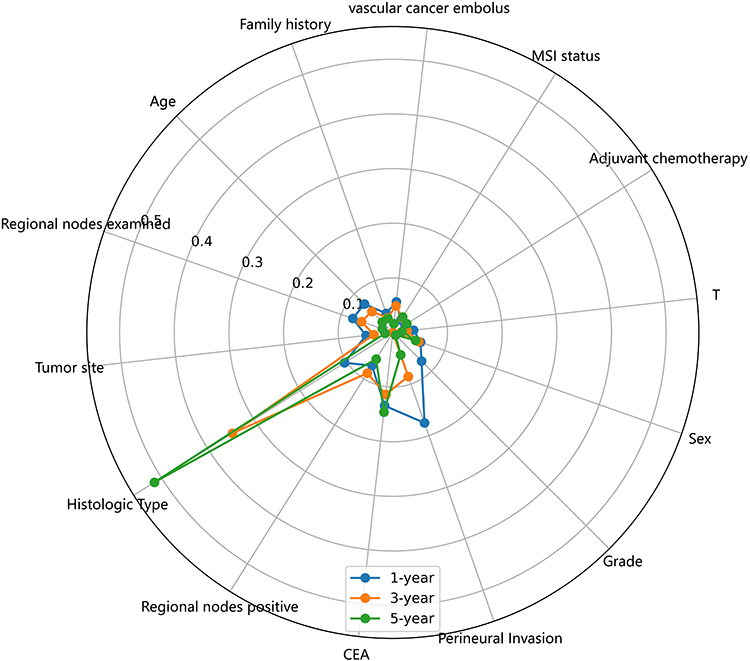 |
Figure 6 Radar plot for importance of predictors in R&M model with 14 predictors. Abbreviations: T, tumor; CEA, carcinoembryonic antigen; CSS, cancer-specific survival; R&M, recurrence and metastasis; MSI, microsatellite instability. |
Discussion
An individualized clinical prognosis model is vitally important for optimal medical treatment decisions and consequently patient outcomes.36 In the present study, CSS and R&M models for non-metastatic CRC were constructed based on ML. They aimed to provide an objective estimate of prognostic risk between 0% and 100% and to serve as an assistive method to improve clinician performance. It has been generally accepted that a model with an AUC of more than 0.7 is reflective of a possibly beneficial discrimination.37 AUCs of the models in the present study were generally greater than 0.7, further confirming the significance of this research. The results showed that the XGBoost approach was superior to LR and RF, suggesting the ability of this nonlinear method to learn complex relationships between outcomes and predictors.
The radar plot clearly showed that the predictor importance varied between the CSS and R&M models. For the CSS model, T stage, regional positive nodes, and CEA level were the three most important predictors. These results are consistent with those of previous studies. It has been shown that T staging has a significant weight in prognosis. Therefore, a T-plus staging system for non-metastatic CRC has been proposed.11 The number of positive nodes is independently associated with improved long-term survival,38 while survival for patients without examined regional nodes was worse.39 Preoperative CEA level is a reliable tumor marker for the management and monitoring of CRC and has been shown to be an independent prognostic indicator of overall survival at all stages of cancer.40 A rise in CEA level is often the first signal of recurrence.
The predictor importance rank was roughly the same for the one-, three-, and five-year cohorts in the CSS model. Histological type accounted for the largest proportion of the predictor importance in the R&M model. Mucinous adenocarcinoma has been shown to have a higher risk of metastasis, and its cure rate and five-year overall survival are significantly lower than those of other pathological types.41 For the R&M model, the importance of histological type rises over time. There are several possible reasons to explain the comparable predictor importance between the CSS and R&M models. First, when the original data for the R&M model were traced, only two types of pathological types were present: non-mucinous adenocarcinoma (78%) and mucinous adenocarcinoma (22%). In addition, the majority of patients in the T stage belong to T3 (66.7%). These samples are extremely non-uniform and may have an impact on the model’s performance. The second reason is that the datasets were relatively small, which may affect the predictors importance.
Transportability is thus a critical model requirement,42 which is vital for evaluating predictive models and their performance in clinical applications.43 In the present study, the CSS model did not only demonstrate a relatively high AUC value, but also showed a generalization ability when using a Chinese cohort for external validation. Due to unbalanced samples in the one-year validation dataset, the results of external validation for the one-year model were much better compared to the three- and five-year models. The characteristics reflected in any model are based on the developed dataset, so the model’s performance may be lower when it is used on a new dataset.44 It was also noted that the higher model accuracy was associated with using more prognostic predictors. How to synthesize these prognostic factors to construct a new generation of CRC prediction systems would be an important problem to investigate in the future. Moreover, no improvement was observed when using the LR model, which implied that it has limitations associated with abstract predictive information in multiple predictors.
The small sample size of the R&M model was the main limitation of the present study. Although no clear consensus exists for the best method for constructing models, it is widely agreed that sufficient and high-quality datasets are critical to avoid overfitting.45 In the future, more outpatients should be included to increase sample size. Bias in collecting clinical information from patients in retrospective studies is another limitation in the present study. A prospective cohort can be included to reduce this bias in further investigations.46
Conclusion
CSS models based on the SEER database were developed in the present study and validated using a cohort from Xiyuan hospital in China. The R&M models were also built based on the ML methods in this cohort. Three ML-based approaches were used to construct CSS and R&M models for non-metastatic CRC. All models demonstrated reliable results with AUC values that were generally greater than 0.7. The XGBoost approach was found to be superior to the LR and RF approaches, indicating that sophisticated nonlinear methods can improve prediction accuracy compared to linear methods. By investigating the predictor importance, T stage, regional positive nodes, and CEA level were found to be the three most important predictors for the CSS model. The histological type and CEA level were more important for the R&M model. It was also revealed that model performance improves when more clinical factors were considered. Overall, the study results suggest that the prognostic prediction models should include more clinical factors and up-to-date analytical methods. Further studies are needed to develop these models for use in daily practice.
Institutional Review Board Statement
The study was conducted according to the guidelines of the Declaration of Helsinki, and approved by the Ethics Committee of Xi-Yuan Hospital, China Academy of Chinese Medical Sciences approved the protocol (approval number 2019XLA044-2).
Informed Consent Statement
Informed consent was waived for the de-identified secondary data analysis.
Acknowledgments
This work has been partially supported by the open-access SEER database. The authors are grateful to every patient and patient’s family who cooperated with the follow-up.
Funding
This research was funded by: (1) National Administration of Traditional Chinese Medicine of China major difficult clinical collaboration pilot of Chinese and Western medicine: Colorectal cancer project; (2) National Key Research and Development Program of Traditional Chinese Medicine Modernization Project: Evidence-based Evaluation of TCM Program for Secondary prevention of Gastrointestinal Malignant Tumor with Coordinated chemotherapy and anti-metastatic Recurrence grant number “No.2017YFC1700600”.
Disclosure
The authors report no conflicts of interest in this work.
References
1. Sung H, Ferlay J, Siegel R, et al. Global cancer statistics 2020: GLOBOCAN estimates of incidence and mortality worldwide for 36 cancers in 185 countries. CA Cancer J Clin. 2021;71(3):209–249. doi:10.3322/caac.21660
2. Dekker E, Tanis P, Vleugels J, et al. Colorectal cancer. Lancet (London, England). 2019;394(10207):1467–1480. doi:10.1016/s0140-6736(19)32319-0
3. Dhillon PK, Mathur P, Nandakumar A, et al. The burden of cancers and their variations across the states of India: the Global Burden of Disease Study 1990-2016. Lancet Oncol. 2018;19(10):1289–1306. doi:10.1016/s1470-2045(18)30447-9
4. Siegel R, Miller K, Goding Sauer A, et al. Colorectal cancer statistics, 2020. CA Cancer J Clin. 2020;70(3):145–164. doi:10.3322/caac.21601
5. Labianca R, Nordlinger B, Beretta G, et al. Early colon cancer: ESMO Clinical Practice Guidelines for diagnosis, treatment and follow-up. Ann Oncol. 2013:vi64–72. doi:10.1093/annonc/mdt354.
6. Mody K, Baldeo C, Bekaii-Saab T. Antiangiogenic therapy in colorectal cancer. Cancer J. 2018;24(4):165–170. doi:10.1097/ppo.0000000000000328
7. Chi S, Tian Y, Li J, et al. Time-dependent and nonlinear effects of prognostic factors in nonmetastatic colorectal cancer. Cancer Med. 2017;6(8):1882–1892. doi:10.1002/cam4.1116
8. Taieb J, Le Malicot K, Shi Q, et al. Prognostic Value of BRAF and KRAS mutations in MSI and MSS Stage III Colon Cancer. J Natl Cancer Inst. 2017;109:5. doi:10.1093/jnci/djw272
9. Galizia G, Orditura M, Romano C, et al. Prognostic significance of circulating IL-10 and IL-6 serum levels in colon cancer patients undergoing surgery. Clin Immunol. 2002;102(2):169–178. doi:10.1006/clim.2001.5163
10. Wang S, Liu Y, Shi Y, et al. Development and external validation of a nomogram predicting overall survival after curative resection of colon cancer. J Int Med Res. 2021;49(5):3000605211015023. doi:10.1177/03000605211015023
11. Kong X, Li J, Cai Y, et al. A modified TNM staging system for non-metastatic colorectal cancer based on nomogram analysis of SEER database. BMC Cancer. 2018;18(1):50. doi:10.1186/s12885-017-3796-1
12. Kim M, Jeong S, Choi S, et al. Survival paradox between stage IIB/C (T4N0) and stage IIIA (T1-2N1) colon cancer. Ann Surg Oncol. 2015;22(2):505–512. doi:10.1245/s10434-014-3982-1
13. Li H, Fu G, Wei W, et al. Re-evaluation of the survival paradox between stage IIB/IIC and Stage IIIA colon cancer. Front Oncol. 2020;10:595107. doi:10.3389/fonc.2020.595107
14. Mehta P, Wang C, Day A, et al. A high-bias, low-variance introduction to machine learning for physicists. Phys Rep. 2019;810:1–124. doi:10.1016/j.physrep.2019.03.001
15. Schwalbe N, Wahl B. Artificial intelligence and the future of global health. Lancet (London, England). 2020;395(10236):1579–1586. doi:10.1016/s0140-6736(20)30226-9
16. Ryo M, Rillig MC. Statistically reinforced machine learning for nonlinear patterns and variable interactions. Ecosphere. 2017;8(11):e01976.
17. Guo J, Li B. The application of medical artificial intelligence technology in rural areas of developing countries. Health Equity. 2018;2(1):174–181. doi:10.1089/heq.2018.0037
18. May M. Eight ways machine learning is assisting medicine. Nat Med. 2021;27(1):2–3. doi:10.1038/s41591-020-01197-2
19. Zhao B, Gabriel R, Vaida F, et al. Predicting overall survival in patients with metastatic rectal cancer: a machine learning approach. J Gastrointestinal Surg. 2020;24(5):1165–1172. doi:10.1007/s11605-019-04373-z
20. Lynch C, Abdollahi B, Fuqua J, et al. Prediction of lung cancer patient survival via supervised machine learning classification techniques. Int J Med Inform. 2017;108:1–8. doi:10.1016/j.ijmedinf.2017.09.013
21. D’Ascenzo F, De Filippo O, Gallone G, et al. Machine learning-based prediction of adverse events following an acute coronary syndrome (PRAISE): a modelling study of pooled datasets. Lancet (London, England). 2021;397(10270):199–207. doi:10.1016/s0140-6736(20)32519-8
22. Weiser M, Hsu M, Bauer P, et al. Clinical calculator based on molecular and clinicopathologic characteristics predicts recurrence following resection of Stage I-III colon cancer. J clin oncol. 2021;39(8):911–919. doi:10.1200/jco.20.02553
23. Royston P, Moons KG, Altman DG, et al. Prognosis and prognostic research: developing a prognostic model. BMJ. 2009:338. doi:10.1136/bmj.b604.
24. Camp R, Dolled-Filhart M, Rimm D. X-tile: a new bio-informatics tool for biomarker assessment and outcome-based cut-point optimization. Clin Cancer Res. 2004;10(21):7252–7259. doi:10.1158/1078-0432.Ccr-04-0713
25. Royston P, Altman DG, Sauerbrei W. Dichotomizing continuous predictors in multiple regression: a bad idea. Stat Med. 2006;25(1):127–141. doi:10.1002/sim.2331
26. Lynch H, de la Chapelle A. Hereditary colorectal cancer. N Engl J Med. 2003;348(10):919–932. doi:10.1056/NEJMra012242
27. Ribic C, Sargent D, Moore M, et al. Tumor microsatellite-instability status as a predictor of benefit from fluorouracil-based adjuvant chemotherapy for colon cancer. N Engl J Med. 2003;349(3):247–257. doi:10.1056/NEJMoa022289
28. Pedregosa F, Varoquaux G, Gramfort A, et al. Scikit-learn: machine learning in python. J Machine Learn Res. 2011;12:2825–2830.
29. Schultz C, Alegría AC, Cornelis J, et al. Comparison of spatial and aspatial logistic regression models for landmine risk mapping. Appl Geogr. 2016;66:52–63. doi:10.1016/j.apgeog.2015.11.005
30. Chen T, Guestrin C XGBoost: a Scalable Tree Boosting System.
31. Svetnik V, Liaw A, Tong C, et al. Random forest: a classification and regression tool for compound classification and QSAR modeling. J Chem Inf Comput Sci. 2003;43(6):1947–1958. doi:10.1021/ci034160g
32. Mantel N, Haenszel W. Statistical aspects of the analysis of data from retrospective studies of disease. J Natl Cancer Inst. 1959;22(4):719–748. doi:10.1093/jnci/22.4.719
33. Ohno-Machado L. Modeling medical prognosis: survival analysis techniques. J Biomed Inform. 2001;34(6):428–439. doi:10.1006/jbin.2002.1038
34. Al’Aref SJ, Maliakal G, Singh G, et al. Machine learning of clinical variables and coronary artery calcium scoring for the prediction of obstructive coronary artery disease on coronary computed tomography angiography: analysis from the CONFIRM registry. Eur Heart J. 2020;41(3):359–367. doi:10.1093/eurheartj/ehz565
35. Vickers A, Elkin E. Decision curve analysis: a novel method for evaluating prediction models. Med Decision Making. 2006;26(6):565–574. doi:10.1177/0272989x06295361
36. Alba A, Agoritsas T, Walsh M, et al. Discrimination and calibration of clinical prediction models: users’ guides to the medical literature. JAMA. 2017;318(14):1377–1384. doi:10.1001/jama.2017.12126
37. Heagerty P, Zheng Y. Survival model predictive accuracy and ROC curves. Biometrics. 2005;61(1):92–105. doi:10.1111/j.0006-341X.2005.030814.x
38. Gunderson LL, Jessup JM, Sargent DJ, et al. Revised TN categorization for colon cancer based on national survival outcomes data. J Clin Oncol. 2010;28(2):264. doi:10.1200/JCO.2009.24.0952
39. Nagtegaal I, Schmoll H. Colorectal cancer: what is the role of lymph node metastases in the progression of colorectal cancer? Nat Rev Gastroenterol Hepatol. 2017;14(11):633–634. doi:10.1038/nrgastro.2017.122
40. Becerra A, Probst C, Tejani M, et al. Evaluating the prognostic role of elevated preoperative carcinoembryonic antigen levels in colon cancer patients: results from the national cancer database. Ann Surg Oncol. 2016;23(5):1554–1561. doi:10.1245/s10434-015-5014-1
41. Hyngstrom J, Hu C, Xing Y, et al. Clinicopathology and outcomes for mucinous and signet ring colorectal adenocarcinoma: analysis from the National Cancer Data Base. Ann Surg Oncol. 2012;19(9):2814–2821. doi:10.1245/s10434-012-2321-7
42. Altman DG, Vergouwe Y, Royston P, et al. Prognosis and prognostic research: validating a prognostic model. BMJ. 2009:338. doi:10.1136/bmj.b605.
43. Collins G, de Groot J, Dutton S, et al. External validation of multivariable prediction models: a systematic review of methodological conduct and reporting. BMC Med Res Methodol. 2014;14:40. doi:10.1186/1471-2288-14-40
44. Bates DW, Auerbach A, Schulam P, et al. Reporting and implementing interventions involving machine learning and artificial intelligence. Ann Intern Med. 2020;172(11_Supplement):S137–S144. doi:10.7326/M19-0872
45. Steyerberg EW, Eijkemans MJ, Harrell FE
46. Altman D, Vergouwe Y, Royston P, et al. Prognosis and prognostic research: validating a prognostic model. BMJ (Clinical Research Ed). 2009;338:b605. doi:10.1136/bmj.b605
 © 2022 The Author(s). This work is published and licensed by Dove Medical Press Limited. The full terms of this license are available at https://www.dovepress.com/terms.php and incorporate the Creative Commons Attribution - Non Commercial (unported, v3.0) License.
By accessing the work you hereby accept the Terms. Non-commercial uses of the work are permitted without any further permission from Dove Medical Press Limited, provided the work is properly attributed. For permission for commercial use of this work, please see paragraphs 4.2 and 5 of our Terms.
© 2022 The Author(s). This work is published and licensed by Dove Medical Press Limited. The full terms of this license are available at https://www.dovepress.com/terms.php and incorporate the Creative Commons Attribution - Non Commercial (unported, v3.0) License.
By accessing the work you hereby accept the Terms. Non-commercial uses of the work are permitted without any further permission from Dove Medical Press Limited, provided the work is properly attributed. For permission for commercial use of this work, please see paragraphs 4.2 and 5 of our Terms.