")
Back to Journals » International Journal of Nanomedicine » Volume 13
Lysyl oxidase activates cancer stromal cells and promotes gastric cancer progression: quantum dot-based identification of biomarkers in cancer stromal cells
Authors Peng CW, Liu JY, Yang GF, Li Y
Received 13 June 2017
Accepted for publication 8 September 2017
Published 27 December 2017 Volume 2018:13 Pages 161—174
DOI https://doi.org/10.2147/IJN.S143871
Checked for plagiarism Yes
Review by Single anonymous peer review
Peer reviewer comments 2
Editor who approved publication: Professor Lei Yang
Chunwei Peng,1 Jiuyang Liu,1 Guifang Yang,2 Yan Li3
1Department of Gastrointestinal Surgery, Zhongnan Hospital of Wuhan University, Hubei Key Laboratory of Tumor Biological Behaviors & Hubei Cancer Clinical Study Center, 2Department of Pathology, Zhongnan Hospital of Wuhan University, Wuchang District, Wuhan, 3Department of Peritoneal Cancer Surgery, Cancer Center of Beijing Shijitan Hospital Affiliated to the Capital Medical University, Yangfangdian, Beijing, People’s Republic of China
Purpose: Semiconductor quantum dots (QDs) are a promising alternative to organic fluorescent dyes for multiplexed molecular imaging of cancer stroma, which have great advantages in holistically analyzing the complex interactions among cancer stromal components in situ.
Patients and methods: A QD probe-based multiplexed spectral molecular imaging method was established for simultaneous imaging. Three tissue microarrays (TMAs) including 184 gastric cancer (GC) tissues were constructed for the study. Multispectral analyses were performed for quantifying stromal biomarkers, such as lysyl oxidase (LOX). The stromal status including infiltrating of immune cells (high density of macrophages), angiogenesis (high density of microvessel density [MVD], low neovessel maturation) and extracellular matrix (ECM) remodeling (low density of type IV collagen, intense expression of matrix metalloproteinase 9 [MMP-9]) was evaluated.
Results: This study compared the imaging features of the QD probe-based single molecular imaging method, immunohistochemistry, and organic dye-based immunofluorescent methods, and showed the advantages of the QD probe-based multiple molecular imaging method for simultaneously visualizing complex components of cancer stroma. The risk of macrophages in high density, high MVD, low neomicrovessel maturation, MMP-9 expression and low type IV collagen was significantly increased for the expression of LOX. With the advantages of the established QD probe-based multiplexed molecular imaging method, the spatial relationship between LOX and stromal essential events could be simultaneously evaluated histologically. Stromal activation was defined and then evaluated. Survival analysis showed that the stromal activation was correlated with overall survival and disease-free survival (P<0.001 for all). The expression of LOX was significantly increased in the intense activation subgroup (P<0.001).
Conclusion: Quantifying assessment of the stroma indicates that the LOX may be a stromal marker for GC and stromal activation, which is not only responsible for the ECM remodeling morphologically, but also for the formation of invasive properties and recurrence. These results support the possibility to integrate morphological and molecular biomarker information for cancer research by the biomedical application of QDs.
Keywords: nanomedicine, cancer stromal, gastric cancer, multiplexed molecular imaging
Introduction
Semiconductor quantum dots (QDs) are highly fluorescent nanocrystals with size-dependent emission spectra.1 Owing to their excellent photophysical properties, QDs are a promising alternative to organic fluorescent dyes for multiplexed molecular imaging of cancer.2,3 In particular, simultaneously visualizing and quantifying of many components is possible along with the integration of spectrum analysis technology. From this perspective, the spectrum analysis derived from QD probes in the cancer research would be one of the most essential and promising clinically relevant applications.4
The high mortality of cancer mainly resulted from the poor understanding of cancer invasion and metastasis.5–7 Despite significant advances in gastric cancer (GC) early diagnosis, staging system and treatment, the 5-year overall survival (OS) of GC remains ~40%.8,9 Extensive evidence across multiple models has verified the critical role for the tumor microenvironment (TME) in promoting tumor progression.10 There is a critical need to deal with the tumor progression no longer as a cancer cell autonomous event but as a continuing process, which relies upon these complex networks of both the immediate microenvironment (cell–cell or cell–matrix interactions) and the extended TME (eg, vascularization).11,12 Beyond question, the morphological, biochemical and biophysical properties of extended TME are significantly different among normal tissues and cancer tissues. The continuous change in cancer stroma in different clinical stages was called stromal activation, which was parallel to cancer cell growth and invasion.13,14 In fact, factors and cells that do not support tumor growth are usually downregulated or mitigated in TME. Stromal activation may serve to establish a supportive TME, fostering the outgrowth of the malignant cells.14 Considering the high heterogeneity of GC, uncovering the stromal activation events would improve tailored treatment for patients.15,16
Several recent studies have highlighted that Lysyl oxidase (LOX) is critical in establishing and mediating TME milieu, through regulating the posttranslational modification of the extracellular matrix (ECM), which enhances cancer cell survival and proliferation, and that therapeutic targeting of LOX prevents the development of such permissive milieu and the associated fibrosis-enhanced metastasis.17,18 Furthermore, increased expression of LOX would recruit bone marrow-derived cells (BMDCs), which are essential for vascularization and infiltration of immune cells, to create a fertile metastatic niche.19 Many studies have identified that the vascularization, infiltration of immune cells and ECM remodeling are key stromal activation events that are responsible for creating a milieu that promotes recurrence and metastasis growth.20–22 Thus, it is hypothesized that LOX may be the mediator responsible for stromal activation, resulting in the invasive properties and the formation of preinvasion niche in primary GC. To detect the expression of LOX on tissue histologically, immunohistochemistry (IHC) and fluorescent imaging are common technologies. However, for the research of TME, multiplexed imaging is needed. There is still no study which has directly visualized the spatial relationship between LOX and stromal activation histologically and quantitatively validated this hypothesis. Considering the complexities of TME, integrated information on key stromal features is very important; thus, a more holistic approach to its investigation is essential to study not only one parameter at a time but at least several key parameters simultaneously. Among the currently available technologies, QD probe-based multiplexed molecular imaging methods have great advantages in holistically analyzing the complex interactions of stromal components in situ.23
In this study, we established QD probe-based multiplexed spectral molecular imaging method to simultaneously reveal the expression of LOX and the spatial evolution of stromal activation. Deep analyses were conducted to investigate the crucial LOX in regulating stromal activation and GC progression quantitatively.
Patients and methods
Patients and follow-up
The records of GC patients who underwent surgery with a curative intent at the Department of Oncology, Zhongnan Hospital of Wuhan University, Wuhan, People’s Republic of China, between December 2002 and February 2011 were reviewed. TNM stage was determined according to the seventh edition of the Union for International Cancer Control (UICC) and the American Joint Committee on Cancer (AJCC) TNM system. By the most recent follow-up on May 31, 2012, the median follow-up was 59.5 months (range: 16.8–102.3 months). Evidence of disease recurrence was based on the following criteria: local recurrence found by endoscopic biopsy or with relaparotomy, peritoneal dissemination on ultrasonography or CT scan with positive peritoneal cytology, liver metastasis on ultrasonography or CT scan, lung metastasis on chest radiography and bone metastasis on radiography or bone scan. Any recurrence occurring in abdominopelvic cavity was defined as local–regional recurrence; recurrence via blood flow was defined as distant metastasis, such as liver metastasis and lung metastasis. Written informed consent was obtained from the patients, and the study protocol was approved by the ethics committee of Zhongnan Hospital of Wuhan University. The study was undertaken according to the ethical standards of the World Medical Association Declaration of Helsinki.
GC specimens and tissue microarrays (TMAs)
All hematoxylin and eosin (HE)-stained slides were examined by independent reviewers who were not aware of the clinical characteristics or clinical outcomes. Three TMAs were constructed. Briefly, two cores were taken from each representative tumor tissue (1.5 mm in diameter for each core). Then, three TMA sections with 184 tumor tissues and 41 distant peritumoral tissues (450 cores, 1.5 mm each core) were constructed (in collaboration with Shanghai Biochip Company Ltd., Shanghai, People’s Republic of China).
IHC and QD probe-based molecular imaging
The IHC and QD probe-based molecular imaging technology were performed as described previously.23 The primary antibodies were mouse anti-human monoclonal antibody against macrophages (dilution 1/100, MA1-38069; Thermo Fisher Scientific, Waltham, MA, USA), mouse anti-human monoclonal antibody against type IV collagen (dilution 1/100, ab6311; Abcam, Cambridge, UK), rabbit anti-human polyclonal antibody against type IV collagen (dilution 1/500, ab-6586; Abcam) for stroma, rabbit anti-human polyclonal antibody against LOX (dilution 1/500, ab-31328; Abcam) for LOX, goat anti-human polyclonal antibody against CD105 (dilution 1/100, sc-23838; Santa Cruz Biotechnology Inc., Dallas, TX, USA) for neovessels and goat anti-human polyclonal antibody against MMP-9 (dilution 1/100, sc-6840; Santa Cruz Biotechnology Inc.) for MMP-9. The QD probes were secondary antibodies conjugated with QDs on the F(ab′)2 fragments, including QDs-525 probe (QDs-525 goat F(ab′)2 anti-mouse IgG conjugate, dilution 1/150, Q-11041MP; Thermo Fisher Scientific), QDs-585 probe (QDs-585 goat F(ab′)2 anti-rabbit IgG conjugate, dilution 1/250, Q-11411MP; Thermo Fisher Scientific) and QDs-655 probe (QDs-655 rabbit F(ab′)2 antigoat IgG conjugate, dilution 1/500, Q-11821MP; Thermo Fisher Scientific). All secondary antibody conjugates of QDs used in this study are made from a nanometer-scale crystal of a semiconductor material (CdSe), which is coated with an additional semiconductor shell (ZnS) to improve the optical properties of the materials.
Evaluation of QD probe-based molecular imaging and multispectral analysis
The slides were examined under Olympus BX51 fluorescence microscope equipped with an Olympus DP72 camera (Olympus Corporation, Tokyo, Japan) and CRi Nuance multispectral imaging systems (Cambridge Research & Instrumentation, Inc., Woburn, MA, USA). The QDs-525, QDs-585 and QDs-655 were excited simultaneously by ultraviolet light (330–385 nm). Panorama of each multi-labeled core was obtained based on four photographs under high-power magnification (×200) with high resolution by DP-BSW software (Olympus Optical Co., Ltd., Tokyo, Japan); identical settings were used for every photograph, so as to avoid the selection bias. The images of QDs were captured by DP72 camera. A spectral cube for each slide, which contained the complete spectral information at 10 nm wavelength intervals from 490 to 720 nm, was collected by CRi Nuance systems. All the cubes were captured under the same condition at proper magnifications, which could make them more accurate and representative in tumor marker assays.
For quantifying, deconvolution algorithms were applied to image each cube, generating a set of “single-color” images representing each individual QDs/biomarker and the tissue autofluorescence. The colors of QDs were converted to pseudocolors for graphic visualization or emphasis. The fluorescence signal information of cubes for each slide of QDs was analyzed by the image analysis software package (CRi Nuance) within the Nuance system. The fluorescent signal intensity and distribution areas of QD probes in cancer tissues were calculated based on spectral unmixing. Feature extraction and pattern recognition algorithms were used to identify areas of interest and whole slide. Biomarker expressions in these identified areas were quantified by pixel-based intensity measurement with a computer-generated threshold obtained from experimental data and was used for background subtraction.
The data of LOX, MMP-9, infiltrating macrophages, microvessel density (MVD) and type IV collagen were collected in this study. To analyze the relationship between LOX and stromal features (macrophages, MVD, the maturation of neoangiogenesis), the data of infiltrating macrophage density, MVD, type IV collagen and the maturation of neoangiogenesis were included in this study. Corresponding evaluation criteria have been established.24 Cutoff point for LOX was explored by “the best cut-off approach by log-rank test”. In all, 50% was defined as the cutoff point.
Statistical analysis
Statistical analyses were carried out using SPSS version 19.0 (IBM Corporation, Armonk, NY, USA). The Pearson χ2 test or Fisher’s exact test was used to compare qualitative variables. Kaplan–Meier analysis was used for survival analysis, and significance among patients’ subgroups was calculated by the log-rank test. Prognostic relevance was investigated using multivariate Cox regression analyses. No adjustments were made. Logistic regression was used to assess the influence of binary factors. Receiver operating characteristic curve (ROC) analysis was used to determine the predictive value of the parameters. Two-sided P<0.05 was considered as statistically significant.
Results
Expression of LOX and the establishment of QD probe-based multiplexed molecular imaging
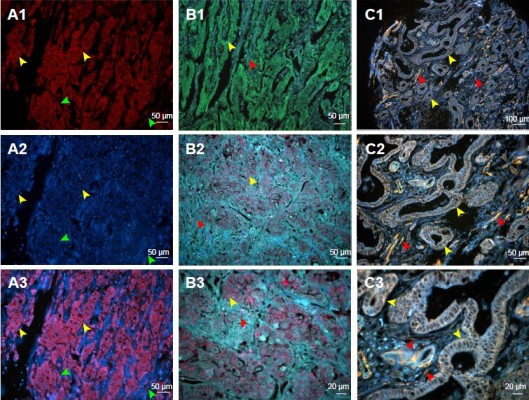
In this study, the QD probe-based multiplexed molecular imaging was established gradually. First, the expression of LOX was visualized by IHC and QDs-585 probe-based single molecular imaging. LOX was stained orange with the emission spectrum of 585 nm and mainly expressed in the cytoplasm of GC cells (red arrows) and stromal cells (blue arrows; Figure 1A1 and A2 and B1 and B2). In addition, some special progress called nuclear translocation was observed too (Figure 1C and D).
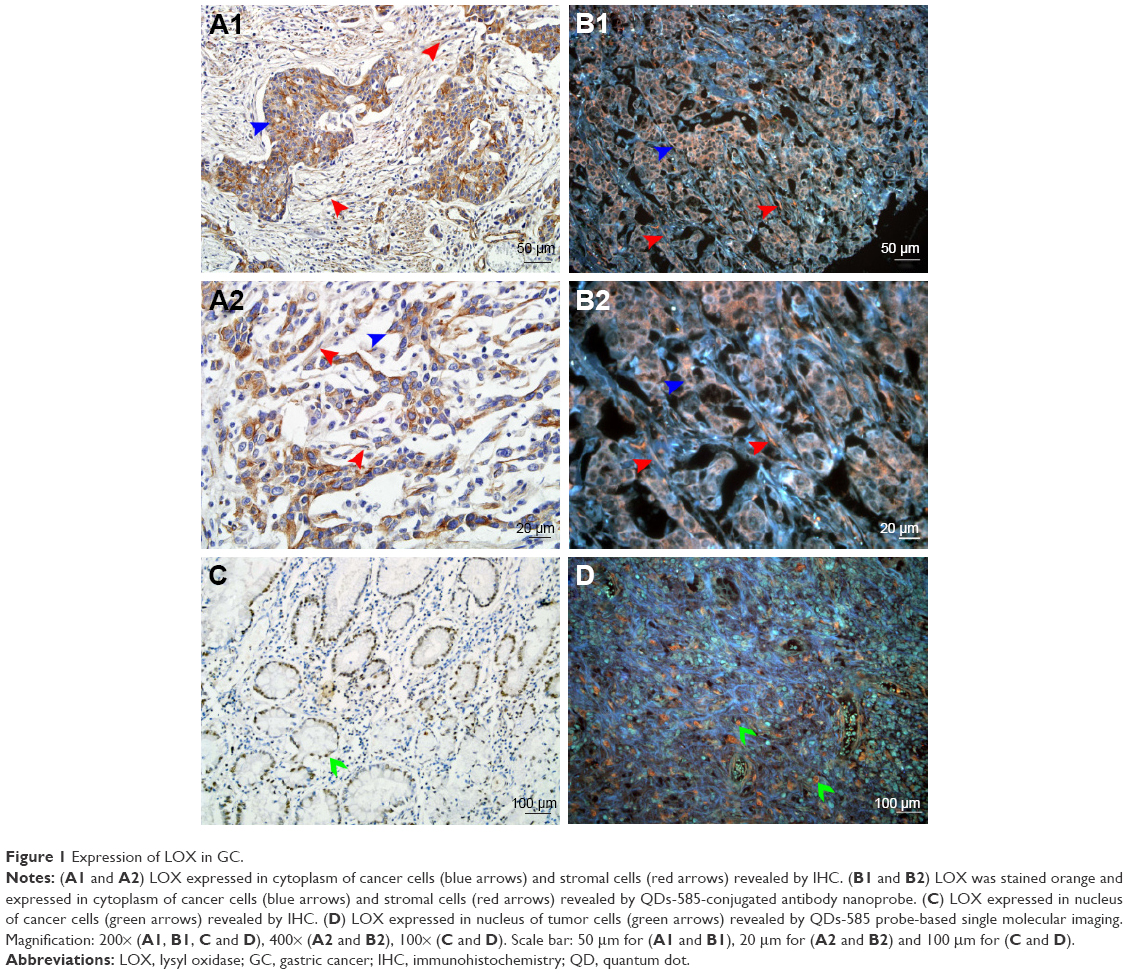 | Figure 1 Expression of LOX in GC. |
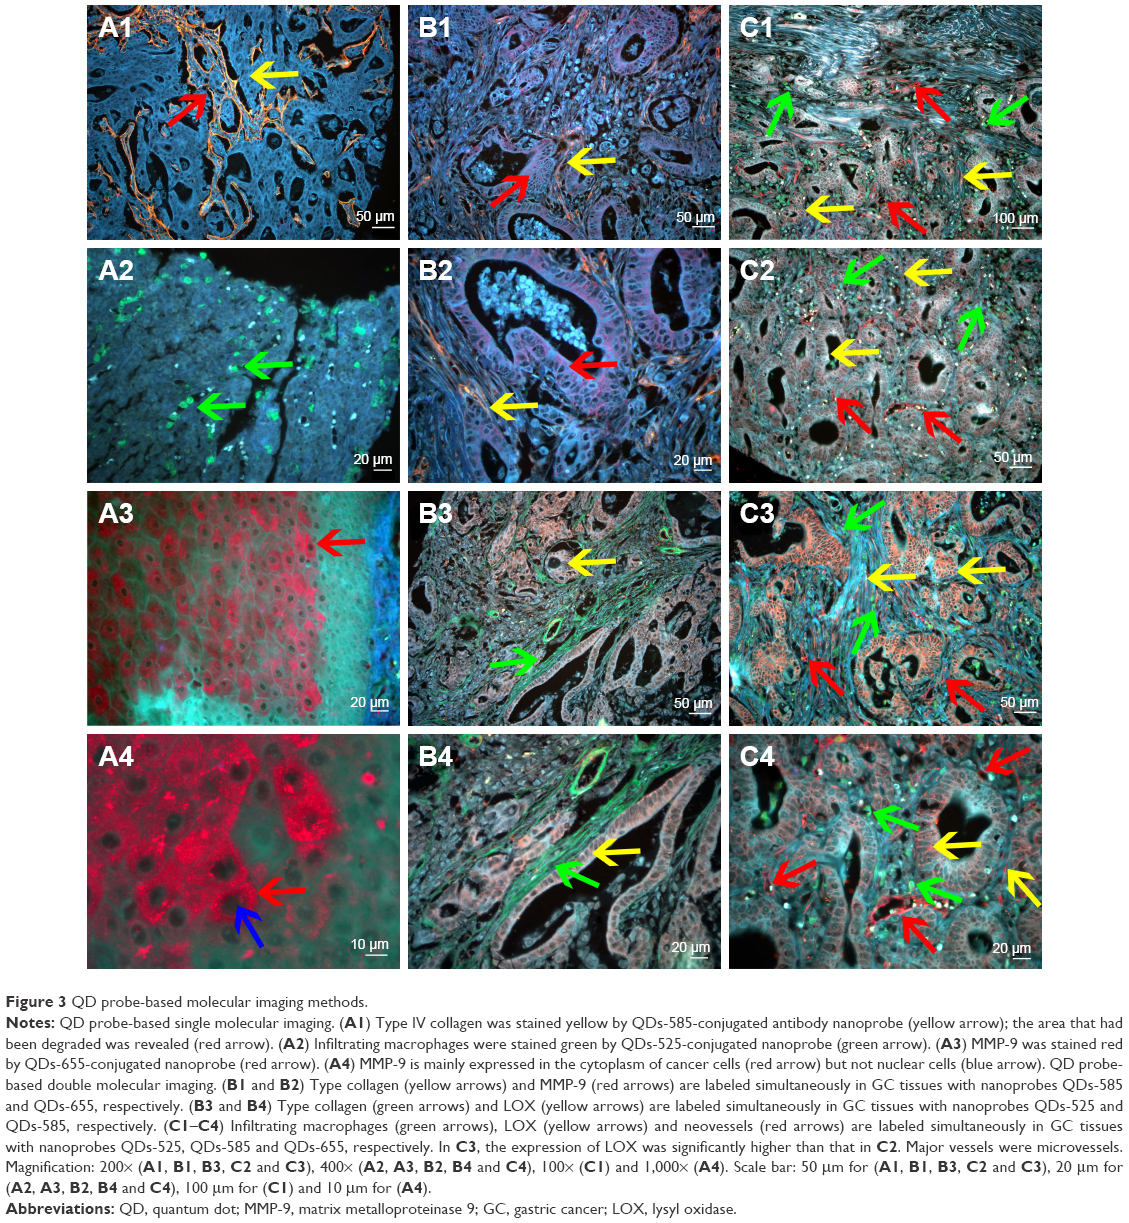
Second, we compared the features between the QD probe-based single molecular imaging method and organic dye-based immunofluorescent method. With conventional fluorescent dyes such as CY3 and Dylight 488, the expression of LOX could be evaluated (Figure 2A1–A3 and B1). QDs-585 probe-based single molecular fluorescent staining can reveal the target protein very well on tissues, with comparable specificity and higher sensitivity (Figure 2B2 and B3). In comparison with organic dyes and fluorescent proteins, the QD-based probe showed unique optical and electronic properties such as improved signal brightness and resistance to photobleaching (Figure 2C1 and C2). In addition, the process of merge was unnecessary (Figure 2B2 and C3). Such properties facilitate the evaluation process.
 | Figure 2 Comparison of conventional fluorescent dyes and QD-based molecular probe. |
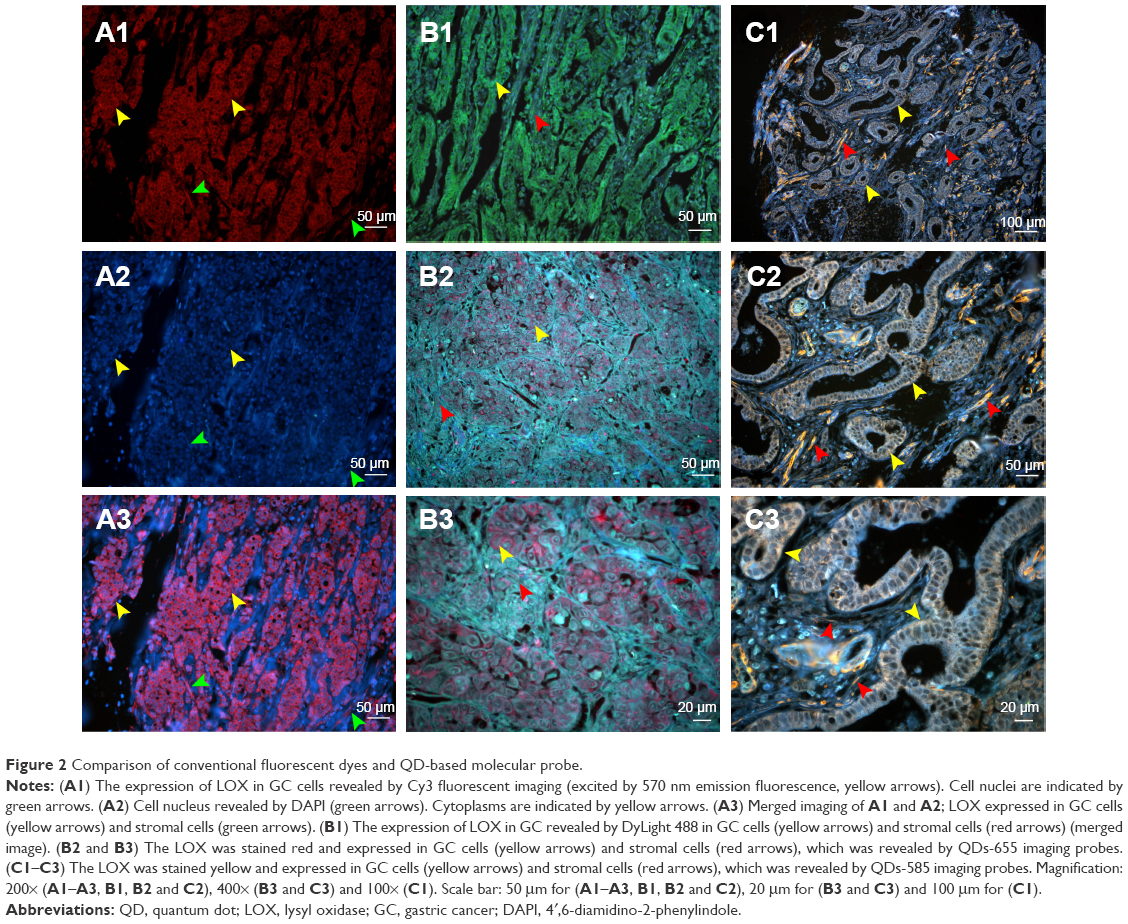
Third, considering that the different QD colors can be simultaneously excited by a single light source, with minimal spectral overlapping, the QD probe-based multiplexed molecular imaging method was established. The QD probe-based single molecular imaging method was stable and reliable, which could be used for the evaluation of other components that could cooperate with LOX (Figure 3A1–A4). We further established the QD probe-based double molecular imaging (Figure 3B1–B4) and QD probe-based multiple molecular imaging (Figure 3C1–C4) to simultaneously visualize these components in TME.
 | Figure 3 QD probe-based molecular imaging methods. |
Fourth, spectrum analysis was performed to quantitatively evaluate the expression of LOX, infiltrating macrophages and neovessels. With this technology, some targets that were not revealed in conventional fluorescent imaging can be visualized and included for statistical analysis (Figure 4).
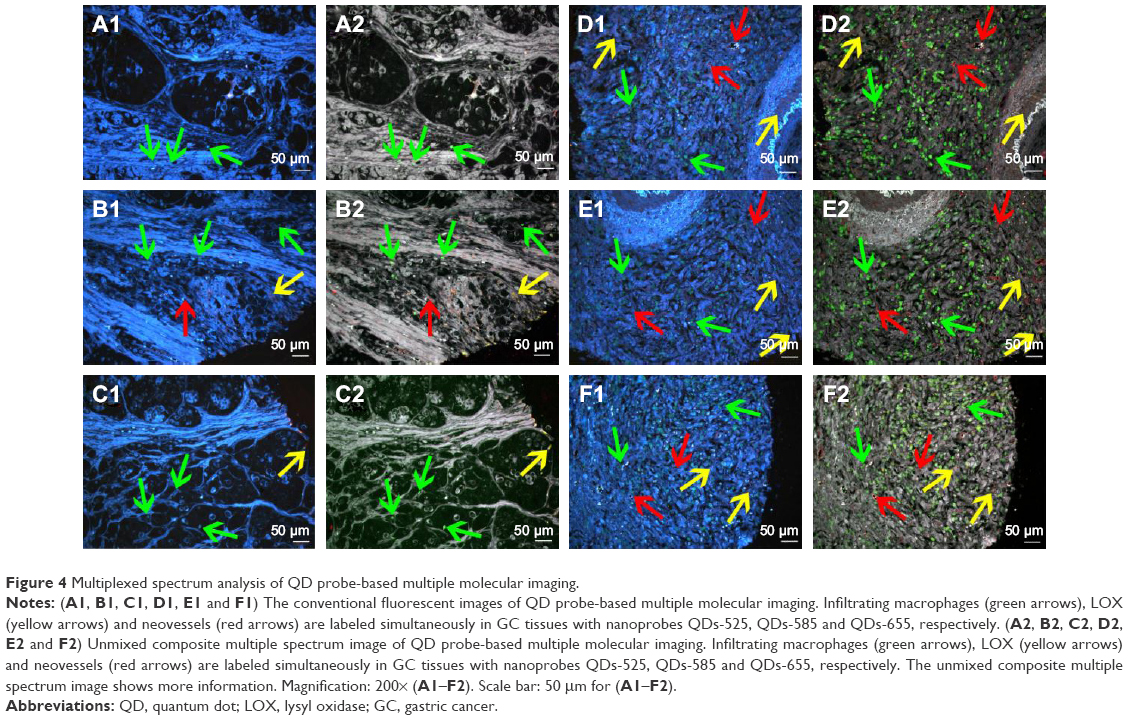 | Figure 4 Multiplexed spectrum analysis of QD probe-based multiple molecular imaging. |
Expression of LOX in peritumoral and GC tissues
To compare the differences in tumor stromal features between tumoral and peritumoral tissues, 41 distant peritumoral tissues were included. The median expression of LOX was 1912069 and 728432 in 184 tumoral tissues and 41 distant peritumoral tissues, respectively. The difference in the expression of LOX between tumor tissues and peritumoral tissues was statistically significant (P=0.001). Further self-control analysis was performed. Compared to the corresponding peritumoral tissues, the LOX expression in GC tissues presented a rising trend; the difference was statistically significant (P<0.05).
The main demographic and clinicopathological characteristics are presented in Table 1. There were 92 (50.0%) patients documented as LOX negative according to the abovementioned classification criteria. The difference in the expression of LOX was statistically significant in terms of gender (P=0.009). The expression of LOX was higher in patients with serosal invasion, lymph node metastasis and advanced GC (P<0.005 for all), and patients with distant metastasis tended to have more expression of LOX (P=0.054). Notably, compared to patients without recurrence (n=124), the expression of LOX was higher in patients with recurrence (n=60); the difference was statistically significant (P<0.001). Among 60 recurrence cases, compared to patients with distant recurrence (n=23), the expression of LOX was higher in patients with local–regional recurrence (n=37); the difference was statistically significant (P=0.024).
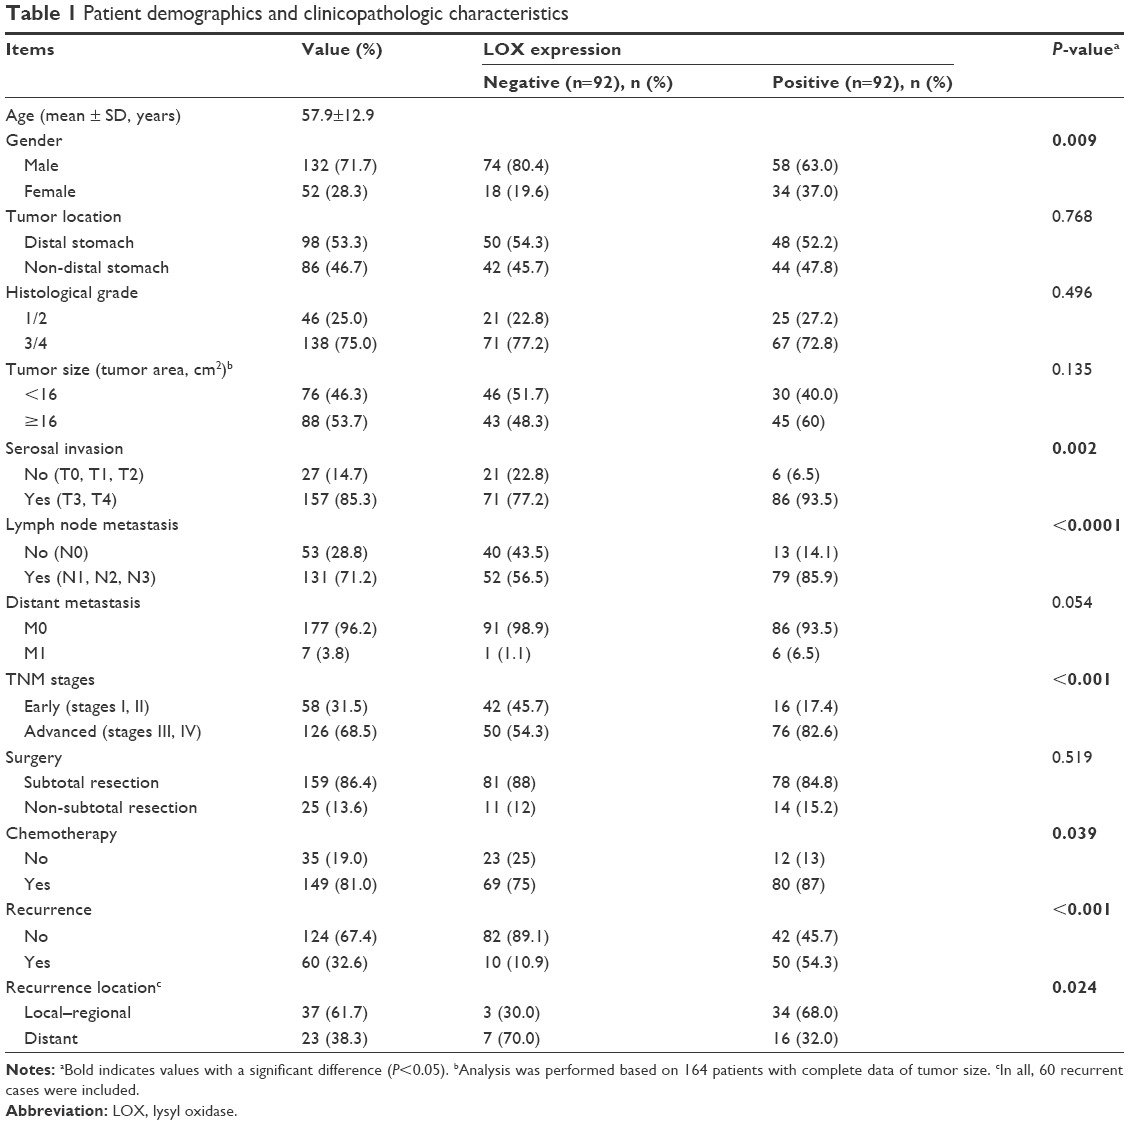 | Table 1 Patient demographics and clinicopathologic characteristics |
Relationship between LOX and stromal evolution (infiltration of immune cells, angiogenesis, ECM remodeling)
To confirm the relationship between LOX and essential stromal events, infiltration of macrophages, angiogenesis (MVD, neomicrovessel maturation) and ECM remodeling (MMP-9, type IV collagen) were assessed independently. All data from 184 patients were included into deep statistical analyses (Table 2). There were 125 (67.9%) and 59 (32.1%) patients classified into macrophage low-density group and macrophage high density group, respectively. The difference in the expression of LOX between different macrophage density subgroups was statistically significant (P=0.04). The risk of macrophage high density was significantly increased for the expression of LOX (odds ratio [OR] =1.929 [95% CI: 1.026–3.624], P=0.0041; logistic regression).
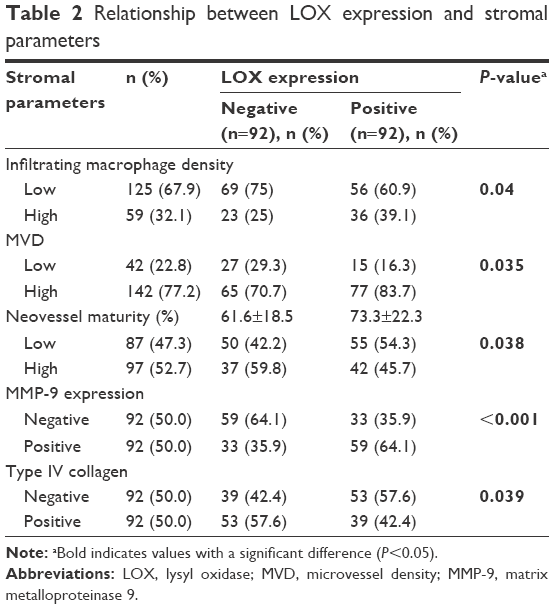 | Table 2 Relationship between LOX expression and stromal parameters |
There were 42 (22.8%) and 142 (77.2%) patients classified into MVD low-density group and MVD high-density group, respectively. The difference in the expression of LOX between different MVD subgroups was statistically significant (P=0.035). The risk of high MVD was significantly increased for the expression of LOX (OR =2.132 [95% CI: 1.046–4.347], P=0.037; logistic regression).
The neovessels’ maturity was another parameter analyzed in this study. There were 87 (22.8%) and 97 (77.2%) patients classified into neomicrovessel low maturation group and neomicrovessel high maturation group, respectively. The difference in the expression of LOX between different neomicrovessel maturation subgroups was statistically significant (P=0.038). The risk of high neomicrovessel maturation were significantly decreased for the expression of LOX (OR =0.550 [95% CI: 0.306–0.989], P=0.046; logistic regression).
There were 92 (50%) and 92 (50%) patients classified into MMP-9 negative group and MMP-9 positive group, respectively. The difference in the expression of LOX between different MMP-9 subgroups was statistically significant (P<0.0001). The risk of MMP expression was significantly increased for the expression of LOX (OR =3.197 [95% CI: 1.75–5.839], P<0.001; logistic regression).
There were 92 (50%) and 92 (50%) patients classified into type IV collagen low group and type IV collagen high group, respectively. The difference in the expression of LOX between different type IV collagen subgroups was statistically significant (P=0.039). The risk of high type IV collagen was significantly decreased for the expression of LOX (OR =0.541 [95% CI: 0.302–0.972], P=0.04; logistic regression).
Furthermore, with the advantages of the established QD probe-based multiplexed molecular imaging method, the spatial relationship between LOX and stromal essential events could be simultaneously evaluated histologically. Some interesting phenomena have been revealed that the density and MVD of the infiltrating macrophages seem to be increased as the expression of LOX increased (Figure 5A–C) and the expression of type IV collagen seems to be decreased as the expression of LOX increased (Figure 5D and E). Particularly, the expression of LOX was significant high in the invasion front, while that of the type IV collagen was low on the contrary (Figure 5F).
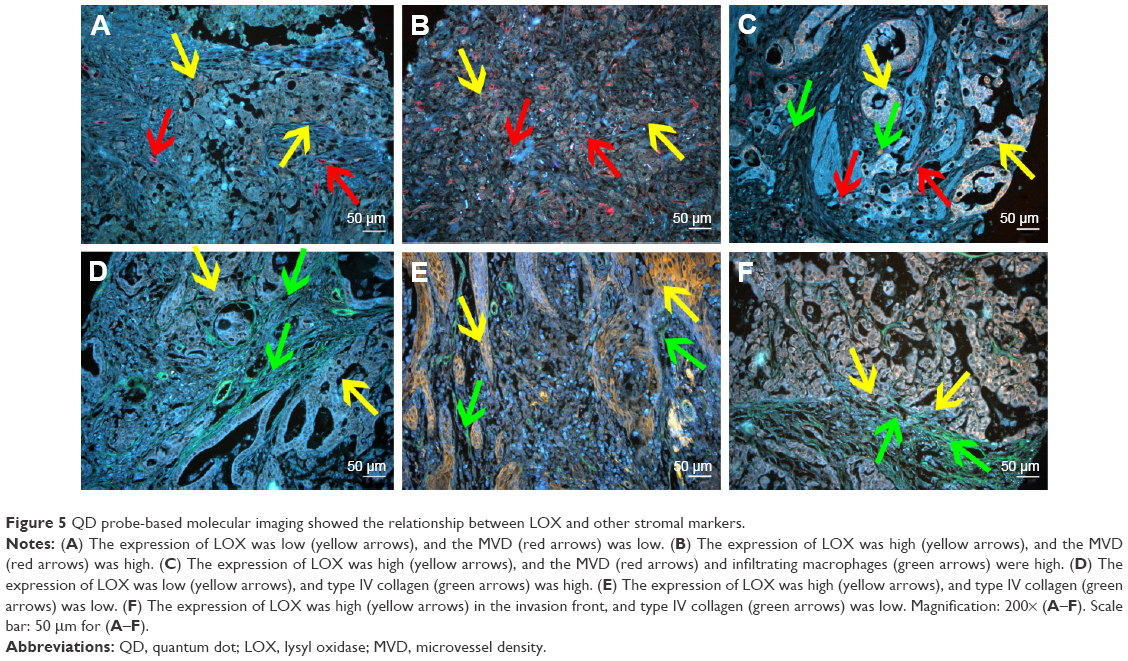 | Figure 5 QD probe-based molecular imaging showed the relationship between LOX and other stromal markers. |
Survival analysis
Survival analysis showed that traditional factors were associated with GC patients’ OS, such as age, tumor size, histological grade, lymph node status, lymph node ratio (LNR), serosal invasion, TNM stage and recurrence (P<0.05 for all) as expected. In addition, low MVD, neovessels high maturation, type IV collagen high expression, MMP-9 negative expression and LOX negative expression were correlated with better OS (P-value was 0.048, <0.001, <0.001, <0.001 and <0.001, respectively; Tables 3 and 4 and Figure 6).
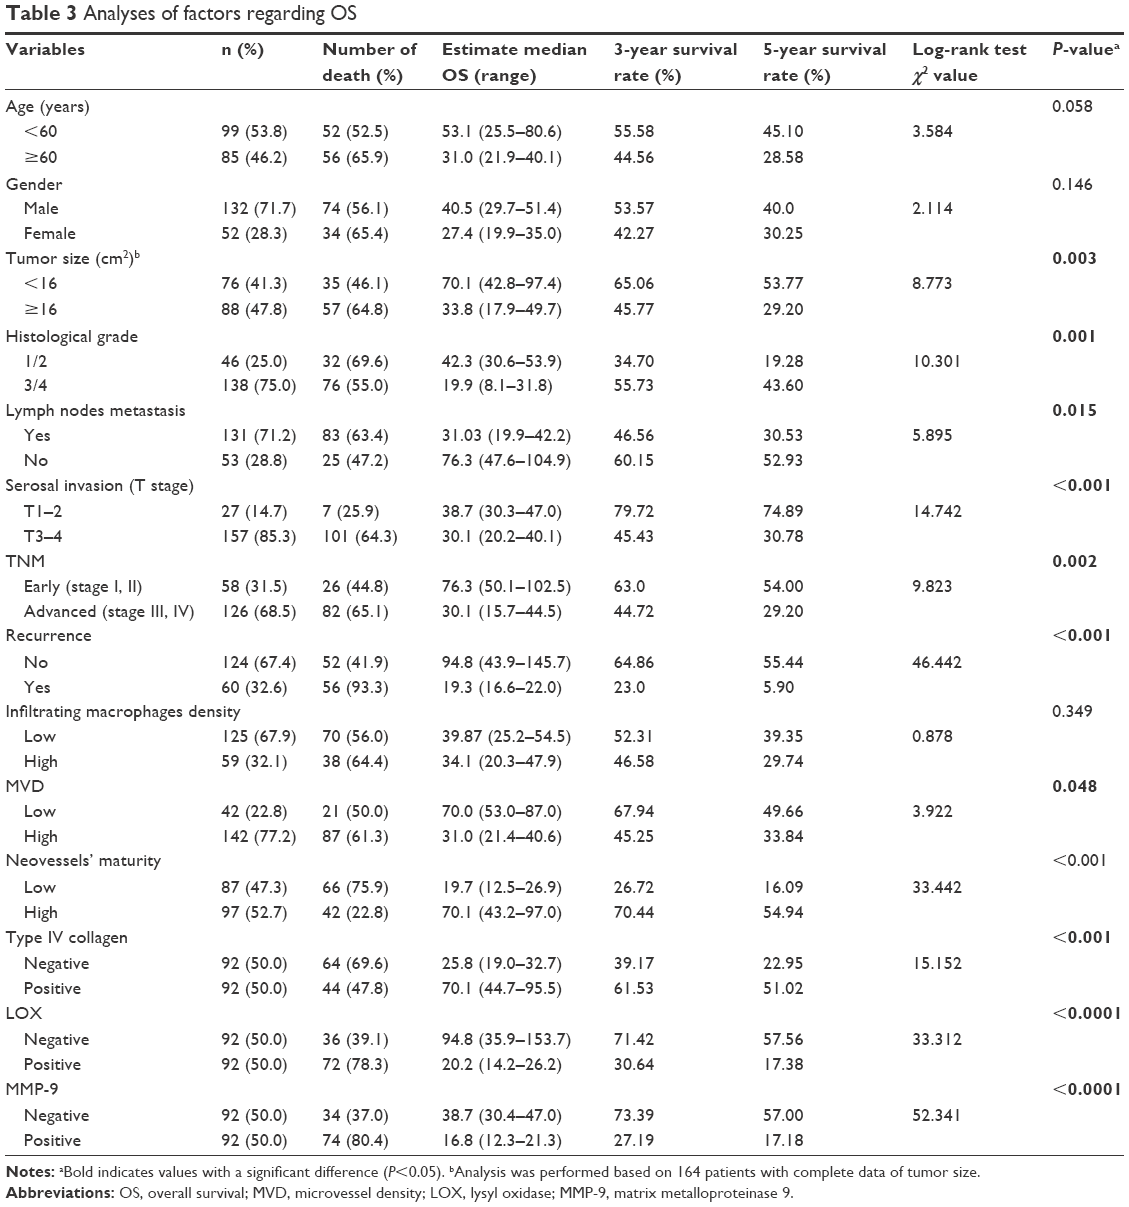 | Table 3 Analyses of factors regarding OS |
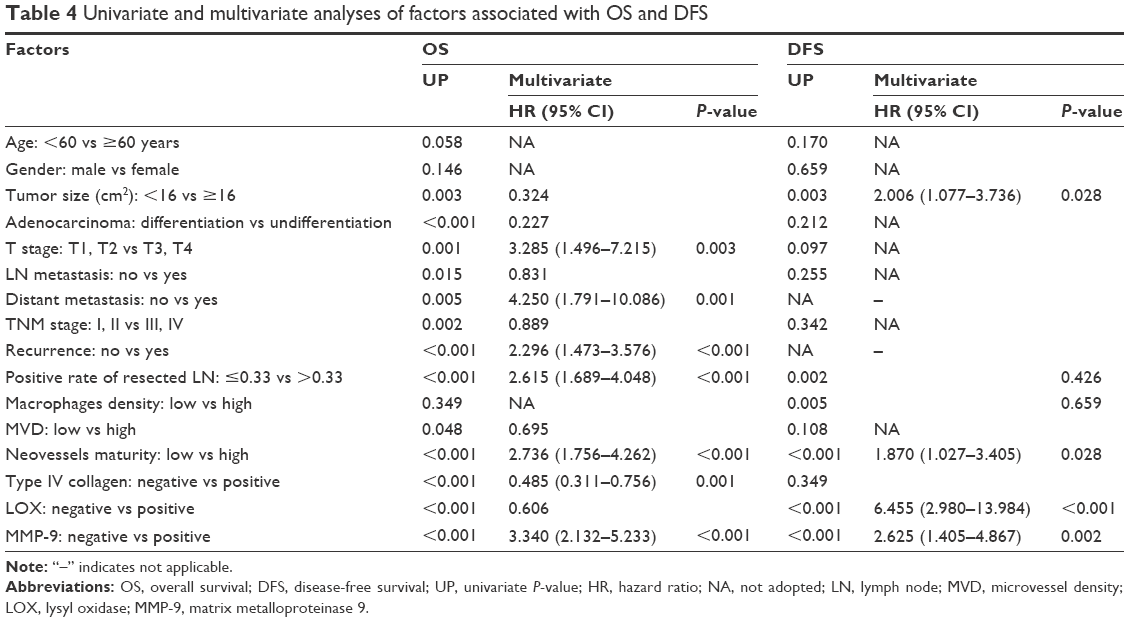 | Table 4 Univariate and multivariate analyses of factors associated with OS and DFS |
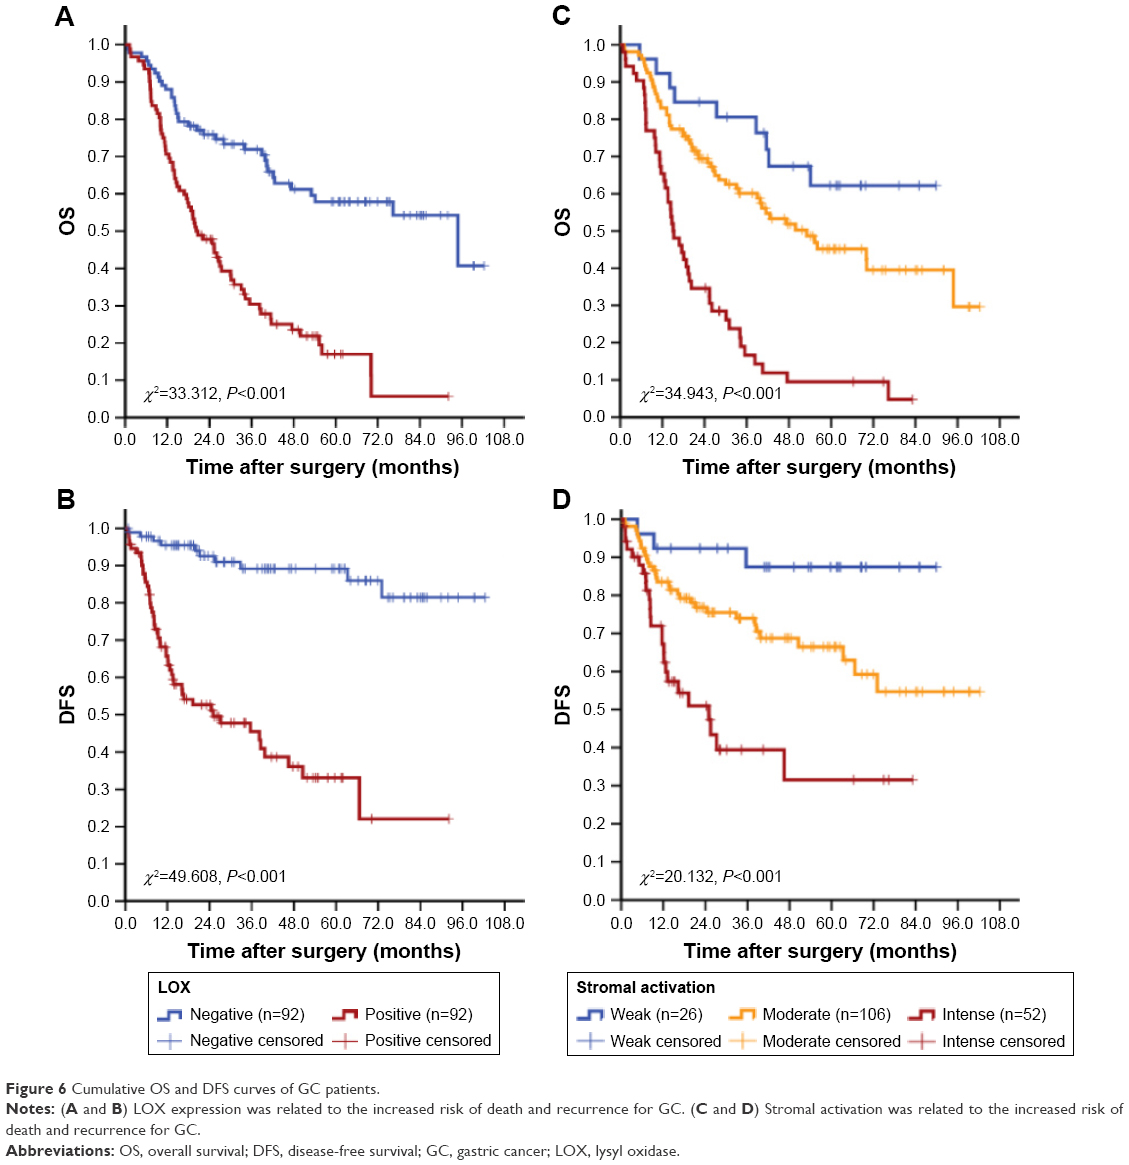 | Figure 6 Cumulative OS and DFS curves of GC patients. |
Factors showing significance by univariate analysis were integrated into multivariate Cox proportional hazards analysis. Tumor features including T stage (hazards ratio [HR] =3.245 [95% CI: 1.477–7.131], P=0.003), distant metastasis (HR =4.320 [95% CI: 1.817–10.271], P=0.001), recurrence (HR =2.296, [95% CI: 1.473–3.576], P<0.001), positive rate of resected lymph nodes (HR =2.615, [95% CI: 1.689–4.048], P<0.001), neovessels’ maturity (HR =2.736 [95% CI: 1.756–4.262], P<0.001), type IV collagen (HR =0.485 [95% CI: 0.311–0.756], P<0.001) and MMP-9 (HR =3.340 [95% CI: 2.132–5.233], P<0.001) were independent prognostic factors for OS after excluding other confounding factors. Moreover, multivariate analysis indicates that tumor size (HR =2.006 [95% CI: 1.077–3.736], P=0.028), neovessels’ maturity (HR =0.519 [95% CI: 0.289–0.933], P=0.028), MMP-9 (HR =2.625 [95% CI: 1.405–4.867], P=0.002) and LOX (HR =6.455 [95% CI: 2.980–13.98], P<0.001) were independent predictors for disease-free survival (DFS; Table 4).
LOX expression and stromal activation
With the quantifying analysis, we have confirmed that LOX expression was correlated with some stromal status including infiltration of immune cells (high density of macrophages), angiogenesis (high density of MVD, low neovessels’ maturation) and ECM remodeling (low density of type IV collagen, intense expression of MMP-9), all of which were independent risk factors for OS or DFS and would be considered as the marker for stromal activation.
We have confirmed that the expression of LOX was correlated with distinct stromal feature morphologically and statistically, then additional analyses focused on exploring the relationship between LOX and whole stromal status should be performed. For this purpose, stromal activation was defined and then evaluated by assessing the activation of infiltrating of immune cells, angiogenesis and ECM remodeling at the invading tumor front: activation was given a score ranging from 0 to 1 (0= unactivated, 1= activated) for each stromal feature. The score were multiplied to obtain the final result, ranging from 0 to 5. The extent of stromal activation was considered as weak activation (score: 0–1, n=31), moderate activation (score: 2–3, n=95) and intense activation (score 4–5, n=58). Survival analysis showed that the stromal activation was correlated with OS and DFS (P<0.001). The expression of LOX was significantly increased in the intense activation group (P<0.001; Table 5 and Figure 6A). In addition, the difference in OS and DFS among stromal activation subgroups was statistically significant (P<0.001 for all; Figure 6B and C).
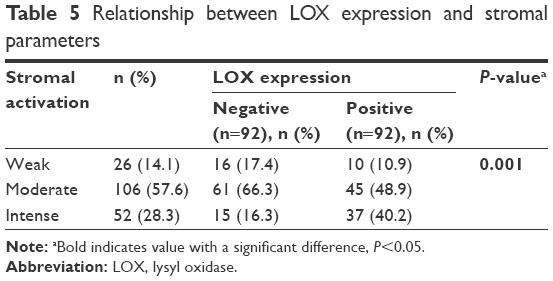 | Table 5 Relationship between LOX expression and stromal parameters |
Discussion
Invasion and metastasis are the basic and dangerous biological behaviors of cancer, which are orchestrated and driven by a combination of cancer cells and cancer stromal cells. Evaluating the stromal activation, which is parallel to cancer cell growth and invasion, would elucidate the complex evolution between cancer cells and TME. Our ability to interpret and model behavior of cancer cells has been limited by the difficulties of measuring stromal differences, for example, comparing activated stromal and nonactivated stromal cells, particularly at the holistic level.
For this purpose, multiple molecules, cells and architecture that are involved in stromal activation should be directly visualized and quantified histologically. Our previous studies have showed that QDs have unique optical and electronic properties such as size-tunable light emission, superior signal brightness, resistance to photobleaching and simultaneous excitation of multiple fluorescence colors.25–27 QDs have gained broad application in many areas of biology.28 The versatile properties of QDs have allowed investigators to conduct biological studies with extended spatiotemporal capabilities.29 Liu et al have revealed extensive tumor heterogeneity at the molecular, cellular, and architectural levels by the multiplexed QDs and wavelength-resolved spectral imaging for molecular mapping of tumor heterogeneity on human prostate cancer tissue specimens.30 Multiplexed detection of biomarker in lung cancer, triple-negative breast cancer and head and neck cancer is possible.31–33 Herein, the unique optical and electronic properties of QDs have been fully displayed. Then, we established QD probe-based multiplexed spectrum molecular imaging method to simultaneously obtain the essential stromal activation-correlated molecular, cellular, morphological and quantifying information and reveal the spatial evolution of LOX expression and stromal activation (angiogenesis, immune cells infiltration, ECM remodeling).
With the established imaging and quantifying method, we conducted this study to answer the important question that whether LOX promotes GC progression and could be used as a marker for stromal activation. LOX is an extracellular amine oxidase whose primary function is to posttranslationally modify collagens and elastin in the ECM, thereby catalyzing the covalent crosslinking of fibers.34 The expression of LOX family members is tightly controlled during normal development; however, aberrant expression and activity of these proteins have been reported in a range of diseases, as well as in many cancers.35 Nilsson et al36 have showed that the LOX levels both in tumors and in the surrounding tumor-bearing organs are apparently related to prostate cancer aggressiveness. High expression of LOX is related to worse outcome in some cancer, such as astrocytomas, non-small lung cancer and GC.37–39 Notably, the protein LOX has also been shown to have antitumor activity in several cancer types, including GC, lung cancer and nasopharyngeal carcinoma.40–42 In this study, we also found that the expression of LOX was significantly increased in tumor tissues compared to peritumoral tissues. LOX was expressed in cancer cells and stromal cells and correlated with cancer progression. Different to some studies focused on breast cancer implicate that LOX precedes and facilitates the spread of the cancer cells to distant organs, such as the bone and lung,18,43 this study showed that patients with a high expression of LOX seem to be in a high risk of recurrence, especially local–regional recurrence.
Although some studies indicate that LOX improved the mobility and invasiveness of cancer cell via EMT, the role of stromal evolution activated by LOX could not be ignored.44,45 Stromal-derived LOX could create a milieu that is suitable for metastastic cancer cells.34,46 Recently, LOX has been considered as one target to control the metastasis of prostate cancer.46,47 MMPs may be the target for LOX in the process of ECM remodeling.38,48 It is noteworthy that LOX mediates cell migration provoked by LKB1 loss with little impact on cell proliferation in 2D cell culture. The discrepancy could be due to the difference between 2D and 3D cell culture systems, and LOX may alter cancer cell growth potential via ECM remodeling.49 The matrix stiffness, as well as the ECM composition and architecture, plays fundamental roles in cell fate determination.49 In addition, LOX would lead to BMDC recruitment, which was the major source for infiltration of inflammation cells.50,51 Morphological and quantitative analyses of this study indicated that the expression of LOX could promote the infiltration of macrophages, the ECM remodeling, the angiogenesis, the maturation of neo-microvessel, the secretion of MMP-9 and the degradation of type IV collagen (Table 2). Survival analysis indicated that those stromal parameters were independent risk factors for OS or DFS and would be considered as the marker for stromal activation (Table 4).
We have compared the imaging features of IHC, fluorescent imaging and QD probe-based molecular imaging and established a novel protocol for QD-based multiplexed imaging on complex clinical cancer tissues. However, our study only focused on the application of QD probes in cancer research, especially in the expression of LOX. In the future, validation studies should be performed before the methods could be applied in a clinical setting to guide treatment and prognosis.
Conclusion
We revealed the unique advantages of QD probe-based multiplexed molecular imaging method in cancer research. By this new method, we proposed that the LOX is a stromal marker for GC and stromal activation, which is not only responsible for the ECM remodeling morphologically but also for the formation of invasive properties and recurrence. These results have raised exciting possibilities in integrating morphological and molecular biomarker information for cancer research.
Acknowledgments
This work was supported by Science Fund of the National Natural Science Foundation of China (grant numbers: 81401515 and 81230031) and the Fundamental Research Funds for the Central Universities of Ministry of Education of China (grant number: 2042014kf0096). This work was also funded by “351 Talent Project (Luojia Young Scholars)” of Wuhan University.
Disclosure
The authors report no conflicts of interest in this work.
References
Smith AM, Nie SM. Next-generation quantum dots. Nat Biotechnol. 2009;27(8):732–733. | ||
Wegner KD, Hildebrandt N. Quantum dots: bright and versatile in vitro and in vivo fluorescence imaging biosensors. Chem Soc Rev. 2015;44(14):4792–4834. | ||
Lee-Montiel FT, Li P, Imoukhuede PI. Quantum dot multiplexing for the profiling of cellular receptors. Nanoscale. 2015;7(44):18504–18514. | ||
Babu LT, Paira P. Current application of quantum dots (QD) in cancer therapy: a review. Mini Rev Med Chem. Epub 2017 Mar 15:doi:10.2174/1389557517666170315125504. | ||
Lambert AW, Pattabiraman DR, Weinberg RA. Emerging biological principles of metastasis. Cell. 2017;168(4):670–691. | ||
Chen W, Zheng R, Baade PD, et al. Cancer statistics in China, 2015. CA Cancer J Clin. 2016;66(2):115–132. | ||
Hanahan D, Weinberg RA. Hallmarks of cancer: the next generation. Cell. 2011;144(5):646–674. | ||
Bang YJ, Kim YW, Yang HK, et al. Adjuvant capecitabine and oxaliplatin for gastric cancer after D2 gastrectomy (CLASSIC): a phase 3 open-label, randomised controlled trial. Lancet. 2012;379(9813):315–321. | ||
Hartgrink HH, Jansen EPM, van Grieken NCT, van de Velde CJH. Gastric cancer. Lancet. 2009;374(9688):477–490. | ||
Klemm F, Joyce JA. Microenvironmental regulation of therapeutic response in cancer. Trends Cell Biol. 2015;25(4):198–213. | ||
Ilkow CS, Marguerie M, Batenchuk C, et al. Reciprocal cellular cross-talk within the tumor microenvironment promotes oncolytic virus activity. Nat Med. 2015;21(5):530–536. | ||
Erler JT, Bennewith KL, Nicolau M, et al. Lysyl oxidase is essential for hypoxia-induced metastasis. Nature. 2006;440(7088):1222–1226. | ||
Webber J, Yeung V, Clayton A. Extracellular vesicles as modulators of the cancer microenvironment. Semin Cell Dev Biol. 2015;40:27–34. | ||
Koontongkaew S. The tumor microenvironment contribution to development, growth, invasion and metastasis of head and neck squamous cell carcinomas. J Cancer. 2013;4(1):66–83. | ||
Peng CW, Wang LW, Zeng WJ, Yang XJ, Li Y. Evaluation of the staging systems for gastric cancer. J Surg Oncol. 2013;108(2):93–105. | ||
Mlecnik B, Tosolini M, Kirilovsky A, et al. Histopathologic-based prognostic factors of colorectal cancers are associated with the state of the local immune reaction. J Clin Oncol. 2011;29(6):610–618. | ||
Cox TR, Gartland A, Erler JT. Lysyl oxidase, a targetable secreted molecule involved in cancer metastasis. Cancer Res. 2016;76(2):188–192. | ||
Cox TR, Rumney RMH, Schoof EM, et al. The hypoxic cancer secretome induces pre-metastatic bone lesions through lysyl oxidase. Nature. 2015;522(7554):U106–U279. | ||
Erler JT, Bennewith KL, Cox TR, et al. Hypoxia-induced lysyl oxidase is a critical mediator of bone marrow cell recruitment to form the premetastatic niche. Cancer Cell. 2009;15(1):35–44. | ||
Labiano S, Palazon A, Melero I. Immune response regulation in the tumor microenvironment by hypoxia. Semin Oncol. 2015;42(3):378–386. | ||
Faurobert E, Bouin AP, Albiges-Rizo C. Microenvironment, tumor cell plasticity, and cancer. Curr Opin Oncol. 2015;27(1):64–70. | ||
Tredan O, Lacroix-Triki M, Guiu S, et al. Angiogenesis and tumor microenvironment: bevacizumab in the breast cancer model. Target Oncol. 2015;10(2):189–198. | ||
Peng CW, Liu XL, Chen C, et al. Patterns of cancer invasion revealed by QDs-based quantitative multiplexed imaging of tumor microenvironment. Biomaterials. 2011;32(11):2907–2917. | ||
Peng CW, Tian Q, Yang GF, et al. Quantum-dots based simultaneous detection of multiple biomarkers of tumor stromal features to predict clinical outcomes in gastric cancer. Biomaterials. 2012;33(23):5742–5752. | ||
Bilan R, Fleury F, Nabiey I, Sukhanova A. Quantum dot surface chemistry and functionalization for cell targeting and imaging. Bioconjug Chem. 2015;26(4):609–624. | ||
Brazhnik K, Sokolova Z, Baryshnikova M, et al. Quantum dot-based lab-on-a-bead system for multiplexed detection of free and total prostate-specific antigens in clinical human serum samples. Nanomedicine. 2015;11(5):1065–1075. | ||
Cui L, He XP, Chen GR. Recent progress in quantum dot based sensors. RSC Adv. 2015;5(34):26644–26653. | ||
Zhao MX, Zeng EZ. Application of functional quantum dot nanoparticles as fluorescence probes in cell labeling and tumor diagnostic imaging. Nanoscale Res Lett. 2015;10:1–9. | ||
Vu TQ, Lam WY, Hatch EW, Lidke DS. Quantum dots for quantitative imaging: from single molecules to tissue. Cell Tissue Res. 2015;360(1):71–86. | ||
Liu J, Lau SK, Varma VA, et al. Molecular mapping of tumor heterogeneity on clinical tissue specimens with multiplexed quantum dots. ACS Nano. 2010;4(5):2755–2765. | ||
Hu ZL, Qian GQ, Muller S, et al. Biomarker quantification by multiplexed quantum dot technology for predicting lymph node metastasis and prognosis in head and neck cancer. Oncotarget. 2016;7(28):44676–44685. | ||
Wu SM, Liu LF, Li G, et al. Multiplexed detection of lung cancer biomarkers based on quantum dots and microbeads. Talanta. 2016;156:48–54. | ||
Zheng H, Li X, Chen C, et al. Quantum dot-based immunofluorescent imaging and quantitative detection of TOP2A and prognostic value in triple-negative breast cancer. Int J Nanomedicine. 2016;11:5519–5529. | ||
Cox TR, Bird D, Baker AM, et al. LOX-mediated collagen crosslinking is responsible for fibrosis-enhanced metastasis. Cancer Res. 2013;73(6):1721–1732. | ||
Barker HE, Cox TR, Erler JT. The rationale for targeting the LOX family in cancer. Nat Rev Cancer. 2012;12(8):540–552. | ||
Nilsson M, Hagglof C, Hammarsten P, et al. High lysyl oxidase (LOX) in the non-malignant prostate epithelium predicts a poor outcome in prostate cancer patient managed by watchful waiting. PLoS One. 2015;10(10):e0140985. | ||
da Silva R, Uno M, Marie SK, Oba-Shinjo SM. LOX expression and functional analysis in astrocytomas and impact of IDH1 mutation. PLoS One. 2015;10(3):e0119781. | ||
Liu J, Ping W, Zu Y, Sun W. Correlations of lysyl oxidase with MMP2/MMP9 expression and its prognostic value in non-small cell lung cancer. Int J Clin Exp Pathol. 2014;7(9):6040–6047. | ||
Zhang Q, Jin XS, Yang ZY, et al. Upregulated expression of LOX is a novel independent prognostic marker of worse outcome in gastric cancer patients after curative surgery. Oncol Lett. 2013;5(3):896–902. | ||
Sung FL, Cui Y, Hui EP, et al. Silencing of hypoxia-inducible tumor suppressor lysyl oxidase gene by promoter methylation activates carbonic anhydrase IX in nasopharyngeal carcinoma. Am J Cancer Res. 2014;4(6):789–800. | ||
Woznick AR, Braddock AL, Dulai M, et al. Lysyl oxidase expression in bronchogenic carcinoma. Am J Surg. 2005;189(3):297–301. | ||
Wu M, Min C, Wang X, et al. Repression of BCL2 by the tumor suppressor activity of the lysyl oxidase propeptide inhibits transformed phenotype of lung and pancreatic cancer cells. Cancer Res. 2007;67(13):6278–6285. | ||
Erez N. Cancer opening LOX to metastasis. Nature. 2015;522(7554):41–42. | ||
Boufraqech M, Zhang LS, Nilubol N, et al. Lysyl oxidase (LOX) transcriptionally regulates SNAI2 expression and TIMP4 secretion in human cancers. Clin Cancer Res. 2016;22(17):4491–4504. | ||
Kasashima H, Yashiro M, Kinoshita H, et al. Lysyl oxidase is associated with the epithelial-mesenchymal transition of gastric cancer cells in hypoxia. Gastric Cancer. 2016;19(2):431–442. | ||
Caley MP, King H, Shah N, et al. Tumor-associated Endo180 requires stromal-derived LOX to promote metastatic prostate cancer cell migration on human ECM surfaces. Clin Exp Metastasis. 2016;33(2):151–165. | ||
Oh HK, Sung WJ, Jung JW, Jeong YJ, Park SH. Lysyl oxidase (LOX) contribute to formation of intratumoural fibrotic focus (FF) by inflammation in invasive breast cancer. Virchows Archiv. 2016;469:S47–S48. | ||
Zheng Y, Wang XM, Wang HD, Yan W, Zhang Q, Chang X. Expression of the lysyl oxidase propeptide in hepatocellular carcinoma and its clinical relevance. Oncol Rep. 2014;31(4):1669–1676. | ||
Gao YJ, Xiao QA, Ma HM, et al. LKB1 inhibits lung cancer progression through lysyl oxidase and extracellular matrix remodeling. Proc Natl Acad Sci U S A. 2010;107(44):18892–18897. | ||
Semenza GL. Cancer-stromal cell interactions mediated by hypoxia-inducible factors promote angiogenesis, lymphangiogenesis, and metastasis. Oncogene. 2013;32(35):4057–4063. | ||
Wong CCL, Zhang HF, Gilkes DM, et al. Inhibitors of hypoxia-inducible factor 1 block breast cancer metastatic niche formation and lung metastasis. J Mol Med. 2012;90(7):803–815. |
 © 2017 The Author(s). This work is published and licensed by Dove Medical Press Limited. The full terms of this license are available at https://www.dovepress.com/terms.php and incorporate the Creative Commons Attribution - Non Commercial (unported, v3.0) License.
By accessing the work you hereby accept the Terms. Non-commercial uses of the work are permitted without any further permission from Dove Medical Press Limited, provided the work is properly attributed. For permission for commercial use of this work, please see paragraphs 4.2 and 5 of our Terms.
© 2017 The Author(s). This work is published and licensed by Dove Medical Press Limited. The full terms of this license are available at https://www.dovepress.com/terms.php and incorporate the Creative Commons Attribution - Non Commercial (unported, v3.0) License.
By accessing the work you hereby accept the Terms. Non-commercial uses of the work are permitted without any further permission from Dove Medical Press Limited, provided the work is properly attributed. For permission for commercial use of this work, please see paragraphs 4.2 and 5 of our Terms.