")
Back to Journals » Journal of Inflammation Research » Volume 14
LPS-Induced Inflammation Affects Midazolam Clearance in Juvenile Mice in an Age-Dependent Manner
Authors Zheng Y, Ye PP, Zhou Y, Wu SY, Liu XT, Du B, Tang BH, Kan M, Nie AQ, Yin R, Wang M, Hao GX, Song LL, Yang XM, Huang X, Su LQ, Wang WQ, van den Anker J, Zhao W
Received 25 May 2021
Accepted for publication 23 July 2021
Published 3 August 2021 Volume 2021:14 Pages 3697—3706
DOI https://doi.org/10.2147/JIR.S321492
Checked for plagiarism Yes
Review by Single anonymous peer review
Peer reviewer comments 2
Editor who approved publication: Professor Ning Quan
Yi Zheng,1 Pan-Pan Ye,2 Yue Zhou,1 Su-Ying Wu,3 Xi-Ting Liu,1 Bin Du,1 Bo-Hao Tang,1 Min Kan,1 Ai-Qing Nie,1 Rui Yin,1 Meng Wang,1 Guo-Xiang Hao,1 Lin-Lin Song,2 Xin-Mei Yang,2 Xin Huang,2 Le-Qun Su,2 Wen-Qi Wang,2 John van den Anker,4– 6 Wei Zhao1,2
1Department of Clinical Pharmacy, School of Pharmaceutical Sciences, Cheeloo College of Medicine, Shandong University, Jinan, 250012, People’s Republic of China; 2Department of Clinical Pharmacy, The First Affiliated Hospital of Shandong First Medical University & Shandong Provincial Qianfoshan Hospital, Shandong Engineering and Technology Research Center for Pediatric Drug Development, Shandong Medicine and Health Key Laboratory of Clinical Pharmacy, Jinan, 250014, People’s Republic of China; 3Shandong University of Traditional Chinese Medicine, Jinan, People’s Republic of China; 4Division of Clinical Pharmacology, Children’s National Hospital, Washington, DC, USA; 5Departments of Pediatrics, Pharmacology & Physiology, Genomics & Precision Medicine, George Washington University, School of Medicine and Health Sciences, Washington, DC, USA; 6Department of Paediatric Pharmacology and Pharmacometrics, University Children’s Hospital Basel, University of Basel, Basel, Switzerland
Correspondence: Wei Zhao
Department of Clinical Pharmacy, School of Pharmaceutical Sciences, Cheeloo College of Medicine, Shandong University, Jinan, 250012, People’s Republic of China
Email [email protected]
Purpose: Inflammation has a significant impact on CYP3A activity. We hypothesized that this effect might be age dependent. Our objective was to conduct a population pharmacokinetic study of midazolam in mice at different developmental stages with varying degrees of inflammation to verify our hypothesis.
Methods: Different doses (2 and 5 mg/kg) of lipopolysaccharide (LPS) were used to induce different degrees of systemic inflammation in Swiss mice (postnatal age 9– 42 days, n = 220). The CYP3A substrate midazolam was selected as the pharmacological probe to study CYP3A activity. Postnatal age, current body weight, serum amyloid A protein 1 (SAA1) levels and LPS doses were collected as covariates to perform a population pharmacokinetic analysis using NONMEM 7.2.
Results: A population pharmacokinetic model of midazolam in juvenile and adult mice was established. Postnatal age and current body weight were the most significant and positive covariates for clearance and volume of distribution. LPS dosage was the most significant and negative covariate for clearance. LPS dosage can significantly reduce the clearance of midazolam by 21.8% and 38.7% with 2 mg/kg and 5 mg/kg, respectively. Moreover, the magnitude of the reduction was higher in mice with advancing postnatal age.
Conclusion: Both inflammation and ontogeny have an essential role in CYP3A activity in mice. The effect of LPS-induced systemic inflammation on midazolam clearance in mice is dependent on postnatal age.
Keywords: CYP3A activity, ontogeny, inflammation, pharmacokinetic, mice
Introduction
CYP3A is the most important member of the CYP450 family in both the liver and intestine as it metabolizes approximately 50% of currently labelled drugs.1 CYP3A metabolic activity can be influenced simultaneously by various factors, including age, sex, disease, gene polymorphism, and drug–drug interactions.2
Inflammation is a universal and variable clinical symptom of many diseases. Several studies have shown that inflammation inhibits the metabolic activity of CYP3A, utilizing clearance (CL) of midazolam as a substrate in humans.3,4 For children, CYP3A activity also changes significantly with age.5–7
The concurrent effects of both inflammation and ontogeny on CYP3A activity in humans still show contradictory results. Brussee et al8 and Vet et al9 developed a PK model which suggests that the CL of midazolam decreases along with the increases of C-reactive protein concentrations in critically ill children aged 1–18 years. Ince et al4 showed that critical illness is a major determinant of midazolam clearance in children aged 1 month to 17 years. However, Altamimi10 integrated multiple studies and reevaluated the covariate analysis, and the result indicated that critical illness might not be a statistically significant predictor of midazolam clearance after adjusting for age and body weight, and there was no significant difference between the variation in critically ill and non-critically ill children aged 2–11 years. In critically ill adult patients, serum albumin levels were more correlated with midazolam clearance than C-reactive protein level, which indicated that impaired liver function has a more significant effect on CYP3A activity in adults than inflammation itself.3 Moreover, the clearance of midazolam seems to decrease faster in adults than that in children along with the C-reactive protein level increases, but it is difficult to determine with certainty due to the lack of data of older children and adults.9
We hypothesized that inflammation affects midazolam clearance in children in an age-dependent manner. To verify this hypothesis, we conducted a developmental population pharmacokinetic study of midazolam in maturing mice with different degrees of inflammation.
Materials and Methods
The test procedures are summarized in Figure 1.
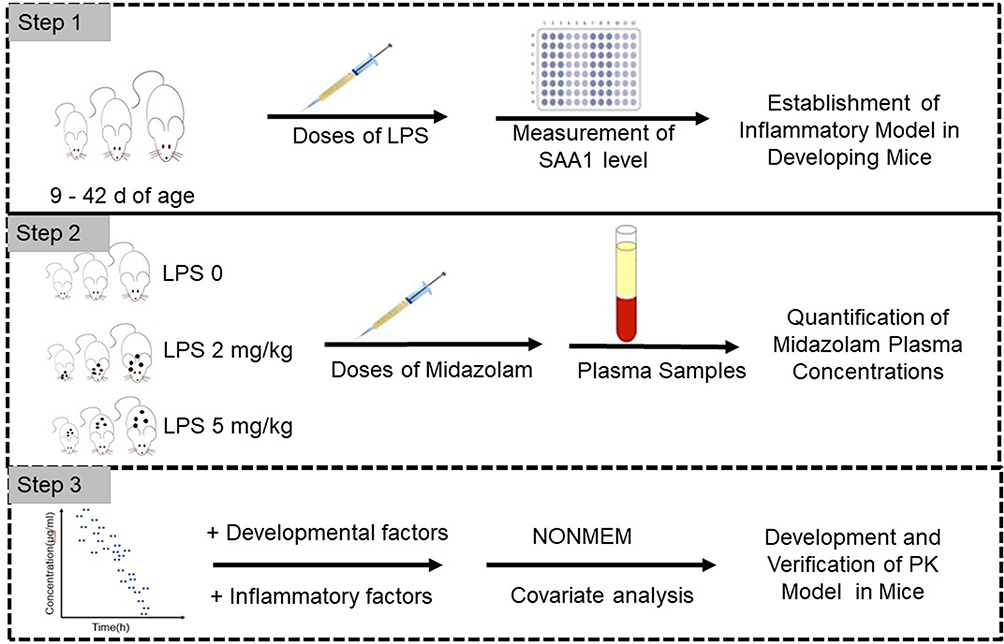 |
Figure 1 Test flow chart. |
Inflammatory Mouse Model
220 Swiss mice, born with a gestational age of 19–21 days, were placed in a clean room with a 12-h light–dark cycle. Mice (n = 184) who aged for 9–28 days were not differentiated in gender, whereas mice (n = 36) who aged for 35–42 days were 50% males and 50% females. Approval for the study was granted by the Laboratory Animal Ethical and Welfare Committee (AEWC) of Shandong University Cheeloo College of Medicine (ref. 21055). All experiments were performed in accordance with the principles and guidelines of AEWC. They were divided into two experimental groups and a control group after weighing. The two experimental groups were intraperitoneally injected with 2 mg/kg and 5 mg/kg LPS solution (E. coli 055:b5, L2880, Sigma-Aldrich, USA), respectively, to induce different degrees of systemic inflammation, and the control group was intraperitoneally injected with an amount of saline equal to the volume of LPS solution used in the experimental groups. SAA1 levels of mice and current body weight (CW) were measured, at 20–23 h after the LPS injection based on a previous study11 and our own preliminary analysis, to determine whether a systemic inflammatory response was induced. SAA1 levels were measured by ELISA (Cusabio, CSB-EL020656MO, Wuhan, China) in plasma samples.
Pharmacokinetic Study
All mice were given 0.2 mg/kg of midazolam subcutaneously. The volume of midazolam that was injected was 50 µL for mice ≤18 d and 100 µL for mice >18 d. Blood samples were collected at 5, 15, 45, 120, and 180 min after midazolam administration. In order to collect enough samples and increase the performance of the PK modeling in mice, 3 mice per sampling time per age were used. Samples were collected from the arteria cervicalis of 9–12 days old mice and collected from tail tip and eyeball of 15–42 days old mice. Three samples were combined for mice aged 9 d and 12 d because the volume of one sample was not enough for concentration detection. Samples were centrifuged and stored frozen at −80°C before analysis.
Quantitation of Midazolam Plasma Concentration
Midazolam samples were analysed by LC-MS with an ODS-4 column (Shimadzu, Japan). First, 50 µL of sample, 5 µL of diazepam (1 µg/mL), and 120 µL of acetonitrile were vortex-mixed at high speed for 1 min and centrifuged at 12,000 rpm for 10 min. Then, 5 µL of supernatant was injected onto the LC-MS system, and analysis was carried out at 40°C. Analytes were separated using the aqueous mobile phase A (0.1% formic acid) and the organic phase B (acetonitrile) with a flow rate of 0.3 mL/min. The initial conditions for the gradient consisted of 30% solvent B, which was increased to 95% at 3 min and returned to 30% after 1 min. Single-quadrupole MS was used with a single-ion monitor in the positive ion mode. Mass transitions for midazolam and diazepam were 326.05 and 285.05, respectively.
Calculation of PK Parameters in Mice
The nonlinear mixed-effects modeling program NONMEM V7.2 (Icon Development Solutions, Ellicott City, MD, USA) and the first-order conditional estimation method with interaction options were used to analyze and estimate the PK parameters. An exponential model was used to estimate the inter-individual variability of the PK parameters; it was expressed as follows:

where  and
and  are the parameter value of the ith subject and the typical parameter value in the population, respectively, and
  is the variability between subjects (assumed to obey a normal distribution with a mean value of 0 and variance of ω2).
A forward and backward selection was used to analyze covariates. The continuous covariates evaluated were postnatal age (PNA), CW and SAA1 level. Categorical covariates included LPS doses. The effect of each variable was evaluated by stepwise covariate modelling12 and the likelihood ratio test. In the first step of building the covariate model, a covariate was included if the objective function value (OFV) obtained from the basic model was significantly reduced (decrease >3.84, p < 0.05, χ2 distribution with one degree of freedom). Then, all significant covariates were added to a “full” model at the same time. Subsequently, each covariate was removed independently from the full model. If the increase of OFV was >6.635 (p < 0.01, χ2 distribution), the covariates were considered to be significantly correlated with PK parameters and were therefore included in the final model.13
Graphical and statistical criteria were used for model validation. Goodness-of-fit plots, including observed concentration versus individual prediction (IPRED) and population prediction (PRED) and conditional weighted residuals (CWRES) versus time and population prediction (PRED), were used initially for diagnostic purposes.14 Then, the means of a nonparametric bootstrap with re-sampling and replacement were used to assess the stability and performance of the final model. Re-sampling was repeated 500 times in an automated fashion using PsN (v2.30),15 and the values of estimated parameters from the bootstrap procedure and the original data set were compared. The final model was also evaluated graphically and statistically by normalized prediction distribution errors (NPDE).16 A total of 1000 datasets were simulated using the final population model parameters in the NPDE R package (v1.2).17 NPDE results were summarised graphically by the defaults provided in R: (i) QQ-plot of the NPDE and (ii) histogram of the NPDE. The NPDE is expected to follow the N (0, 1) distribution.
Results
A total of 354 plasma samples (0.22–79.16 ng/mL) were available from 220 mice. The SAA1 level in plasma was measured. As shown in Table 1, after 20 h of LPS administration, the SAA1 level increased with the higher dose of LPS (P < 0.01), whereas the body weight of the mice in the experimental group decreased significantly (P < 0.01) (Table 1). This indicated that the inflammatory model of mice was constructed successfully after LPS administration for 20 h.
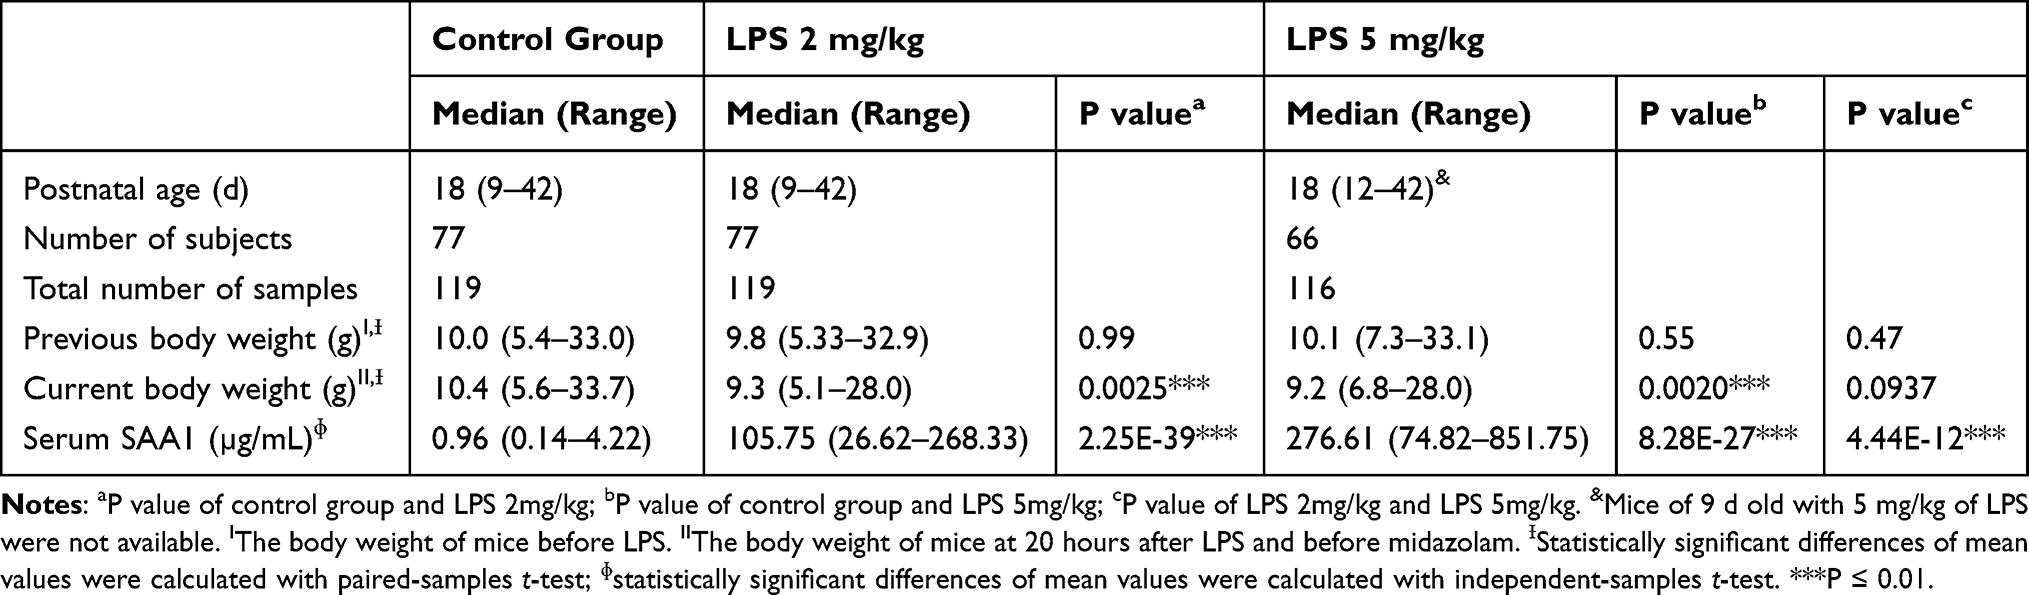 |
Table 1 Data Comparison Between Experimental and Control Groups of Mice |
Model Development and Covariate Analysis
A one-compartment model with first-order elimination fitted the data. Interindividual variability of CL and volume of distribution (Vd) were best described by an exponential model. Residual variability was also best described by an exponential model.
The covariate analysis identified that PK parameters were significantly impacted by PNA, CW, and LPS dose. The relationship between PNA and PK parameters (CL and Vd) was investigated using a PNA-based sigmoid hyperbolic model which was defined as FPNA with the following equations:
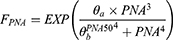
Where  is the coefficient and
  is the PNA in days at which half-maximal PK value is obtained.
In the process of covariate analysis, CW caused a significant drop in the OFV of 148.9 points for CL and Vd (P < 0.01), and FPNA-Vd caused a significant drop in the OFV of 291.6 points for CL and Vd (P < 0.01). The model was further improved by introducing the LPS dose as the third covariate of CL (∆OFV 6.8 points, P < 0.01). The correlation with CL of SAA1 level was worse than that of LPS dosage (∆OFV 2.1 point, P > 0.05). A detailed presentation of the covariate analysis results is presented in Table 2. CW and FPNA-CL explained about 62.7% and LPS dose explained 1.4% of midazolam CL variability in the final model.
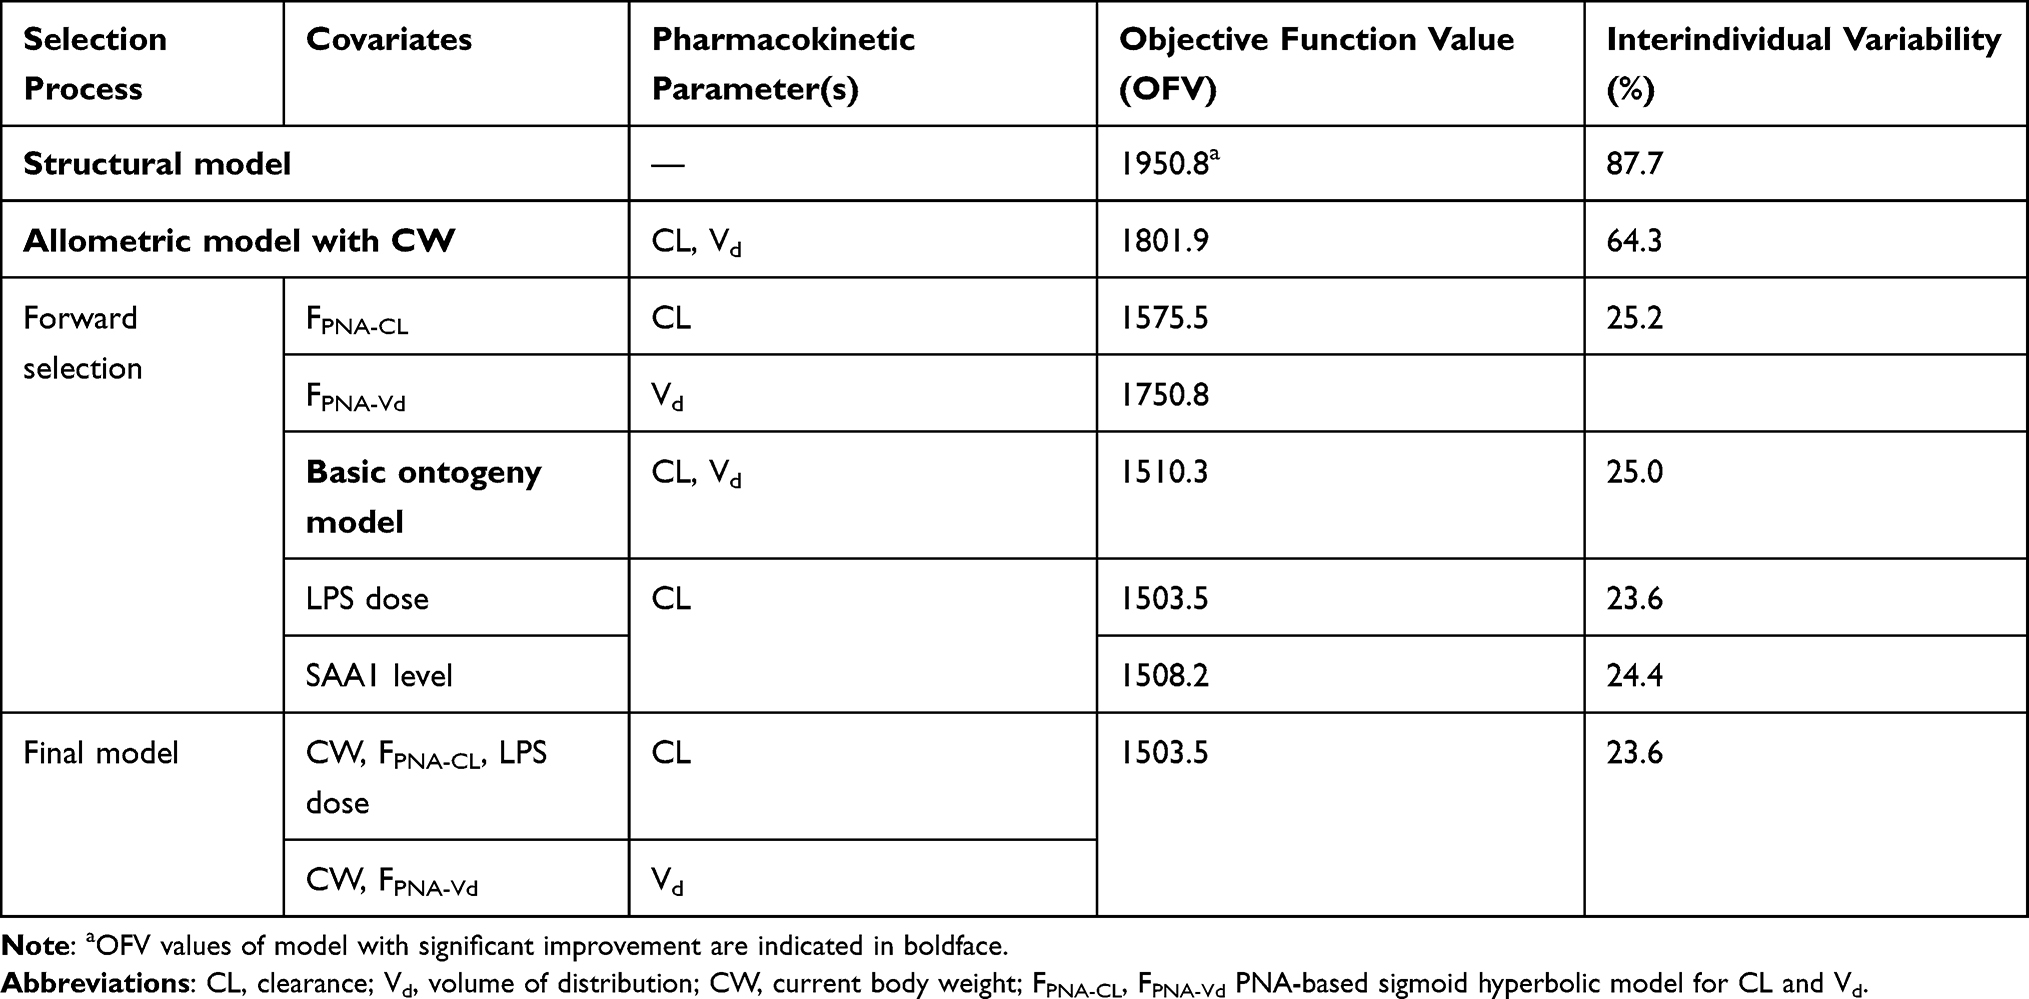 |
Table 2 Covariate Analysis |
Final Model
Table 3 summarizes parameter estimates for the final PK model. The medians (ranges) of estimated CL and Vd were 0.124 (0.006 to 0.263) L/h and 0.093 (0.009 to 0.217) L, respectively. CL of midazolam first increased and then decreased with the PNA of mice (Figure 2A), which was related to the ontogeny of CYP3A activity. The CL peaked at about 28–35 d without the impaction of LPS. The medians (ranges) of estimated CL for 3 LPS dosages were 0.156 (0.007 to 0.263) L/h, 0.124 (0.006 to 0.221) L/h and 0.096 (0.013 to 0.201) L/h, respectively. LPS dosage can significantly reduce CL of midazolam by 21.8% and 38.7% with 2 mg/kg and 5 mg/kg, respectively (P < 0.01) (Figure 2B). However, a comparison of the data dispersion and significant difference between the two LPS dose groups showed that different doses of LPS have different effects on CL in mice of different ages (Figure 2C). Compared with the control group, 2 mg/kg of LPS caused no significant change for CL in younger mice (P > 0.05) but caused more significant decrease for CL in older mice (P < 0.05). When LPS dose was increased to 5 mg/kg, significant change for CL in younger mice also appeared (P < 0.05). In summary, LPS had less effect on the CL of midazolam on juvenile mice and more effect on older mice. Because PNA was better than CW in the correlation with CL, and CW was related to PNA, we did not compare the weight-normalized CL.
 |
Table 3 Parameter Estimates of the Final Model |
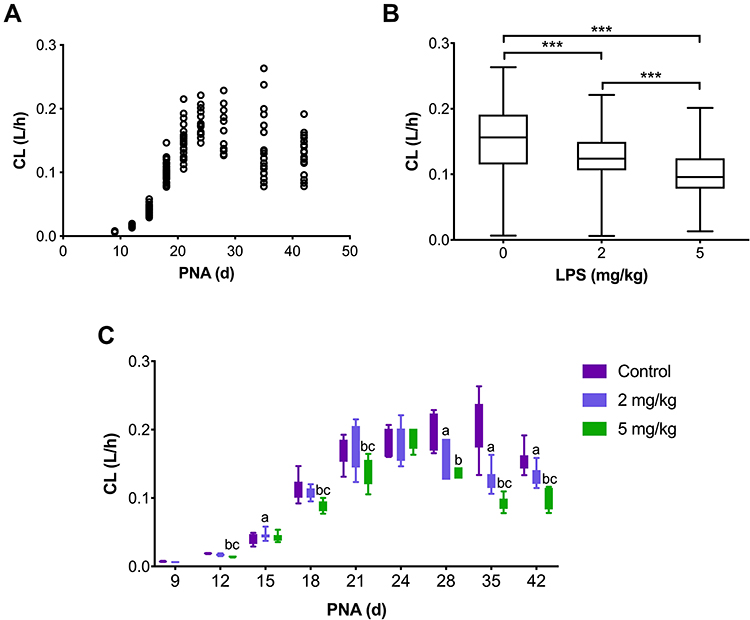 |
Figure 2 Comparison of CL between experimental and control groups of mice. (A) Scatter diagram of CL of midazolam at different LPS doses. (B) Boxplot of the individual predicted CL values for each individual in the study versus dosage of LPS after removing the impact of CW and PNA. ***Statistically significant differences in mean values between control, 2 mg/kg LPS, and 5 mg/kg LPS groups (p < 0.01). (C) Bar chart of CL of midazolam at different LPS doses. Abbreviations: CL, clearance; PNA, postnatal age in days. Notes: aStatistically significant differences in mean values between 2 mg/kg LPS and control groups (p < 0.05); bstatistically significant differences in mean values between 5 mg/kg LPS and control groups (p < 0.05); cstatistically significant differences in mean values between 5 mg/kg LPS and 2 mg/kg LPS groups (p < 0.05). All statistically significant differences in mean values were calculated with independent samples t-test. |
The formula structure of the factor of PNA on Vd was same to that on CL, indicating that Vd also showed a trend of first increasing and then decreasing with the PNA of mice. LPS had no significant effect on Vd.
Model Diagnosis
Median parameter values were in agreement with the model estimations and standard errors (Table 3). The mean parameters estimated by the bootstrap program (500 iterations) are in good agreement with the corresponding values in the final population model (Table 3), indicating that the estimated values of population PK parameters in the final population model are accurate and the model was stable. In addition, model diagnosis showed that the final models were acceptable (Figure 3A–F). The mean and variance of NPDE were 0.0057 (Wilcoxon signed rank test p = 0.795) and 1.11 (Fisher variance test p = 0.150), respectively.
 |
Figure 3 Routine diagnostic goodness-of-fit plots of midazolam: (A) population predicted (PRED) versus observed concentrations (DV); (B) individual predicted (IPRED) versus observed concentrations (DV); (C) conditional weighted residuals(CWRES) versus time; (D) conditional weighted residuals (CWRES) versus population-predicted concentrations; (E) QQ-plot of the distribution of the normalized prediction distribution errors (NPDE) versus the theoretical N (0,1) distribution; (F) histogram of the NPDE distribution with a density of the standard Gaussian distribution overlaid. |
Discussion
This is the first time that a PK model of midazolam in mice, maturing from juveniles to adults, has been constructed with inflammation as a covariate. We estimated the PK parameters and covariates of midazolam in mice. A one-compartment model with first-order elimination with FPNA, CW and LPS dosage had the best fit with the PK parameters of midazolam. CL had a significant positive correlation with CW and FPNA-CL (P < 0.01) and negative correlation with LPS dosage (P < 0.01). Vd had a significant positive correlation with CW and FPNA-Vd (P < 0.01).
At present, no unique formula can describe liver CYP3A maturation. The sigmoid hyperbolic model was the general model to describe the ontogeny of the kidney.18 But it cannot describe the ontogeny of CYP3A very well, especially in infants.19 We tested the traditional sigmoid hyperbolic model in our data and found that it was not suitable for the ontogeny of liver CYP3A activity in mice neither (the final OFV= 1549.0) because the liver CYP3A activity does not peak at the adult stage. In humans, the metabolic activity of CYP3A began to increase rapidly in children aged 1 month and then declined slowly until it stabilizes at the adult level after reaching its peak concentration at about 1 year.5–7 In mice, although the ontogeny of CYP3A activity is still unclear, the mRNA expression of the CYP3A family and the level of liver transaminase increased rapidly in mice aged 1–3 wks and then decreased slowly to the adult level.20,21 Based on the development trends of mRNA expression of the CYP3A family and the level of liver transaminase, we developed a PNA-based sigmoid hyperbolic model with the formula of FPNA-CL for the liver CYP3A maturation in mice as the dependent variable. It should be noted that  no longer represents
 after introducing FPNA-CL. Our final model was successful, indicating that the ontogeny trend of CYP3A activity in mice and humans is similar.
Vd of midazolam also showed a trend of first increasing and then decreasing with the PNA of mice. This trend is not only affected by body weight but also affected by body composition including body fat and plasma protein content.22–24 The total protein content of the newborn is about 86% of the adult level, reaching the adult level in infancy.23,24 The trend of fat content in human body is complex. The weight of adipose tissue is about 10–15% of body weight at birth of newborn, increases to 28–30% at the end of infancy, and then decreases to 10–15% at the end of adolescence.25–27 This trend is similar to that of liver CYP3A maturation. The above changes in body composition may lead to a greater volume of drug distribution in children than in adults. Ginsberg compared the Vd of 22 drugs in children and adults. The Vd of these drugs in all age groups of children was larger than that in adults.28 The decrease of adipose tissue may be related to the increase in activity ability and muscle content of children after one year old.26 When the mice grew to 3 wks, they were weaned and fed in separate cages. The activity space, activity ability and muscle content increased. In conclusion, the life pattern of mice is similar to that of human beings, and the change of fat content in mice may also be similar. Therefore, the Vd of midazolam in mice is similar to the mature change of CYP3A in liver.
Our results showed that LPS-induced system inflammation reduced midazolam CL in juvenile mice (Figure 2B). Our results are similar to those of previous studies on the reduction of CL of midazolam in children by inflammation,4,8,9 which suggests that inflammation has the same inhibitory effect on CYP3A activity in mice as in humans.
We further analyzed our hypothesis that the reduction of midazolam clearance in juvenile mice caused by LPS-induced systemic inflammation is age dependent. The results showed that the effects of LPS-induced systemic inflammation on CYP3A activity were weaker in younger mice. We suggest that these age-dependent changes may be related to the ontogeny of immune function in juvenile mice. LPS can induce immune cells to produce tumor necrosis factor-α (TNF-α), which can damage liver cells and tissues, and even liver function.29 TNF-α is secreted by monocytes, macrophages, B cells, and T cells. Nakagaki et al21 showed that the immune cells in newborn mice were mainly composed of myeloid cells and immature B cells, and the proportion of lymphoid cells rapidly increased at about 1–3 wk and then gradually increased to adult levels. Therefore, LPS stimulation may produce a small amount of TNF-α due to the immature immune system in juvenile mice with PNA ≤24 d, with less damage to the liver, thus producing the characterization that CYP3A activity of mice is not sensitive to LPS. After the mouse immune system matures, a large amount of TNF-α was produced by LPS stimulation. Liver cells are severely damaged, and CYP3A activity is significantly decreased. Jeljeli et al30 also found that TNF-α levels stimulated by phytohemagglutinin were lower in newborns and then gradually increased to adult levels. Our prediction of TNF-α levels in mice is the same as that in humans.
Our study also has a limitation that we failed to collect samples from 9-d-old mice treated with 5 mg/kg of LPS because they had poor tolerance to LPS, with high mortality of 25% for 2 mg/kg in 9-d-old mice and 16.7% for 5 mg/kg in 12-d-old mice. We proposed FPNA-CL for liver CYP3A maturation and estimated the effects of FPNA-CL and LPS dosages on CYP3A activity in mice. The construction of the PK model was successful, but more data are needed to verify its accuracy and stability. Our hypothesis that the reduction of midazolam clearance in juvenile mice caused by LPS-induced systemic inflammation is age dependent was proven. We further hypothesized that immature immune cells in juvenile mice might be related to less liver damage after LPS induction, and further verification is needed to support our hypothesis.
Conclusion
A population developmental pharmacokinetic study of midazolam in maturing mice with different degrees of inflammation was conducted. Inflammation and ontogeny had concurrent effects on CYP3A activity in juvenile mice. LPS-induced system inflammation can strongly inhibit mice CYP3A activity as shown by a decreased CL of midazolam, and the inhibition is both age dependent and LPS-dosage dependent in juvenile mice. Our study suggests that the clinical treatment of children with inflammation should take into account that the inhibition of liver metabolism due to inflammatory stimulation may be weaker in children than in adults. Our results also provided a preliminary empirical basis for the influence of ontogeny and inflammation on liver metabolism in mice.
Funding
This study was supported by the Key Technologies R & D Program of Shandong Province (Grant No.2018GSF118053), Qilu Young Scholars Program of Shandong University, National Science and Technology Major Project for Major New Drugs Innovation and Development (2017ZX09304029-002) and Young Taishan Scholars Program of Shandong Province.
Disclosure
The authors report no conflicts of interest in this work.
References
1. de Wildt SN, Kearns GL, Leeder JS, et al. Cytochrome P450 3A: ontogeny and drug disposition. Clin Pharmacokinet. 1999;37(6):485–505. doi:10.2165/00003088-199937060-00004
2. Zanger UM, Schwab M. Cytochrome P450 enzymes in drug metabolism: regulation of gene expression, enzyme activities, and impact of genetic variation. Pharmacol Ther. 2013;138(1):103–141. doi:10.1016/j.pharmthera.2012.12.007
3. Franken LG, Masman AD, de Winter B, et al. Hypoalbuminaemia and decreased midazolam clearance in terminally ill adult patients, an inflammatory effect? Br J Clin Pharmacol. 2017;83(8):1701–1712. doi:10.1111/bcp.13259
4. Ince I, de Wildt SN, Peeters MY, et al. Critical illness is a major determinant of midazolam clearance in children aged 1 month to 17 years. Ther Drug Monit. 2012;34(4):381–389. doi:10.1097/FTD.0b013e31825a4c3a
5. Hines RN. Ontogeny of human hepatic cytochromes P450. J Biochem Mol Toxicol. 2007;21(4):169–175. doi:10.1002/jbt.20179
6. Kearns GL. Pharmacogenetics and development: are infants and children at increased risk for adverse outcomes? Curr Opin Pediatr. 1995;7(2):220–233. doi:10.1097/00008480-199504000-00018
7. Schuetz JD, Beach DL, Guzelian PS. Selective expression of cytochrome P450 CYP3A mRNAs in embryonic and adult human liver. Pharmacogenetics. 1994;4(1):11–20. doi:10.1097/00008571-199402000-00002
8. Brussee JM, Vet NJ, Krekels E, et al. Predicting CYP3A-mediated midazolam metabolism in critically ill neonates, infants, children and adults with inflammation and organ failure. Br J Clin Pharmacol. 2018;84(2):358–368. doi:10.1111/bcp.13459
9. Vet NJ, Brussee JM, de Hoog M, et al. Inflammation and organ failure severely affect midazolam clearance in critically ill children. Am J Respir Crit Care Med. 2016;194(1):58–66. doi:10.1164/rccm.201510-2114OC
10. Altamimi MI. Variation in Clearance and Invasiveness of Pharmacokinetic Studies in Children[Dissertation]. University of Nottingham; 2016.
11. Ikeda M, Hamada K, Sumitomo N, et al. Serum amyloid A, cytokines, and corticosterone responses in germfree and conventional mice after lipopolysaccharide injection. Biosci Biotechnol Biochem. 1999;63(6):1006–1010. doi:10.1271/bbb.63.1006
12. De Cock RF, Piana C, Krekels EH, et al. The role of population PK-PD modelling in paediatric clinical research. Eur J Clin Pharmacol. 2011;67(Suppl 1):5–16. doi:10.1007/s00228-009-0782-9
13. Zhao W, Le Guellec C, Benjamin DK, et al. First dose in neonates: are juvenile mice, adults and in vitro-in silico data predictive of neonatal pharmacokinetics of fluconazole. Clin Pharmacokinet. 2014;53(11):1005–1018. doi:10.1007/s40262-014-0169-7
14. Lavy E, Ziv G, Shem-Tov M, Glickman A, Dey A. Pharmacokinetics of clindamycin HCl administered intravenously, intramuscularly and subcutaneously to dogs. J Vet Pharmacol Ther. 1999;22(4):261–265. doi:10.1046/j.1365-2885.1999.00221.x
15. Lindbom L, Ribbing J, Jonsson EN. Perl-speaks-NONMEM (PsN) – a Perl module for NONMEM related programming. Comput Methods Programs Biomed. 2004;75(2):85–94. doi:10.1016/j.cmpb.2003.11.003
16. Brendel K, Comets E, Laffont C, et al. Metrics for external model evaluation with an application to the population pharmacokinetics of gliclazide. Pharm Res. 2006;23(9):2036–2049. doi:10.1007/s11095-006-9067-5
17. Comets E, Brendel K, Mentré F. Computing normalised prediction distribution errors to evaluate nonlinear mixed-effect models: the npde add-on package for R. Comput Methods Programs Biomed. 2008;90(2):154–166. doi:10.1016/j.cmpb.2007.12.002
18. Anderson BJ, Holford NH. Mechanistic basis of using body size and maturation to predict clearance in humans. Drug Metab Pharmacokinet. 2009;24(1):25–36. doi:10.2133/dmpk.24.25
19. Anderson BJ, Larsson P. A maturation model for midazolam clearance. Paediatr Anaesth. 2011;21(3):302–308. doi:10.1111/j.1460-9592.2010.03364.x
20. Cui JY, Renaud HJ, Klaassen CD. Ontogeny of novel cytochrome P450 gene isoforms during postnatal liver maturation in mice. Drug Metabol Disposit. 2012;40(6):1226–1237. doi:10.1124/dmd.111.042697
21. Nakagaki BN, Mafra K, de Carvalho É, et al. Immune and metabolic shifts during neonatal development reprogram liver identity and function. J Hepatol. 2018;69(6):1294–1307. doi:10.1016/j.jhep.2018.08.018
22. Allegaert K, Mian P, van den Anker JN. Developmental pharmacokinetics in neonates: maturational changes and beyond. Curr Pharm Des. 2017;23(38):5769–5778. doi:10.2174/1381612823666170926121124
23. Batchelor HK, Marriott JF. Paediatric pharmacokinetics: key considerations. Br J Clin Pharmacol. 2015;79(3):395–404. doi:10.1111/bcp.12267
24. van den Anker J, Reed MD, Allegaert K, et al. Developmental changes in pharmacokinetics and pharmacodynamics. J Clin Pharmacol. 2018;58(Suppl 10):S10–S25. doi:10.1002/jcph.1284
25. Fomon SJ, Haschke F, Ziegler EE, et al. Body composition of reference children from birth to age 10 years. Am J Clin Nutr. 1982;35(5):1169–1175. doi:10.1093/ajcn/35.5.1169
26. Friis-Hansen B. Body composition during growth. In vivo measurements and biochemical data correlated to differential anatomical growth. Pediatrics. 1971;47(1):
27. Hawkes CP, Hourihane JO, Kenny LC, et al. Gender- and gestational age-specific body fat percentage at birth. Pediatrics. 2011;128(3):e645–e6451. doi:10.1542/peds.2010-3856
28. Ginsberg G, Hattis D, Sonawane B, et al. Evaluation of child/adult pharmacokinetic differences from a database derived from the therapeutic drug literature. Toxicol Sci. 2002;66(2):185–200. doi:10.1093/toxsci/66.2.185
29. Yang P, Zhou W, Li C, et al. Kupffer-cell-expressed transmembrane TNF-α is a major contributor to lipopolysaccharide and D-galactosamine-induced liver injury. Cell Tissue Res. 2016;363(2):371–383. doi:10.1007/s00441-015-2252-2
30. Jeljeli M, Guérin-El Khourouj V, Pédron B, et al. Ontogeny of cytokine responses to PHA from birth to adulthood. Pediatr Res. 2019;86(1):63–70. doi:10.1038/s41390-019-0383-y
 © 2021 The Author(s). This work is published and licensed by Dove Medical Press Limited. The full terms of this license are available at https://www.dovepress.com/terms.php and incorporate the Creative Commons Attribution - Non Commercial (unported, v3.0) License.
By accessing the work you hereby accept the Terms. Non-commercial uses of the work are permitted without any further permission from Dove Medical Press Limited, provided the work is properly attributed. For permission for commercial use of this work, please see paragraphs 4.2 and 5 of our Terms.
© 2021 The Author(s). This work is published and licensed by Dove Medical Press Limited. The full terms of this license are available at https://www.dovepress.com/terms.php and incorporate the Creative Commons Attribution - Non Commercial (unported, v3.0) License.
By accessing the work you hereby accept the Terms. Non-commercial uses of the work are permitted without any further permission from Dove Medical Press Limited, provided the work is properly attributed. For permission for commercial use of this work, please see paragraphs 4.2 and 5 of our Terms.