")
Back to Journals » Diabetes, Metabolic Syndrome and Obesity » Volume 13
Low-Magnitude High-Frequency Vibration Decreases Body Weight Gain and Increases Muscle Strength by Enhancing the p38 and AMPK Pathways in db/db Mice
Authors Ren Z , Lan Q, Chen Y , Chan YWJ, Mahady GB, Lee SMY
Received 26 August 2019
Accepted for publication 10 January 2020
Published 1 April 2020 Volume 2020:13 Pages 979—989
DOI https://doi.org/10.2147/DMSO.S228674
Checked for plagiarism Yes
Review by Single anonymous peer review
Peer reviewer comments 4
Editor who approved publication: Prof. Dr. Antonio Brunetti
Zhitao Ren,1 Qingping Lan,1 Yan Chen,1 Yuet Wa Judy Chan,1 Gail B Mahady,2 Simon Ming-Yuen Lee1
1State Key Laboratory of Quality Research in Chinese Medicine and Institute of Chinese Medical Sciences, University of Macau, Macau, People’s Republic of China; 2Department of Pharmacy Practice, College of Pharmacy, PAHO/WHO Collaborating Center for Traditional Medicine, University of Illinois at Chicago, Chicago, IL, USA
Correspondence: Simon Ming-Yuen Lee
Institute of Chinese Medical Sciences, University of Macau, Avenide Da Universidade, Room 7003, N22 Building, Taipa, Macau, People’s Republic of China
Tel +853-88224695
Email [email protected]
Objective: To evaluate the effect LMHFV on body weight gain, NAFLD and muscle strength and explore effect in mitochondrial biogenesis, AMPKα and p38 pathways.
Methods: Vibration platform used in this study provides specific whole-body cyclic mechanical stimulation at low magnitude (0.3 g) and high frequency (50 Hz). Diabetic mice (8– 9 mice per group) (C57BL/KsJ-m+/+Leprdb) were randomly divided into untreated group (no vibration) and two vibration groups. Lean mice (8 mice) were used as non-diabetic control for both groups. Two diabetic vibration groups received LMHFV every day for 20 min/day and 40 min/day separately.
Results: After 8 weeks of treatment, results showed that body weight, liver weight, fat pad weight, glucose level and insulin level were lower in vibration group when compared with the untreated group. The ratio of fat in liver was significantly decreased after vibration treatment. Muscle strength was significantly increased after vibration. Mitochondrial biogenesis-related gene expression was increased in soleus, gastrocnemius and liver. AMPKα mRNA expression level was increased in soleus and gastrocnemius after vibration treatment. p38 and AMPKα mRNA expression level and protein expression level in liver were enhanced with vibration treatment. Moreover, phosphorylation of p38 and AMPKα was enhanced in liver.
Conclusion: LMHFV applied in our study decreases body weight gain and improves muscle strength and NAFLD in diabetic mice which were partly through improving mitochondrial biogenesis by enhancing p38 and AMPKα pathway.
Keywords: type 2 diabetes mellitus, low-magnitude high-frequency vibration, mitochondrial biogenesis, AMPKα, p38
Plain Language Summary
What is already known about this subject?
- Whole-body vibration improves insulin sensitive. Whole body vibration treatment (45 Hz of frequency and accelerated speed of 0.5g for 60min/day) suppressed oxidative stress to alleviate liver steatosis and consequently improve insulin resistance in db/db mice.
- Low magnitude high frequency vibration (LMHFV) (0.6 g, 35 Hz; g=gravitational acceleration, 20min/day and 5 days/week) enhanced myogenic cells proliferative activitives in Sprague-Dawley (SD) adults rats.
- Whole body vibration (35 Hz, amplitude: low) is effective and convenient exercise option for NAFLD patients.
- LMHFV (0.3 g peak-to-peak acceleration) stimulates collagen synthesis which is critical for tendon in the Achilles Tendon in SD rats.
What does this study add?
- LMHFV decreases body weight gain, liver weight and fat pad weight gain significantly.
- LMHFV enhances muscle strength and muscle mitochondrial biogenesis-related gene relative mRNA expression.
- LMHFV decreases liver lipid content and mitochondrial biogenesis related gene relative mRNA expression in liver.
- The effect of LMHFV on mitochondrial biogenesis may partly due to regulateing p38 and AMPK pathway.
Introduction
Diabetes Mellitus (DM) is a chronic disorder of glucose homeostasis. According to the report of the World Health Organization in 2016, the global prevalence of diabetes has nearly doubled since 1980, rising from 4.7% to 8.5% in the adult population and diabetes caused 1.5 million deaths in 2012.1 An unhealthy diet and lack of physical activity are major causes for type 2 diabetes mellitus (T2DM), which lead to an imbalance of high glucose production and low glucose utilization.2 Diet control is not an easy task for most people in cities when they have adapted an unhealthy eating habit. Exercise is an efficient way to control body weight and fat composition which are very critical risk factors in pathological development of T2DM. Exercise can metabolize calories which lead to insulin accumulation and subsequently modulate free fatty acid and triglyceride synthesis pathways.3 Moreover, muscle build-up is largely dependent on regular exercise.4 Nevertheless, certain exercise interventions may involve vigorous activities (eg, running) which are often not suitable for those of elderly, injured or severely over-weighted patients. To date, only a small percentage of diabetic patients have benefited from any sport activity.5 There are many reasons that may explain this problem. One of the most important reasons may be due to facts that many diabetic patients are obese and sport activities are very difficult for them. Skeletal muscle (soleus and gastrocnemius) is responsible for switched acute and chronic workload when doing exercise.6 Muscle wasting has been reported in diabetic patients, particularly after long-term immobilization.7 A study from Korea reported handgrip strength was associated with T2DM.8 Insulin resistance may occur in liver, muscle and fat at the early stage of T2DM before hyperglycemia occurring. The relationship between increased glucose level and reduced grip strength may partly be due to lower levels of physical activity. Several types of research have indicated that exercise can increase glucose uptake via an insulin-independent mechanism which is mediated by the activation of AMP-activated protein kinase (AMPK).9,10
There are strong associations among nonalcoholic fatty liver diseases (NAFLD), insulin resistance, and T2DM.11 Previous clinical research reported that ~69.5% of 3166 patients had NAFLD.12 Furthermore, 86% of obese patients with abnormal glucose were afflicted with NAFLD.13 Improve NAFLD with T2DM should be a kind of therapy for T2DM.
Low-magnitude high-frequency vibration (LMHFV) is a non-invasive biophysical intervention that has been shown to have biological effects since the early 60s.14 The applications of LMHFV are widely used in sports, fitness, rehabilitation and medical therapies.15 The LMHFV platform provides specific whole-body cyclic mechanical stimulation at low magnitude (0.3–0.6 g) and high frequency (30–50 Hz).16 The advantage of this platform is that it is a non-invasive biophysical approach to provide vibration stimulation to the musculoskeletal system and induces muscle activities.17 The low magnitude generates a displacement of <0.2 mm, which is a safe biophysical modality. However, the beneficial effect of the unique vibration parameters for improving DM and related muscle weakness is uncertain. One of the adaptations in skeletal muscle to exercise is increased mitochondrial content/function, resulting from increased mitochondrial biogenesis and decreased mitochondrial damage. Impaired mitochondrial biogenesis is also a possible cause of apoptosis of skeletal muscle cells in T2DM.18
The goal of this study was to evaluate the effects of LMHFV on glucose homeogenesis, NAFLD and muscle strength as well as the possible mechanisms on mitochondrial biogenesis and lipid metabolism.
Methodology
Animal
Male diabetic C57BL/KsJ-m+/+Leprdb mice (+db/+db) and non-diabetic lean mice (m/+db) with age 4–5 weeks were supplied by the Beijing Vital River Laboratory Animal Technology Co., Ltd. The mice were fed with standard chow and sterile water in a 12-h light/dark cycle (Animal welfare guidelines followed by Management of Animal Room in ICMS, University of Macau). All animal experiments were performed according to the protocols approved by Animal Research Ethics Committee of University of Macau.
After 3 days of acclimatization, DM mice were randomly divided into untreated group (no vibration) and vibration group with 8–9 mice per group. Eight lean mice were used as non-diabetic control for both groups. Diabetic vibration group received LMHFV using a specially designed vibration platform providing vertical vibrations at 50 Hz with a peak-to-peak magnitude of 0.3 g. The mice were allowed standing separately in compartmented cages fixed on the vibration platform every day for 20 min/day and 40 min/day.19 They can eat freely when vibration is ongoing. Vibration treatment lasted for 8 weeks.20 During the treatment period, food intake was measured every 2–3 days. Body weight, fasting plasma glucose, grip strength and time on Rotarod apparatus were measured every 2 weeks. After 8 weeks, total fat pad weight (epididymal and abdominal fat) after anesthesia and fasting plasma insulin (Ultra sensitive Mouse Insulin ELISA kit, Cat 90080, Crystal Chem) and fasting plasma glucose were measured. Soleus, gastrocnemius muscle and liver were harvested for further examination on mitochondrial biogenesis and lipid metabolism.
Measurement of Plasma Glucose and Insulin Level
At week 0, 2, 4, 6 and 8, blood were collected from the tail vein of each mouse after overnight fasting. Plasma glucose level was determined by the glucose oxidase method (Biosystem, 11504, USA). Plasma insulin was determined after 8-week treatment using Ultra Sensitive Mouse Insulin ELISA Kit (Crystal Chem Incorporation, 90080, USA) according to the manufacturer’s instructions.
Measurement of Grip Strength
Grip strength was evaluated using grip strength meter (Beijing JNT Technology and Development Company, China) and rotarod apparatus (Shanghai Biowill Co. Ltd., China). The grip strength meter determined the maximum force displayed by the mice. The grip strength meter was positioned horizontal and the mouse was held by the tail and lowered towards the apparatus. The mouse was allowed grasping the metal grid by the front paw and then pulled backwards in the horizontal plane. The force applied to the grid just before it lost grip was recorded as the peak tension. The rod apparatus was used to measure forelimb and hindlimb motor coordination and balance. In each trial, the mouse was placed on a 4 cm diameter rod with speed set at 5 rpm then raised to 40 rpm gradually. The mouse was tested for 5 min. A soft foam cushion was placed under the rod to prevent injury from falling. The time point for the mouse falling down was recorded. Five min was counted even if the mouse could hold on the rod for more than 5 min.
Evaluating the Ratio of Lipid Content in Liver Using Oil Red O Staining and H&E Staining
To evaluate the cellular neutral lipid accumulation, liver samples were embedded in OCT and stored at −80°C. The frozen liver samples were sliced at 10μm and stained with Oil Red O solution (stock solution 5 mg/mL in isopropanol; working solution 6 mL Oil Red O stock solution and 4 mL distilled water) for 10 min at 20°C. After staining, sections were washed with 0.01-M phosphate buffer solution and then observed with an Olympus light microscope.
Liver samples were collected and fixed in 4% paraformaldehyde, embedded into paraffin. Then, the sections were cut into 6-μm slices and stained with Hematoxylin and eosin (H&E) for further analysis.
Detection of Gene Expression Level of Mitochondrial Biogenesis Markers Using Real-Time PCR
Soleus, gastrocnemius and liver were weighted in 2 mL tube and TRIZOL (Invitrogen, 100 mg:100 mL) were added into tubes. RNA extraction protocols followed by the instruction. RNA concentration and quality were measured by Nanodrop. A total of 2 ng RNA were used in cDNA synthesis. The primer for qPCR is shown in Table 1.
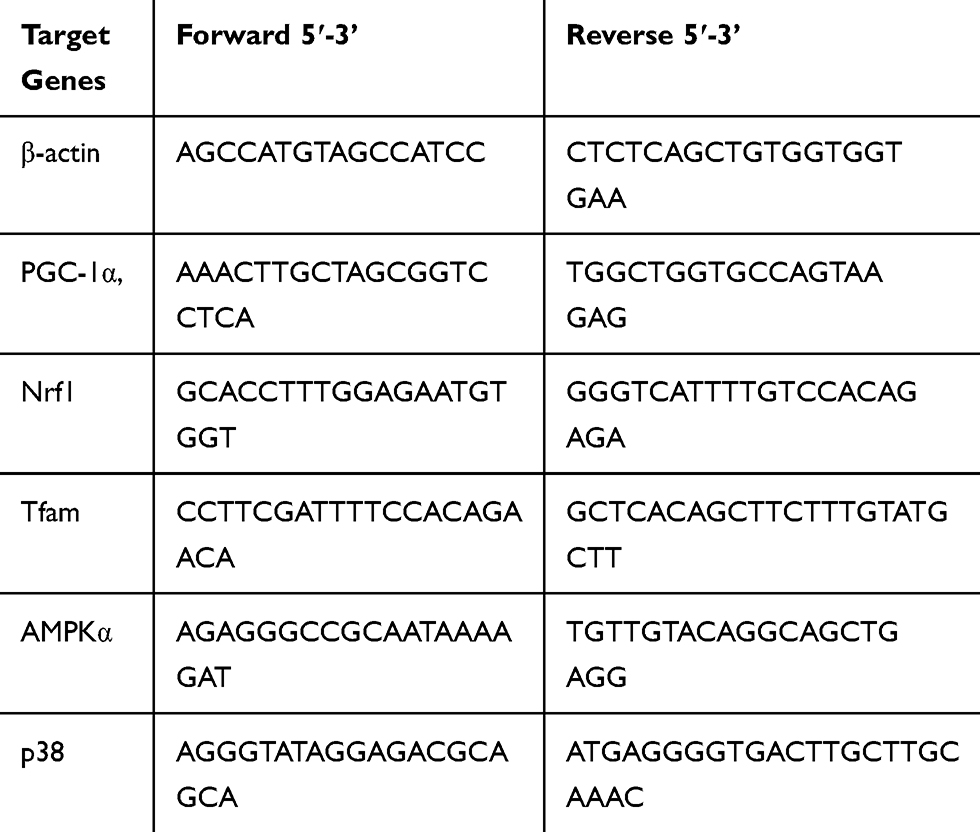 |
Table 1 Primers Information |
The threshold cycle (Ct), the cycle number at which the amounts of amplified genes of interest reached a fixed threshold, was determined. Relative expression of the RT-PCR product was calculated by using the comparative 2−ΔΔCt method. The endogenous control β-actin was used for normalization.
Detection of Protein Level of Lipid Metabolism Markers, p38MAPK and AMPKα Using Western Blotting
Protein expression was detected and measured by Western blotting assays. The liver and muscle samples were homogenized with RIPA containing phosphate and protease inhibitors using a homogenizer for 5 min and then incubated for 20 min on ice. Then, the lysed samples were centrifuged at 12,000 g. The supernatant was harvested into another new tube and protein concentration was measured with Invitrogen BCA Protein Assay Kit. Proteins were denatured by boiling at 99°C for 5 min with loading buffer. The denatured proteins were separated by using 12% SDS-PAGE. After that, proteins were transferred from the gel to polyvinylidene fluoride membranes. Five percent milk diluted with TBST buffer was used to block the nonspecific binding site for 1 h at room temperature. Primary antibodies were then applied and incubated at 4°C overnight. After incubation, the membranes were washed three times for 5 min each with TBST buffer and then incubated with appropriate HRP-conjugated secondary antibody for 60 min at room temperature. The protein bands were visualized with chemiluminescent reagents and quantified using Image J software. β-actin was used as reference protein.
Statistical Analysis
Data are presented as means ± SD. One-way ANOVA followed by Kruskal–Wallis’s multiple comparison tests were used to compare the differences between the groups. P-value <0.05 was considered as statistically significant.
Results
Body Weight, Liver Weight and Total Fat Pad Weight
In this study, we utilized db/db mice with a mutated leptin gene, and an observed diabetic condition from weeks 4–5, onwards. The vibration intervention was started when the mice were 4–5 weeks old and the results (Figure 1) showed that the body weight, liver weight and fat pad weight of the vibrated mice were significantly lower than untreated group. These results indicated that vibration treatment could have effect on obese in db/db mice.
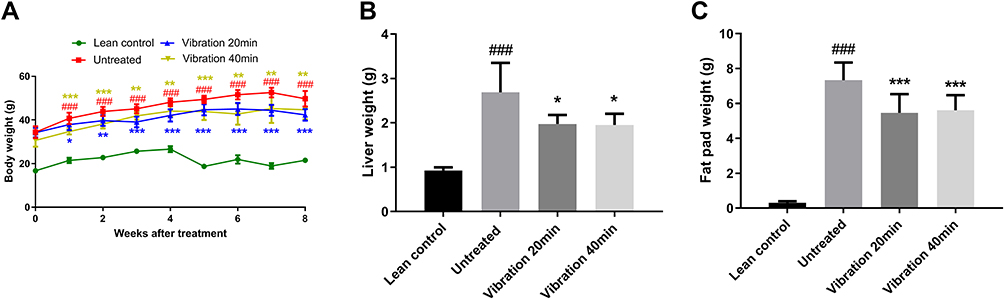 |
Figure 1 (A) Body weight. (B) Liver weight. (C) Fad weight. Notes: Data are expressed as mean ± SD. P-value <0.05 were considered significant. *P<0.05 vs untreated, **P<0.01 vs untreated, ***P<0.001 vs untreated. ###P<0.001 vs lean control. |
Plasma Glucose and Insulin Level
Plasma glucose level (Figure 2A) and Plasma insulin level (Figure 2B) of mice in diabetic untreated group, vibration group and lean control group were measured on week 0, 2, 4, 6, and 8. Whole blood was collected from the tail vein of each mouse after overnight fasting. Plasma glucose level was then determined by the glucose oxidase method. Each group have 8–9 mice (n ≥ 8). Plasma insulin level was then determined by Ultra Sensitive Mouse Insulin ELISA Kit. Each group have 8–9 mice (n ≥ 8). When compared diabetic untreated group to vibration group, the fasting plasma glucose level showed obvious change after 2nd, 4th and 8th week of treatment, but a mild decrease after 6 weeks of treatment. The insulin level changing trend is just clear at 6th week. The pathogenesis of T2DM is complex after vibration treatment. Insulin level should be increased in the early stages and decreased latter due to impaired pancreas. We hypothesized that vibration treatment postponed the stage of T2DM at 6th week. Vibration treatment is a kind of special treatment and partly similar to physical exercise. The effect of vibration on glucose would not be stable without any drug treatment.
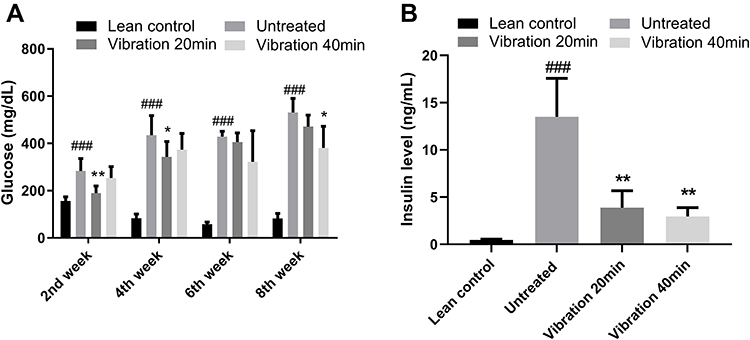 |
Figure 2 (A) Plasma glucose level of mice in diabetic untreated group. (B) Plasma insulin level at 6th week. Notes: Data are expressed as mean ± SD. P-value <0.05 were considered significant. *P<0.05 vs untreated, **P<0.01 vs untreated. ###P<0.001 vs lean control. |
Oil Red O Staining and H&E Staining
Liver lipid accumulation was examined by Oil Red O staining (Figure 3A) and H&E staining (Figure 3B). Lipid contents in vibration treatment group (vibration 20 min 20–30%, vibration 40 min 15–30%) were decreased significantly when compared with untreated group (>50%). The H&E staining results showed consistent trend with oil red O staining. All the histological results indicated that both the number and size of lipid droplets were remarkably decreased after vibration treatment.
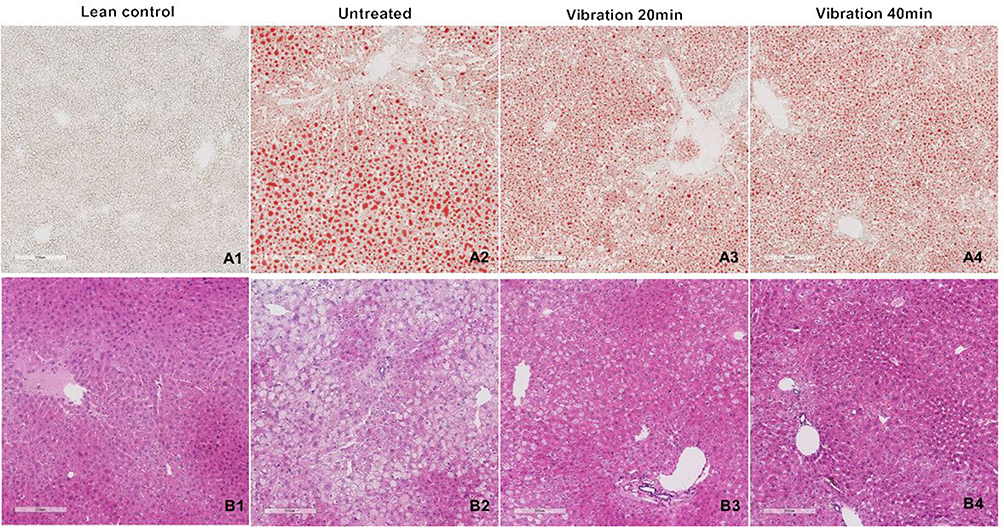 |
Figure 3 (A) Oil Red O staining. (B) H&E staining. Notes: Several slices liver cutting from different region of the whole liver were embedded in OCT and paraffin. The frozen samples were cut in 10μm slice then staining with Oil red O. The paraffin samples were cut in 6μm then with H&E. Taking pictures with 100 folds. |
Muscle Strength
Muscle strength was evaluated by two ways: grip strength meter and Rotarod apparatus. The results of grip strength meter indicated that vibration treatment significantly increased muscle strength comparing vibration treatment group with untreated group (Figure 4A). A similar trend was also observed in Rotarod apparatus. The time for the mice staying on the rolling rod was significantly increased after vibration treatment (Figure 4B). These results indicated that vibration treatment could enhance muscle strength.
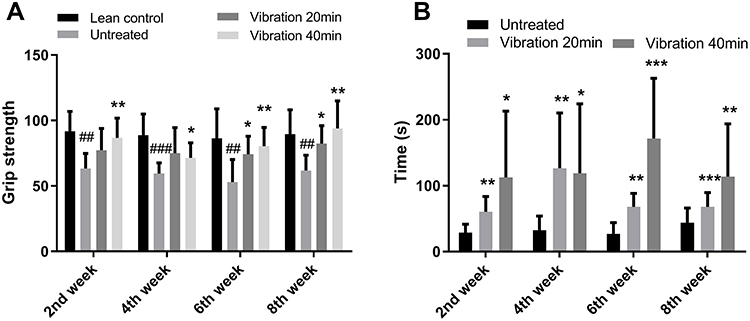 |
Figure 4 (A) Grip strength. (B) Time on rotarod. Notes: Data are expressed as mean ± SD. P-value <0.05 were considered significant. *P<0.05 vs untreated, **P<0.01 vs untreated, ***P<0.001 vs untreated. ##P<0.01 vs lean control, ###P<0.001 vs lean control. |
Changes in Mitochondrial Biogenesis-Related Gene Expression in Soleus, Gastrocnemius Muscles and Liver
mRNA expression levels of nuclear respiratory factor 1 (Nrf1), transcription factor A mitochondrial (Tfam) and peroxisome proliferator-activated receptor gamma co-activator 1-alpha (PGC-1α) in soleus, gastrocnemius muscles and liver were measured and the relative expression ratio was compared to lean control group. Results shown in Figure 5A illustrated that Nrf1, Tfam and PGC1-α mRNA expression were increased significantly in soleus muscle. However, only PGC-1α expression was significantly increased without Nrf1 and Tfam increasing in gastrocnemius muscle after the 8-week vibration treatment (Figure 5B). Figure 5C showed a similar trend in liver samples as observed in soleus samples.
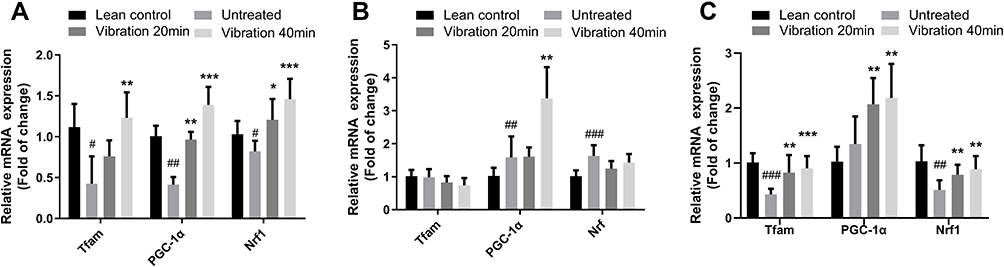 |
Figure 5 (A) Tfam, PGC1-α and Nrf1 relative mRNA expression in soleus, (B) Tfam, PGC1-α and Nrf1 relative mRNA expression in gastrocnemius, (C) Tfam, PGC1-α and Nrf1 relative mRNA expression in liver. Notes: Data are expressed as mean ± SD. P-value <0.05 were considered significant. *P<0.05 vs untreated, **P<0.01 vs untreated, ***P<0.001 vs untreated. #P<0.05 vs lean control, ##P<0.01 vs lean control, ###P<0.001 vs lean control. |
Changes in AMPKα Gene Expression in the Soleus and Gastrocnemius Muscles
AMPKα mRNA expression levels in the soleus and gastrocnemius muscles were measured and the relative expression rate was compared with the untreated group. AMPKα mRNA expression in soleus muscles is shown in Figure 6A. There were no significant changes between lean control group and untreated group. But the vibration treatment group showed enhanced AMPKα mRNA expression. The results shown in Figure 6B are from the gastrocnemius muscles. After 8 weeks of vibration treatment, AMPKα mRNA expression in vibration was significantly increased both in soleus and gastrocnemius when compared with the untreated group.
 |
Figure 6 (A) AMPKα relative mRNA expression in soleus, (B) AMPKα relative mRNA expression in gastrocnemius. Notes: Data are expressed as mean ± SD. P-value <0.05 were considered significant. *P<0.05 vs untreated, **P<0.01 vs untreated, ***P<0.001 vs untreated. ###P<0.001 vs lean control. |
Changes in p38 and AMPKα Gene Expression in Liver
mRNA expression levels for p38, AMPKα in the liver were measured and the relative expression rate was compared with the lean untreated group. The results shown in Figure 7 are from the liver tissues. After 8 weeks of vibration treatments, p38 (Figure 7A) and AMPKα (Figure 7B) relative mRNA expression in vibration groups were significantly increased when compared with the untreated group.
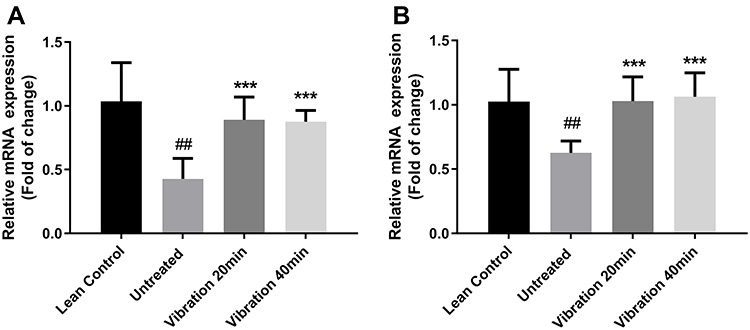 |
Figure 7 (A) p38 relative mRNA expression in liver, (B) AMPKα relative mRNA expression in liver. Notes: Data are expressed as mean ± SD. P-value <0.05 were considered significant. ***P<0.001 vs untreated. ##P<0.01 vs lean control. |
Changes in p38 and AMPKα Protein Expression and Phosphorylation in Liver
The liver samples were harvested and p38, p-p38, AMPKα and p-AMPKα (Thr172) protein levels were measured using Western blotting, and the results are shown in Figure 8A and D. The vibration treatment increased the AMPKα protein level and enhanced its phosphorylation when compared with the untreated group. Meanwhile, the phosphorylation level of p38 is also increased by the vibration treatment for 40 min only.
 |
Figure 8 (A) β-actin, p38 and p-p38 protein expression. (B) Quantity of p38 protein relative expression to β-actin. (C) Quantity of p-p38 protein relative expression to β-actin. (D) β-actin, AMPKα and p-AMPKα protein expression. (E) Quantity of AMPKα protein relative expression to β-actin. (F) Quantity of p-AMPKα protein relative expression to β-actin. Notes: Data are expressed as mean ± SD. P-value <0.05 were considered significant. *P<0.05 vs untreated. ##P<0.01 vs lean control. |
Discussion
In the progression of clinical T2DM, weight gain, ectopic lipid accumulation in liver and abdomen play very important roles in disease development.21 Compared with nondiabetic subjects, older patients with T2DM have a changed body composition and weaker skeletal muscle strength.7 In this study, we have investigated the effects of vibration exercise on diabetes-related muscle weakness. The vibration platform used in the study provides vibration at specific magnitude (0.3 g) and frequency (50 Hz). In previous clinical studies, it was demonstrated that vibration therapy increased muscle strength, balancing ability and reduced the risk of falling in elderly patients, which was retained even after cessation of vibration.22
In this study, the body weight, liver weight and fat pad weight of the vibrated mice were significantly lower than untreated group. Also, previous work has shown that vibration exercise played a positive role in glycemic control.23 In our study, there was ~25% decrease in blood glucose and ~60% decrease in blood insulin in vibration group.
Although weight gain and accumulation of abdominal fat would induce T2DM, the changes in body composition after the onset of diabetes have not been well investigated.21 Whole-body vibration treatment could improve muscle function by strengthening postural control, muscle strength and jumping height. Resistance training has similar function as whole-body vibration exercise.24,25 However, the effect of vibration treatment would be influenced by loading procedures, parameters and duration.26 Vibration treatment for 20–30 min was widely used in human and animal experiments.
In this study, vibration 20 min and vibration 40 min group were set up to investigate whether these two durations have significant difference. We used grip strength meter and rotarod apparatus to monitor the grip strength of the mice during and after vibration treatment period. After training by vibration exercise, the diabetic mice showed a significant increase in grip force and time on the rotarod. These changes may be associated with an increase in mitochondrial biogenesis in soleus muscle.
The mitochondrion plays key roles in cellular metabolism. Mitochondria plays a critical role in maintaining cellular health due to their roles in regulating skeletal muscle fiber size, metabolism, and function.27 An increase in mitochondrial mass and/or number is termed “an enhanced mitochondrial biogenesis.” Multiple genes, such as Nrf1, Tfam and PGC-1α, are involved in the regulation of mitochondrial biogenesis and fiber-type transformation.28 Therefore, mitochondria in skeletal muscle can improve muscle health and overall well-being through regulating skeletal muscle fiber types and expression of key genes involved in this process.
Our results show that after vibration treatment, the expression of mitochondrial biogenesis-related markers (Tfam, PGC-1α and Nrf1) were significantly increased in the diabetic group as compared with the untreated group. The results may explain the increase of muscle strength in vibration group. Soleus muscle is a powerful muscle in the back part of the lower leg which is involved in standing and walking. Soleus muscles have a higher proportion of slow muscle fibers than many other muscles29 and they are the most effective muscle for plantar flexion in a bent knee position. It is closely connected to the gastrocnemius muscle. The gastrocnemius muscle is superficial to the soleus. In the gastrocnemius muscle, no significant changes in mitochondrial biogenesis-related markers (Tfam and Nrf1) were observed and only PGC-1α showed enhanced expression. The gastrocnemius is primarily involved in running, jumping and other fast movements of leg, and to a lesser degree in walking and standing.30 This may partly explain why after vibration treatment, the mitochondrial biogenesis only enhanced in soleus but not in gastrocnemius.
About 70% of obese patients with T2DM mellitus have NAFLD.31 There is a strong association between NAFLD and T2DM mellitus. The db/db mice are also a good model for NAFLD. So the liver samples were also harvested for investigating the effect of vibration on NAFLD and mitochondrial biogenesis in liver.
The histological analysis indicates that the vibration improved NAFLD by reducing the lipid droplet number and size. These results were consistent with the liver weight results. To investigate the potential mechanism, we measured the expression of mRNA and protein of mitochondrial biogenesis-related genes. The results shown in Figure 6 show that vibration treatments enhanced the mitochondrial biogenesis-related gene expression. After short-term fasting periods, the liver produces and releases glucose mainly through glycogenolysis. Gluconeogenesis is regulated by availability of gluconeogenic, gluconeogenic enzymes and multiple transcription factors and coregulators including PGC-1α. Cyclic AMP response element binding (CREB) protein was found to induce gluconeogenic enzyme expression through PGC-1 and in Herzig S research, they found activation of PGC-1 by CREB in liver contributes importantly to the pathogenesis of T2DM by restored glucose homeostasis and rescued expression of gluconeogenic genes.32
PGC1α plays an important role in mitochondrial biogenesis. It is regulated by mitogen-activated protein kinase p38 (p38 MAPK). p38 MAPK is activated by Ca2+, cold, cytokines and exercise.33 AMPK participates in many signaling pathways involved in energy homeostasis including mitochondrial biogenesis. Phosphorylated AMPK actives components of signaling pathways that enhances mitochondrial biogenesis such as PGC-1α which master Nrf1 and Nrf2. Then, Nrf1 and Nrf2 increase the expression of the gene encoding Tfam.34 The results show that p38 and AMPKα mRNA expression are increased and the consistent results were observed in protein level. Also, the phosphorylation of p38 and AMPKα were increased, suggesting that vibration treatment may increase p38 and AMPKα mRNA and protein expression, and this may increase mitochondrial biogenesis in the liver and muscle. Most of the results indicated that vibration 20 min/day has similar effect with vibration 40 min/day except the influence on p38 pathway.
Conclusion
Low magnitude and high-frequency vibration decrease body weight, liver weight, fat pad weight and fat content in liver in vibration group when compared with the untreated group. Moreover, it improved the fasting glucose levels and insulin levels at 6th week. In skeletal muscle tissues (soleus and gastrocnemius), vibration treatment enhanced mitochondrial biogenesis by increasing p38 and AMPKα expression to improve muscle strength. In liver tissues, vibration treatment enhances mitochondrial biogenesis by increasing p38 and AMPK phosphorylation and then decreased the lipid content. All these results suggest that low magnitude and high-frequency vibration (20min/day and 40 min/day) may be a potential therapy or alternative method to improve muscle strength and NAFLD in T2DM mellitus patients.
Abbreviations
AMPK, AMP-activated protein kinase; ANOVA, analysis of variance; Ct, threshold cycle; EMG, electromyography; FASN, fatty acid synthase coding gene; GAPDH, glyceraldehyde 3-phosphate dehydrogenase; LMHFV, low-magnitude high-frequency vibration; Nrf1, nuclear respiratory factor 1; NAFLD, nonalcoholic fatty liver diseases; OCT, optimal cutting temperature compound; p38, p38 mitogen-activated protein kinases; PGC-1α, peroxisome proliferator-activated receptor gamma co-activator 1-alpha; qPCR, quantitative polymerase chain reaction; RT-PCR, real-time polymerase chain reaction; SD, standard deviation; Tfam, transcription factor A.
Acknowledgment
The author wishes to acknowledge the help of Professor Lei Jiang, Professor Mang-I Vai, Professor Kwok-Sui Leung, Professor Wing-Hoi Cheung, Professor Kwok-Pui Fung and Professor Guozhen Cui. This study was supported by The Science and Technology Development Fund, Macau S.A.R (FDCT0058/2019/A1) (Reference no. 061-2017-AIR) and the Multi-year Research Grant from University of Macau (Reference no. MYRG2019-00105-ICMS and MYRG2015-00182-ICMS-QRCM).
Disclosure
The authors report no conflicts of interest in this work.
References
1. Global report on diabetes by World Health Organization; 2016. Available from: http://www.who.int/.
2. Causes of diabetes by National Diabetes Information Clearinghouse; 2014. Available from: www.diabetes.niddk.nih.gov.
3. Beauchamp B, Ghosh S, Dysart MW, et al. Low birth weight is associated with adiposity, impaired skeletal muscle energetics and weight loss resistance in mice. Int J Obes (Lond). 2015;39(4):702–711. doi:10.1038/ijo.2014.120
4. Yang J. Enhanced skeletal muscle for effective glucose homeostasis. Prog Mol Biol Transl Sci. 2014;121:133–163.
5. Lawton J, Ahmad N, Hanna L, et al. ‘I can’t do any serious exercise’: barriers to physical activity amongst people of Pakistani and Indian origin with Type 2 diabetes. Health Educ Res. 2006;21(1):43–54. doi:10.1093/her/cyh042
6. Suhr F, Gehlert S, Grau M, et al. Skeletal muscle function during exercise-fine-tuning of diverse subsystems by nitric oxide. Int J Mol Sci. 2013;14(4):7109–7139. doi:10.3390/ijms14047109
7. Park SW, Goodpaster BH, Strotmeyer ES, et al. Decreased muscle strength and quality in older adults with type 2 diabetes: the health, aging, and body composition study. Diabetes. 2006;55(6):1813–1818. doi:10.2337/db05-1183
8. Lee M-R, Jung SM, Bang H, et al. Association between muscle strength and type 2 diabetes mellitus in adults in Korea: data from the Korea national health and nutrition examination survey (KNHANES) VI. Medicine (Baltimore). 2018;97(23):e10984. doi:10.1097/MD.0000000000010984
9. Musi N, Fujii N, Hirshman MF, et al. AMP-activated protein kinase (AMPK) is activated in muscle of subjects with type 2 diabetes during exercise. Diabetes. 2001;50(5):921–927. doi:10.2337/diabetes.50.5.921
10. Hegarty BD, Turner N, Cooney GJ, et al. Insulin resistance and fuel homeostasis: the role of AMP-activated protein kinase. Acta Physiol (Oxf). 2009;196(1):129–145. doi:10.1111/aps.2009.196.issue-1
11. Birkenfeld AL, Shulman GI. Nonalcoholic fatty liver disease, hepatic insulin resistance, and type 2 diabetes. Hepatology. 2014;59(2):713–723. doi:10.1002/hep.v59.2
12. Targher G, Bertolini L, Padovani R, et al. Prevalence of nonalcoholic fatty liver disease and its association with cardiovascular disease among type 2 diabetic patients. Diabetes Care. 2007;30(5):1212–1218. doi:10.2337/dc06-2247
13. Ortiz-Lopez C, Lomonaco R, Orsak B, et al. Prevalence of prediabetes and diabetes and metabolic profile of patients with Nonalcoholic Fatty Liver Disease (NAFLD). Diabetes Care. 2012;35(4):873. doi:10.2337/dc11-1849
14. Bierman W. Influence of cycloid vibration massage on trunk flexion. Am J Phys Med Rehabil. 1960;39(6):219–224. doi:10.1097/00002060-196012000-00001
15. Rittweger J. Vibration as an exercise modality: how it may work, and what its potential might be. Eur J Appl Physiol. 2010;108(5):877–904. doi:10.1007/s00421-009-1303-3
16. Chow DH-K, Leung K-S, Qin L, et al. Low-magnitude high-frequency vibration (LMHFV) enhances bone remodeling in osteoporotic rat femoral fracture healing. J Orthop Res. 2011;29(5):746–752. doi:10.1002/jor.21303
17. Cheung WH, Li CY, Zhu TY, et al. Improvement in muscle performance after one-year cessation of low-magnitude high-frequency vibration in community elderly. J Musculoskelet Neuronal Interact. 2016;16(1):4.
18. Larsen S, Skaaby S, Helge JW, et al. Effects of exercise training on mitochondrial function in patients with type 2 diabetes. World J Diabetes. 2014;5(4):482–492. doi:10.4239/wjd.v5.i4.482
19. Guo A-Y, Leung K-S, Qin J-H, et al. Effect of low-magnitude, high-frequency vibration treatment on retardation of sarcopenia: senescence-accelerated mouse-P8 model. Rejuvenation Res. 2016;19(4):293–302. doi:10.1089/rej.2015.1759
20. Sun KT, Leung KS, Siu PMF, et al. Differential effects of low-magnitude high-frequency vibration on reloading hind-limb soleus and gastrocnemius medialis muscles in 28-day tail-suspended rats. J Musculoskelet Neuronal Interact. 2015;15(4):316–324.
21. Koh-banerjee P, Wang Y, Hu FB, et al. Changes in body weight and body fat distribution as risk factors for clinical diabetes in US men. Am J Epidemiol. 2004;159(12):1150–1159. doi:10.1093/aje/kwh167
22. Cheung W-H, Li C-Y, Zhu TY, et al. Improvement in muscle performance after one-year cessation of low-magnitude high-frequency vibration in community elderly. J Musculoskelet Neuronal Interact. 2016;16(1):4–11.
23. Baum K, Votteler T, Schiab J. Efficiency of vibration exercise for glycemic control in type 2 diabetes patients. Int J Med Sci. 2007;4(3):159–163. doi:10.7150/ijms.4.159
24. Roelants M, Delecluse C, Verschueren SM. Whole-body-vibration training increases knee-extension strength and speed of movement in older women. J Am Geriatr Soc. 2004;52(6):901–908. doi:10.1111/(ISSN)1532-5415
25. Verschueren SM, Roelants M, Delecluse C, et al. Effect of 6-month whole body vibration training on hip density, muscle strength, and postural control in postmenopausal women: a randomized controlled pilot study. J Bone Miner Res. 2004;19(3):352–359. doi:10.1359/JBMR.0301245
26. Edwards JH, Reilly GC. Vibration stimuli and the differentiation of musculoskeletal progenitor cells: review of results in vitro and in vivo. World J Stem Cells. 2015;7(3):568–582. doi:10.4252/wjsc.v7.i3.568
27. Venhoff N, Lebrecht D, Pfeifer D, et al. Muscle-fiber transdifferentiation in an experimental model of respiratory chain myopathy. Arthritis Res Ther. 2012;14(5):R233. doi:10.1186/ar4076
28. Lin J, Wu H, Tarr PT, et al. Transcriptional co-activator PGC-1 alpha drives the formation of slow-twitch muscle fibres. Nature. 2002;418(6899):797–801. doi:10.1038/nature00904
29. Ariano MA, Edgerton VR, Armstrong RB. Hindlimb muscle fiber populations of five mammals. J Histochem Cytochem. 1973;21(1):51–55. doi:10.1177/21.1.51
30. Chao M-W, Lin C-H, Assa J, et al. Human motion retrieval from hand-drawn sketch. IEEE Trans Vis Comput Graph. 2012;18(5):729–740. doi:10.1109/TVCG.2011.53
31. Portillo-sanchez P, Bril F, Maximos M, et al. High prevalence of nonalcoholic fatty liver disease in patients with Type 2 diabetes mellitus and normal plasma aminotransferase levels. J Clin Endocrinol Metab. 2015;100(6):2231–2238. doi:10.1210/jc.2015-1966
32. Herzig S, Long F, Jhala US, et al. CREB regulates hepatic gluconeogenesis through the coactivator PGC-1. Nature. 2001;413(6852):179–183. doi:10.1038/35093131
33. Hock MB, Kralli A. Transcriptional control of mitochondrial biogenesis and function. Annu Rev Physiol. 2009;71(1):177–203. doi:10.1146/annurev.physiol.010908.163119
34. Ventura-clapier R, Garnier A, Veksler V. Transcriptional control of mitochondrial biogenesis: the central role of PGC-1alpha. Cardiovasc Res. 2008;79(2):208–217. doi:10.1093/cvr/cvn098
 © 2020 The Author(s). This work is published and licensed by Dove Medical Press Limited. The full terms of this license are available at https://www.dovepress.com/terms.php and incorporate the Creative Commons Attribution - Non Commercial (unported, v3.0) License.
By accessing the work you hereby accept the Terms. Non-commercial uses of the work are permitted without any further permission from Dove Medical Press Limited, provided the work is properly attributed. For permission for commercial use of this work, please see paragraphs 4.2 and 5 of our Terms.
© 2020 The Author(s). This work is published and licensed by Dove Medical Press Limited. The full terms of this license are available at https://www.dovepress.com/terms.php and incorporate the Creative Commons Attribution - Non Commercial (unported, v3.0) License.
By accessing the work you hereby accept the Terms. Non-commercial uses of the work are permitted without any further permission from Dove Medical Press Limited, provided the work is properly attributed. For permission for commercial use of this work, please see paragraphs 4.2 and 5 of our Terms.