")
Back to Journals » OncoTargets and Therapy » Volume 13
Low Levels of SPARC are Associated with Tumor Progression and Poor Prognosis in Human Endometrial Carcinoma
Authors Wang L , Wang W, Xu Y, Wang Q
Received 19 August 2020
Accepted for publication 7 October 2020
Published 11 November 2020 Volume 2020:13 Pages 11549—11569
DOI https://doi.org/10.2147/OTT.S277795
Checked for plagiarism Yes
Review by Single anonymous peer review
Peer reviewer comments 2
Editor who approved publication: Dr Federico Perche
Ling Wang,1 Wei Wang,2 Yangchun Xu,3 Qiang Wang1
1Department of Gynecology and Obstetrics, The Second Hospital of Jilin University, Changchun 130041, People’s Republic of China; 2Department of Radiology, The First Hospital of Jilin University, Changchun 130041, People’s Republic of China; 3Department of Dermatology, The Second Hospital of Jilin University, Changchun 130041, People’s Republic of China
Correspondence: Qiang Wang
Department of Gynecology and Obstetrics, The Second Hospital of Jilin University, 218 Zi Qiang Road, Nanguan District, Changchun 130041, People’s Republic of China
Tel/Fax +86-431-8113-6727
Email [email protected]
Background: SPARC (secreted protein acidic and rich in cysteine), also known as osteonectin, BM-40, and 43 K protein, is a matricellular protein associated with various tumor progressions. The aim of this research was to investigate the prognostic value of SPARC in endometrial carcinoma (EC) and its function in cancer cell invasion and metastasis.
Methods: From both mRNA and protein levels, SPARC expression in normal endometrial tissue and EC tissue, normal endometrial cells and 4 EC cell lines (KLE, HEC-1A, HEC-1B, Ishikawa) were evaluated by immunohistochemistry (IHC) or immunocytochemistry (ICC), quantitative real-time PCR (qRT-PCR) and Western blotting. RNA interference mediated by lentivirus was performed to get the stable SPARC down-expressing cells. The functional analysis techniques in vitro and in vivo were used to detect the effects of SPARC knockdown on EC cell proliferation, apoptosis, invasion and metastasis.
Results: The expressions of SPARC in EC tissues and cells were much lower than those in normal endometrial cells and tissues; meanwhile, its low expression was closely related to the malignant clinicopathological characteristics of EC. SPARC knockdown could inhibit apoptosis, promote the process of EMT and improve the proliferation and invasion capacities of EC cells in vitro and in vivo.
Conclusion: The low expression of SPARC was detected in EC tissues and cells, which was positively correlated with the poor prognosis of EC patients. SPARC acted as a tumor suppressor gene that hindered EC progression, which proposed a new therapeutic strategy for EC treatment.
Keywords: SPARC, endometrial cancer, invasion, metastasis, EMT
Introduction
Endometrial carcinoma (EC) is an epithelial malignancy occurring in the endometrium and is one of the most common gynecologic malignancies that seriously threatens women’s health.1 In 2018, 63,230 new cases and 11,350 deaths from EC were projected to occur in the United States. Among all female malignant tumors, the incidence of EC ranks 4th, and the mortality rate ranks 6th.2 EC is more common in postmenopausal women, although approximately 14% of ‘patients are premenopausal women, and approximately 4% are less than 40 years old.3 Numerous studies have shown that hypertension, diabetes, and obesity are high-risk factors for EC. Due to the increasing incidence of chronic diseases, the population at high risk of EC is continually expanding, and the overall incidence rate of EC is increasing.4 At present, treatment for EC is mainly based on surgery, radiotherapy, chemotherapy, and other comprehensive treatments, although the prognosis of patients with EC at an advanced stage with recurrence or metastasis is still very poor.5 Metastasis of regional or distant lymph nodes is a major prognostic determinant of EC.6 Therefore, it is necessary to actively study the invasion and metastasis mechanisms of EC and uncover its biological characteristics, so as to explore new comprehensive treatment strategies for improving the patient prognosis.
Secreted protein acidic and rich in cysteine (SPARC) was originally described and purified as a non-collagen component by Temine et al in 1981.7 SPARC, also known as osteonectin, BM-40, and 43 K protein, is a calcium-binding protein of the extracellular matrix non-collagen glycoproteins. Subsequent studies have shown that SPARC is widely distributed in humans, especially in tissues during development and reconstruction. The physiological functions of SPARC involve multiple aspects of tissue differentiation and embryonic development, cell adhesion and migration, and regulation of the cell cycle.8 Abnormal expression of SPARC has been found in many malignant solid tumors and is associated with tumorigenesis and progression, invasion and metastasis, and clinical stage and prognosis of patients.9,10
While the relationship between SPARC and different malignancies has been demonstrated, there have been few studies on its relationship with EC, and the conclusions are contradictory. In this study, using lentivirus transfection and cell functional assays in vitro and in vivo, we systematically elucidated the effects of SPARC on EC progression and its role in cell proliferation, invasion, and metastasis at the cellular level.
Materials and Methods
Tumor Tissues Samples
With written informed consent, 75 normal endometrial tissues and 245 EC tissues were collected from the Second Hospital of Jilin University between 2005 and 2017. All EC patients were diagnosed according to the revised International Federation of Gynecology and Obstetrics (FIGO) staging system, with the following FIGO stages: stages I and II, 144 cases; and stages III and IV, 101 cases. No patient received any preoperative radiotherapy or chemotherapy. This study was approved by the Institutional Medical Ethics Committee of Jilin University, and all approaches were based on relevant guidelines and regulations. Written informed consent was obtained from all patients involved in this study.
Analysis of the Oncomine Public Databases
Oncomine array datasets (www.oncomine.org) are large tumor gene chip databases, containing 65 gene chip data sets, 4,700 chips, and expression data for 480 million genes, which can be used to perform differential analysis of gene expression, identify the clinical relevance of gene expression, and perform multi-gene co-expression analysis.11,12 The advantage of Oncomine analysis is that, in addition to data, it also provides some simple and easy-to-operate analytical tools, such as differential expression analysis, co-expression analysis and so on. Moreover, it integrates some of the TCGA and GEO data. Oncomine analysis is more suitable for comparative studies, and detailed information on standardized techniques and statistical calculations is provided on the online platform. In this study, the Oncomine comprehensive assay was used to compare the differential expression of SPARC between endometrial carcinoma and normal endometrial tissue.
Culture and Identification of Normal Endometrial Cells
Normal endometrial tissues were collected during hysterectomy in patients with hysteromyoma or polyps in the Gynecology and Obstetrics department of the Second Hospital of Jilin University. Tissue obtained from the operation was washed using phosphate-buffered saline (PBS), cut into small pieces, immersed in 5 mL of 0.25% trypsin supplemented with 0.25 mg/mL collagenase type I (Sigma-Aldrich, St. Louis, MO, USA) at a ratio of 1:1, and incubated at 37 °C on a rotating platform for 1 h, to promote cell isolation and primary cell growth.11 Then, the digested tissue was washed using PBS, suspended in Dulbecco’s Modified Eagle’s Medium (DMEM)/F12 (Gibco BRL, Rockville, MD, USA) containing 10% fetal bovine serum (FBS; Australian origin) and 1% antibiotics (100 µg/mL streptomycin, 100 U/mL penicillin; Millipore, USA), transferred to a cell culture flask, and cultured at 37 °C with 5% CO2. The primary cell isolation process does not change the expression of cell-specific proteins, and the cultures can be examined for specific protein markers. Normal endometrial cells can be identified by morphological and immunocytochemical methods. Epithelial cells are polygonal, closely arranged, and vortex-like, and their nucleus is larger and obvious. Stromal cells are spindle-shaped, show stretched and flat growth, and their nucleus is not obvious. Keratin is found in glandular epithelial cells, and vimentin is present in stromal cells.13
Culture of EC Cell Lines
Four types of EC cells, KLE, HEC-1A, HEC-1B, and Ishikawa, were purchased from the Shanghai Institute of Science, Academia Sinica. All cells were cultured in DMEM/F12 supplemented with 10% FBS and 1% antibiotics at 37 °C and 5% CO2. The medium was changed daily, and cell growth was observed under an inverted microscope. When cell density reached 80%, cells were trypsinized and subcultured.
Detection of SPARC Expression in Endometrial Tissue and Cells by Immunohistochemistry and Immunocytochemistry
For immunohistochemistry (IHC), paraffin-embedded tissue sections were successively baked, dewaxed, PBS-soaked, submitted for antigen-retrieval, and goat serum-blocked. Thereafter, cells were incubated with primary anti-human SPARC antibody (ab225716; Abcam) at 4 °C overnight. The next day, goat anti-rabbit biotin-conjugated secondary antibody was added and incubated for 30 min at 37 °C. After washing using PBS, a drop of DAB chromogenic solution was added on top of sections. Brown particles in the tissue were observed in real time under a microscope, and the reaction was terminated immediately using tap water. After hematoxylin re-dyeing, 1% alcohol hydrochloride differentiation, gradient ethanol dehydration, and neutral gum sealing, the staining results were observed and photographed under an electron microscope. The appearance of brown granules in the cytoplasm was considered a positive result. A semi-quantitative scoring system was used to determine the staining results.14 The total expression score was equal to the staining intensity score plus the percentage score of positive cells. The staining intensity was divided into four categories: totally negative, 0 points; weakly positive (pale yellow, slightly higher than the background),1 point; positive (brown-yellow, significantly higher than the background), 2 points; and strong positive (dark brown), 3 points. The percentage of positive cells was divided into five categories: 0 points (0%), 1 point (1%–25%), 2 points (26%–50%), 3 points (51%–75%), and 4 points (76%–100%). A total score of 0–3 indicated low expression and 4–7 indicated high expression. For immunocytochemistry (ICC), cells in the logarithmic growth phase were suspended, inoculated in small culture dishes covered with coverslips, and cultured at 37 °C and 5% CO2 for 24 h. After washing using PBS, all coverslips with adhered cells were gathered and fixed using 95% ethanol for 30 min, and the remaining IHC procedure steps were followed. For outcome determination, five random views of each coverslip were selected and examined for positive cell ratio and positive staining intensity, using the same judgment criteria as for IHC. Each experiment was performed in triplicate.
Quantitative Real-Time PCR Detection of SPARC mRNA Expression in Normal Endometrial and EC Cells
Logarithmic growth cells were collected. Total RNA was extracted using TRIzol reagent (TaKaRa Biotechnology, China) and diluted to 500 ng/µL, of which 2 µL was reverse-transcribed to cDNA (PrimeScript RT reagent Kit with gDNA Eraser; TaKaRa). The total amount of reaction solution was 20 μL, including 10 µL Power SYBR Green PCR master mix (TaKaRa), 0.4 µL each of upstream and downstream primers, 2 µL cDNA template, and 7.2 µL DNase/RNase-Free Water (Sigma-Aldrich). PCR was performed using the LightCycler 480 System (Applied Biosystems Inc.; Thermo Fisher Scientific, Inc. Inc). The specific upstream and downstream primers were designed and synthesized by TaKaRa. The primer sequences are shown in Table 1. The relative gene expression was analyzed by the 2-ΔΔCt method.15 Each experiment was performed in triplicate.
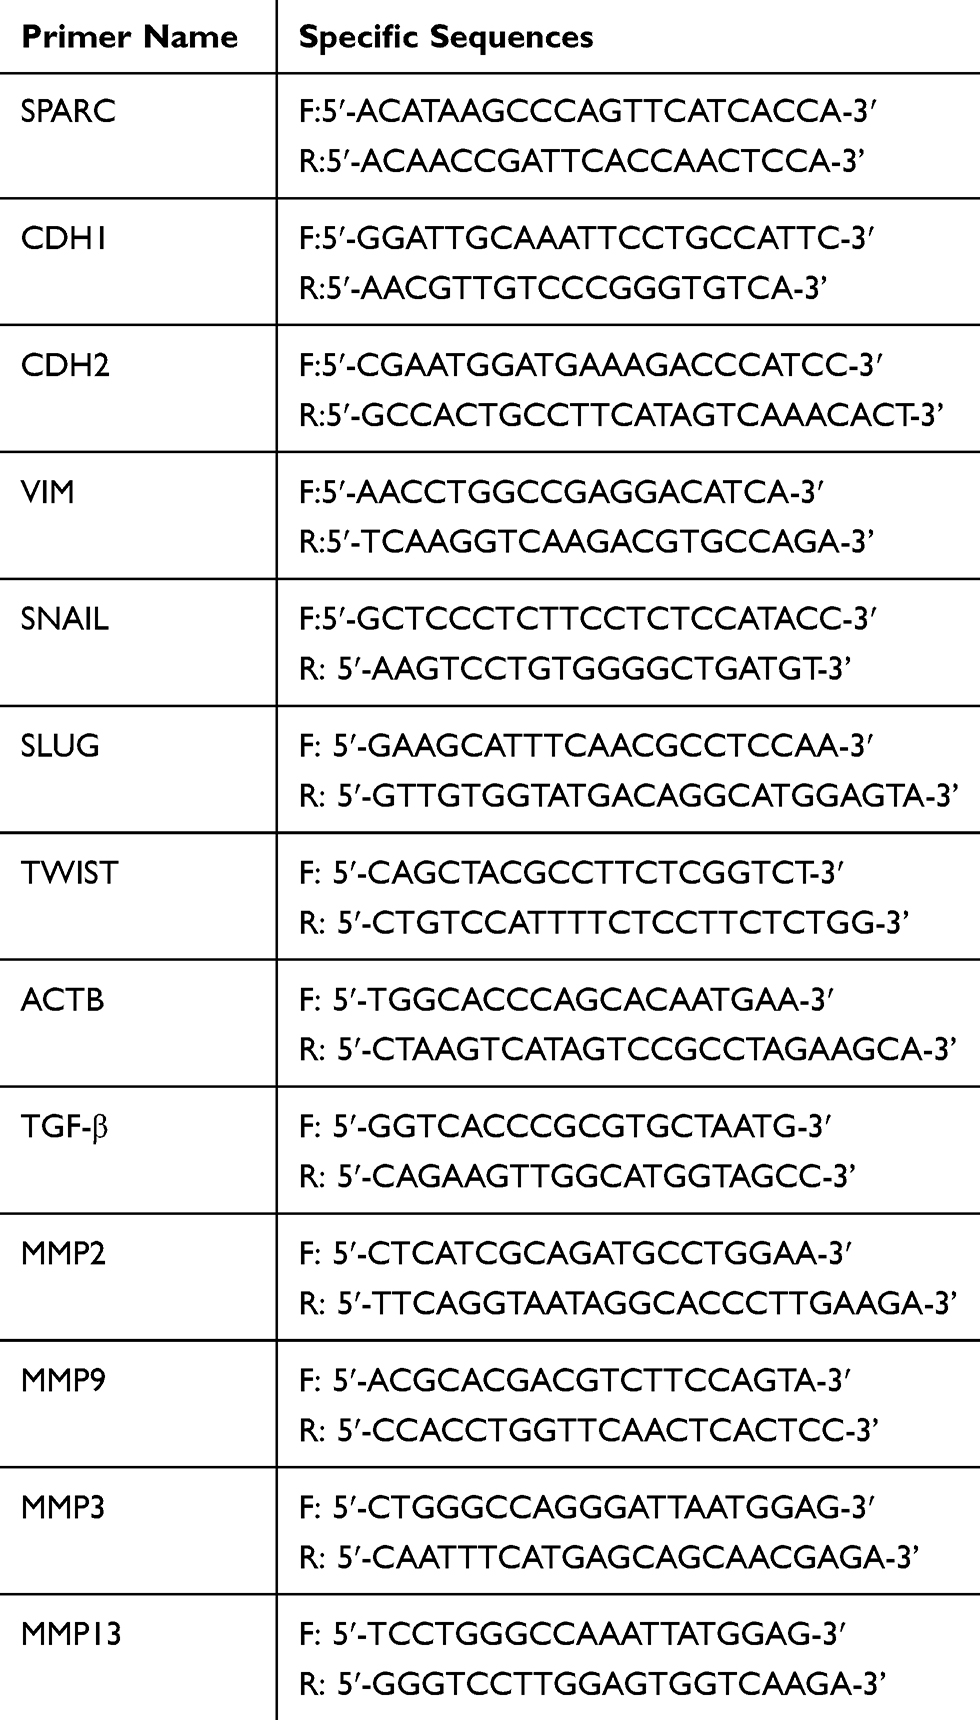 |
Table 1 The Sequence of Primer in RT-qPCR |
Western Blotting Detection of SPARC Protein Expression in Normal Endometrial and EC Cells
Logarithmic growth cells were collected and lysed on ice for 30 min in radio-immunoprecipitation assay (RIPA) buffer supplemented with 1 mM phenylmethylsulfonyl fluoride (PMSF). Protein was extracted by low-temperature centrifugation at 12,000 rpm/min and the concentration was determined with the bicinchoninic acid (BCA) Protein Assay Kit (Solarbio, China). Protein samples (40 μg per lane) were separated by 10% sodium dodecyl sulfate-polyacrylamide gel electrophoresis (SDS-PAGE), transferred to polyvinylidene difluoride (PVDF) membranes, and blocked with 5% bovine serum albumin (BSA) for 1 h at room temperature. After washing using Tris-buffered saline with Tween 20 (TBST), membranes were incubated with primary antibodies at a working dilution of 1:1000, at 4 °C overnight. The next day, the membranes were washed using TBST and incubated with a secondary antibody for 1 h at room temperature. Thereafter, immunoblots were developed using enhanced chemiluminescence (ECL, Thermo Fisher Scientific, Inc.). After automatic exposure, the gray values of the bands were analyzed to determine protein levels. Each experiment was performed in triplicate.
RNA Interference Mediated by Lentivirus
The LV-SPARC-RNAi vector and LV-negative-RNAi vector were designed and provided by GeneChem Inc. (Shanghai, China). Exogenous SPARC-forced knockdown in Ishikawa and HEC-1B cells was accomplished by transfection with the LV-SPARC-RNAi vector to obtain Ishikawa-shRNA cells and HEC-1B-shRNA cells. The target sequence for SPARC was 5ʹ-AACAAGACCTTCGACTCTTCC-3ʹ; the negative control sequence was 5ʹ-TTCTCCGAACGTGTCACGT-3ʹ. According to the manufacturer’s protocol, logarithmic growth cells were collected, inoculated into a 24-well plate, and cultured at 37 °C and 5% CO2 for 24 h. For accurate judgment of the best infection conditions as well as multiplicity of infection (MOI) values, the LV-negative-RNAi vector was used for pre-experimentation. The MOI values were set to 10, 50, and 100 for the pre-experiment, and the final MOI value was determined to be 100. The amount of virus required was calculated according to the formula: MOI = (viral titer×volume of virus)/cell number. The transfection mixtures of lentivirus particles and infection enhancers were added into the wells, and cells were maintained in a 37 °C and 5% CO2 incubator for 12 h. In order to avoid viral cytotoxicity, 12 h after lentiviral transfection, the transfection mixture was replaced with fresh complete medium. Cell culture medium was changed daily for 3 days. After 72 h of incubation, transfected cells showing green fluorescence were observed under a fluorescence microscope, and transfection effects were determined by qRT-PCR, Western blotting, and ICC.
Detection of Apoptosis by Flow Cytometry
Cells were collected and washed using PBS, as required by the PE Annexin V Apoptosis Detection Kit I (BD Pharmingen™). Cells in the control and experimental groups were resuspended in 1× buffer, and the suspension was filtered and added to a special glass tube containing 5 μL 7-AAD and 5 μL PE fluorochrome. The number of cells in each tube was guaranteed to be more than 1×10⁴ cells, which were mixed slightly and stained at room temperature for 15 min. The apoptosis rate of 10,000 cells was measured by flow cytometry, and the total apoptosis rate of each group was the sum of the early (Q4) and late (Q2) apoptosis rates. Each experiment was performed in triplicate.
Growth Curve Test to Detect Changes in Cell Proliferation Ability Before and After Transfection
After trypsin digestion and centrifugation, logarithmic growth cells were collected and counted, then seeded on a 24-well plate, maintaining the number of cells in each well at 1 × 10⁴ cells. Three duplicate wells were used for each cell type. From the next day, cells were trypsinized daily, and the average number of cells per day was calculated from the three duplicate wells, per week. The culture time was displayed on the horizontal axis, and the number of cells obtained from daily statistics was displayed on the longitudinal axis to draw the growth curve. Each experiment was performed in triplicate.
Plate Cloning Formation Test to Detect Changes in Cell Cloning Capacity Before and After Transfection
Logarithmic growth cells were digested using trypsin and centrifuged at low speed (1,000 rpm). After cell counting, cells were seeded on a 6-well plate, and the number of cells per well was consistent at 500. Cells were blown to distribute them evenly, and they were incubated at 37 °C and 5% CO2 for 10 days. The culture medium was changed every 3–4 days. Ten days later, after washing using PBS, cells were fixed with 4% paraformaldehyde for 20 min, and then completely covered and stained using hematoxylin for 10 min. After removing the hematoxylin dye, the 6-well plate was gently rinsed under slow-running tap water to avoid removing stained cells. The number and size of stained cell clones were observed under an inverted microscope to determine their formation ability. All data were expressed as mean±SE. Each experiment was performed in triplicate.
Transwell Invasion and Migration Test to Detect Changes in Cell Invasion and Migration Ability Before and After Transfection
For the invasion test, Matrigel matrix glue (BD Biosciences, Bedford, MA, USA) was diluted with serum-free medium (dilution ratio 1:7), 50 μL of which was used to evenly cover the upper chamber filter membrane of the Transwell plate, taking care not to produce bubbles, and this was incubated at 37 °C for 2 h until the Matrigel glue had solidified thoroughly. Thereafter, 200 μL cell suspension was added to the upper chamber (approximately 2 × 10⁵ cells). NIH3T3 cells (mouse embryonic fibroblasts) were cultured in a serum-free medium for 24 h. The medium was aspirated and filtered, and 600 μL was added to the lower chamber as chemokine treatment. The Transwell chamber was removed after culturing at 37 °C and 5% CO2 for 24 h. The upper layer of the filter membrane was carefully removed, including non-invaded cells and the residual Matrigel, and then fixed using 95% ethanol for 30 min and stained with crystal violet for 10 min. Five random visual fields were selected and examined using an inverted microscope (BX63F; Olympus, Japan), and the invaded and dyed cells were counted to determine their invasion ability. For the migration test, except for the absence of Matrigel matrix glue, the other operation steps were completely consistent with the invasion test. All data were expressed as mean±SE. Each experiment was performed in triplicate.
Establishment of an in vivo Xenograft Tumor in Nude Mice
BALB/C-nu/nu nude mice were purchased from the National Resource Center for Rodent Laboratory Animal of China, kept in an SPF sterile experimental environment, and regularly fed sterile water and sterilized feed. They were randomly divided into four groups, with five mice in each group. Cell suspensions of Ishikawa-shRNA, Ishikawa control, HEC-1B-shRNA, and HEC-1B control groups, and 1 × 10⁷ cells were subcutaneously injected into the neck and back of nude mice.16,17 Formation and changes in tumor were observed regularly, and the length and width of each animal tumor were measured weekly. After calculating the volume according to the formula: length × width2 × 0.5, the growth curve of tumor formation was constructed with time as the horizontal coordinate and tumor volume as the vertical coordinate. The animal experiments were approved by the Institutional Animal Care and Use Committee of Jilin University. All mouse experimental procedures were performed in accordance with the Regulations for the Administration of Affairs Concerning Experimental Animals approved by the State Council of the People’s Republic of China. The study was carried out in accordance with the principles of the Declaration of Helsinki.
Statistical Analysis
All experimental data were analyzed using Statistical Package for the Social Sciences (SPSS) software version 24.0 0 (SPSS Inc., Chicago, IL, USA). P < 0.05 (two-sided) was considered statistically significant. Measurement data were expressed as “mean ± SE” and analyzed using a t-test (two groups) and one-way ANOVA (three and more groups; between-group tests used SNK or Dunnett’s test). IHC data were expressed in n (%) and analyzed by the Χ2 test or Fisher’s exact test. Survival analysis was performed using the Kaplan–Meier statistical method.
Results
SPARC Expression in Human Normal Endometrial and EC Tissues
The results of the IHC experiments were as follows. The high expression of SPARC in normal endometrial tissue was 89.3%, significantly higher than that in cancer tissues (P < 0.05), as shown in Figure 1 and Table 2. In EC tissue, clinicopathological features, such as differentiation grade, tumor stage, and lymph node metastasis, had a strong impact on the high expression of SPARC (Table 3). The analysis showed that the high expression percentage of SPARC in well-differentiated EC tissue (29.8%) was significantly higher than that in poorly differentiated EC tissue (9.6%, P < 0.05). High expression levels of SPARC decreased with an increase in tumor stage, in which the I and II stages were 27.8%, and the III and IV stages were 10.0%, P < 0.05. Lymph node metastasis increased the possibility of lower expression of SPARC. The high expression rates of SPARC in EC tissues without and with lymph node metastasis were 25.9% and 10.3%, respectively (P < 0.05). Our research used the Oncomine database to compare the differential expression of SPARC between endometrial carcinoma and normal endometrial tissue. Based on the analysis of Oncomine datasets, we found that SPARC copy number in the normal endometrium (25) was 1.019 times higher than that in endometrial endometrioid adenocarcinoma (291), and 1.056 times higher than that in endometrial serous adenocarcinoma (50) (P < 0.05), as shown in Figure 1G. Overall survival was estimated using the Kaplan–Meier statistical method to assess the relationship between SPARC expression and the prognosis of EC patients. According to SPARC high or low expression, EC patients were divided into two groups: 195 patients with low SPARC expression (green line) and 50 patients with high SPARC expression (blue line). The results showed that the survival time of patients in the SPARC high expression group was longer than that in the SPARC low expression group, and the high expression of SPARC indicated a good prognosis for EC patients (Figure 2A).
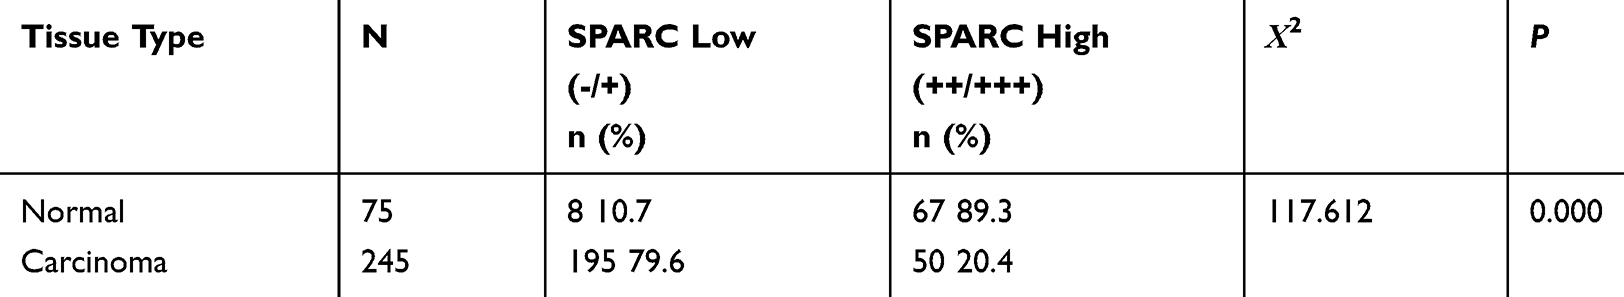 |
Table 2 Expression of SPARC in Normal Endometrial Tissue and Carcinoma Tissue |
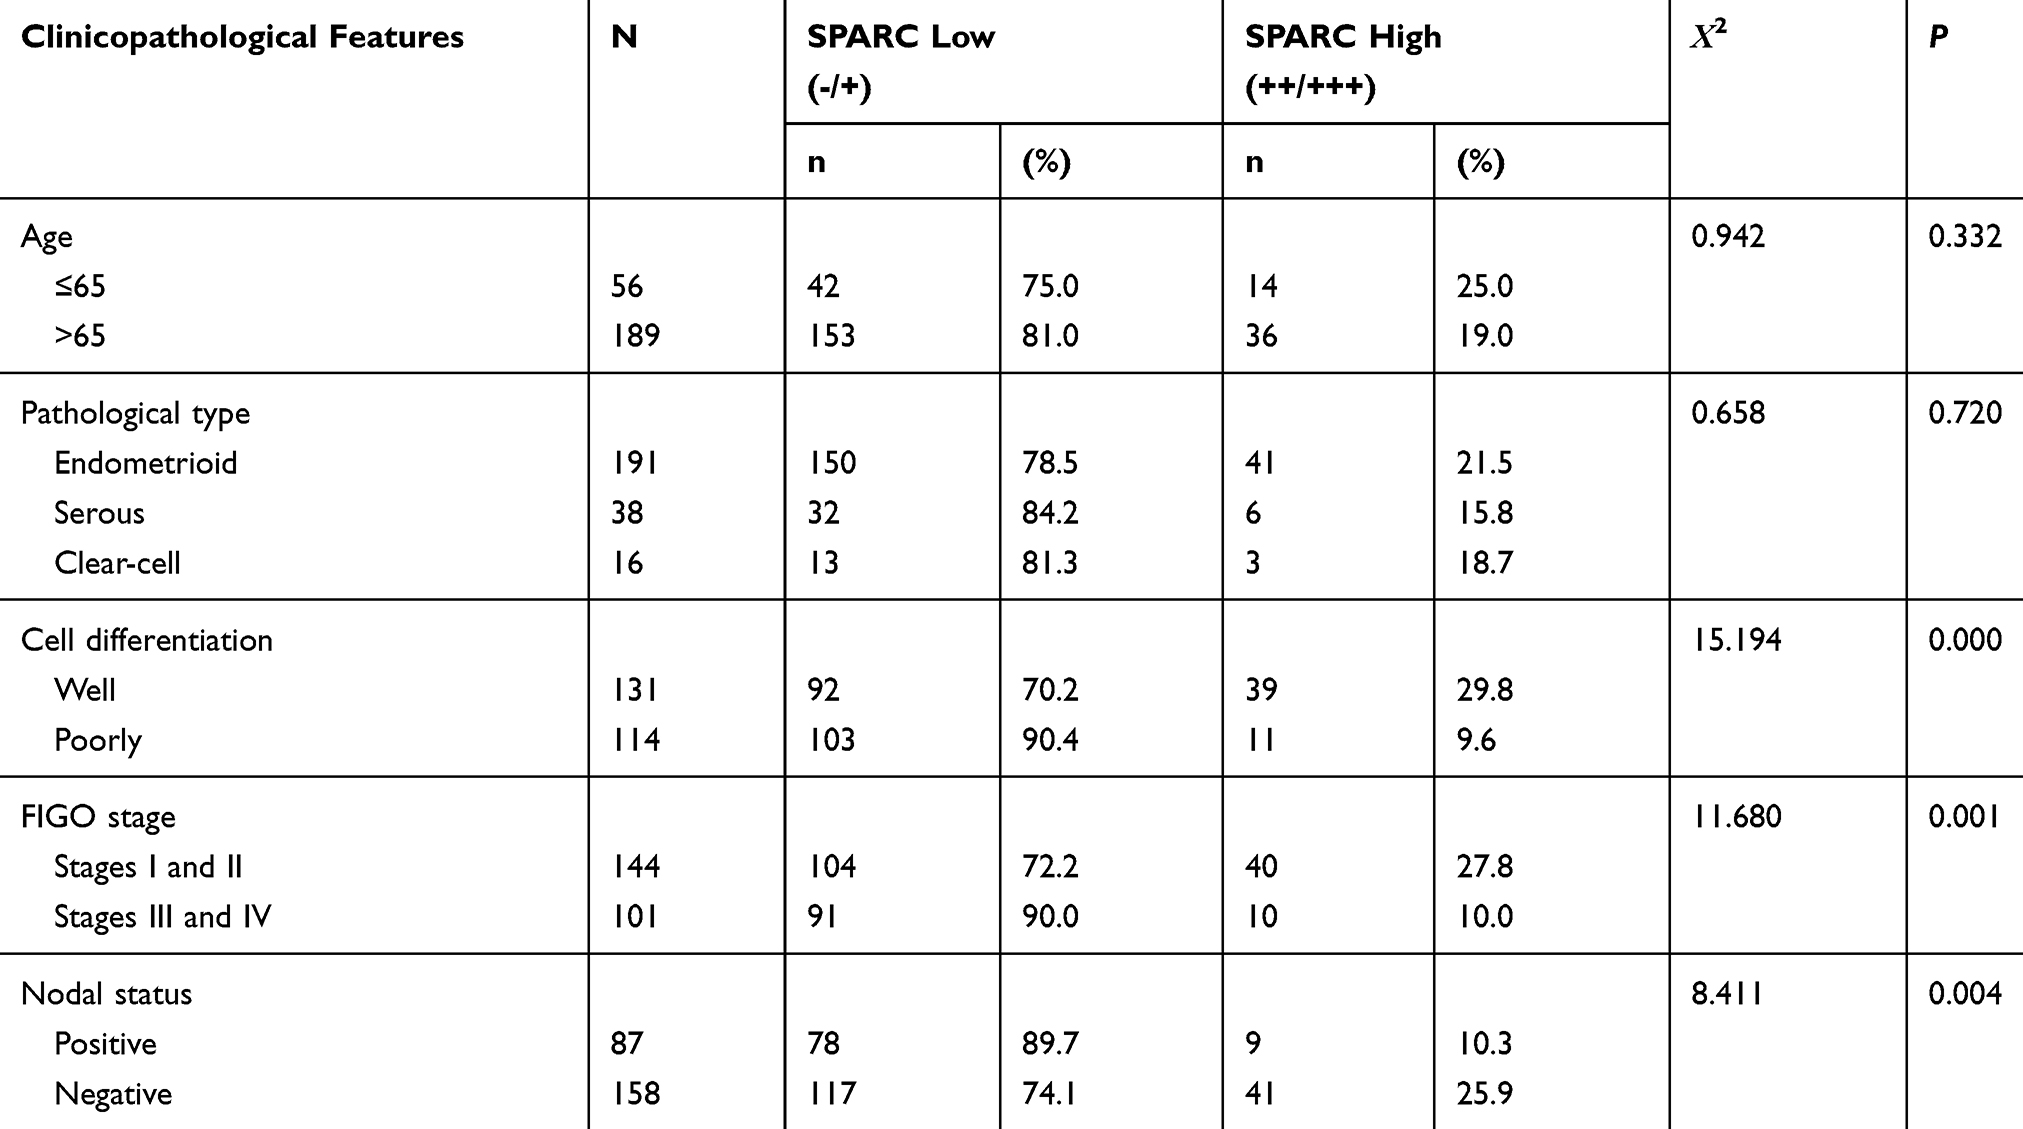 |
Table 3 Relationship Between the Expression of SPARC and Clinicopathological Features of Endometrial Cancer Patients |
 |
Figure 1 Expressions of SPARC in in human endometrial tissues and analysis of the public databases. SPARC expressions of (A) proliferative stage of normal human endometrium, (B) secretory phase of normal human endometrium, (C and D) well-differentiated endometrial carcinoma, (E and F) poorly differentiated endometrial carcinoma were measured by IHC. (Magnification×200). (G) In TCGA Endometrium Statistics of Oncomine, SPARC copy number in normal endometrium (25) was 1.019 times higher than that in endometrial endometrioid adenocarcinoma (291), and 1.056 times higher than that in endometrial serous adenocarcinoma (50) (P<0.05). |
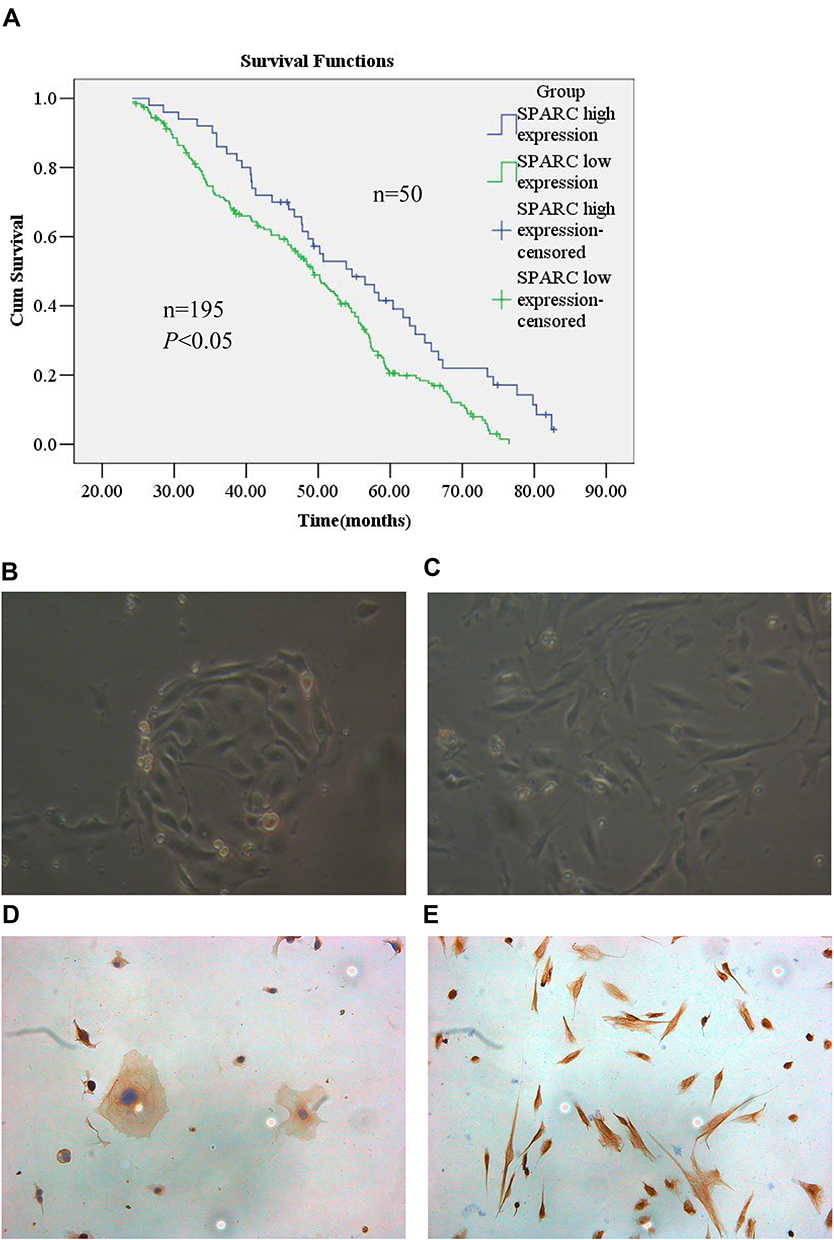 |
Figure 2 Kaplan–Meier analysis and acquisition of endometrial epithelial cells and stromal cells. (A) A total of 245 patients of endometrial carcinoma were included in the cohort. Patients with low SPARC expression (green line, n = 195) had a poor prognosis in contrast with those with high SPARC expression (blue line, n = 50) (P<0.05), and the high expression of SPARC indicated good prognosis in endometrial carcinoma patients. (B) The normal endometrial epithelial cells were spirally arranged and grow in clusters, and the morphology confirmed that the cells were epithelial sources. (C) The normal stromal cells were fusiform and more parallel, and morphologically confirming the interstitial origin. (D) The cytokeratin staining of epithelial cells was positive, showing the cell epithelial origin by ICC identification. (E) The vimentin staining of stromal cells was also positive, indicating the cell interstitial origin by ICC identification (Magnification×200). |
SPARC Expressions in Normal Endometrial Cells and EC Cell Lines
For the primary culture of normal endometrial cells, we found that the endometrial epithelial cells were spirally arranged and grew in clusters (Figure 2B), and the stromal cells were fusiform and more parallel (Figure 2C). Cytokeratin staining of epithelial cells was positive (Figure 2D), and vimentin staining of stromal cells was also positive (Figure 2E). Isolation of normal endometrial cells was confirmed by morphological observation and ICC identification. The results of Western blotting showed that the expression of SPARC in normal endometrial cells was significantly higher than that in four cancer cell lines, Ishikawa, HEC-1B, HEC-1A, and KLE (Figure 3A). The ICC results further confirmed that the expression of SPARC decreased with an increase in cell invasion and proliferation abilities. The KLE cell line had a strong ability to invade and proliferate, but weak SPARC expression, while the invasion and proliferation abilities of Ishikawa cells were weak, but SPARC expression was strong (Figure 3B).18 At the mRNA level, qRT-PCR results were consistent with the results of ICC and Western blotting (Figure 3C). From the above experimental results, we found that the expression of SPARC in normal endometrial tissues and cells was significantly higher than that in EC tissues and cell lines. With the increase in tumor cell malignancy, the expression of SPARC decreased. SPARC expression was negatively correlated with tumor cell invasion and proliferation ability. This study further used RNAi to reduce the expression of SPARC and observe the changes in cell invasion and proliferation ability before and after transfection.
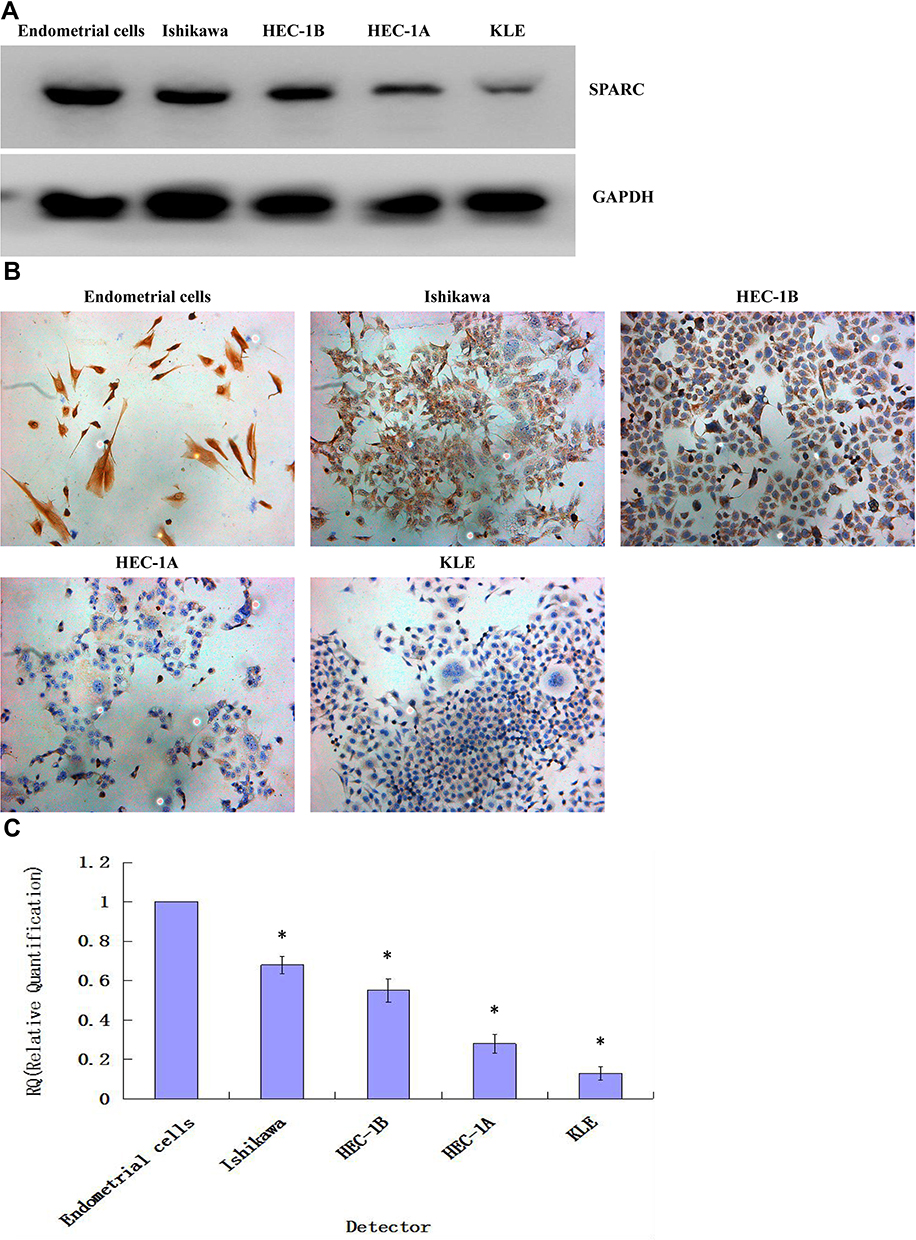 |
Figure 3 Expression of SPARC in normal endometrial cells and 4 endometrial carcinoma cell lines. (A) The protein expressions of SPARC in normal endometrial cells and 4 endometrial carcinoma cell lines (Ishikawa, HEC-1B, HEC-1A and KLE) were measured by Western blotting (cropped blot). (B) The protein expressions of SPARC in normal endometrial cells and 4 endometrial carcinoma cell lines (Ishikawa, HEC-1B, HEC-1A and KLE) were measured by ICC staining. (Magnification×200) (C) The mRNA expressions of SPARC in normal endometrial cells and 4 endometrial carcinoma cell lines (Ishikawa, HEC-1B, HEC-1A and KLE) were measured by qRT-PCR. *P < 0.05. |
Validation of Lentivirus-Mediated SPARC RNAi Transfection Efficiency
The human endometrial cancer cell lines, Ishikawa, HEC-1B, HEC-1A, and KLE, had different invasiveness and SPARC expression levels. Ishikawa and HEC-1B cells showed weak invasiveness and strong SPARC expression, while HEC-1A and KLE showed strong invasiveness and weak SPARC expression. Therefore, we selected Ishikawa and HEC-1B cells with higher SPARC expression to perform RNAi experiments. Using lentivirus-mediated RNAi, the expression of SPARC in Ishikawa and HEC-1B cells was knocked down, and the transfection efficiency was verified by Western blotting (Figure 4A), qRT-PCR (Figure 4B), and ICC (Figure 4C). All three results showed that SPARC expression in SPARC shRNA-transfected Ishikawa and HEC-1B cells was successfully decreased, and there was no significant difference between the negative control group and the non-transfected group, which suggested high efficiency in RNAi experiments and that stable SPARC knockdown cell lines were obtained.
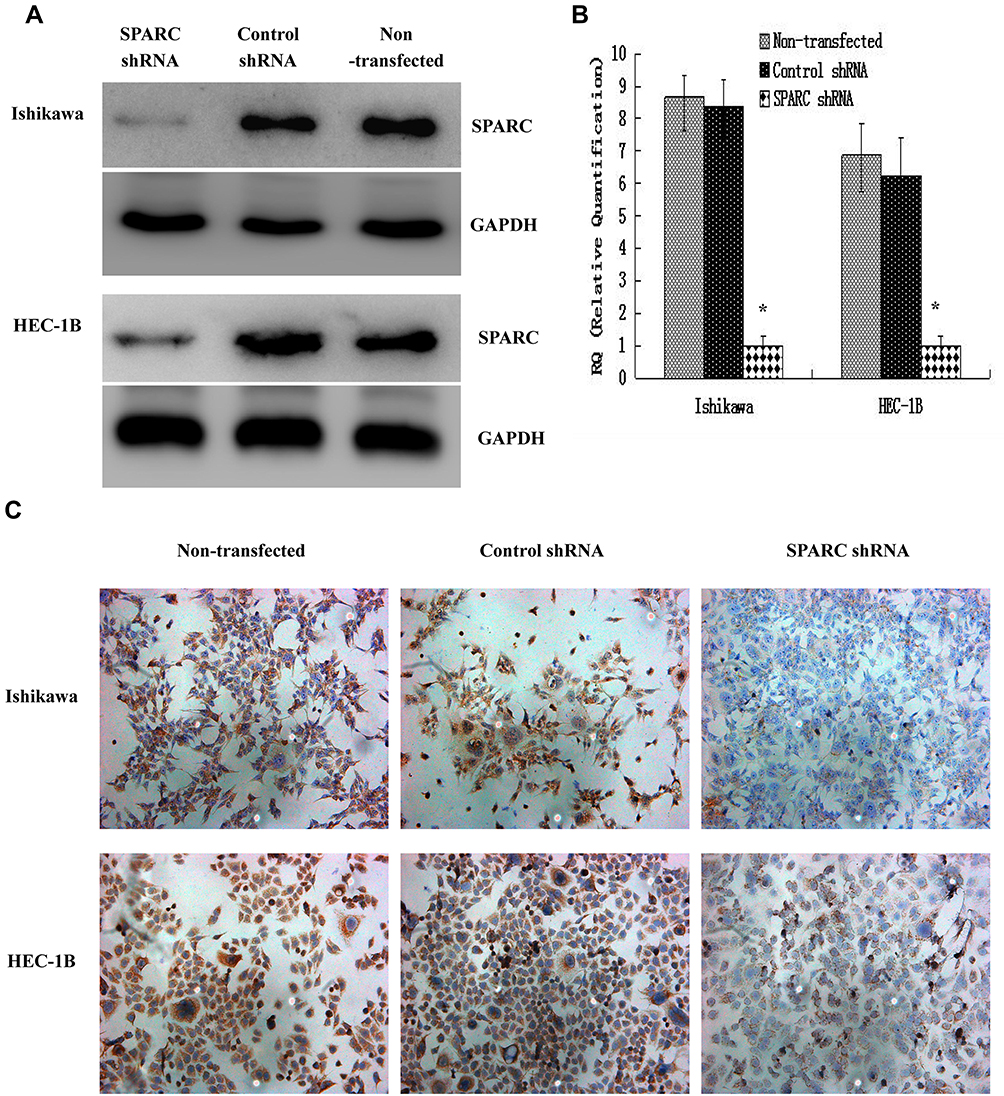 |
Figure 4 Verification of the transfection efficiencies after lentivirus-mediated RNAi in endometrial carcinoma cell lines Ishikawa and HEC-1B.(A) The protein expressions of SPARC in SPARC shRNA transfected, negative control shRNA transfected and non-transfected Ishikawa and HEC-1B cells were measured by Western blotting (cropped blot). (B) The mRNA expressions of SPARC in SPARC shRNA transfected, negative control shRNA transfected and non-transfected Ishikawa and HEC-1B cells were measured by qRT-PCR. (C) The protein expressions of SPARC in SPARC shRNA transfected, negative control shRNA transfected and non-transfected Ishikawa and HEC-1B cells were measured by ICC staining. (Magnification×200). *P < 0.05. |
Changes in Cell Proliferation and Cloning Ability Before and After Transfection
Growth curve results showed (Figure 5A) that after RNAi-silencing SPARC expression, the proliferation rate of SPARC shRNA-transfected Ishikawa and HEC-1B cells was greatly enhanced. For plate cloning formation test, the clone number formed by SPARC shRNA-transfected Ishikawa and HEC-1B cells was significantly higher than in the negative control group and non-transfected group, and there was no significant difference between the negative control group and the non-transfected group (Figure 5B). The images of the clone formation test showed that, regardless of the number or size of clones, SPARC knockdown groups had obvious advantages over the negative control group (Figure 5C). Overall, SPARC knockdown clearly promoted cell growth, proliferation, and cloning ability.
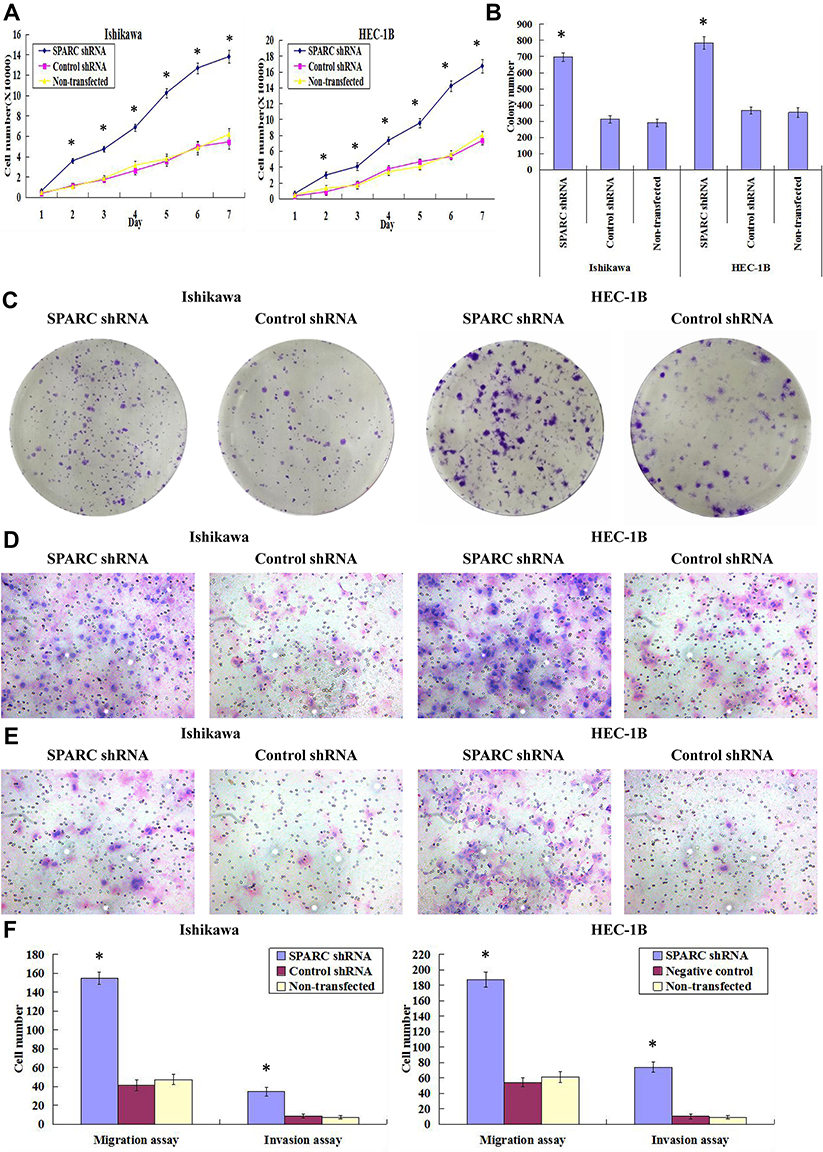 |
Figure 5 Effects of SPARC knockdown on endometrial carcinoma cell proliferation, clonogenicity, migration and invasive activities in vitro. (A) By growth curves, SPARC shRNA-transfected Ishikawa and HEC-1B cells showed faster growth than negative control shRNA transfected and non-transfected Ishikawa and HEC-1B cells. SPARC down-regulation significantly promoted the proliferation of endometrial carcinoma cells. (B) The colony numbers formed by SPARC shRNA-transfected Ishikawa and HEC-1B cells were much more than those formed by the negative control shRNA transfected and non-transfected Ishikawa and HEC-1B cells. (C) Images of colonies formed by SPARC shRNA transfected and negative control shRNA-transfected Ishikawa and HEC-1B cells as examined by plate clone formation assay, which indicated that SPARC knockdown distinctly increased the colony-forming capacities of endometrial carcinoma cells. (D) Images of cell migration assay performed in SPARC shRNA transfected and negative control shRNA-transfected Ishikawa and HEC-1B cells as examined by Boyden chambers without Matrigel, which revealed that SPARC knockdown promoted the migrating abilities of endometrial carcinoma cells. (E) Images of cell invasion assay performed in SPARC shRNA transfected and negative control shRNA-transfected Ishikawa and HEC-1B cells as examined by Boyden chambers coated with Matrigel, which demonstrated that SPARC down-regulation promoted invasion abilities of endometrial carcinoma cells. (F) With the down-regulation of SPARC, more cells migrated through the PVPF membrane or invaded through the Matrigel in the SPARC shRNA-transfected group than that in the control group. SPARC down-regulation promoted invasion and migration abilities of endometrial carcinoma cells. (Magnification×200). *P < 0.05. |
Changes in Cell Apoptosis Ability Before and After Transfection
The total apoptosis rates of SPARC shRNA-transfected and control shRNA-transfected cells in the Ishikawa group were 16.3% (Q2: 12.7%, Q4: 3.6%) and 27.6% (Q2: 20.0%, Q4: 7.6%), respectively (Figure 6A). Similarly, the total apoptosis rates of SPARC shRNA-transfected and control shRNA-transfected cells in HEC-1B group were 19.4% (Q2: 14.1%, Q4: 5.3%) and 27.4% (Q2: 20.7%, Q4: 6.7%), respectively (Figure 6B). The apoptosis rate of SPARC shRNA-transfected cells was significantly inhibited after reducing the expression of SPARC in Ishikawa and HEC-1B cells (Figure 6C). SPARC expression was related to the apoptotic ability of EC cells, and SPARC knockdown inhibited the apoptosis of Ishikawa and HEC-1B cells.
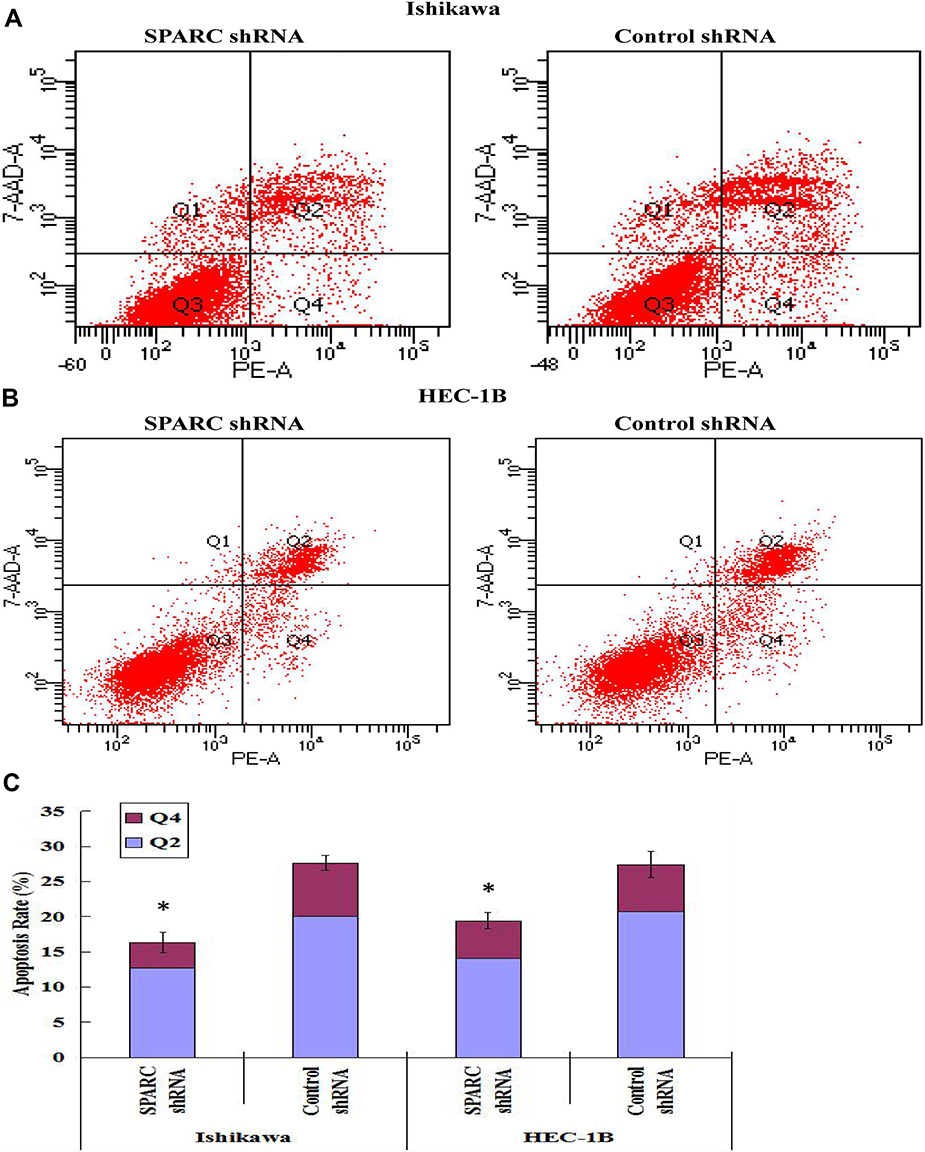 |
Figure 6 Effects of SPRAC down-regulation on cell apoptosis. Cell apoptosis was detected using flow cytometry, Q1: cell debris, Q2: late apoptotic cells, Q3: normal growing cells, Q4: early apoptotic cells. (A) The total apoptosis rates of SPARC shRNA transfected and control shRNA-transfected cells in Ishikawa group were 16.3% (Q2:12.7%, Q4:3.6%) and 27.6% (Q2:20.0%, Q4:7.6%), separately. (B) The total apoptosis rates of SPARC shRNA transfected and control shRNA-transfected cells in HEC-1B group were 19.4% (Q2:14.1%, Q4:5.3%) and 27.4% (Q2:20.7%, Q4:6.7%), separately. (C) The apoptosis rate of SPARC shRNA-transfected cells was significantly inhibited after reducing the expression of SPARC in Ishikawa and HEC-1B cells. *P< 0.05. |
Changes in Cell Invasion and Migration Capacity Before and After Transfection
The Transwell invasion test examined the ability of cells to invade the Matrigel matrix glue coating microporous membranes, and the Transwell migration test examined the ability of cells to move through the microporous membranes. After RNAi-silencing SPARC expression, the invasion abilities of the SPARC knockdown groups were greatly improved, with more cells invading through the Matrigel coating membranes (Figure 5D). At the same, the migration abilities of SPARC knockdown groups were also obviously increased with more cells migrating through the membranes (Figure 5E). The average migrating and invading cell numbers of SPARC shRNA-transfected Ishikawa and HEC-1B cells were much higher than those of non-transfected and negative control cells, and no significant differences were found between the non-transfected group and negative control group (Figure 5F). In summary, knockdown of SPARC distinctly elevated the invasion and migration abilities of EC cells.
Effects of SPARC on Tumor Growth in vivo
SPARC-shRNA-transfected Ishikawa cells, control-shRNA-transfected Ishikawa cells, SPARC-shRNA transfected HEC-1B cells, and control-shRNA transfected HEC-1B cells were introduced subcutaneously in five nude mice, described as Ishikawa-shRNA, Ishikawa control, HEC-1B-shRNA, and HEC-1B control groups. After the inoculation of 1 × 10⁷ cells for 8 weeks, the tumor formation rates for the HEC-1B-shRNA and HEC-1B control groups were 100%, but there were significant differences in tumor volume and growth speed between the two groups. The SPARC knockdown group showed rapid tumor growth with a larger tumor volume than the control group. The tumor formation rate in the Ishikawa control group was only 60%. However, for the Ishikawa-shRNA group, the tumor formation rate was 100%. Furthermore, the average tumor volume in the SPARC knockdown group was much larger than that of the control group (Figure 7A). The tumors formed by the Ishikawa control group and HEC-1B control group were nodular, oval-shaped, and smaller, with clear boundaries easily separated from surrounding tissue. However, the tumors of the SPARC knockdown group were larger and polygonal, with the adhesive boundary not easily separated from the surrounding tissue (Figure 7B). In summary, SPARC knockdown promoted tumor formation and growth in vivo.
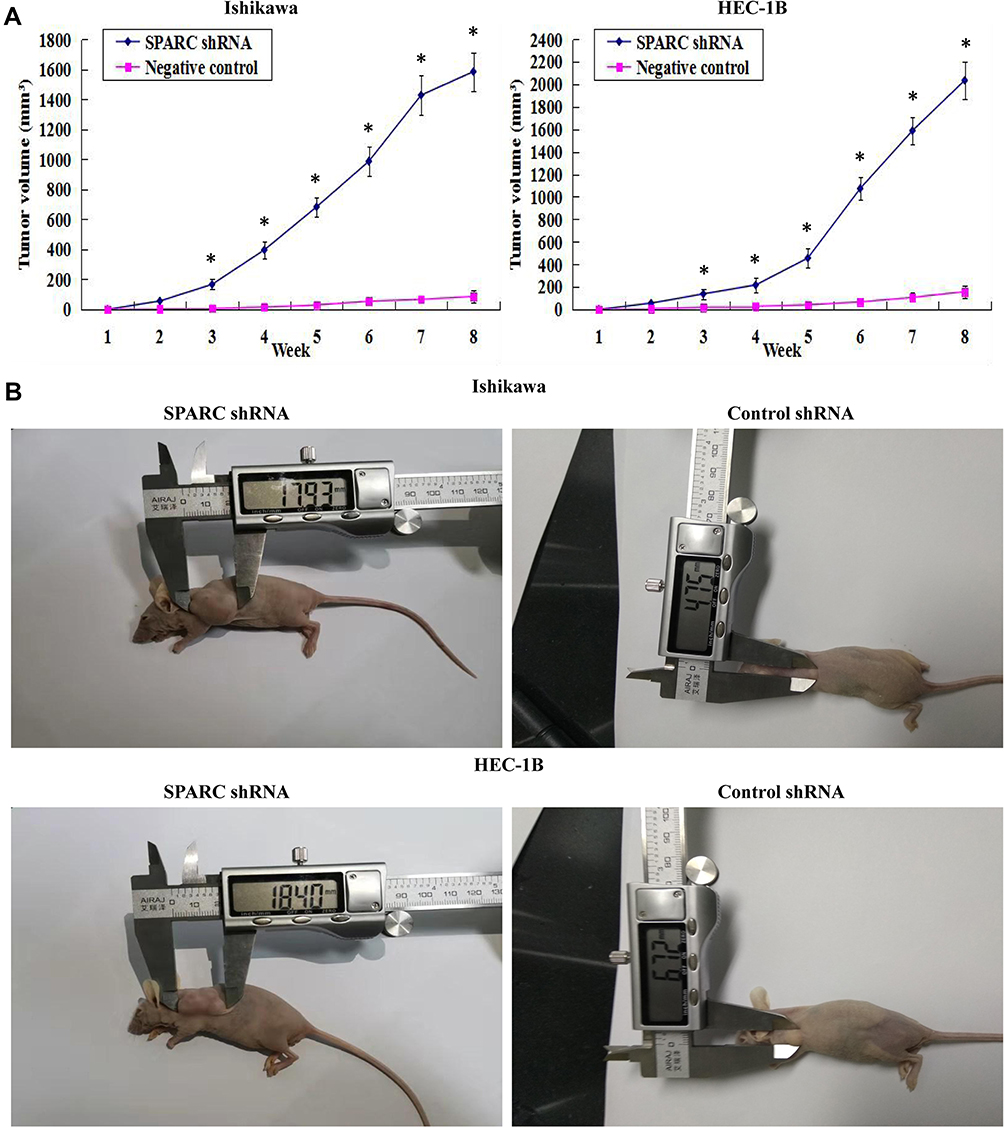 |
Figure 7 Effects of SPRAC down-regulation on tumor growth in vivo. (A) The growth tumors profile of SPARC shRNA and negative control shRNA-transfected Ishikawa and HEC-1B cells were observed continuously for 8 weeks. The SPARC shRNA-transfected group showed a clearly rapid growth in both tumor size and growth rate in vivo. (B) Images of xenotransplantation tumor after subcutaneous inoculation of SPARC shRNA and negative control shRNA-transfected Ishikawa and HEC-1B cells, which showed that the subcutaneous tumors formed by SPARC shRNA-transfected Ishikawa and HEC-1B cells were much larger than those formed by the negative control shRNA-transfected cells. SPARC knockdown could promote tumor formation and growth in vivo. *P<0.05. |
Effects of SPARC on Epithelial-to-Mesenchymal Transition Genes and Matrix Metalloproteases
Epithelial-to-mesenchymal transition (EMT) refers to the process by which epithelial cells lose the adhesion function and normal polarity to obtain mesenchymal cell morphology, anti-apoptosis ability, and high invasion and metastasis ability.19 EMT plays an important role in the occurrence and development of EC.20 Matrix metalloproteases (MMPs) are not only related to matrix remodeling, cancer invasion, and angiogenesis but also to all stages of cancer from initiation to the outgrowth of clinically relevant metastases.21 Through the above experiments, we concluded that SPARC knockdown improved the proliferation and invasion ability of EC cells in vitro and in vivo. Therefore, we speculated whether SPARC knockdown could affect EMT genes and MMPs (MMP2, MMP9, MMP3, and MMP13). Western blotting (Figure 8A) and qRT-PCR (Figure 8B) were used to detect the EMT gene and MMP expression changes before and after transfection. The results showed that after RNAi-silencing SPARC expression, the expression of E-cadherin, an epithelial marker, decreased, and expression of the mesenchymal markers N-cadherin and vimentin increased. Furthermore, expression of the transcription suppressors Snail, Slug, and Twist were upregulated, and the expression of MMP3, MMP2, and MMP9 also increased with the decrease in SPRAC expression and the enhancement of cell invasion ability. There was no significant difference in MMP13 expression between the SPARC shRNA-transfected group and the negative control group. SPARC knockdown had the effect of promoting EMT course and strengthening the expression of MM3, MMP2 and MMP9. TGF-β is a well-known mediator of EMT and cancer metastasis.22 We also examined changes in TGF-β expression after SPARC knockdown at the mRNA and protein levels. There was no significant change in TGF-β expression between the SPARC shRNA-transfected group and the negative control group. Regarding the role of SPARC in the EMT process and regulating the proliferation, migration, and invasion of endometrial cancer cells, it appears there are other mechanisms that require further experimental exploration.
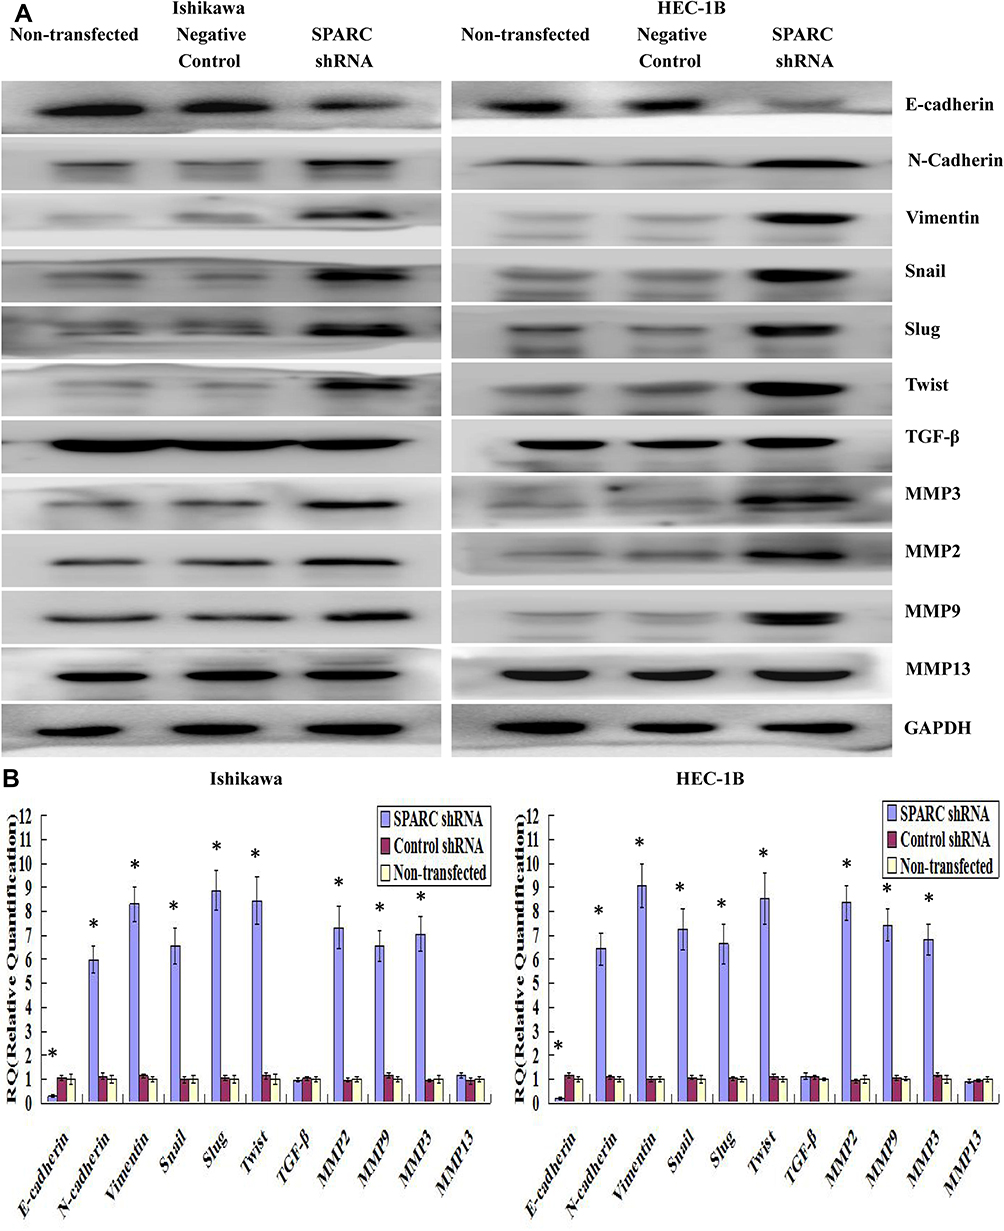 |
Figure 8 Effects of SPARC knockdown on the EMT-related genes and MMPs. (A) By Western blotting (cropped blot), EMT markers, including E-cadherin, N-cadherin, vimentin, Snail, Slug and Twist, and MMPs (MMP2, MMP9, MMP3 and MMP13) were measured in SPARC shRNA transfected, negative control shRNA transfected and non-transfected Ishikawa and HEC-1B cells. SPARC knockdown significantly decreased the expression of E-cadherin, and increased the expression of N-cadherin, Vimentin, Snail, Slug, Twist, MMP3, MMP2 and MMP9, at protein levels. And there was no significant difference in MMP13 and TGF-β expression between SPARC shRNA-transfected group and negative control group. (B) By qRT-PCR, we confirmed that SPARC down-regulation repressed the expression of E-cadherin, and enhanced the expression of N-cadherin, Vimentin, Snail, Slug, Twist, MMP3, MMP2 and MMP9, at mRNA levels. And three was also no significant change in MMP13 and TGF-β expression between SPARC shRNA-transfected group and negative control group. The process of EMT was significantly promoted by SPARC down-regulation. *P < 0.05. |
Discussion
The results of our experiments showed that the expression of SPARC in normal endometrial cells and tissues is much higher than that in EC cells and tissues. Meanwhile, its low expression in EC tissues with advanced clinical stage, poor differentiation, and positive lymph node metastasis suggests that SPARC is closely related to the malignant clinicopathological characteristics of EC. Using lentivirus-mediated RNAi, the effects of SPARC knockdown on the proliferation and invasion abilities of EC cells were explored in vitro and in vivo. SPARC plays an inhibitory role in EC progression, and its high expression indicates a good prognosis for EC patients. SPARC knockdown promoted the process of EMT and improved the proliferation and invasion abilities of EC cells.
The processes of tumorigenesis, invasion, and metastasis involve cell-cell and cell-matrix interactions, during which SPARC plays an important role. Recent studies have shown that the role of SPARC in various cancers is different and has tissue specificity, and even in the same carcinoma, the role of SPARC was paradoxical, acting as a tumor suppressor or an oncogene, which implies that the function of SPARC in these tumors may be multidimensional. In prostate cancer (PCa), some researchers found that SPARC was highly expressed in PCa tissues, and through stable knockdown and overexpression of SPARC in PC3 and LNCaP cells, endogenous SPARC induced EMT and enhanced cancer cell migration and invasion.23 In contrast, in other studies, SPARC protein was expressed well in normal tissue compared with PCa tissue, and exogenous SPARC decreased PCa cell proliferation and migration.24 SPARC expression was decreased in PCa cell lines because of hypermethylation of the SPARC promoter, and SPARC hypermethylation was correlated with a poorer prognosis in PCa patients.25 In colorectal cancer (CRC), high stromal SPARC indicated poor prognosis in CRC patients, and fibroblast-derived SPARC enhanced tumor cell invasion;26 however, other studies revealed that low expression of SPARC in CRC tissue is associated with poor prognosis and aggressive clinicopathological features.27,28 In studying the relationship between SPARC and gynecological tumors, we also found contradictory results. SPARC was markedly downregulated in ovarian carcinomas and acts as a tumor suppressor inhibiting angiogenesis and lymphangiogenesis.29,30 However, other studies have found that SPARC is overexpressed in ovarian cancer tissues and plays an important role in ovarian cancer growth, apoptosis, and metastasis.31,32 In a cervical carcinoma study, SPARC was over-expressed and significantly associated with poor prognostic clinicopathological characteristics, and played an important role in promoting the growth and metastasis of cervical cancer cells.33,34 In EC studies, there are also contradictory reports that SPARC could be highly or weakly expressed in EC tissues. Yusuf et al found that SPARC was overexpressed in endometrial cancer stem cells (CSCs) and EC tissues (including 58 EC patients), and SPARC knockdown decreased the migration activity of Ishikawa-SPARC cells and had no effect on the invasion activity. However, they also found that SPARC over-expression inhibited subcutaneous tumor growth in nude mice.35 The promotion of tumor cell migration and inhibition of tumor cell growth by SPARC is a paradox. Another study showed the opposite result, in that, compared to normal endometrial tissue, both SPARC mRNA and protein expression were decreased in EC tissues, which could be caused by abnormal hypermethylation of its CpG-rich region. However, further immunohistochemistry experiments revealed that SPARC is highly expressed in the stromal fibroblasts of EC tissue (including 29 EC patients), in contrast with the negative neoplastic epithelium, which seemed to contradict the results of Western blotting analysis.36 The difference in expression of ECM genes between nine normal endometrial tissues and 40 EC specimens was compared by microarray hybridization. The results showed that the expression of the fibronectin and SPARC genes decreased in EC tissues.37 Given the small number of clinical cases in the above studies, we expanded the sample size (including 245 EC specimens and 75 normal endometrial tissues) to obtain stable and consistent results. SPARC expression in EC cell lines and normal endometrial cells were also included in the experimental plan to further validate the expression of SPARC at the cellular level. In our study, SPARC was highly expressed in normal endometrial tissue, including endometrial cells and stromal cells, and low expression of SPARC was found both in tumor cells and stromal cells of EC tissue. There was no significant difference in SPARC expression between cancer cells and stromal cells. We also draw the same conclusion based on TCGA endometrial statistics, that SPARC gene expression is lower in endometrial endometrioid adenocarcinoma and endometrial serous adenocarcinoma than in normal endometrium. Moreover, the low expression of SPARC was positively correlated with poor clinicopathological features and prognosis of EC. To further support our conclusions, SPARC expression in normal endometrial cells and four EC cell lines were examined by qRT-PCR, Western blotting, and ICC. The results were consistent with our conclusions from the IHC experiment, in that SPARC expression in four EC cell lines was significantly lower than that in normal endometrial cells, and SPARC expression was lowest in the most invasive and metastatic KLE cells. The paradoxical role of SPARC as a tumor suppressor or oncogene may be due to the specific microenvironment of each human cancer, or because SPARC comes from different sources. We suspect that tumor-cell-derived SPARC and interstitial-cell-derived SPARC may play the same role. SPARC, as a secretory protein, can enter the blood circulation system of patients and can be detected by enzyme-linked immunosorbent assay (ELISA), although the serum of the experimental group was not collected in this study, and no research was carried out in this regard. However, by consulting the current literature, we found that SPARC can act as a serum prognostic indicator, and the detection of serum SPARC can be beneficial for the early diagnosis of tumors. Circulating SPARC had prognostic value in malignant pleural mesothelioma (MPM); the median survival was longer in patients with low SPARC than in those with high SPARC, and further multivariate analyses revealed that serum SPARC remained an independent predictor.38 The serum level of SPARC in melanoma was found to be higher than that in healthy people, and combined detection of serum GPC3 and SPARC enabled us to diagnose melanoma patients at an early stage.39 In hepatocellular carcinoma (HCC), similar results showed that the serum levels of SPARC and THBS2 in HCC patients were both significantly higher than those in healthy controls, and the combined detection of serum SPARC and THBS2 could distinguish HCC patients from healthy individuals.40 Overall, the reported roles of SPARC as a matricellular protein in tumorigenesis are somewhat contradictory and not fully elucidated. Additional research is required, especially to identify proteins that interact with SPARC, which might explain its complexity.
EMT is involved in embryogenesis, wound healing, and tumor malignant progression. Normally, the cells of the epithelial layer exhibit top-base polarity and are connected by tight and adhesive connections. Adhesive junctions are formed by E-cadherin, which is important for the integrity of the epithelial layer structure. After EMT activation, the expression of E-cadherin is inhibited, resulting in the loss of polygon, pebble morphology of typical epithelial cells, and the acquisition of spindle-shaped mesenchymal morphology. The markers related to mesenchymal cell status, especially N-cadherin and vimentin are significantly increased. EMT promotes tumorigenesis and metastasis and increases tumor tolerance to clinical intervention.41 There are also contradictory results regarding the role of SPARC in EMT. Some researchers have reported that SPARC plays a promotional role during EMT in melanoma, lung cancer, and head and neck cancer. SPARC stimulates melanocyte motility and promotes EMT-associated melanoma cell invasion with down-regulation of E-cadherin; conversely, SPARC depletion leads to the up-regulation of E-cadherin.42,43 SPARC contributes to tumor development by promoting the migration and EMT of the lung cancer cells A549 and H1299.44 Exogenous SPARC treatment promotes the migration and EMT phenotype in the non-small cell lung cancer cell lines CL1-5 and H1299.45 SPARC treatment promotes cell proliferation and migration in the head and neck cancer cell lines FaDu and Detroit 562, and enhances the EMT signaling pathway via activation of AKT.46 In hepatocellular carcinoma (HCC), SPARC over-expression enhances the ability of cancer cells to form tumorspheres and promotes the migration and EMT in HCC cells.47 However, there are also contrary reports that with adenovirus infection in the HCC cells HepG2, Hep3B and Huh7, SPARC over-expression inhibits spheroid growth, decreases the clonogenic and migratory capabilities of HCC cells, increases E-cadherin expression, and decreases N-cadherin expression.48 The reported relationship between SPARC and MMPs is also contradictory. Some studies have suggested that SPARC promotes the expression and activity of MMPs, while others have suggested that SPARC inhibits the expression and activity of MMPs. SPARC up-regulates MT1-MMP levels and MMP-2 activity in U87MG glioma cells.49 SPARC promotes the proliferation and metastasis of hepatocellular carcinoma by regulating the ERK1/2-MMP2/9 signaling pathway.50 In contrast, SPARC overexpression suppresses angiogenesis by down-regulating the expression of VEGF and MMP-7 in gastric cancer,51 and SPARC suppresses the invasion and migration of gastric cancer cells by reducing MMP-7 and MMP-9 expression.52 Overexpression of SPARC decreases angiogenesis and tumor growth in an orthotopic tumor model, and inhibits the expressions of MMP-9 and VEGF.53 In summary, the relationship between SPARC and MMPs is consistent with the role of SPARC in cancer progression. The tumor microenvironment determines the functions of genes. In different tumor microenvironments, the role of SPARC is also different, and may be inhibitory or promoting.54 Our research is the first to uncover the relationship between SPARC and EMT in the development of EC. Previous studies on the relationship between SPARC and EC, in which SPARC was considered an oncogene or a tumor suppressor gene, have not explored the role of SPARC in the EMT process. In our study, SPARC downregulation enhanced the migration and invasion abilities of EC cells in vitro and in vivo; therefore, we believe that SPARC plays an important role in the EMT process of EC. Further experiments confirmed our speculation that SPARC knockdown remarkably decreases the expression of the epithelial marker E-cadherin; increases the expression of the mesenchymal markers N-cadherin and vimentin, and the transcription factors Snail, Slug, and Twist; and enhances the expression of MM3, MMP2, and MMP9 in the EC cell lines Ishikawa and HEC-1B, at both the mRNA and protein level. In conclusion, the role of SPARC in the EMT process was consistent with its role in tumor progression, either in promotion or inhibition. Similarly, the role of SPARC in tumor cell apoptosis was also consistent with its role in tumor progression. In colorectal cancer, SPARC was reported to potentiate apoptosis by augmenting the signaling cascade in a caspase-8-dependent manner or by disturbing the activity of Bcl-2.55,56 In gastric cancer, and cervical and ovarian carcinoma, SPARC inhibits cell apoptosis and causes cell cycle arrest.32,33,57 In our study, SPARC knockdown remarkably inhibited cell apoptosis, which was consistent with its ability to promote proliferation and invasion of endometrial cancer cells. Some researchers believe that further studies on truncated, alternative splicing variants and signal peptides of SPARC might elucidate its unique function in different cancers.10 In future studies, we will focus on the upstream and downstream signal pathways of SPARC in EC progression, as well as the characterization of its intracellular and extracellular binding proteins, in an attempt to understand its complex roles.
Conclusion
Our study suggested that the low expression of SPARC was related to the aggressive phenotype of EC cells and poor prognosis in EC patients. Moreover, SPARC knockdown promoted the process of EMT and improved the proliferation and invasion abilities of EC cells. Our study provides a glimpse into the biological mechanism of SPARC in EC invasion and metastasis and might help to identify new therapeutic strategies to improve the prognosis of EC patients.
Data Sharing Statement
All data generated or analyzed during this study are included in this published article.
Ethics Approval and Consent to Participate
This study was approved by the Medical Ethics Committee of Human and Animal Institution of Jilin University. All methods were performed in accordance with the relevant guidelines and regulations. The written informed consents were obtained from all patients involved in this study. All mouse experimental procedures were performed in accordance with the Regulations for the Administration of Affairs Concerning Experimental Animals approved by the State Council of People’s Republic of China. The study was carried out in accordance with the principles of the Declaration of Helsinki.
Consent for Publication
We obtained consents for publication from the participants.
Disclosure
The authors declare they have no conflict of interest.
References
1. Braun MM, Overbeek-Wager EA, Grumbo RJ. Diagnosis and management of endometrial cancer. Am Fam Physician. 2016;93(6):468–474.
2. Siegel RL, Miller KD, Jemal A. Cancer statistics, 2018. CA Cancer J Clin. 2018;68:7–30. doi:10.3322/caac.21442
3. Moore K, Brewer MA. Endometrial cancer: is this a new disease? Am Soc Clin Oncol Educ Book. 2017;37:435–442. doi:10.14694/EDBK_175666
4. Siegel RL, Miller KD, Jemal A. Cancer statistics, 2017. CA Cancer J Clin. 2017;67:7–30. doi:10.3322/caac.21387
5. Brooks RA, Fleming GF, Lastra RR, et al. Current recommendations and recent progress in endometrial cancer. CA Cancer J Clin. 2019;69(4):258–279.
6. Sullivan SA, Rossi EC. Sentinel lymph node biopsy in endometrial cancer: a new standard of care? Curr Treat Options Oncol. 2017;18(10):62. doi:10.1007/s11864-017-0503-z
7. Termine JD, Kleinman HK, Whitson SW, Conn KM, McGarvey ML, Martin GR. Osteonectin, a bone-specific protein linking mineral to collagen. Cell. 1981;26:99–105. doi:10.1016/0092-8674(81)90037-4
8. Porter PL, Sage EH, Lane TF, Funket SE, Gown AM. Distribution of SPARC in normal and neoplastic human tissue. J Histochem Cytochem. 1995;43(8):791–800. doi:10.1177/43.8.7622842
9. Zhao P, Wang Y, Wu A, Rao Y, Huang Y. Roles of albumin-binding proteins in cancer progression and biomimetic targeted drug delivery. Chembiochem. 2018;19(17):1796–1805. doi:10.1002/cbic.201800201
10. Feng J, Tang L. SPARC in tumor pathophysiology and as a potential therapeutic target. Curr Pharm Des. 2014;20(39):6182–6190. doi:10.2174/1381612820666140619123255
11. Rhodes DR, Yu J, Shanker K, et al. ONCOMINE: a cancer microarray database and integrated data-mining platform. Neoplasia. 2004;6(1):1–6. doi:10.1016/S1476-5586(04)80047-2
12. Liu W, Ouyang S, Zhou Z, et al. Identification of genes associated with cancer progression and prognosis in lung adenocarcinoma: analyses based on microarray from oncomine and the cancer genome atlas databases. Mol Genet Genomic Med. 2019;7(2):e00528.
13. Jividen K, Movassagh MJ, Jazaeri A, Li H. Two methods for establishing primary human endometrial stromal cells from hysterectomy specimens. J Vis Exp. 2014;87:e51513.
14. Soumaoro LT, Uetake H, Higuchi T, Takagi Y, Enomoto M, Sugihara K. Cyclooxygenase-2 expression: a significant prognostic indicator for patients with colorectal cancer. Clin Cancer Res. 2004;10:8465–8471. doi:10.1158/1078-0432.CCR-04-0653
15. Livak KJ, Schmittgen TD. Analysis of relative gene expression data using real-time quantitative PCR and the 2(‐delta delta C (T)) method. Methods. 2001;25:402–408. doi:10.1006/meth.2001.1262
16. Gu CJ, Xie F, Zhang B, et al. High glucose promotes epithelial-mesenchymal transition of uterus endometrial cancer cells by increasing ER/GLUT4-mediated VEGF secretion. Cell Physiol Biochem. 2018;50(2):706–720. doi:10.1159/000494237
17. Zhang Y, Xu F, Liang H, et al. Exenatide inhibits the growth of endometrial cancer Ishikawa xenografts in nude mice. Oncol Rep. 2016;35(3):1340–1348. doi:10.3892/or.2015.4476
18. Qu W, Zhao Y, Wang X, et al. Culture characters, genetic background, estrogen/progesterone receptor expression, and tumorigenic activities of frequently used sixteen endometrial cancer cell lines. Clin Chim Acta. 2019;489:225–232. doi:10.1016/j.cca.2018.08.013
19. Puisieux A, Brabletz T, Caramel J. Oncogenic roles of EMT-inducing transcription factors. Nat Cell Biol. 2014;16(6):488–494. doi:10.1038/ncb2976
20. Franceschi T, Durieux E, Morel AP, et al. Role of epithelial-mesenchymal transition factors in the histogenesis of uterine carcinomas. Virchows Arch. 2019;475(1):85–94. doi:10.1007/s00428-019-02532-w
21. Shay G, Lynch CC, Fingleton B. Moving targets: emerging roles for MMPs in cancer progression and metastasis. Matrix Biol. 2015;44–46:200–206. doi:10.1016/j.matbio.2015.01.019
22. Hao Y, Baker D, Ten Dijke P. TGF-β-mediated epithelial-mesenchymal transition and cancer metastasis. Int J Mol Sci. 2019;20(11):2767. doi:10.3390/ijms20112767
23. López-Moncada F, Torres MJ, Castellón EA, Contreras HR. Secreted protein acidic and rich in cysteine (SPARC) induces epithelial-mesenchymal transition, enhancing migration and invasion, and is associated with high Gleason score in prostate cancer. Asian J Androl. 2019;21(6):557–564. doi:10.4103/aja.aja_23_19
24. Shin M, Mizokami A, Kim J, et al. Exogenous SPARC suppresses proliferation and migration of prostate cancer by interacting with integrin β1. Prostate. 2013;73(11):1159–1170. doi:10.1002/pros.22664
25. Liu T, Qiu X, Zhao X, et al. Hypermethylation of the SPARC promoter and its prognostic value for prostate cancer. Oncol Rep. 2018;39(2):659–666.
26. Drev D, Harpain F, Beer A, et al. Impact of fibroblast-derived SPARC on invasiveness of colorectal cancer cells. Cancers (Basel). 2019;11(10):1421. doi:10.3390/cancers11101421
27. Liu QZ, Gao XH, Chang WJ, et al. Secreted protein acidic and rich in cysteine expression in human colorectal cancer predicts postoperative prognosis. Eur Rev Med Pharmacol Sci. 2015;19(10):1803–1811.
28. Liang JF, Wang HK, Xiao H, et al. Relationship and prognostic significance of SPARC and VEGF protein expression in colon cancer. J Exp Clin Cancer Res. 2010;29(1):71. doi:10.1186/1756-9966-29-71
29. Yiu GK, Chan WY, Ng SW, et al. SPARC (secreted protein acidic and rich in cysteine) induces apoptosis in ovarian cancer cells. Am J Pathol. 2001;159(2):609–622. doi:10.1016/S0002-9440(10)61732-4
30. Peng F, Zhong Y, Liu Y, et al. SPARC suppresses lymph node metastasis by regulating the expression of VEGFs in ovarian carcinoma. Int J Oncol. 2017;51(6):1920–1928. doi:10.3892/ijo.2017.4168
31. Paley PJ, Goff BA, Gown AM, Greer BE, Sage EH. Alterations in SPARC and VEGF immunoreactivity in epithelial ovarian cancer. Gynecol Oncol. 2000;78(3Pt1):336–341. doi:10.1006/gyno.2000.5894
32. Chen J, Wang M, Xi B, et al. SPARC is a key regulator of proliferation, apoptosis and invasion in human ovarian cancer. PLoS One. 2012;7(8):e42413. doi:10.1371/journal.pone.0042413
33. Chen J, Shi D, Liu X, Fang S, Zhang J, Zhao Y. Targeting SPARC by lentivirus-mediated RNA interference inhibits cervical cancer cell growth and metastasis. BMC Cancer. 2012;12:464. doi:10.1186/1471-2407-12-464
34. Shi D, Jiang K, Fu Y, Fang R, Liu XI, Chen J. Overexpression of SPARC correlates with poor prognosis in patients with cervical carcinoma and regulates cancer cell epithelial-mesenchymal transition. Oncol Lett. 2016;11(5):3251–3258. doi:10.3892/ol.2016.4399
35. Yusuf N, Inagaki T, Kusunoki S, et al. SPARC was overexpressed in human endometrial cancer stem-like cells and promoted migration activity. Gynecol Oncol. 2014;134(2):356–363. doi:10.1016/j.ygyno.2014.04.009
36. Rodríguez-Jiménez FJ, Caldés T, Iniesta P, Vidart JA, Garcia-Asenjo JL, Benito M. Overexpression of SPARC protein contrasts with its transcriptional silencing by aberrant hypermethylation of SPARC CpG-rich region in endometrial carcinoma. Oncol Rep. 2007;17(6):1301–1307.
37. Futyma K, Kubiatowski T, Rózyńska K, et al. Decreased osteonectin and fibronectin gene expression in endometrial cancer cancer as a prognostic marker. Ginekol Pol. 2009;80(12):907–913.
38. Kao SC, Kirschner MB, Cooper WA, et al. A proteomics-based approach identifies secreted protein acidic and rich in cysteine as a prognostic biomarker in malignant pleural mesothelioma. Br J Cancer. 2016;114(5):524–531. doi:10.1038/bjc.2015.470
39. Ikuta Y, Nakatsura T, Kageshita T, et al. Highly sensitive detection of melanoma at an early stage based on the increased serum secreted protein acidic and rich in cysteine and glypican-3 levels. Clin Cancer Res. 2005;11(22):8079–8088. doi:10.1158/1078-0432.CCR-05-1074
40. Zhang J, Hao N, Liu W, et al. In-depth proteomic analysis of tissue interstitial fluid for hepatocellular carcinoma serum biomarker discovery. Br J Cancer. 2017;117(11):1676–1684. doi:10.1038/bjc.2017.344
41. Dongre A, Weinberg RA. New insights into the mechanisms of epithelial-mesenchymal transition and implications for cancer. Nat Rev Mol Cell Biol. 2019;20(2):69–84. doi:10.1038/s41580-018-0080-4
42. Smit DJ, Gardiner BB, Sturm RA. Osteonectin downregulates E-cadherin, induces osteopontin and focal adhesion kinase activity stimulating an invasive melanoma phenotype. Int J Cancer. 2007;121(12):2653–2660. doi:10.1002/ijc.23039
43. Fenouille N, Tichet M, Dufies M, et al. The epithelial-mesenchymal transition (EMT) regulatory factor SLUG (SNAI2) is a downstream target of SPARC and AKT in promoting melanoma cell invasion. PLoS One. 2012;7(7):e40378. doi:10.1371/journal.pone.0040378
44. Sun W, Feng J, Yi Q, Xu X, Chen Y, Tang L. SPARC acts as a mediator of TGF-β1 in promoting epithelial-to-mesenchymal transition in A549 and H1299 lung cancer cells. Biofactors. 2018;44(5):453–464. doi:10.1002/biof.1442
45. Hung JY, Yen MC, Jian SF, et al. Secreted protein acidic and rich in cysteine (SPARC) induces cell migration and epithelial mesenchymal transition through WNK1/snail in non-small cell lung cancer. Oncotarget. 2017;8(38):63691–63702. doi:10.18632/oncotarget.19475
46. Chang CH, Yen MC, Liao SH, et al. Secreted protein acidic and rich in cysteine (SPARC) enhances cell proliferation, migration, and epithelial mesenchymal transition, and SPARC expression is associated with tumor grade in head and neck cancer. Int J Mol Sci. 2017;18(7):1556. doi:10.3390/ijms18071556
47. Jiang X, Liu F, Wang Y, Gao J. Secreted protein acidic and rich in cysteine promotes epithelial-mesenchymal transition of hepatocellular carcinoma cells and acquisition of cancer stem cell phenotypes. J Gastroenterol Hepatol. 2019;34(10):1860–1868. doi:10.1111/jgh.14692
48. Atorrasagasti C, Malvicini M, Aquino JB, et al. Overexpression of SPARC obliterates the in vivo tumorigenicity of human hepatocellular carcinoma cells. Int J Cancer. 2010;126(11):2726–2740.
49. McClung HM, Thomas SL, Osenkowski P, et al. SPARC upregulates MT1-MMP expression, MMP-2 activation, and the secretion and cleavage of galectin-3 in U87MG glioma cells. Neurosci Lett. 2007;419(2):172–177. doi:10.1016/j.neulet.2007.04.037
50. Liu Y, Feng Y, Wang X, et al. SPARC negatively correlates with prognosis after transarterial chemoembolization and facilitates proliferation and metastasis of hepatocellular carcinoma via ERK/MMP signaling pathways. Front Oncol. 2020;10:813. doi:10.3389/fonc.2020.00813
51. Zhang JL, Chen GW, Liu YC, et al. Secreted protein acidic and rich in cysteine (SPARC) suppresses angiogenesis by down-regulating the expression of VEGF and MMP-7 in gastric cancer. PLoS One. 2012;7(9):e44618. doi:10.1371/journal.pone.0044618
52. Zhang J, Wang P, Zhu J, et al. SPARC expression is negatively correlated with clinicopathological factors of gastric cancer and inhibits malignancy of gastric cancer cells. Oncol Rep. 2014;31(5):2312–2320. doi:10.3892/or.2014.3118
53. Bhoopathi P, Chetty C, Gujrati M, Dinh DH, Rao JS, Lakka SS. The role of MMP-9 in the anti-angiogenic effect of secreted protein acidic and rich in cysteine. Br J Cancer. 2010;102(3):530–540. doi:10.1038/sj.bjc.6605538
54. Clark CJ, Sage EH. A prototypic matricellular protein in the tumor microenvironment–where there’s SPARC, there’s fire. J Cell Biochem. 2008;104(3):721–732. doi:10.1002/jcb.21688
55. Chern YJ, Wong JCT, Cheng GSW, et al. The interaction between SPARC and GRP78 interferes with ER stress signaling and potentiates apoptosis via PERK/eIF2α and IRE1α/XBP-1 in colorectal cancer. Cell Death Dis. 2019;10(7):504. doi:10.1038/s41419-019-1687-x
56. Tang MJ, Tai IT. A novel interaction between procaspase 8 and SPARC enhances apoptosis and potentiates chemotherapy sensitivity in colorectal cancers. J Biol Chem. 2007;282(47):34457–34467. doi:10.1074/jbc.M704459200
57. Li A, Qu X, Li Z, et al. Secreted protein acidic and rich in cysteine antagonizes bufalin-induced apoptosis in gastric cancer cells. Mol Med Rep. 2015;12(2):2926–2932. doi:10.3892/mmr.2015.3676
 © 2020 The Author(s). This work is published and licensed by Dove Medical Press Limited. The full terms of this license are available at https://www.dovepress.com/terms.php and incorporate the Creative Commons Attribution - Non Commercial (unported, v3.0) License.
By accessing the work you hereby accept the Terms. Non-commercial uses of the work are permitted without any further permission from Dove Medical Press Limited, provided the work is properly attributed. For permission for commercial use of this work, please see paragraphs 4.2 and 5 of our Terms.
© 2020 The Author(s). This work is published and licensed by Dove Medical Press Limited. The full terms of this license are available at https://www.dovepress.com/terms.php and incorporate the Creative Commons Attribution - Non Commercial (unported, v3.0) License.
By accessing the work you hereby accept the Terms. Non-commercial uses of the work are permitted without any further permission from Dove Medical Press Limited, provided the work is properly attributed. For permission for commercial use of this work, please see paragraphs 4.2 and 5 of our Terms.