")
Back to Journals » International Journal of General Medicine » Volume 16
Low Expression of TSTD2 Serves as a Biomarker for Poor Prognosis in Kidney Renal Clear Cell Carcinoma
Authors Tang G, Sun K, Ding G, Wu J
Received 25 February 2023
Accepted for publication 17 April 2023
Published 20 April 2023 Volume 2023:16 Pages 1437—1453
DOI https://doi.org/10.2147/IJGM.S408854
Checked for plagiarism Yes
Review by Single anonymous peer review
Peer reviewer comments 3
Editor who approved publication: Dr Scott Fraser
Gonglin Tang,1,* Kai Sun,2,* Guixin Ding,1 Jitao Wu1
1Department of Urology, The Affiliated Yantai Yuhuangding Hospital of Qingdao University, Yantai, Shandong, 264000, People’s Republic of China; 2Urology Department, Shandong Province Hospital, Shandong University, Jinan, 250021, People’s Republic of China
*These authors contributed equally to this work
Correspondence: Jitao Wu, Department of Urology, The Affiliated Yantai Yuhuangding Hospital of Qingdao University, Yantai, Shandong, 264000, People’s Republic of China, Email [email protected]
Introduction: Kidney renal clear cell carcinoma (KIRC) is a common cancer in people worldwide, and one of the main issues is developing suitable biomarkers. This study aims to investigate the expression of TSTD2 in KIRC and its impact on prognosis.
Methods: RNA sequencing data from TCGA and GTEx were gathered to examine the functional enrichment of TSTD2-related differentially expressed genes (DEGs) using GO/KEGG, GSEA, immunocyte permeation analysis, and protein–protein interaction (PPI) network analysis. The Kaplan‒Meier-Cox regression model and the prognostic nomograph model were used to assess the clinical importance of TSTD2 in KIRC. R software was used to analyze the included studies. Finally, verification of cells and tissues was performed using immunohistochemical staining and quantitative real‒time PCR.
Results: In contrast to normal samples, it was discovered that TSTD2 was underexpressed in a number of malignancies, including KIRC. Furthermore, in 163 KIRC samples, low expression of TSTD2 was linked to a poor prognosis, as were subgroups with age greater than 60, the integrin pathway, the development of elastic fibers, and high TNM stage, pathologic stage, and histologic grade (P < 0.05). Age and TNM stage were included in the nomogram prognostic model, and low TSTD2 was a prognostic predictor that could be used independently in Cox regression analysis. In addition, 408 DEGs with 111 upregulated genes and 297 downregulated genes were found between the high- and low-expression groups.
Conclusion: The diminished expression of TSTD2 may serve as a biomarker for unfavorable outcomes in KIRC, and holds potential as a target for therapeutic interventions.
Keywords: kidney renal clear cell carcinoma, TSTD2, the cancer genome atlas, R packages
Introduction
The preponderance of primary renal malignancies (75–82%) manifest as Kidney renal clear cell carcinoma (KIRC), rendering it the foremost malignant neoplasm within the realm of renal pathology.1 According to the International Society of Urological Pathology Vancouver Consensus Statement, KIRC has been categorized into distinct subtypes, including clear cell, type I and type II papillary cell, and chromophobe subtypes based on pathological classification.2 KIRC has a stronger recurrence metastasis potential than other subtypes, and patients have a worse prognosis than renal cancer patients with other subtypes.3–5 Hence, the discovery of novel and efficacious clinical markers and targets is of great significance to improve the survival rate and treatment of KIRC.
Thiosulfate sulfurtransferase-like domain containing 2 (TSTD2) belongs to the TSTD family. This gene encodes for thiosulfate sulfotransferase, which governs the intercellular transfer of sulfur compounds.6 The human genome database comprises annotations for TSTD subtypes 1, 2, and 3. It is predicted that TSTD3 may not function as an autonomous sulfur transferase due to the absence of the catalytic cysteine. The function of the conserved cysteine located in the active site of TSTD2 remains unclear. TSTD1 is found in the cytoplasm, close to the nuclear membrane,7,8 and has the potential to play a role in sulfide signaling. Currently, there is a paucity of literature regarding the correlation between TSTD2 and human ailments. The expression of TSTD2 may be linked to an unfavorable prognosis in hepatocellular carcinoma associated with the hepatitis B virus,9 mainly downstream of HCC-related pathways, such as the phosphatidylinositol-3-kinase and protein kinase B signaling pathways, focal adhesion, human papillomavirus infection, the Rap1 signaling pathway, and cyclic guanosine monophosphate-dependent protein kinase (cGMP PKG) signaling pathway mediation. Furthermore, the differentiation of chondrocytes in the growth plate may be impacted by the expression of TSTD2, subsequently affecting an individual’s stature.10–12 Nonetheless, the expression and prognostic significance of TSTD2 in KIRC remain elusive.
In this study, we aimed to establish a correlation between TSTD2 expression levels and the prognosis of KIRC patients through three distinct phases. Firstly, we obtained genotype tissue expression (GTEx) and RNA sequencing (RNA-seq) data of KIRC samples from The Cancer Genome Atlas (TCGA) to investigate the expression of the core gene TSTD2. Subsequently, we conducted functional enrichment analysis of TSTD2 using Gene Ontology (GO), Kyoto Encyclopedia of Genes and Genomes (KEGG), GSEA, immune cell infiltration analysis, and protein-protein interaction (PPI) network analysis. In addition, we utilized prognostic methods such as Kaplan-Meier and nomograms to assess the clinical relevance of TSTD2 in KIRC. Our ultimate goal is to establish a comprehensive understanding of the role of TSTD2 in KIRC prognosis.
Materials and Methods
RNA-Sequencing Data and Bioinformatics Analysis
UCSC XENA provided pancancer RNA-seq data for TCGA and GTEx, with toil processed uniformly.13,14 To conduct further inquiry, the level 3 HTSeq-FPKM and HTSeq-Count data pertaining to the TSTD2 samples were procured from the TCGA website. The present study adhered to the published guidelines of both TCGA and GTEx in their entirety.
Differentially Expressed Gene (DEG) Analysis
DESeq2 R software was employed to identify DEGs by analyzing the expression data of TSTD2 in KIRC samples with low- and high-expression levels (using a cutoff value of 50%).(HTseq-Count).15 We used heatmaps to identify the top ten DEGs.
Functional Enrichment Analysis
Functional enrichment analysis was performed on DEGs with |logFC| >1.5 and padj <0.05. The R ClusteProfiler package was utilized to conduct analyses of cellular components (CC), molecular functions (MF), and biological processes (BP) based on the Gene Ontology (GO) and Kyoto Encyclopedia of Genes and Genomes (KEGG) pathway.16
Gene Set Enrichment Analysis
To contrast the functional and pathway variances amidst the TSTD2 high-expression and low-expression cohorts, GSEA was executed through the utilization of The R package ClusteProfiler (3.14.3).16 The gene set underwent 1000 permutations for each study. Statistical significance was defined as an adjusted P value 0.05 and an FDR q-value 0.25.
Immune Infiltration Analysis by Single-Sample Gene Set Enrichment Analysis (ssGSEA)
The immune infiltration analysis of TSTD2 was executed through ssGSEA utilizing the gsva package in R (version 3.6.3). To discern the correlation between TSTD2 and the enrichment fraction of 24 distinct types of infiltrating immune cells, Spearman correction was implemented.17 The enrichment scores of the high and low TSTD2 expression groups were analyzed using the Wilcoxon rank sum test.
PPI Network
The PPI network of DEGs was predicted using the Search Tool for the Retrieval of Interacting Genes (STRING) database.18 The cutoff criterion was established at a 0.4 interaction score threshold. Cytoscape (version 3.7.1) was used to map the PPI network,19 and MCODE (version 1.6.1) was used to identify the most significant modules.20 Selection criteria: degree cutoff = 2, node score cutoff = 0.2, MCODE scores >5, max depth = 100, and k-score = 2. The route and process enrichment study were carried out using Metascape.
Prognostic Model Generation and Prediction
To predict the overall survival (OS) and event-free survival (EFS) of KIRC patients on an individual level, a nomogram was created using the RMS R package (version 5.1). The nomogram incorporated significant clinical features and calibration plots were utilized to visually evaluate the probabilities predicted by the nomogram against the measured rates. The calibration curves were assessed, with the 45° line reflecting the optimal predictive results. The discrimination of the nomogram was evaluated using the concordance index (C-index), and 1000 resamples were computed using the bootstrap method. Furthermore, the predictive efficacy of the nomogram was compared to that of various prognostic factors using the C-index and receiver operating characteristic (ROC) curve. All double-tailed statistical tests were set at a statistical significance level of 0.05.
Patient Samples
Between 2020 and 2023, a total of 42 patients who underwent either radical or partial nephrectomy at the urology department of Qingdao University Affiliated Yantai Yuhuangding Hospital kindly provided us with KIRC tissues and matched normal renal tissues. The surgical specimens were promptly submerged in liquid nitrogen and subsequently transferred to a −80°C refrigerator for further utilization. All participants provided their informed consent, and the project was approved by the ethics committee of Qingdao University Affiliated Yantai Yuhuangding Hospital.
Cell Lines and Cell Culture
The Cell Bank of the Chinese Academy of Sciences has recently made available for purchase the KIRC cell lines (786-O, 769-P, ACHN, Caki-2, and A498), as well as a human normal renal proximal convoluted tubular cell line (HK-2). While the RPMI 1640 medium was used for the cultivation of the former cell lines, DMEM (BI, Israel) (BI, Israel) was employed for the latter. All media were supplemented with 10% Fetal Bovine Serum (FBS) and 1% of penicillin and streptomycin, respectively. The cells were maintained in a humidified incubator at 37 degrees Celsius and 5% carbon dioxide.
RNA Extraction, Reverse Transcription and Quantitative Real‑time PCR (qRT‒PCR)
We utilized the SteadyPure Quick RNA Extraction Kit (Accurate Biology, China) to extract total RNA from freshly frozen tissues or KIRC cell lines, followed by reverse transcription using the Evo M-MLV RT Mix Kit (Accurate Biology, China). Subsequently, qPCR was conducted with the SYBR® Green Premix Pro Taq HS qPCR Kit and Rox Reference Dye (Accurate Biology, China). The internal reference gene GAPDH was utilized, and the relative expression level of the target gene was determined using the 2−ΔΔCT calculation method. Each experiment was performed in triplicate.
Immunohistochemical (IHC) Analysis
All paraffin specimens were sectioned at 0.4mm intervals, and two consecutive slices were cut and baked at 65°C for 30 minutes. This thin cut was then stained with HE to provide a more detailed image of the tissues.
Statistics Analysis
The statistical analyses and graphs were analyzed and displayed using R (version 3.6.2). The Wilcoxon rank-sum test was utilized for unpaired samples, while the Wilcoxon signed-rank test was employed for paired samples. The relationship between clinical/cytogenetic characteristics and TSTD2 expression was evaluated through the Kruskal–Wallis test, Wilcoxon signed-rank test, and logistic regression analysis. Cox regression analysis and the Kaplan‒Meier method were used to evaluate prognostic factors. A multivariate Cox analysis was conducted to assess the impact of TSTD2 expression on survival in conjunction with other clinical characteristics, with the median TSTD2 expression serving as the cutoff value. A P value of 0.05 was considered statistically significant for all data. The calculated area under the curve (AUC) value ranged from 0.5 to 1.0, indicating a discriminating capacity of 50% to 100%. Additionally, the effectiveness of TSTD2 transcriptional expression in distinguishing KIRC from healthy samples was evaluated using ROC analysis with the pROC software.
Results
TSTD2 Expression Across Cancers and KIRC
The RNA-seq data derived from UCSC XENA were acquired in both TCGA and GTEx formats, and underwent uniform processing utilizing the toil procedure. Notably, TSTD2 displayed significantly decreased expression in 28 types of cancer (Figure 1A), including KIRC, when compared to its expression levels in normal samples from both TCGA and GTEx databases, versus comparable tumor samples from the TCGA database (Figure 1B).
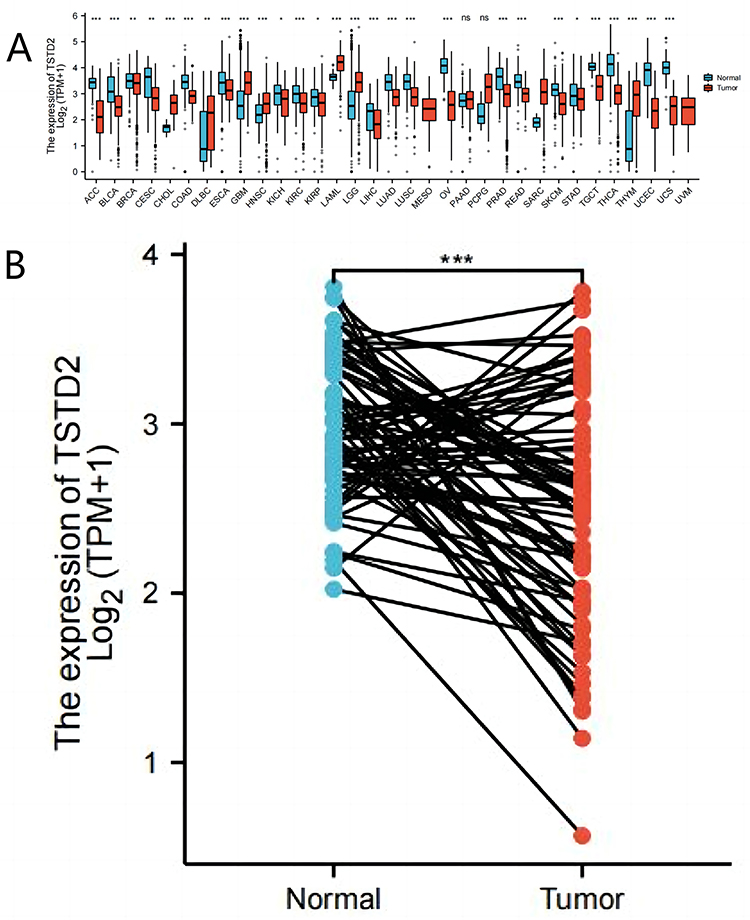 |
Figure 1 The lower expression of TSTD2 was showed in KIRC compared with normal samples. (A) Expression level of TSTD2 in paired normal and pan-cancer samples. (B) Expression level of TSTD2 in paired normal and KIRC samples. *P < 0.05; **P < 0.01; ***P < 0.001. |
Identification of DEGs in KIRC Samples with Low and High TSTD2 Expression
We sought to identify differences in median mRNA expression levels between high- and low-expression groups within gene expression profiles. Our analysis revealed a total of 408 DEGs, consisting of 111 upregulated and 297 downregulated genes, which were statistically significant in the TSTD2 high- and low-expression groups, as determined by gene expression RNA-seq-HTSeq-Counts (|log fold change (logFC)| > 1.5, P < 0.05) (Figure 2A). The heatmap displays the top five upregulated and top five downregulated DEGs between the high- and low-expression groups of TSTD2 (Figure 2B).
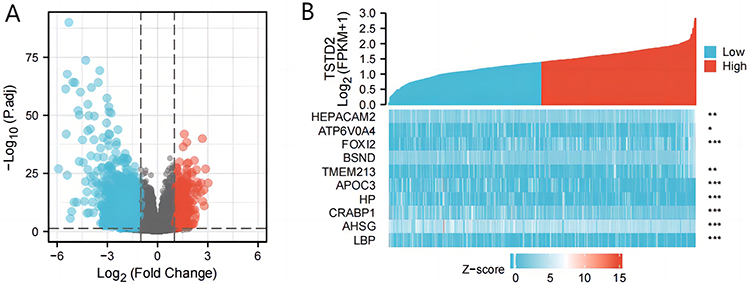 |
Figure 2 A total of 408 DEGs were identified as being statistically significant between TSTD2 high-expressed and low-expressed groups. (A) Volcano plot of differentially expressed genes, including 111 up-regulated and 297 down-regulated genes. Normalized expression levels were shown in descending order from green to red. (B) Heat map of the 10 differentially expressed RNAs, including 5 up-regulated genes and 5 down-regulated genes. The X-axis represents the samples, while the Y-axis denotes the differentially expressed RNAs. Green and red tones represented down-regulated and up-regulated genes, respectively. *P < 0.05; **P < 0.01; ***P < 0.001. |
Functional Enrichment Analysis of DEGs
To gain a deeper comprehension of the functional implications of 408 DEGs between high and low expression of TSTD2 in KIRC, we utilized the clusterProfiler program to conduct GO and KEGG functional enrichment analysis (Supplementary Table 1, Figure 3). The biological processes (BP), cellular components (CC), including the acute inflammatory response, protein activation cascade, and blood microparticle, as well as molecular functions (MF), such as serine hydrolase activity, serine-type endopeptidase activity, and enzyme inhibitor activity, were all related to the growth and metastasis of tumors. Furthermore, complement and coagulation cascades were all identified in KEGG.
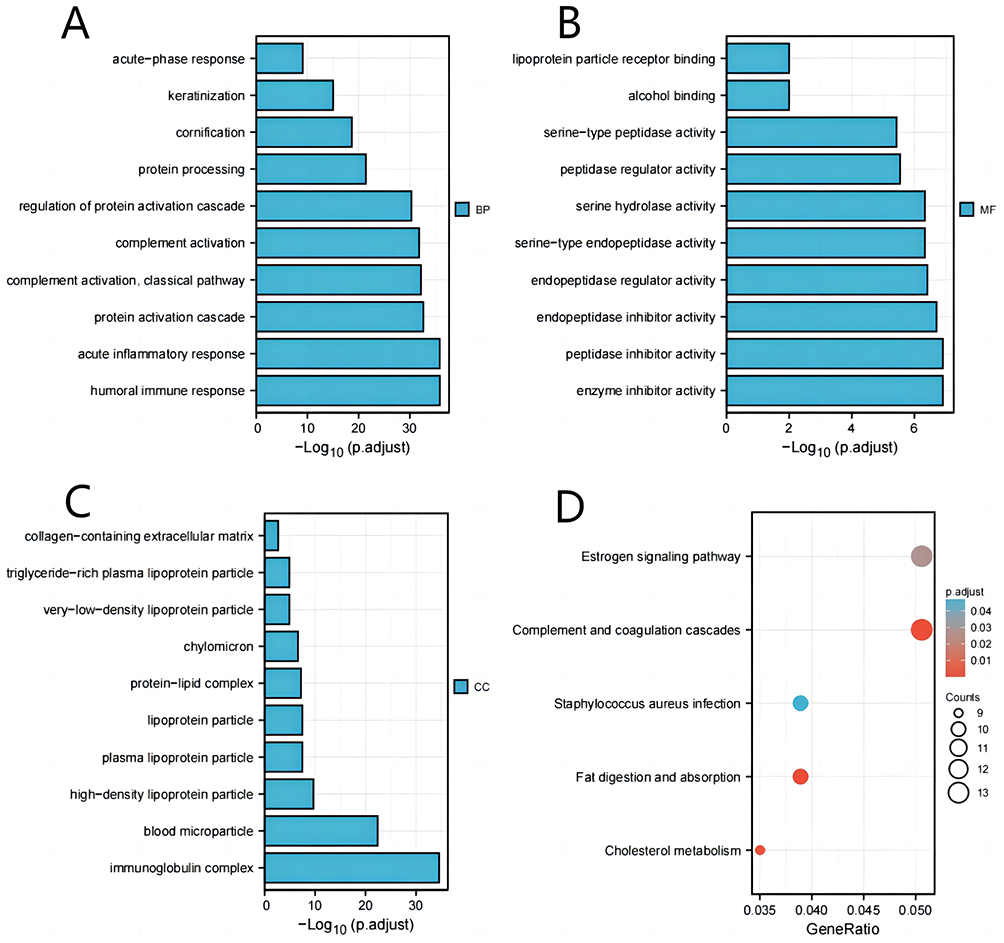 |
Figure 3 GO/KEGG enrichment analysis of DEGs between high- and low- TSTD2 expression in TCGA-KIRC patients. (A) Enriched GO terms in the “biological process” category. (B) Enriched GO terms in the “molecular function” category. (C) Enriched GO terms in the “cellular component” category. (D) KEGG pathway annotations. The X-axis represented the proportion of DEGs, and the Y-axis represented different categories. The different colors indicate different properties, and the different sizes represent the number of DEGs. |
GSEA was performed to acquire a better understanding of the biological pathways involved in KIRC with varying amounts of TSTD2 expression. By contrasting datasets with low- and high-TSTD2 expression, GSEA was utilized to pinpoint significant signaling pathways connected to TSTD2. The enrichment of these routes in the MSigDB Collection (C2.all.v7.0.symbols.gmt) showed significant variations (Supplementary Table 2 and Figure 4) (FDR 0.05, ADJ P 0.05). In the low expression of TSTD2 phenotypes, the transport of small molecules was greatly enhanced (Figure 4A). The high expression of TSTD2 in KIRC phenotypes was significantly enriched by elements such as the integrin pathway, elastic fiber production, and spinal cord damage (Figure 4B–L).
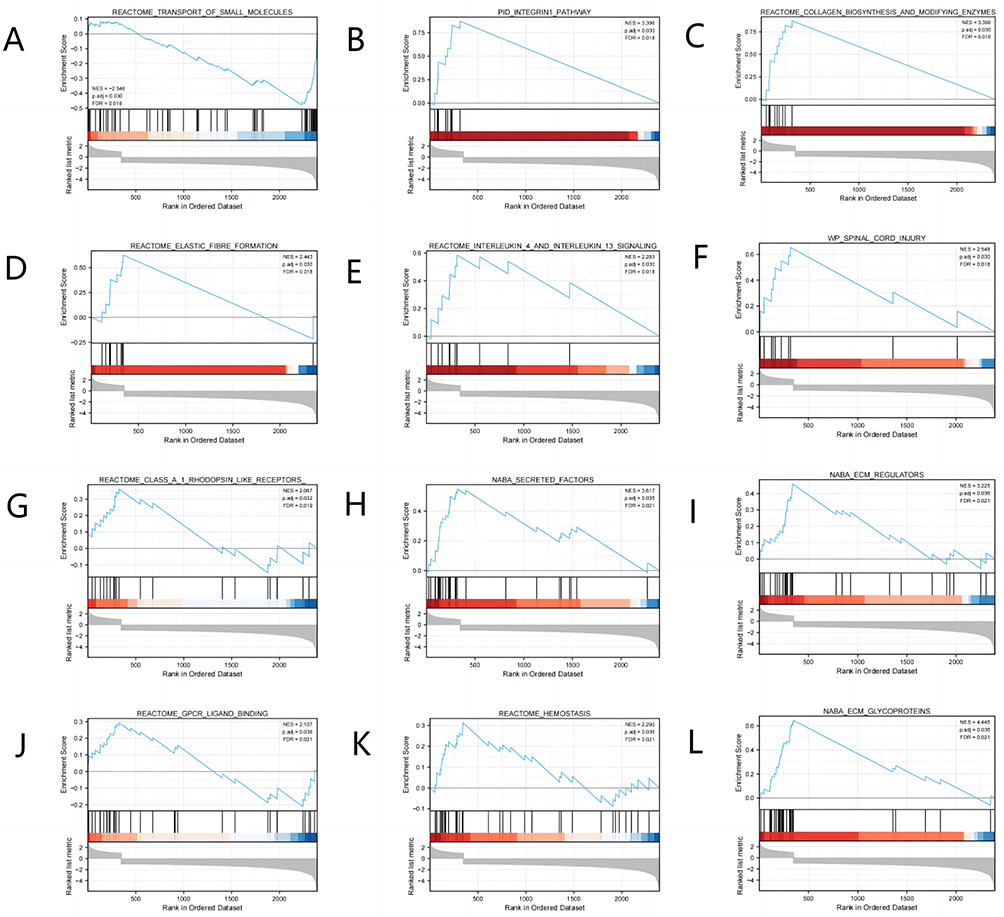 |
Figure 4 Enrichment plots from the gene set enrichment analysis (GSEA). (A–L) ES, enrichment score; NES, normalized ES; ADJ P-val, adjusted P-value. |
Immune Infiltration Analysis in TSTD2
The level of TSTD2 expression within the microenvironment of KIRC was found to be correlated with the level of immune cell infiltration, as determined by SSGSEA through Spearman correlation analysis. In particular, diminished TSTD2 expression was significantly associated with the presence of NK CD56bright cells (Figure 5).
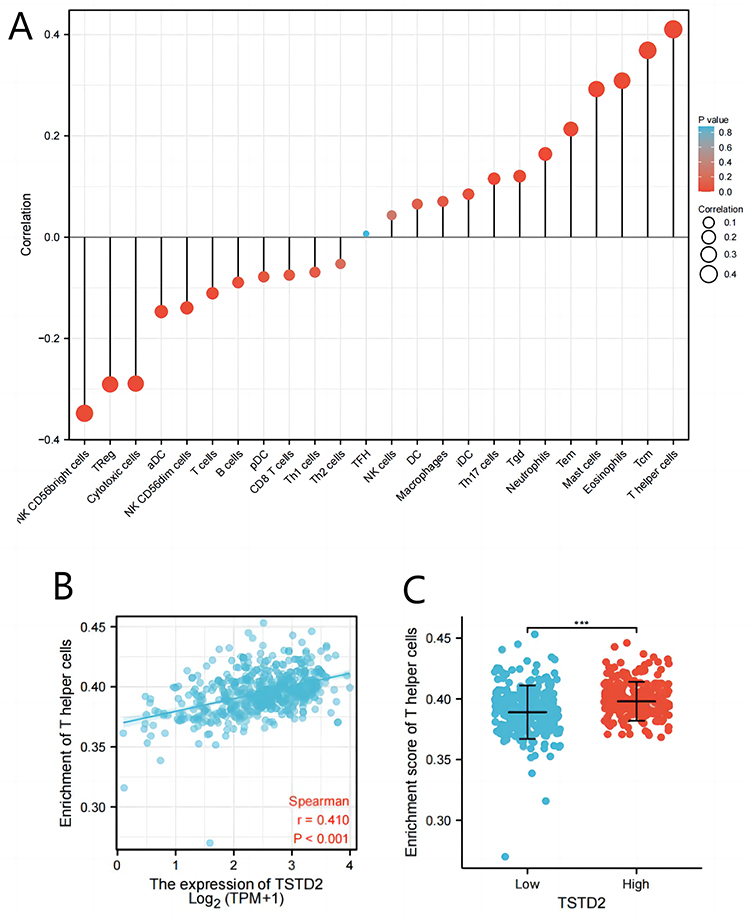 |
Figure 5 The expression of TSTD2 was associated with immune infiltration in the KIRC microenvironment. (A) The forest plots showed a positive correlation between TSTD2 and 13 immune cells, and a negative correlation between TSTD2 and 11 immune cell subsets. The size of dots showed the absolute value of Spearman r. (B) Correlation between the relative enrichment score of T helper cells and the expression level (TPM) of TSTD2. (C) Infiltration of T helper cells between low- and high-TSTD2 expressed. ***P < 0.001. |
PPI Enrichment Analysis in TSTD2
The network of TSTD2 and its associated coexpressed genes in TSTD2-related DEGs was constructed using STRING, employing a threshold of 0.4 (Supplementary Table 3). A total of 408 DEGs were identified based on a threshold of |log fold change (logFC)| >1.5 and P < 0.05. The PPI network was visualized using Cytoscape-MCODE, which revealed 86 nodes and 241 edges (Figure 6). Additionally, Metascape-MCODE was utilized to identify highly connected PPI network components of TSTD2 (Supplementary Figure 1). The functional descriptions of the respective components were determined based on the three best-scoring GO keywords by p value, which are presented in Supplementary Table 4.
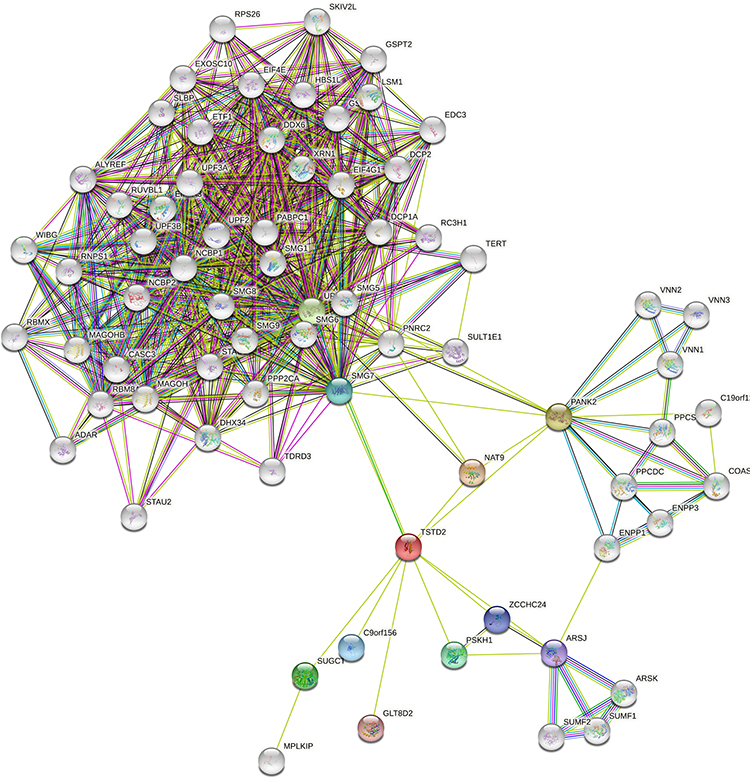 |
Figure 6 The PPI network of TSTD2-related DEGs and the most significant module. |
Association Between TSTD2 Expression and Clinical Features
The primary clinical characteristics of KIRC in TCGA are delineated in Table 1. In total, 539 patients were enrolled in this investigation, with an average age of 60.5 years, comprising 186 females and 353 males. TSTD2 expression was low in 269 (49.9%) of KIRC patients and high in 270 (50.1%). Notably, overall survival (OS), disease-free survival (DSS), and progression-free survival (PFS) were all significantly associated with TSTD2 expression (P< 0.001). Moreover, TSTD2 expression was strongly linked with sex (P< 0.001), T stage (P = 0.002), M stage (P = 0.016), pathologic stage (P = 0.002), histologic grade (P = 0.001), and age (P = 0.028).
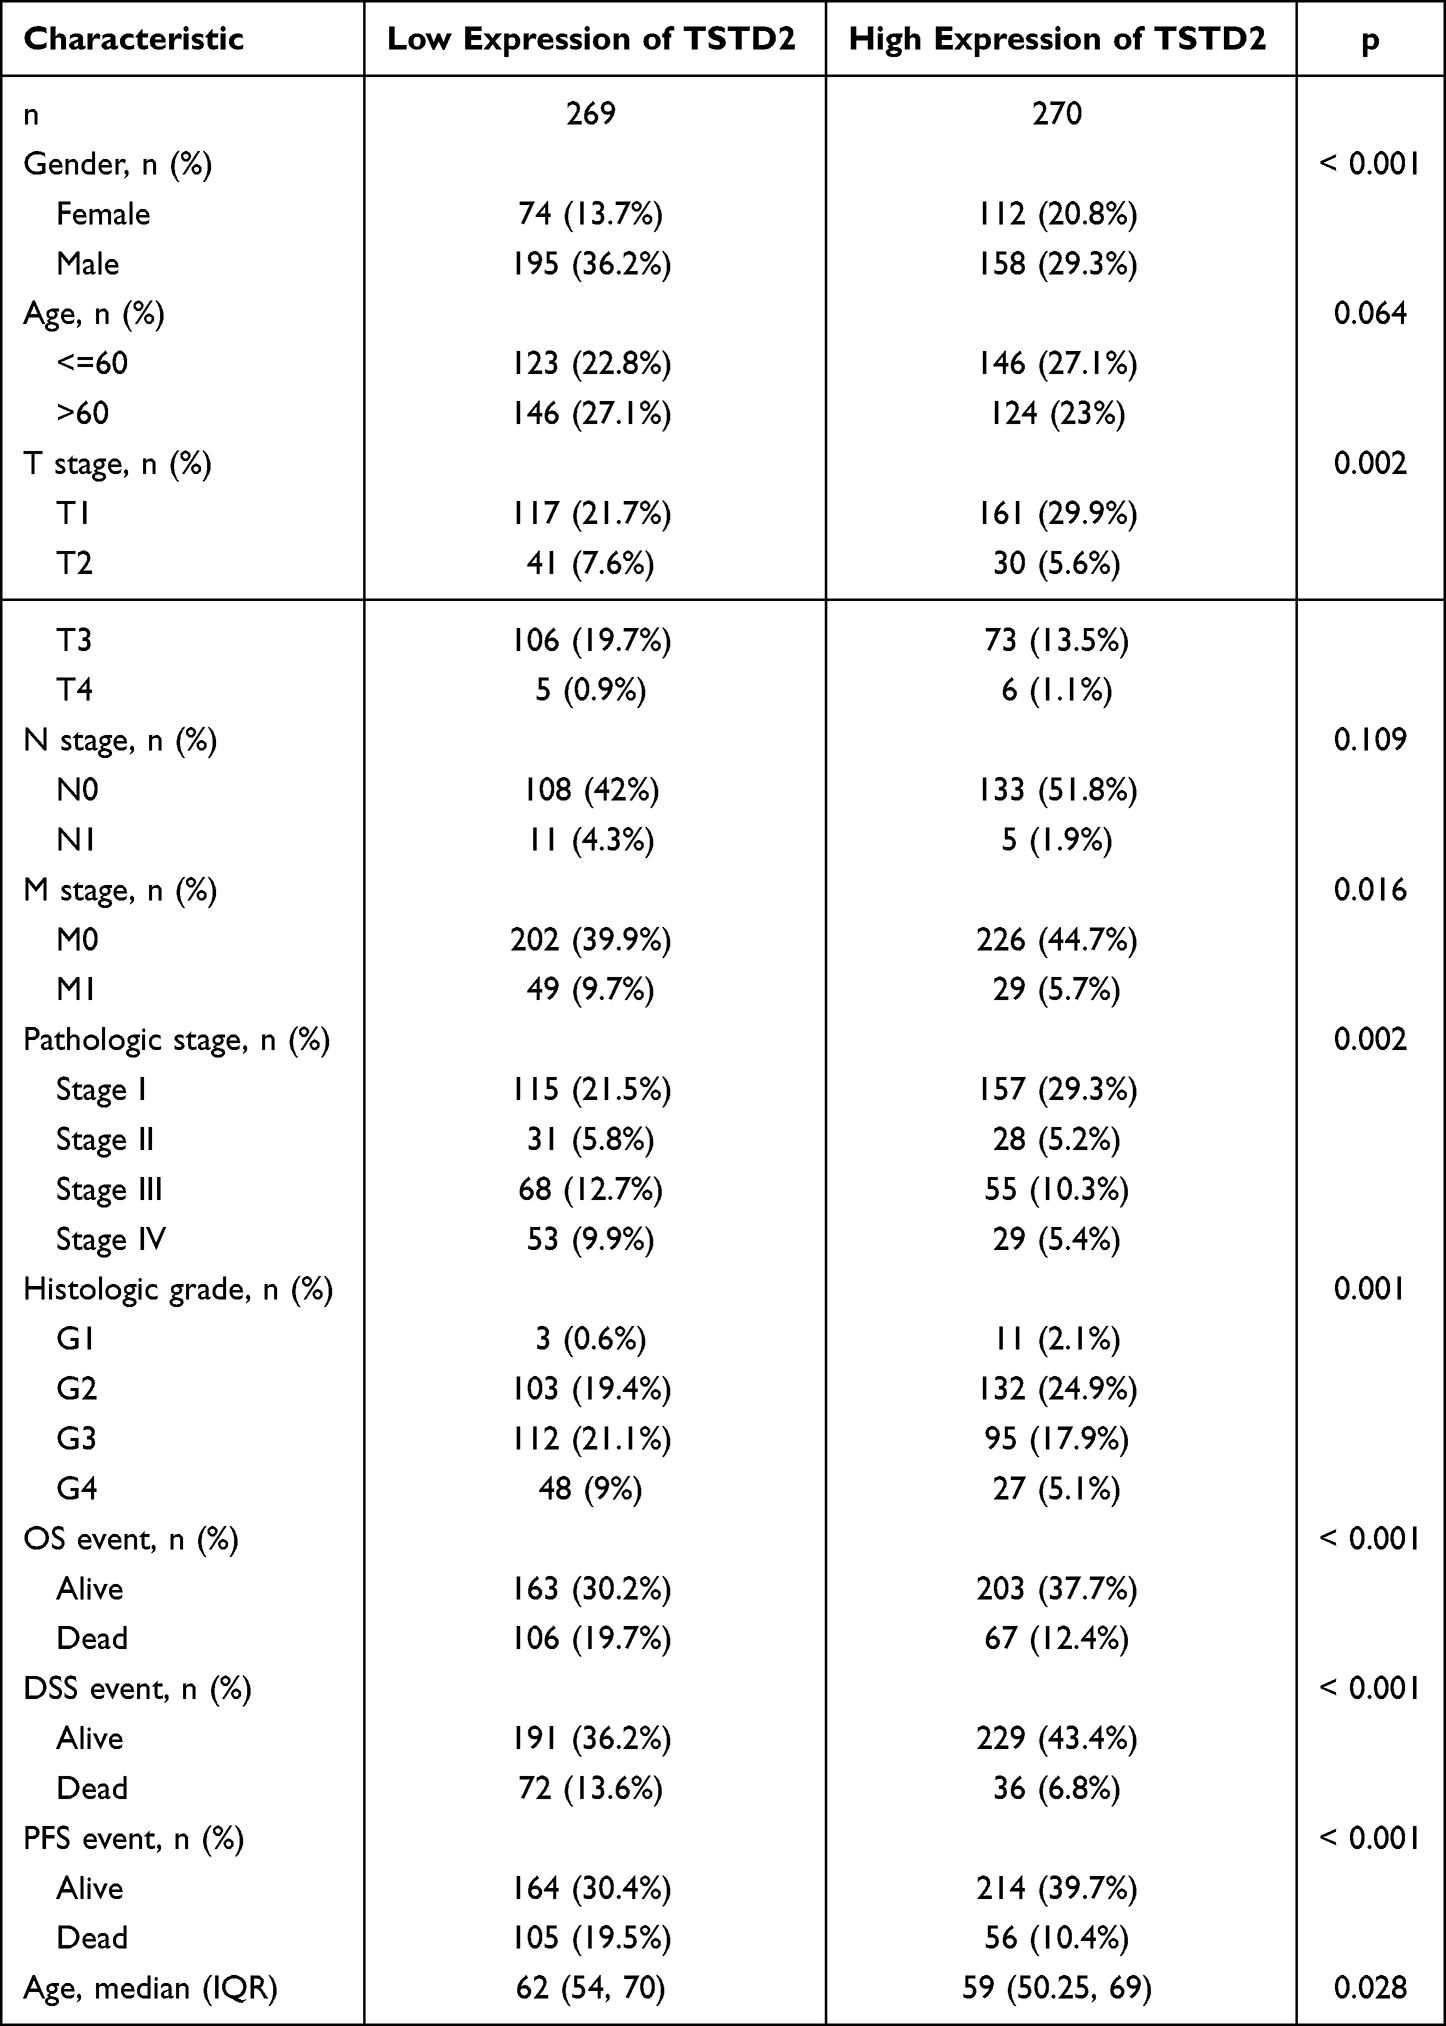 |
Table 1 Association Between TSTD2 Expression and Clinicopathologic Features in KIRC Samples from the TCGA Database |
Utilizing logistic regression analysis, the connection between KIRC clinicopathological characteristics and the TSTD2 high-low dichotomy was verified. The findings revealed that high TSTD2 expression exhibited a noteworthy inverse correlation with high T stage (odds ratio [OR], 0.420; P < 0.001), high M stage (OR, 0.595; P = 0.038), high pathologic stage (OR, 0.442; P < 0.001), and high histologic grade (OR, 0.272; P = 0.047) (Table 2). Additionally, the potential significance of TSTD2 in distinguishing KIRC patients from healthy individuals was evaluated using ROC curve analysis, with an AUC of 0.760 indicating its potential as a biomarker (Figure 7A). Furthermore, the Wilcoxon rank sum test was utilized to assess the expression of TSTD2 in patients with diverse clinicopathological characteristics. The outcomes indicated that TSTD2 was significantly expressed at low levels in patients with high TNM stage (P < 0.05), high pathologic stage (P < 0.05), high histologic grade (P < 0.05), male gender (P < 0.05), OS event (death; P < 0.001), DSS event (death; P < 0.001), and PFS event (death; P < 0.001) (Figure 7B–J).
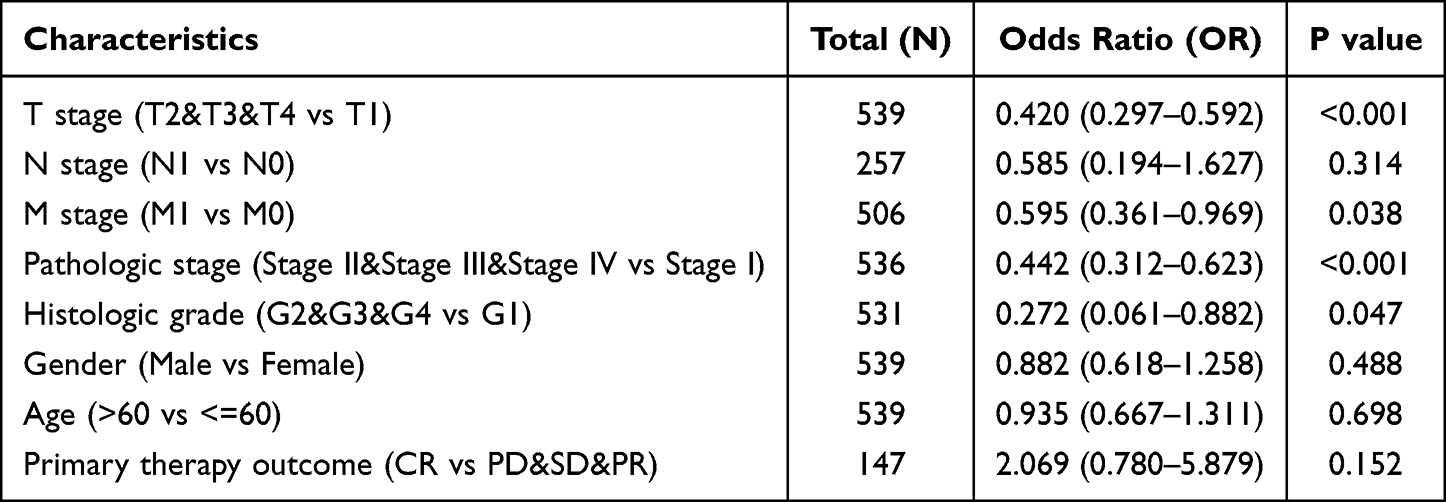 |
Table 2 The Relationship Between the Clinicopathological Factors of KIRC and TSTD2 Expression by Using Logistic Analysis |
 |
Figure 7 Association between TSTD2 expression and clinical features and prognosis. (A) The diagnostic efficacy of TSTD2 in KIRC analyzed by ROC. (B–J) Association between TSTD2 expression and T stage, N stage, M stage, Pathologic stage, Histologic grade, Gender, OS event, DSS event, and PFI event analyzed by using Wilcoxon Rank SUM test. *P < 0.05; **P < 0.01; ***P < 0.001. |
Low TSTD2 Impacted the Prognosis of KIRC in Patients with Different Clinicopathological Statuses
Using the Kaplan-Meier technique, the relationship between TSTD2 expression and prognosis was investigated in KIRC patients. Those with low TSTD2 expression exhibited a significantly worse prognosis than those with high TSTD2 expression, as demonstrated in Figure 8A (hazard ratio [HR], 0.61 (0.45−0.84); P = 0.002). Kaplan‒Meier analysis revealed that low TSTD2 expression correlated with poor prognosis in the T stage T1 (P = 0.038), T stage T3 (P = 0.028), M stage M0 (P = 0.011), age>60 (P = 0.017), and histologic grade G3 (P = 0.007) subgroups (Figure 8B–F).
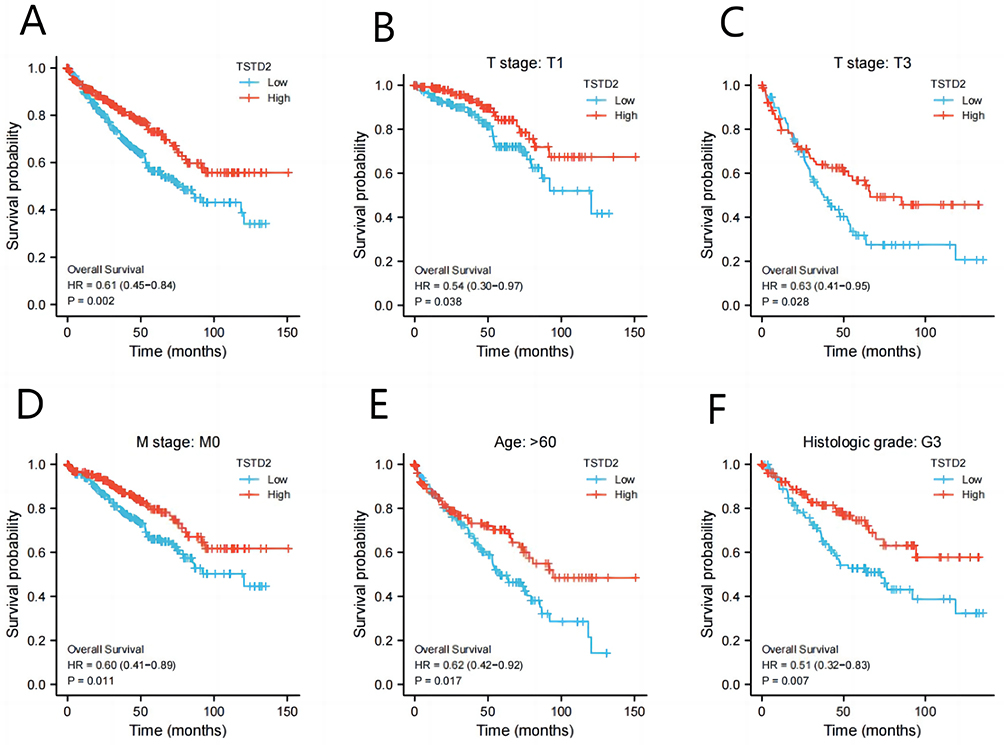 |
Figure 8 Low expression of TSTD2 was associated with poor OS in KIRC patients. (A) Kaplan-Meier curves in all KIRC patients, (B–F) Kaplan-Meier curves in KIRC patients with T stage: T1, T stage: T3, M stage: M0, Age: >60 and Histologic grade: G3. |
Subsequently, univariate Cox proportional hazards regression was employed to assess the factors affecting OS. This analysis showed that TSTD2 (low vs high, P = 0.002) was a predictive factor for worse OS, as were age (>60 vs ≤60, P < 0.001), T stage (T2&T3&T4 vs T1, P < 0.001), N stage (N1 vs N0, P < 0.001), M stage (M1 vs M0, P < 0.001), pathologic stage (Stage II&Stage III&Stage IV vs Stage I, P < 0.001), and primary therapy outcome (progressive disease and stable disease and partial response vs complete response, P = 0.002) (Table 3). Multivariate Cox regression analysis indicated that age > 60 (P < 0.001) and low expression of TSTD2 (P = 0.015) were independent prognostic factors for worse OS.
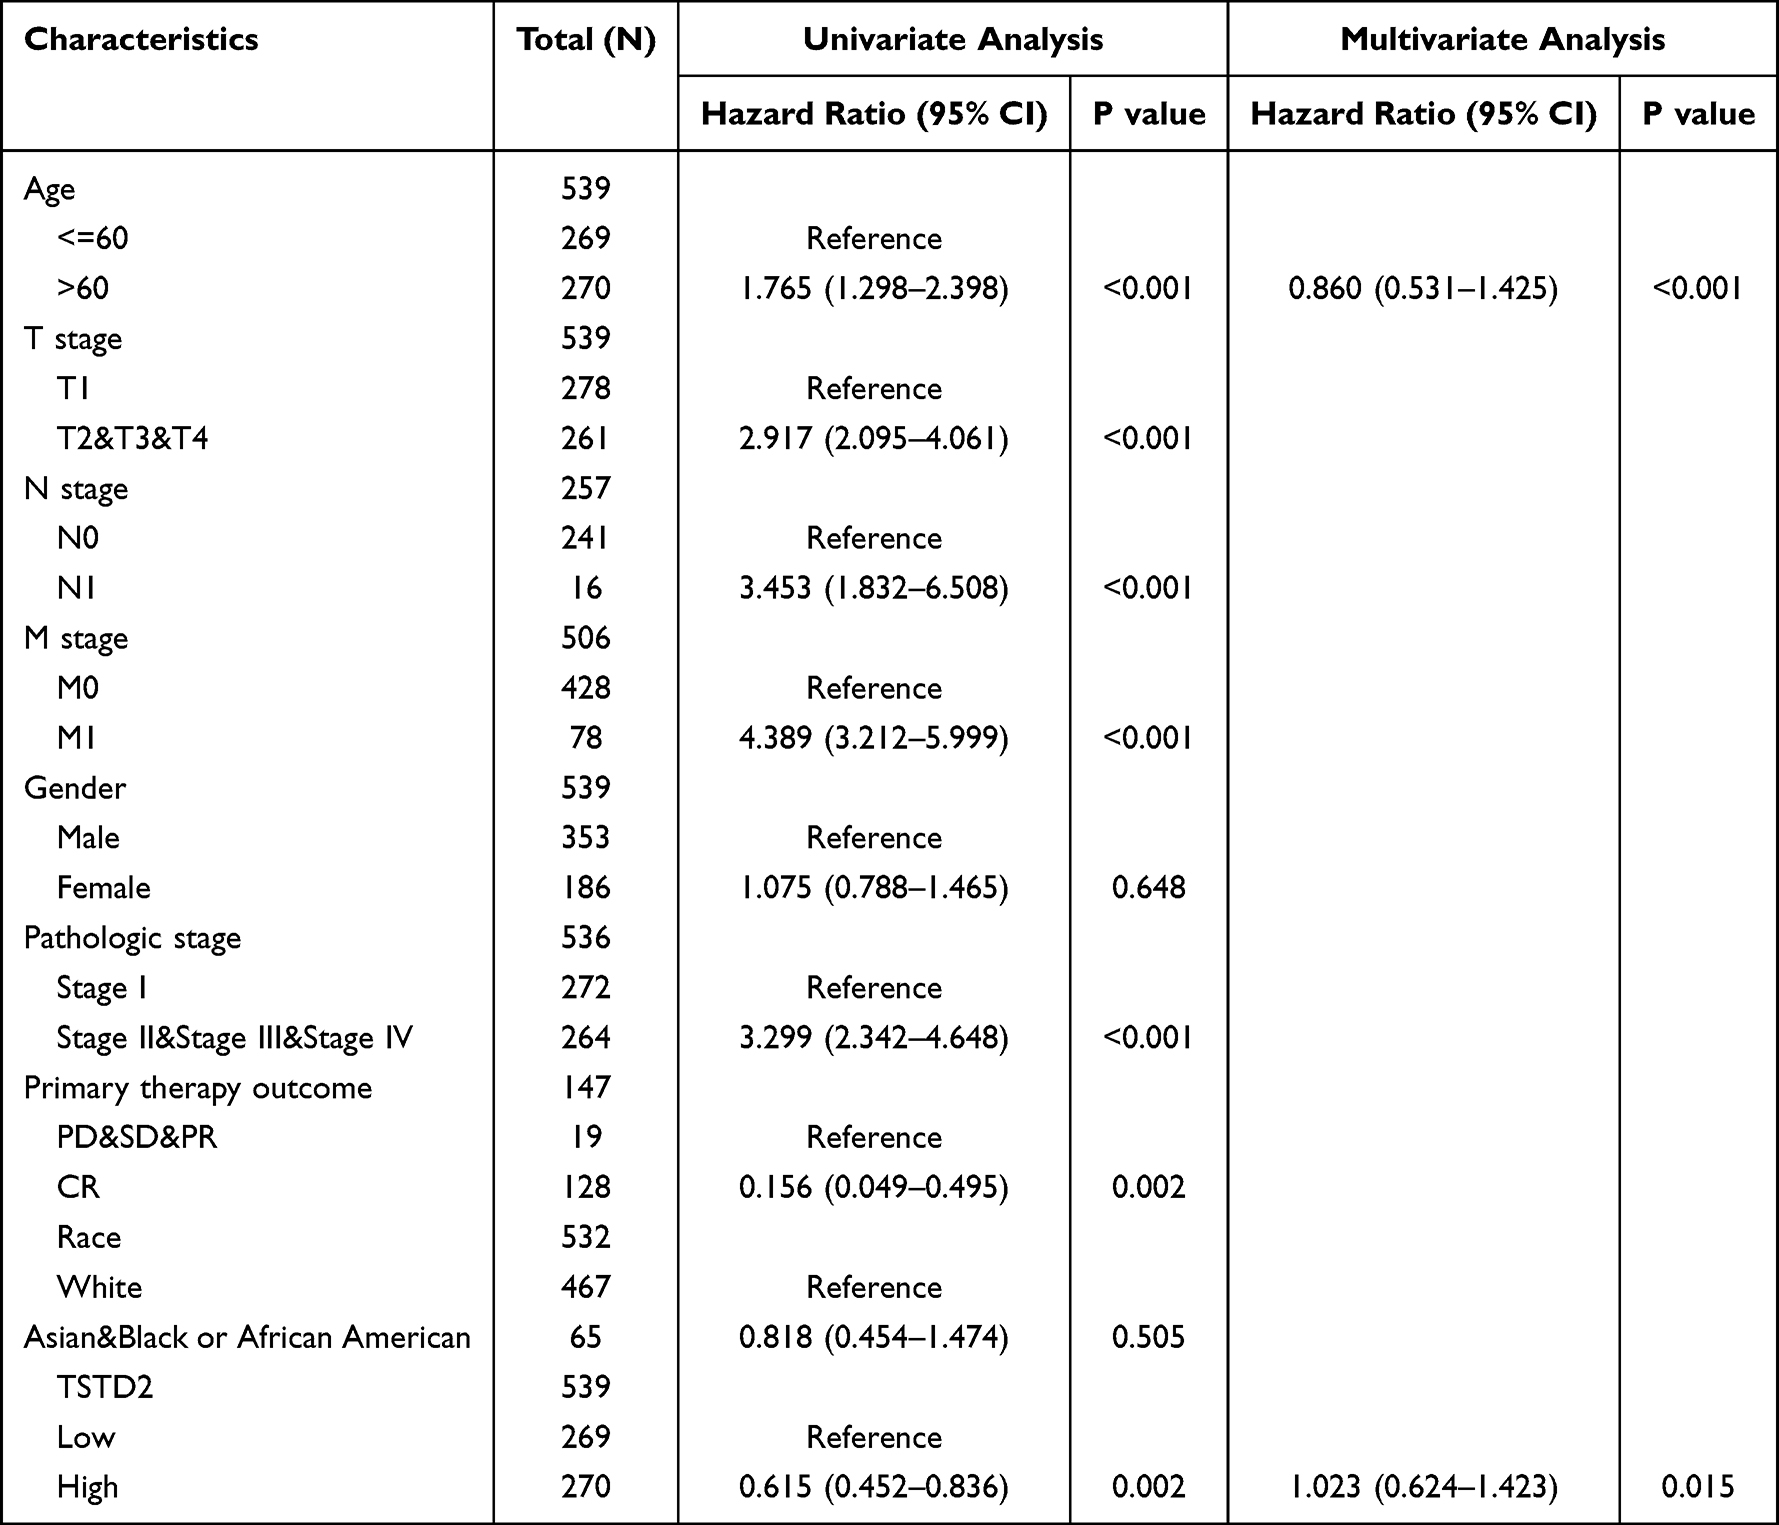 |
Table 3 Univariate and Multivariate Cox’s Regression Analysis of Factors Associated with OS in KIRC |
Prognostic Model of TSTD2 in KIRC
According to the results of Cox regression analysis, a nomogram was created using the RMS R program to more precisely forecast the prognosis of KIRC patients (Figure 9). The model consisted of five autonomous prognostic factor variables, namely age, T stage, N stage, M stage, and TSTD2 expression. A scoring system was applied to assign scores to these factors based on multivariate Cox analysis. The scores of the variables were determined by drawing a vertical line, and the sum of the scores allocated to each variable was recalibrated to a range of 0–100. The total scores were determined by adding up the scores from each variable. A line was then drawn from the total score axis vertically downwards to the outcome axis in order to evaluate the likelihood of KIRC patient survival at one, three, and five years.
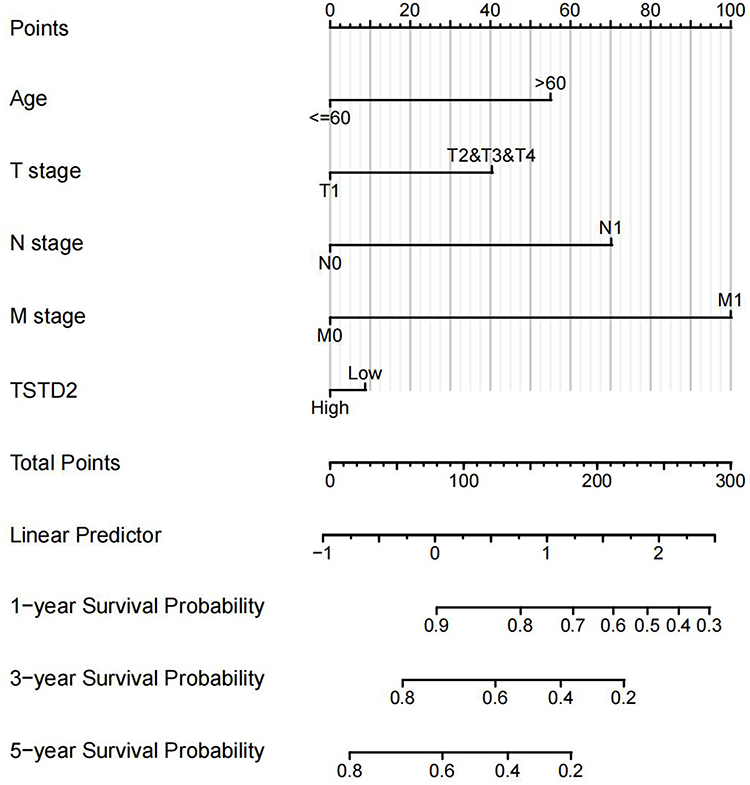 |
Figure 9 Nomogram for predicting the probability of 1-, 3-, 5-year OS for KIRC. |
Low Expression of TSTD2 in KIRC Tissues and Cell Lines
We collected 36 pairs of tumor tissues and adjacent tissues from KIRC patients for qRT‒PCR verification. The results showed that the mRNA expression level of TSTD2 in tumor tissues was significantly lower (Figure 10A). We also verified this finding in renal cancer cell lines. The results showed that compared with HK-2, TSTD2 mRNA was highly expressed in all renal cancer cell lines (Figure 10B: 786-O, P < 0.01; 769-P, P < 0.01; ACHN, P < 0.01; Caki-2, P < 0.01; A498, P < 0.01). The primer sequences utilized are presented in Table 4.
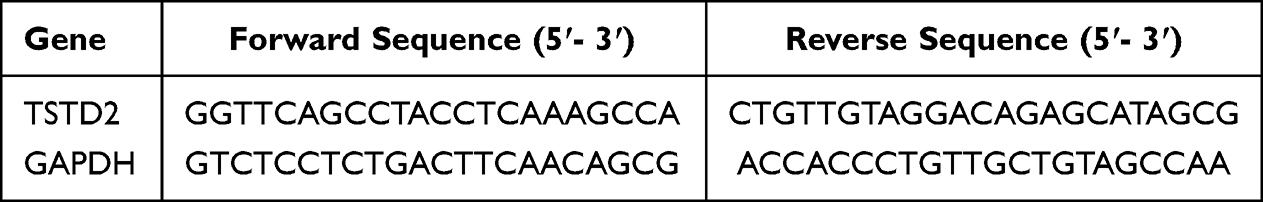 |
Table 4 Sequence of Gene-Specific Primers for qPCR |
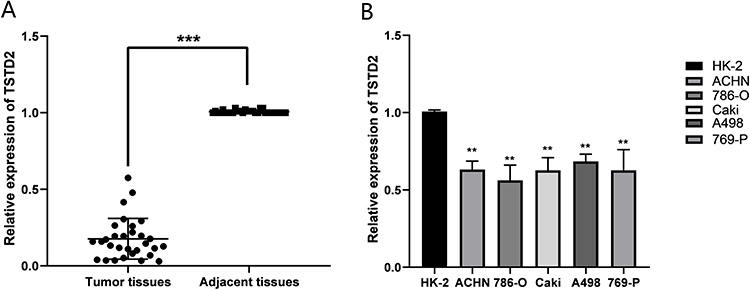 |
Figure 10 The mRNA expression levels of TSTD2 in KIRC tissues and cell lines. (A) The mRNA expression levels of TSTD2 in KIRC tissues (T = 33, N = 33). (B) The mRNA expression levels of TSTD2 in KIRC cell lines. **P < 0.01, ***P < 0.001. Abbreviation: ccRCC, clear cell renal cell carcinoma. |
Protein Expression of TSTD2 in KIRC Tissue Samples
In order to authenticate the differential expression of TSTD2 at the protein level, immunohistochemical labeling was executed on KIRC tissues and their corresponding normal tissues. As illustrated in Figure 11, the stained regions were predominantly located within the cell cytoplasm, and the expression of TSTD2 was visibly reduced in KIRC tissues when compared to their normal tissue counterparts.
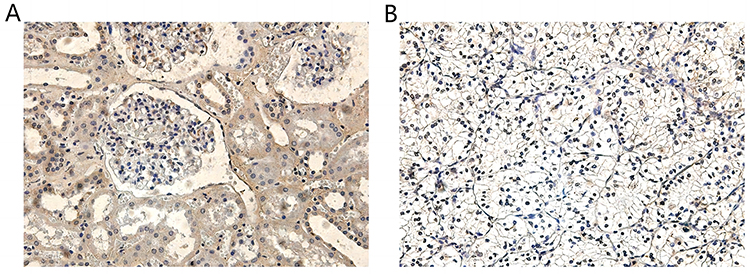 |
Figure 11 TSTD2 expression in cancer and adjacent tissues by Immunohistochemical staining: (A) high expression of TSTD2 protein (×200) in para-cancer tissue; (B) low expression of TSTD2 protein (×200) in cancer tissue. |
Discussion
TSTD2 belongs to the TSTD gene family, and it is speculated that this gene encodes a thiosulfate sulfotransferase involved in the regulation of sulfur compound transfer between cells. Its potential involvement in protein persulfation suggests a significant role in cellular processes.21,22 Its placement within a transcriptional regulatory region portends its potential to exert an impact on gene expression. Therefore, deregulated enzyme activity may lead to the abnormal transfer of sulfur compounds between cells,22,23 potentially associated with multiple tumorigenesis. Currently, there exist limited research endeavors pertaining to TSTD2, and no clinical trials have been conducted to directly investigate its role in malignancies. Consequently, the expression of TSTD2 in KIRC, as well as its prognostic significance, remains enigmatic.
From the PPI network of TSTD2 and its co-expression gene map in TSTD2-related DEGs, it is evident that TSTD2 expression is closely linked to numerous proteins, particularly GLT8D2 and SMG7. GLT8D2 is an acyltransferase that participates in regulating the synthesis and release of neurotransmitters. Recent studies have shown that overexpression of GLT8D2 in ovarian cancer contributes to cisplatin resistance by activating the FGFR/PI3K/AKT signaling pathway.24 Additionally, high expression of GLT8D2 in tumor cells may be associated with proliferation, invasion, and metastasis.25,26 SMG7 is an RNA degradation factor that participates in the process of mRNA decay. Recent studies have shown that SMG7 plays an important role in the occurrence and development of tumors. It has been found to promote the proliferation and invasion of tumor cells. Researchers have found that the expression level of SMG7 is significantly increased in various tumors, such as lung cancer, breast cancer, and colon cancer, furthermore, SMG7 can promote the proliferation and invasion of tumor cells through various pathways, including regulating the Wnt/β-catenin and AKT signaling pathways.27–29
In this investigation, we utilized TCGA data and various online analysis tools to elucidate the function of TSTD2 in KIRC. Subsequently, through simultaneous qPCR and immunohistochemical validation, we discovered that TSTD2 was downregulated in cancerous tissues when compared to adjacent normal tissues at both the transcriptional and translational levels. GSEA gene enrichment analysis revealed that high TSTD2 expression in KIRC was associated with the integrin pathway, elastic fiber formation, collagen biosynthesis and modifying enzymes, and spinal cord injury. Based on the results of the Kaplan-Meier analysis, reduced TSTD2 expression was linked to an unfavorable prognosis and poor survival. Furthermore, multivariate Cox regression analysis identified high TSTD2 expression as an additional independent prognostic factor, in addition to age (> 60 years). By constructing a nomogram prediction model, we further demonstrated the predictive effect of TSTD2 expression for prognosis. Therefore, TSTD2 may represent a novel risk factor for poor prognosis in KIRC patients.
More significantly, it has been determined that the mRNA expression of distinct T stages, with or without lymph node metastasis, with or without distant metastasis, different pathologic stages, and histological grades of TSTD2, exhibit marked differences amongst KIRC patients. Logistic regression analysis also indicates that TSTD2 mRNA expression is linked to the aforementioned characteristic manifestations of patients. As there is currently no universally recognized prognostic biomarker for KIRC, TSTD2 presents itself as a potentially valuable KIRC prognostic marker. Recent investigations have also identified additional prognostic factors that impact KIRC, such as androgen receptor (AR) and miR-106b-5p.30 Combining TSTD2 with these factors may offer a more precise prognostic forecast for Renal Cell Carcinoma (KIRC). Collectively, TSTD2 could potentially serve as a crucial player in the pathogenesis and advancement of KIRC.
Furthermore, GSEA has uncovered a potential regulatory pathway involving TSTD2 in the advancement and progression of KIRC, and has established a negative correlation between TSTD2 expression and the upregulation of the integrin signaling pathway. Integrins are pivotal in regulating cellular adhesion to both other cells and the extracellular matrix, and thus play a crucial role in tumor metastasis and progression. Studies have demonstrated that α2β1 integrin can suppress the metastasis of clinically relevant spontaneous breast cancer, and that α2 expression can serve as a critical biomarker for assessing both metastatic potential and patient survival in breast cancer.31 Integrins, as essential mediators of cell adhesion behavior, play a critical role in tumor formation and metastasis and have emerged as promising therapeutic targets.32–35 Studies in a large number of in vitro and in vivo orthotopic or xenograft models have shown that β1 integrins mediate gastric, ovarian and lung cancer resistance and stimulate metastasis.36,37 Using cell lines in vivo or in vitro, it was shown that α2β1 integrins may help promote metastasis in different organs.38–40 It has been discovered that TSTD2 is intricately linked to this particular biological pathway and may play a significant role in the tumorigenesis and metastasis of KIRC. Naturally, additional experimental research is requisite to authenticate the precise mechanism by which TSTD2 contributes to the evolution and advancement of KIRC.
In the examination of immune cell infiltration, the manifestation of TSTD2 exhibited a strong correlation with T helper cells (CD4+ T cells). Human CD4+ T cells are indispensable constituents of the immune system. CD4+ T lymphocytes are dichotomized into various subsets, including Th1, Th2, Th17, follicular helper T cells, regulatory T cells (Tregs), and other discernible categories.41–45 Th cells play different roles in the progression of various tumors, mainly by producing various cytokines.46 As an illustration, Th1 cells are capable of synthesizing IL-2 and INF γ, and have been demonstrated to exert a pivotal function in the initiation and endurance of antitumor CD8 T cells, thereby substantiating the theoretical foundation for the employment of interleukins in the management of neoplastic diseases.47–49 The cytokine IL-21 also exerts its antitumor effects by stimulating two antitumor immune populations, NK cells and cytotoxic T lymphocytes.50 In this study, a positive correlation was observed between the infiltration of T helper cells and the expression of TSTD2. Upon conducting Kaplan‒Meier survival analysis, it was revealed that high TSTD2 expression was significantly associated with a favorable prognosis in KIRC patients. Nevertheless, the connection between T helper cells and KIRC necessitates further inquiry. Therefore, in light of our discoveries and the aforementioned research reports, the association between TSTD2 and T helper cells warrants further exploration.
Based on the nomogram model analysis, the 1-, 3-, and 5-year OS probabilities of patients with KIRC were found to be significantly associated with age, TNM stage, and TSTD2 expression. With this in mind, our model has the potential to offer personalized scores for each individual KIRC patient.
However, the current study is limited by its sample size. To ensure the validity and representativeness of our findings and hypotheses, future research should aim to increase the sample size. Clinical specimens will be instrumental in confirming the prognostic predictive function of TSTD2 mRNA and protein in KIRC. Moreover, experimental validation is necessary to investigate the regulatory relationships between TSTD2 and the pathways identified by GSEA.
Conclusion
The downregulation of TSTD2 may serve as a biomarker for unfavorable outcomes in KIRC, indicating its potential role in the development and progression of the disease. Moreover, TSTD2 could potentially be targeted for therapeutic intervention. As such, it is imperative to further investigate the mechanistic involvement of TSTD2 in KIRC pathogenesis.
Consent for Publication
Informed consent for publication was obtained from all authors.
Author Contributions
All authors made a significant contribution to the work reported, whether that is in the conception, study design, execution, acquisition of data, analysis and interpretation, or in all these areas; took part in drafting, revising or critically reviewing the article; gave final approval of the version to be published; have agreed on the journal to which the article has been submitted; and agree to be accountable for all aspects of the work.
Funding
This work was supported by grants from the National Natural Science Foundation of China (No. 81870525) and the Taishan Scholars Program of Shandong Province (No. tsqn201909199).
Disclosure
The authors declare that there are no competing interests associated with this work.
References
1. Siegel R, Ma J, Zou Z, et al. Cancer statistics, 2014. CA Cancer J Clin. 2014;64(1):9–29. doi:10.3322/caac.21208
2. Srigley JR, Delahunt B, Eble JN, et al. The International Society of Urological Pathology (ISUP) Vancouver classification of renal neoplasia. Am J Surg Pathol. 2013;37(10):782–795. doi:10.1097/PAS.0b013e318299f2d1
3. Cui Y, Zhang C, Li Y, et al. HOXD1 functions as a novel tumor suppressor in kidney renal clear cell carcinoma. Cell Biol Int. 2021;45(6):1246–1259. doi:10.1002/cbin.11568
4. Huang Y, Wang J, Jia P, et al. Clonal architectures predict clinical outcome in clear cell renal cell carcinoma. Nat Commun. 2019;10(1):1245. doi:10.1038/s41467-019-09241-7
5. Barata PC, Rini BI. Treatment of renal cell carcinoma: current status and future directions. CA Cancer J Clin. 2017;67(6):507–524. doi:10.3322/caac.21411
6. Maran S, Lee YY, Xu SH, et al. Towards understanding the low prevalence of Helicobacter pylori in Malays: genetic variants among Helicobacter pylori -negative ethnic Malays in the north-eastern region of Peninsular Malaysia and Han Chinese and South Indians. J Dig Dis. 2013;14(4):196–202. doi:10.1111/1751-2980.12023
7. Wenzel K, Felix SB, Flachmeier C, et al. Identification and characterization of KAT, a novel gene preferentially expressed in several human cancer cell lines. Biol Chem. 2003;384(5):763–775. doi:10.1515/BC.2003.085
8. Libiad M, Motl N, Akey DL, et al. Thiosulfate sulfurtransferase-like domain–containing 1 protein interacts with thioredoxin. J Biol Chem. 2018;293(8):2675–2686. doi:10.1074/jbc.RA117.000826
9. Si T, Ning X, Chen H, et al. ANTXR1 as a potential prognostic biomarker for hepatitis B virus-related hepatocellular carcinoma identified by a weighted gene correlation network analysis. J Gastrointest Oncol. 2021;12(6):3079–3092. doi:10.21037/jgo-21-764
10. Kichaev G, Bhatia G, Loh P-R, et al. Leveraging polygenic functional enrichment to improve GWAS power. Am J Hum Genet. 2019;104(1):65–75. doi:10.1016/j.ajhg.2018.11.008
11. Wood AR, Esko T, Yang J, et al. Defining the role of common variation in the genomic and biological architecture of adult human height. Nat Genet. 2014;46(11):1173–1186. doi:10.1038/ng.3097
12. Weiss B, Eberle B, Roeth R, et al. Evidence that non-syndromic familial tall stature has an oligogenic origin including ciliary genes. Front Endocrinol. 2021;12:660731. doi:10.3389/fendo.2021.660731
13. Li K, Luo H, Luo H, et al. Clinical and prognostic pan-cancer analysis of m6A RNA methylation regulators in four types of endocrine system tumors. Aging. 2020;12(23):23931–23944. doi:10.18632/aging.104064
14. Goldman MJ, Craft B, Hastie M, et al. Visualizing and interpreting cancer genomics data via the xena platform. Nat Biotechnol. 2020;38(6):675–678. doi:10.1038/s41587-020-0546-8
15. Love MI, Huber W, Anders S. Moderated estimation of fold change and dispersion for RNA-seq data with DESeq2. Genome Biol. 2014;15(12):550. doi:10.1186/s13059-014-0550-8
16. Yu G, Wang L-G, Han Y, et al. clusterProfiler: an R package for comparing biological themes among gene clusters. Omics. 2012;16(5):284–287. doi:10.1089/omi.2011.0118
17. Bindea G, Mlecnik B, Tosolini M, et al. Spatiotemporal dynamics of intratumoral immune cells reveal the immune landscape in human cancer. Immunity. 2013;39(4):782–795. doi:10.1016/j.immuni.2013.10.003
18. Szklarczyk D, Gable AL, Lyon D, et al. STRING v11: protein-protein association networks with increased coverage, supporting functional discovery in genome-wide experimental datasets. Nucleic Acids Res. 2019;47(D1):D607–D613. doi:10.1093/nar/gky1131
19. Demchak B, Hull T, Reich M, et al. Cytoscape: the network visualization tool for GenomeSpace workflows. F1000Res. 2014;3:151. doi:10.12688/f1000research.4492.2
20. Bandettini WP, Kellman P, Mancini C, et al. MultiContrast Delayed Enhancement (MCODE) improves detection of subendocardial myocardial infarction by late gadolinium enhancement cardiovascular magnetic resonance: a clinical validation study. J Cardiovasc Magn Reson. 2012;14(1):83. doi:10.1186/1532-429X-14-83
21. Mishanina TV, Libiad M, Banerjee R. Biogenesis of reactive sulfur species for signaling by hydrogen sulfide oxidation pathways. Nat Chem Biol. 2015;11(7):457–464. doi:10.1038/nchembio.1834
22. O’Gara EA, Hill DJ, Maslin DJ. Activities of garlic oil, garlic powder, and their diallyl constituents against Helicobacter pylori. Appl Environ Microbiol. 2000;66(5):2269–2273. doi:10.1128/AEM.66.5.2269-2273.2000
23. Haristoy X, Angioi-Duprez K, Duprez A, et al. Efficacy of sulforaphane in eradicating Helicobacter pylori in HumanGastric xenografts implanted in NudeMice. Antimicrob Agents Chemother. 2003;47(12):3982–3984. doi:10.1128/AAC.47.12.3982-3984.2003
24. Huang S, Liang S, Chen G, et al. Overexpression of glycosyltransferase 8 domain containing 2 confers ovarian cancer to CDDP resistance by activating FGFR/PI3K signalling axis. Oncogenesis. 2021;10(7):55. doi:10.1038/s41389-021-00343-w
25. Wu Y, Chen X, Wang S, et al. Advances in the relationship between glycosyltransferases and multidrug resistance in cancer. Clin Chim Acta. 2019;495:417–421. doi:10.1016/j.cca.2019.05.015
26. Lairson LL, Henrissat B, Davies GJ, et al. Glycosyltransferases: structures, functions, and mechanisms. Annu Rev Biochem. 2008;77(1):521–555. doi:10.1146/annurev.biochem.76.061005.092322
27. Song X, Ru M, Steinsnyder Z, et al. SNPs at SMG7 associated with time from biochemical recurrence to prostate cancer death. Cancer Epidemiol Biomarkers Prev. 2022;31(7):1466–1472. doi:10.1158/1055-9965.EPI-22-0053
28. Yang L, Kraft VAN, Pfeiffer S, et al. Nonsense-mediated decay factor SMG7 sensitizes cells to TNFα-induced apoptosis via CYLD tumor suppressor and the noncoding oncogene Pvt1. Mol Oncol. 2020;14(10):2420–2435. doi:10.1002/1878-0261.12754
29. Jo YS, Song SY, Kim MS, et al. Frameshift mutations of SMG7 essential for nonsense-mediated mRNA decay in gastric and colorectal cancers. Pathol Oncol Res. 2017;23(1):221–222. doi:10.1007/s12253-016-0141-y
30. Cimadamore A, Gasparrini S, Santoni M, et al. Biomarkers of aggressiveness in genitourinary tumors with emphasis on kidney, bladder, and prostate cancer. Expert Rev Mol Diagn. 2018;18(7):645–655. doi:10.1080/14737159.2018.1490179
31. Ramirez NE, Zhang Z, Madamanchi A, et al. The α₂β₁ integrin is a metastasis suppressor in mouse models and human cancer. J Clin Invest. 2011;121(1):226–237. doi:10.1172/JCI42328
32. Damsky CH, Werb Z. Signal transduction by integrin receptors for extracellular matrix: cooperative processing of extracellular information. Curr Opin Cell Biol. 1992;4(5):772–781. doi:10.1016/0955-0674(92)90100-Q
33. Dedhar S, Hannigan GE. Integrin cytoplasmic interactions and bidirectional transmembrane signalling. Curr Opin Cell Biol. 1996;8(5):657–669. doi:10.1016/S0955-0674(96)80107-4
34. Weaver VM, Petersen OW, Wang F, et al. Reversion of the malignant phenotype of human breast cells in three-dimensional culture and in vivo by integrin blocking antibodies. J Cell Biol. 1997;137(1):231–245. doi:10.1083/jcb.137.1.231
35. Albelda SM. Role of integrins and other cell adhesion molecules in tumor progression and metastasis. Lab Invest. 1993;68(1):4–17.
36. Shibue T, Weinberg RA. Integrin beta1-focal adhesion kinase signaling directs the proliferation of metastatic cancer cells disseminated in the lungs. Proc Natl Acad Sci U S A. 2009;106(25):10290–10295. doi:10.1073/pnas.0904227106
37. White DE, Muller WJ. Multifaceted roles of integrins in breast cancer metastasis. J Mammary Gland Biol Neoplasia. 2007;12(2–3):135–142. doi:10.1007/s10911-007-9045-5
38. Ho W-C, Heinemann C, Hangan D, et al. Modulation of in vivo migratory function of α2β1 integrin in mouse liver. Mol Biol Cell. 1997;8(10):1863–1875. doi:10.1091/mbc.8.10.1863
39. Yang C, Zeisberg M, Lively JC, et al. Integrin alpha1beta1 and alpha2beta1 are the key regulators of hepatocarcinoma cell invasion across the fibrotic matrix microenvironment. Cancer Res. 2003;63(23):8312–8317.
40. Yoshimura K, Meckel KF, Laird LS, et al. Integrin α2 mediates selective metastasis to the liver. Cancer Res. 2009;69(18):7320–7328. doi:10.1158/0008-5472.CAN-09-0315
41. Kumar V, Stellrecht K, Sercarz E. Inactivation of T cell receptor peptide-specific CD4 regulatory T cells induces chronic experimental autoimmune encephalomyelitis (EAE). J Exp Med. 1996;184(5):1609–1617. doi:10.1084/jem.184.5.1609
42. Schaerli P, Willimann K, Lang AB, et al. CXC chemokine receptor 5 expression defines follicular homing T cells with B cell helper function. J Exp Med. 2000;192(11):1553–1562. doi:10.1084/jem.192.11.1553
43. Bettelli E, Carrier Y, Gao W, et al. Reciprocal developmental pathways for the generation of pathogenic effector TH17 and regulatory T cells. Nature. 2006;441(7090):235–238. doi:10.1038/nature04753
44. Mangan PR, Harrington LE, O’Quinn DB, et al. Transforming growth factor-β induces development of the TH17 lineage. Nature. 2006;441(7090):231–234. doi:10.1038/nature04754
45. Veldhoen M, Hocking RJ, Atkins CJ, et al. TGFβ in the context of an inflammatory cytokine milieu supports de novo differentiation of IL-17-producing T cells. Immunity. 2006;24(2):179–189. doi:10.1016/j.immuni.2006.01.001
46. Accogli T, Bruchard M, Végran F. Modulation of CD4 T cell response according to tumor cytokine microenvironment. Cancers. 2021;13(3):373.
47. Charych DH, Hoch U, Langowski JL, et al. NKTR-214, an engineered cytokine with biased IL2 receptor binding, increased tumor exposure, and marked efficacy in mouse tumor models. Clin Cancer Res. 2016;22(3):680–690. doi:10.1158/1078-0432.CCR-15-1631
48. Diab A, Tannir NM, Bentebibel S-E, et al. Bempegaldesleukin (NKTR-214) plus nivolumab in patients with advanced solid tumors: phase I dose-escalation study of safety, efficacy, and immune activation (PIVOT-02). Cancer Discov. 2020;10(8):1158–1173. doi:10.1158/2159-8290.CD-19-1510
49. Bentebibel S-E, Hurwitz ME, Bernatchez C, et al. A first-in-human study and biomarker analysis of NKTR-214, a novel IL2Rβγ-biased cytokine, in patients with advanced or metastatic solid tumors. Cancer Discov. 2019;9(6):711–721. doi:10.1158/2159-8290.CD-18-1495
50. Skak K, Frederiksen KS, Lundsgaard D. Interleukin-21 activates human natural killer cells and modulates their surface receptor expression. Immunology. 2008;123(4):575–583. doi:10.1111/j.1365-2567.2007.02730.x
 © 2023 The Author(s). This work is published and licensed by Dove Medical Press Limited. The full terms of this license are available at https://www.dovepress.com/terms.php and incorporate the Creative Commons Attribution - Non Commercial (unported, v3.0) License.
By accessing the work you hereby accept the Terms. Non-commercial uses of the work are permitted without any further permission from Dove Medical Press Limited, provided the work is properly attributed. For permission for commercial use of this work, please see paragraphs 4.2 and 5 of our Terms.
© 2023 The Author(s). This work is published and licensed by Dove Medical Press Limited. The full terms of this license are available at https://www.dovepress.com/terms.php and incorporate the Creative Commons Attribution - Non Commercial (unported, v3.0) License.
By accessing the work you hereby accept the Terms. Non-commercial uses of the work are permitted without any further permission from Dove Medical Press Limited, provided the work is properly attributed. For permission for commercial use of this work, please see paragraphs 4.2 and 5 of our Terms.