")
Back to Journals » Clinical Epidemiology » Volume 15
Loss of Anthropometry-Lipids Relationship in Obese Adults: A Cross-Sectional Study in Southern China
Authors Huang W , Feng R, Xu X, Ma M, Chen J, Wang J, Hu Z, Du S, Ye W
Received 11 December 2022
Accepted for publication 11 February 2023
Published 17 February 2023 Volume 2023:15 Pages 191—201
DOI https://doi.org/10.2147/CLEP.S400150
Checked for plagiarism Yes
Review by Single anonymous peer review
Peer reviewer comments 3
Editor who approved publication: Professor Lars Pedersen
Wuqing Huang,1,* Ruimei Feng,1,* Xin Xu,1,* Mingyang Ma,1 Jun Chen,1 Junzhuo Wang,1 Zhijian Hu,1,2 Shanshan Du,1 Weimin Ye1– 3
1Department of Epidemiology and Health Statistics, School of Public Health, Fujian Medical University, Fuzhou, Fujian, People’s Republic of China; 2Key Laboratory of Ministry of Education for Gastrointestinal Cancer, Fujian Medical University, Fuzhou, People’s Republic of China; 3Department of Medical Epidemiology and Biostatistics, Karolinska Institutet, Stockholm, Sweden
*These authors contributed equally to this work
Correspondence: Weimin Ye; Shanshan Du, Fujian Medical University, No. 1, Xue Yuan Road, University Town, Fuzhou City, Fujian Province, 350108, People’s Republic of China, Tel +86 591 2286 2023, Fax +86 591 2286 2510, Email [email protected]; [email protected]
Background: Emerging data suggest that the interpretation of the association between obesity and lipids appears to be oversimplified. This study aimed to quantify the complex relationships between anthropometric indices and lipid profile.
Methods: This is a cross-sectional study including 9620 participants in Southern China. Anthropometric indices included the indices of general obesity (ie, body mass index (BMI)) and central obesity (ie, waist circumference (WC) and waist-to-hip ratio (WHR)). Lipids included low-density lipoprotein cholesterol (LDLc) and atherogenic lipids (ie, high-density lipoprotein cholesterol (HDLc), triglycerides (TG) and TG/HDLc ratio). LOESS regression and general linear model were the main statistical methods.
Results: Almost all associations between anthropometric indices and lipids were lost in obese adults. The loss of association occurred quicker with LDLc than that with atherogenic lipids; the break point for the association loss was at BMI of 24 kg/m2 with LDLc (Slope Below break-point = 1.81, P< 0.001; Slope Above break-point = 0.29, P=0.121), while at 28 kg/m2 with HDLC (Slope Below break-point = − 1.41, P< 0.001; Slope Above break-point = 0.07, P=0.666) or TG (Slope Below break-point = 4.96, P< 0.001; Slope Above break-point = 2.93, P=0.01), and at 30 kg/m2 with TG/HDLc ratio (Slope Below break-point = 0.15, P< 0.001; Slope Above break-point= 0.01, P=0.936), respectively. Similar relationships were found for WC and WHR. Besides, the presence of other metabolic disorders contributed to the loss of anthropometry-lipids relationships, for example, the BMI-LDLc association attenuated to null in both obese adults and non-obese population but with more than one other metabolic disorders.
Conclusion: The relationships were lost between anthropometric indices and lipids in obese adults with different break points across different lipids, which appeared to be dependent on metabolic status.
Keywords: anthropometry, lipid profile, epidemiology
Introduction
Both obesity and dyslipidemia are established risk factors of cardiovascular diseases.1–3 Low-density lipoprotein cholesterol (LDLc) is known to play a central role in the occurrence of cardiovascular diseases, while LDLc-lowering treatment cannot completely eliminate the risk of cardiovascular diseases. Residual risk of cardiovascular diseases may be related to atherogenic dyslipidemia, primarily characterized by increased triglycerides (TG) and decreased high-density lipoprotein cholesterol (HDLc), which is a component of obesity-driven metabolic syndrome.4–6 Recently, some studies found that positive association was not always observed between body mass index (BMI) and LDLc.7–9 For example, a cross-sectional study in the US and Spanish populations observed a U-shaped relationship with a clear break point between BMI and LDLc, in which the positive BMI-LDLc association was lost in obese population probably related to metabolic impairment, indicating that weight loss plays a smaller role in cardiovascular prevention via lowering LDLc in obese individuals.7 Although atherogenic dyslipidemia is commonly present in obese individuals, reduced level of TG was occasionally reported in individuals with extreme obesity.10 There is a lack of study elucidating the dose–response relationship between anthropometric indices and atherogenic lipids. Therefore, we aimed to explore the relationship between anthropometric indices and lipid profile in Chinese population.
Methods
Study Design and Population
This is a cross-sectional study within Fuqing Cohort Study. Fuqing Cohort Study is an ongoing project in Fuqing city, Fujian Province, located in Southern China, which is planned to recruit more than 50,000 residents aged 35–75 years living in several towns across Fuqing city.11 Two waves of this cohort project have been initiated in Gaoshan Town in 2019 and 2020, respectively. Until the end of June 2021, a total of 10,207 residents in the town have been recruited with baseline assessment. As shown in the flowchart (Supplementary Figure 1), after excluding participants with missing data of physical measurements or lipids information, a total of 9620 participants were finally included in the cross-sectional study. There were 3109 individuals who received repeated measurements in both waves, for these participants, baseline measurements in the second wave were used for cross-sectional analyses.
Anthropometric Measurements
Anthropometric measurements were conducted based on standard protocol by trained staff. Weight and height were measured by using an electronic scale and stadiometer (Tanita bioimpedance analyser, BC-601, Japan), keeping the participant stand upright with heels together, in bare feet and in light clothing. Waist and hip circumferences were measured by using a tape measure; waist circumference was measured at the halfway between the lowest rib and the top of iliac crest and hip circumference was measured at the largest circumference of the buttocks. Body mass index (BMI) was calculated as the weight (kg) divided by the height in squared meters (m2). Waist-to-hip ratio (WHR) was calculated as the ratio between waist circumference and hip circumference. BMI is regarded as a marker of general obesity, and population can be classified into four groups according to the criteria proposed for Chinese population as following: underweight (<18.5 kg/m2), normal weight (18.5–23.9 kg/m2), overweight (24.0–27.9 kg/m2) and obesity (≥28 kg/m2). Waist circumference (WC) or waist-to-hip ratio (WHR) is regarded as a marker of central obesity.
Lipids Measurements
12-h fasting blood samples were obtained by professional nurses. Serum LDLc, HDLc and triglycerides were measured using automatic biochemical analyser (Toshiba automatic biochemical analyzer, TBA-120FR, Japan) within 4 hours after collection. The unit was converted from mmol/L to mg/dL for LDLc or HDLc via multiplying by 38.67, for triglycerides via multiplying by 88.57. Triglycerides/HDLc ratio was calculated as the ratio between triglycerides and HDLc, which is regarded as a marker of atherogenic dyslipidemia.
Covariates
Fasting blood glucose was also measured using automatic biochemical analyser (Toshiba automatic biochemical analyzer, TBA-120FR, Japan) within 4 hours after collection. The unit was converted from mmol/L to mg/dL for glucose via multiplying by 18. Blood pressure was measured by using blood pressure monitor (Omron blood pressure (BP) measuring device, U30, Japan) after having a rest for 5 minutes in a sitting position, and the average value of two consecutive blood pressure readings was used in the study. Metabolic disorders included increased LDLc and components of metabolic syndrome in this study. Increased LDLc was defined as ≥3.4 mmol/l. The component of metabolic syndrome was defined according to the IDF definition as following: central obesity (waist circumference ≥90 cm for males or ≥80 cm for females); increased triglycerides (≥1.7 mmol/l); decreased HDLc (<1.03 mmol/l in males and <1.29 mmol/l in females); increased blood pressure (systolic blood pressure ≥130 mmHg or diastolic blood pressure ≥85 mmHg or self-report previous diagnosis of hypertension or treatment for hypertension); increased fasting blood glucose (≥5.6 mmol/l or self-report previous diagnosis of diabetes or treatment for diabetes).12 The number of metabolic disorders was calculated as the sum of metabolic disorders excluding central obesity and the type of lipid of focus, which ranged from 0 to 4. For the analyses for TG/HDLc ratio, central obesity, triglycerides and HDLc were excluded in the calculation of the number of metabolic disorders, thus the value ranged from 0 to 3. Medication use was defined as ever intake of specific medicines during the past six months. Smoking was defined as at least one cigarette per day during the past six months and categorized as never, former, current smoker. Alcohol drinking was defined as drinking at least once per week in the past year and categorized as never, former, current drinker.
Statistical Analysis
Linear regression was first performed to estimate the linear association between anthropometric indices and lipids. Next, locally weighted scatterplot smoothing (LOESS) regression was used to explore the anthropometry-lipids associations graphically with a span of 0.75, which is an approach free of assumptions regarding the shape of the relationships. According to the shape of LOESS regression, we then applied general linear model with two segments to assess the anthropometry-lipids relationships numerically (mg/dL per anthropometric unit) by adjusting for age, sex and number of metabolic disorders (excluding central obesity and the lipid of focus), in which the break point was determined automatically by using segmented regression. In addition, to explore the metabolism-related variations in the associations between BMI and lipids, stratified analyses based on the number of metabolic disorders were performed by using LOESS regression and general linear regression in two segments with break point at BMI of 28 kg/m2, which is the cutoff value for defining obesity based on Chinese criteria.
A series of sensitivity analyses were further performed to explore the BMI-lipids associations in subpopulations. First, stratified analyses by specific metabolic disorder were conducted to estimate the role of specific metabolic disorder in the observed BMI-lipids associations. Second, to take into account the potential effect of lipid-lowering drug use, we explored the BMI-lipids associations in lipid-lowering users and non-users, respectively. Third, to assess the age and sex-related variations in lipids, we used generalized additive model with smooth function to explore the relationship between age, BMI and lipids graphically in women and men, respectively. Based on the contour plot from generalized additive model, we then divided the population into <55 or ≥55 years old and explored the age and sex-specific BMI-lipids associations. Finally, a total of 3109 participants received repeated measurements over one-year period, which allowed us to assess the anthropometry-lipids relationships via a prospective design. We then validated the observed associations by estimating the relationships by using measurements of anthropometric indices and covariates in the first wave as the baseline information and lipid profile obtained in the second wave as the outcome. All analyses were performed in the R statistical software (version 4.1.2). Two-tailed P < 0.05 was considered as statistically significant.
Patient and Public Involvement
Patients or the public were not involved in the design, or conduct, or reporting, or dissemination plans of our research.
Results
A total of 9620 participants were included in the analysis with 6085 (63.3%) females and 3535 (36.7%) males. The baseline information of the study population is shown in Table 1 and Supplementary Table 1. The mean age is 57.8 years old, and the mean value of BMI, waist circumference and WHR is 24.2 kg/m2, 83.1 cm, and 0.9, respectively. The mean value of lipids is 126.6 mg/dl for LDLc, 61.2 mg/dl for HDLc, 121.5 mg/dl for TG and 2.2 for TG/HDLc ratio, respectively. Linear regression analysis showed significant positive associations of anthropometric indices with LDLc, TG or TG/HDLc, and negative relationships between anthropometric indices and HDLc (Supplementary Table 2).
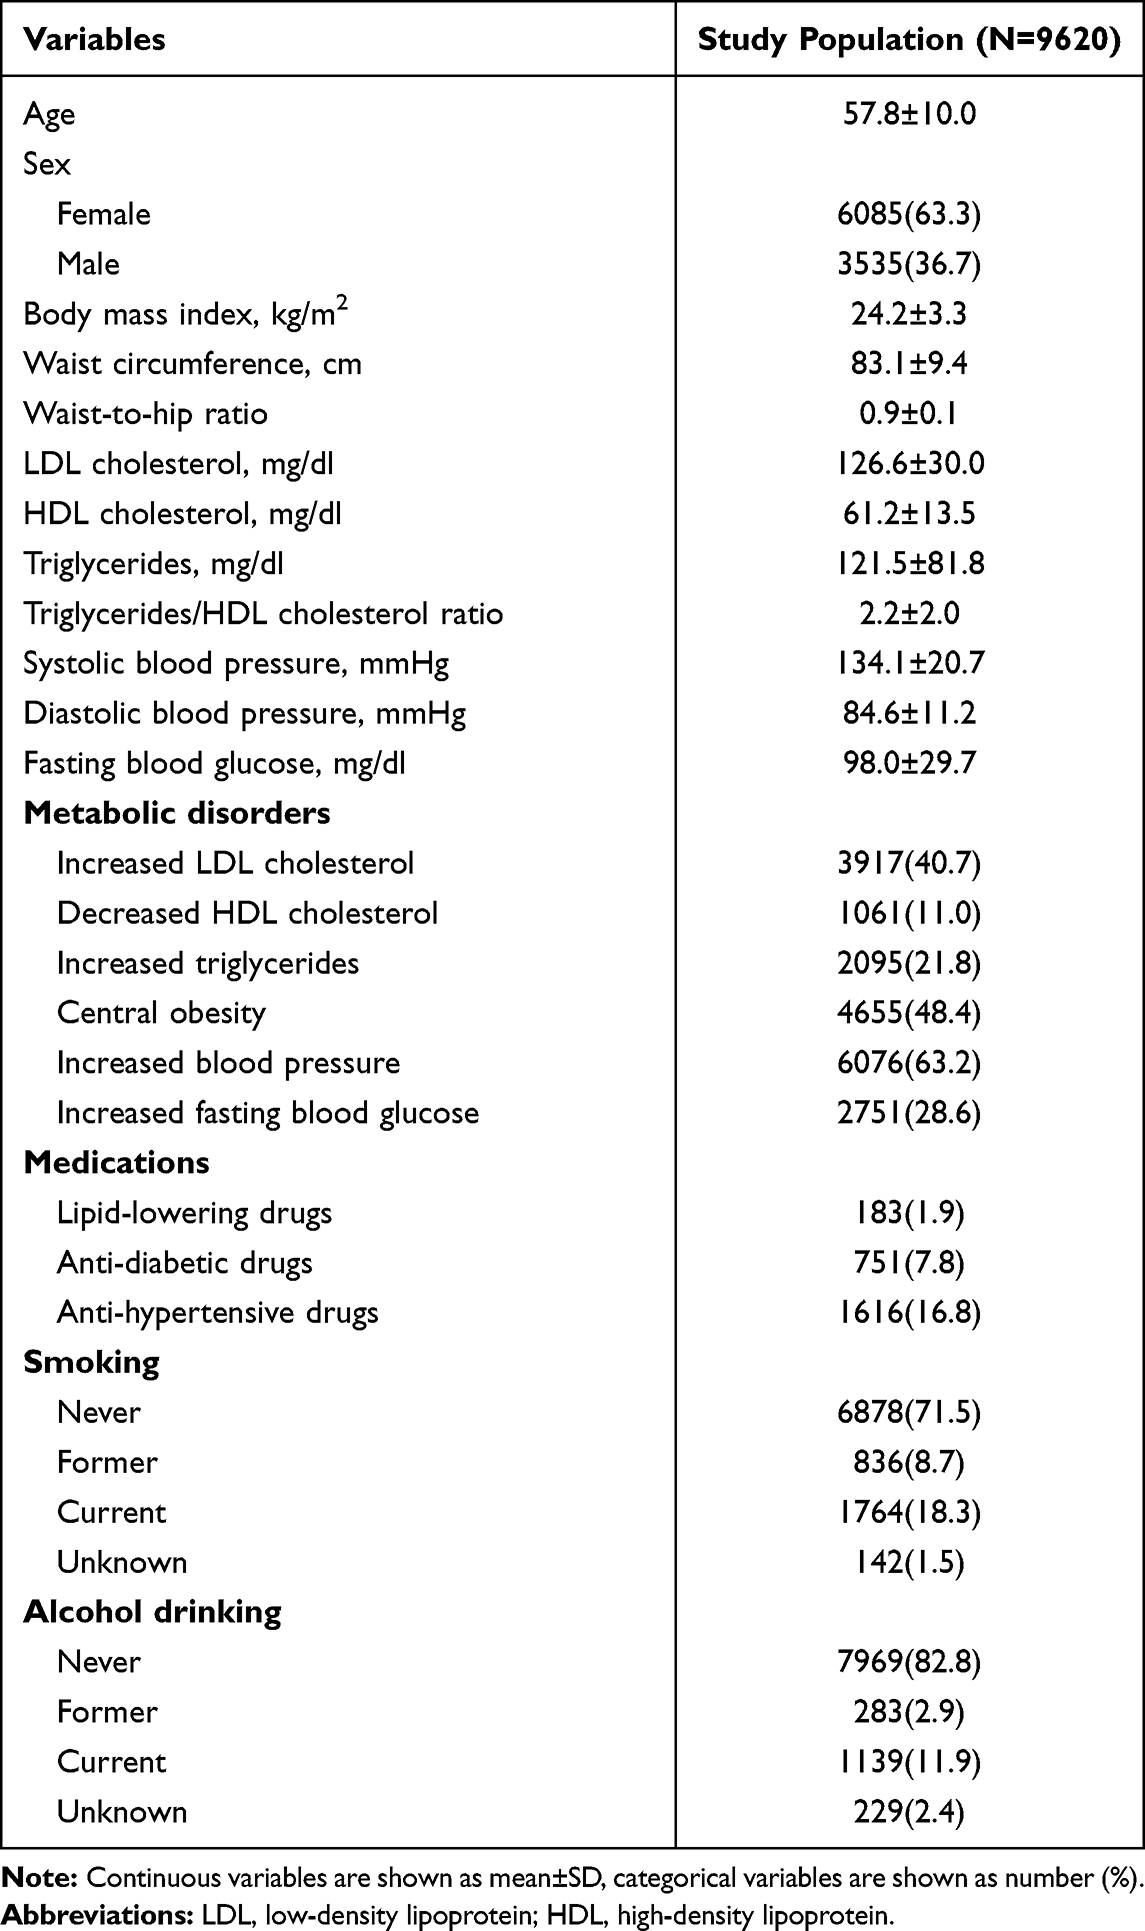 |
Table 1 Characteristics of the Study Population |
As shown in Figures 1 and 2, LOESS regression analyses found non-linear relationships between anthropometric indices and LDLc or atherogenic lipids. Besides, these observed relationships with specific lipid were similar across groups defined by BMI, WC and WHR. In Figure 1, similar inverted L-shaped relationships with clear break point were observed between all anthropometric indices and LDLc. After adjusting for age, sex and metabolic disorders, break point was found at BMI of 24 kg/m2, at WC of 82 cm, and at WHR of 0.9, respectively (Table 2). In Figure 2, for HDLc, a relationship close to “U” shape with a clear break point was observed with anthropometric indices; for TG and the ratio of TG/HDLc, the associations were close to inverted L-shaped with anthropometric indices. After adjusting for age, sex and metabolic disorders, the break point was found at the BMI of 28, 28, or 30 kg/m2 for the association with HDLc, TG or TG/HDLc ratio, respectively; at the WC of 97, 98 or 99 cm, respectively; and at the WHR of 1.0,1.0 or 1.0, respectively (Table 2). Below these break points, all anthropometric-lipids associations were statistically significant (P<0.001), while above these break points, most observed associations attenuated to null except for the association between BMI and TG. Although the positive association kept statistically significant, the slope between BMI and TG declined from 4.96 (P<0.001) to 2.93 (P=0.011).
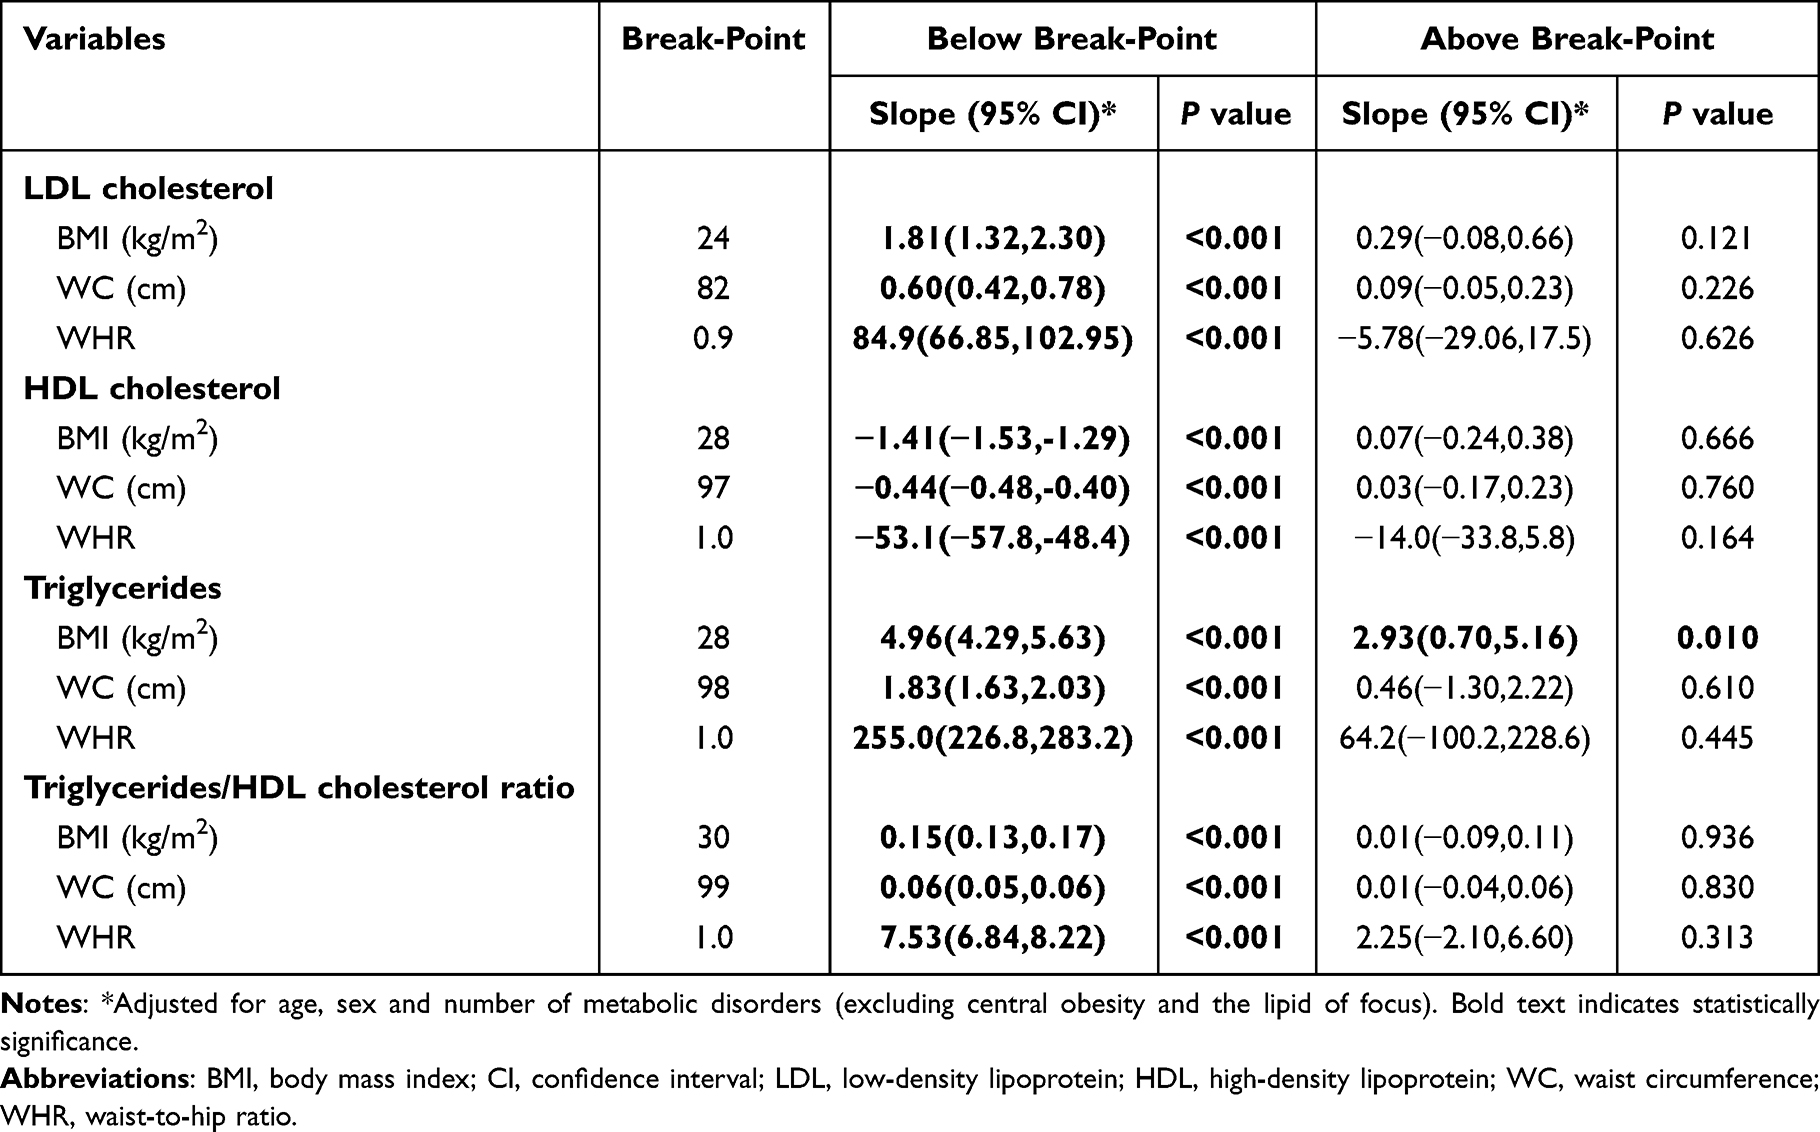 |
Table 2 Slopes (95% CIs) of the Association Between Anthropometric Indices and Lipids Among Individuals Below or Above the Estimated Break Point |
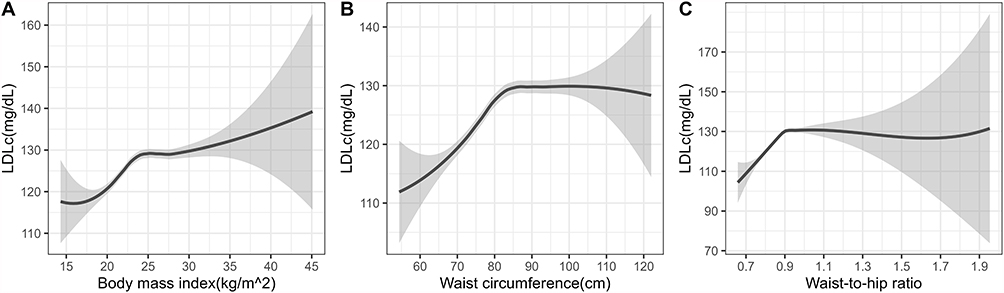 |
Figure 1 LOESS regressions between anthropometric indices and LDL cholesterol. (A) Body mass index and LDL cholesterol; (B) waist circumference and LDL cholesterol; (C) waist-to-hip ratio and LDL cholesterol. |
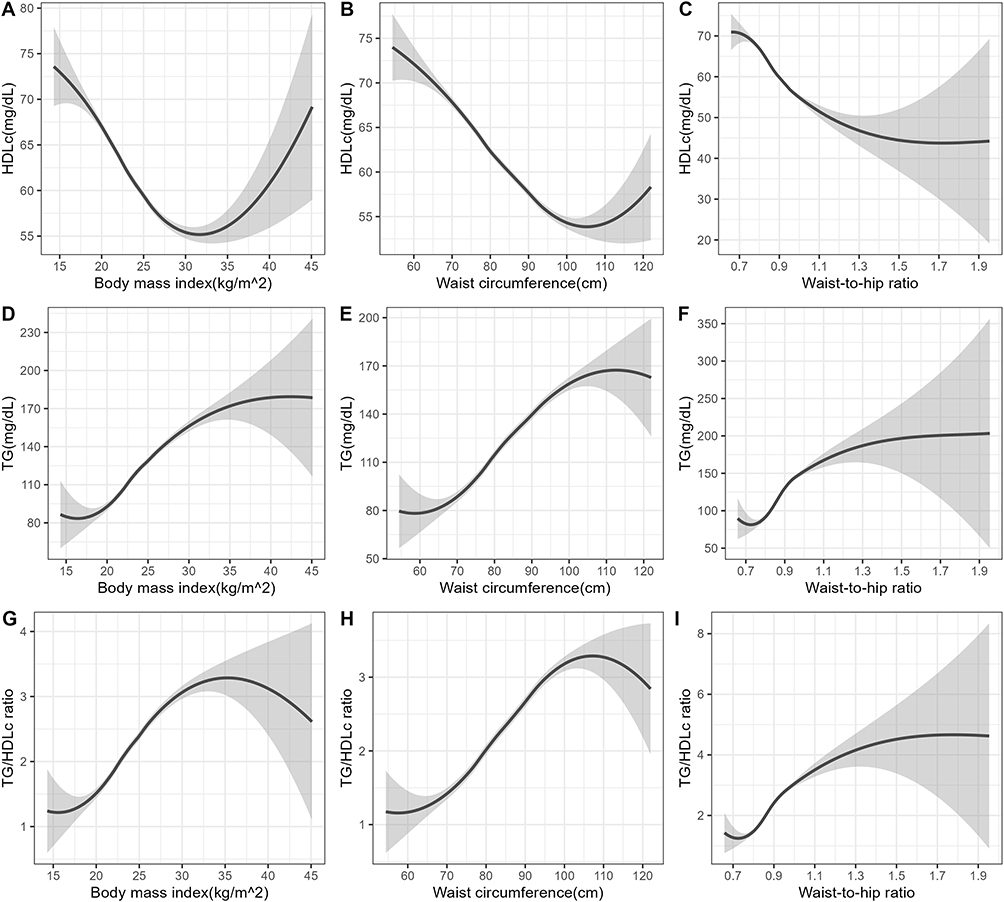 |
Figure 2 LOESS regressions between anthropometric indices and atherogenic lipids. (A) Body mass index and HDL cholesterol; (B) waist circumference and HDL cholesterol; (C) waist-to-hip ratio and HDL cholesterol; (D) body mass index and triglycerides; (E) waist circumference and triglycerides; (F) waist-to-hip ratio and triglycerides; (G) body mass index and triglycerides-to-HDL cholesterol ratio; (H) waist circumference and triglycerides-to-HDL cholesterol ratio; (I) waist-to-hip ratio and triglycerides-to-HDL cholesterol ratio. |
Due to the similar relationships across anthropometric indices, stratified analyses were then performed for BMI-lipids relationships. By combining results stratified by number of metabolic disorders using LOESS regression (Figure 3) and general linear model with break point at the BMI of 28 kg/m2 (Table 3), we found that the inverted L-shaped relationship between BMI and LDLc was only observed in the population without or with one metabolic disorder, while the associations attenuated to null in non-obese population but with more than one other metabolic disorders. Figure 3 shows that the break point in the U-shaped or inverted L-shaped relationship between BMI and atherogenic lipids occurred quicker in population with more metabolic disorders. In Table 3, there were significant associations between BMI and atherogenic lipids in non-obese population (P<0.05) and marginally significant associations in obese population with one or two other metabolic disorders (P<0.1), while the associations were lost in the population with obesity and more than two other metabolic disorders. According to Figure 3, the non-significant association in obese population without other metabolic disorders was probably due to the small sample size, in which the upper limit of BMI was only around 35 kg/m2. These findings suggested that the loss of association between BMI and lipids might indicate the progression of metabolic impairment.
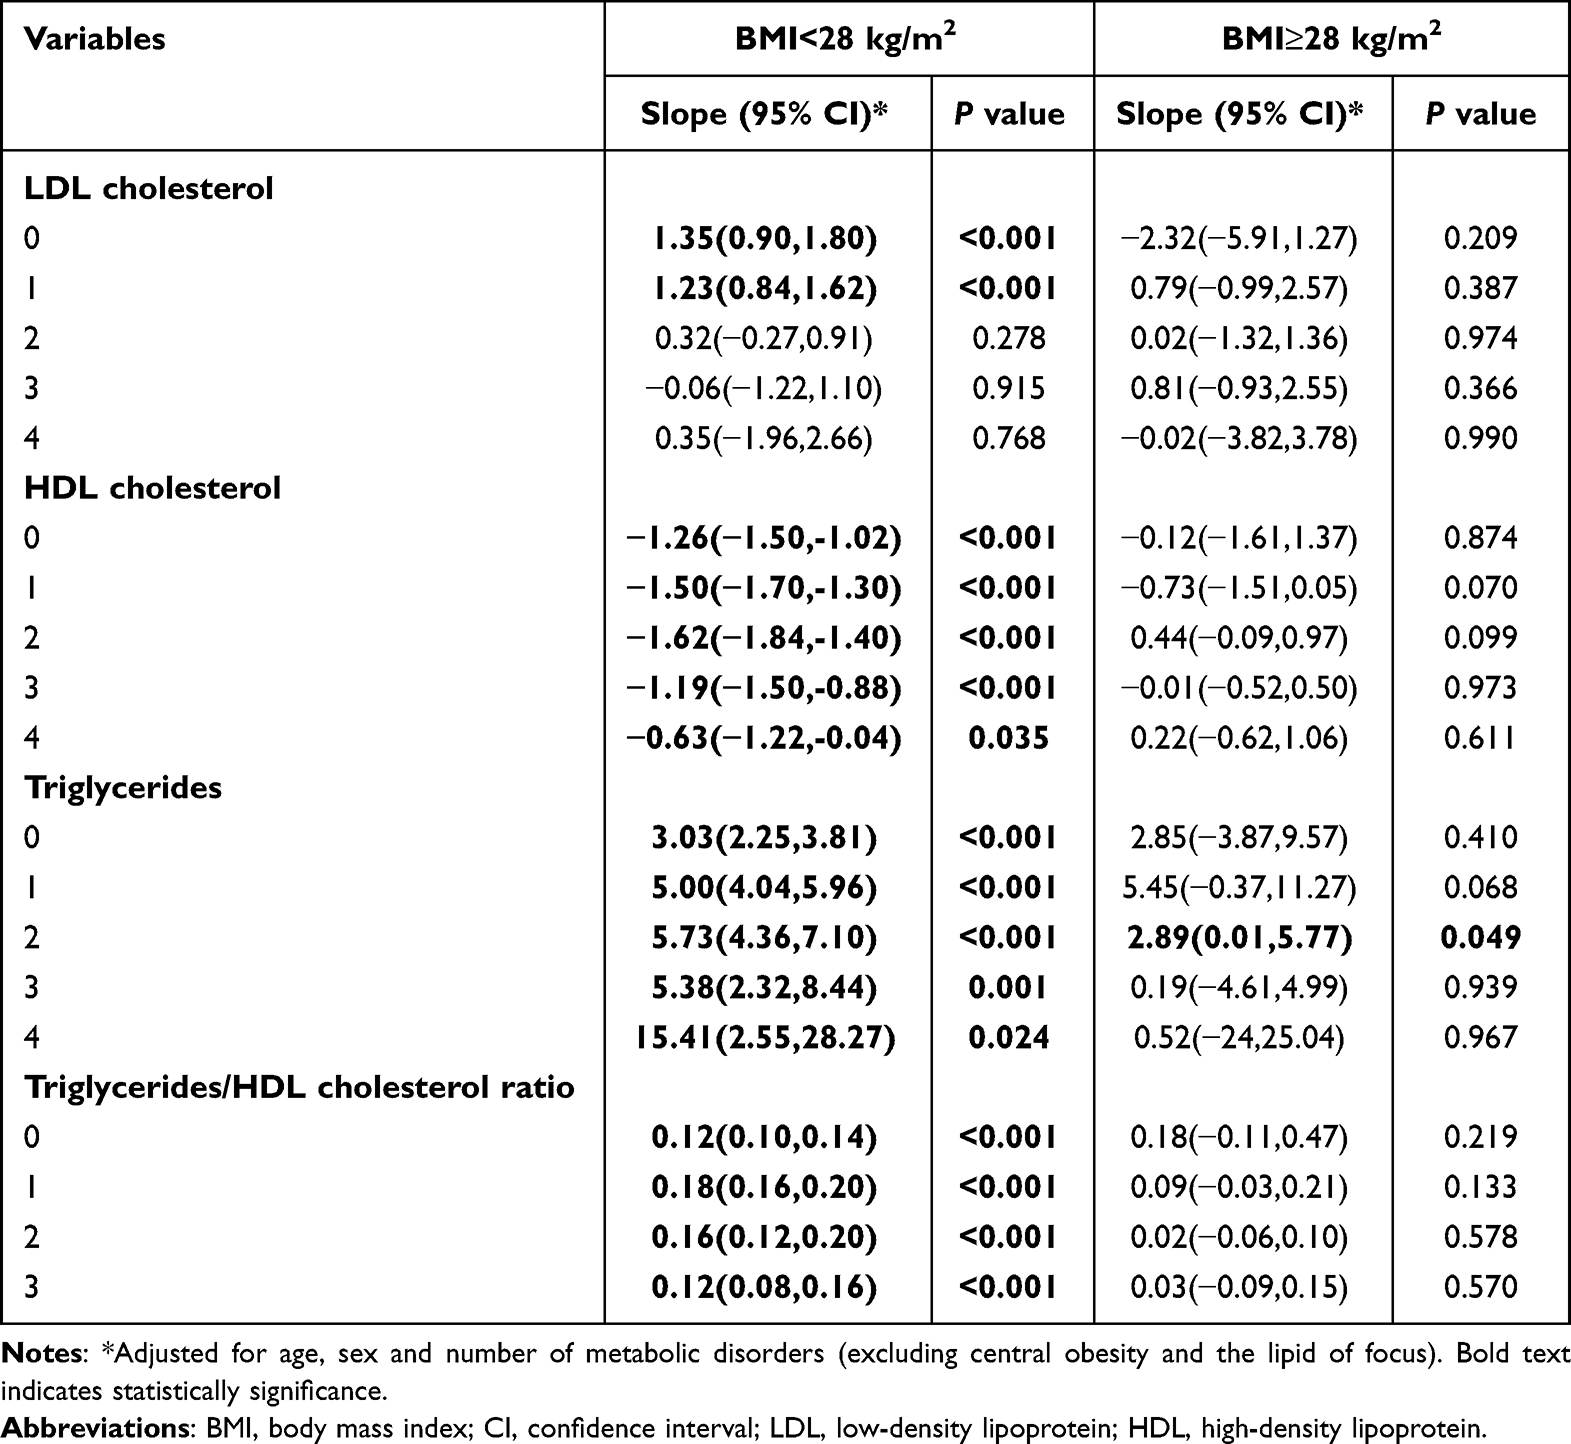 |
Table 3 Slopes (95% CIs) of the Association of Body Mass Index with Lipids Stratified by Number of Metabolic Disorders |
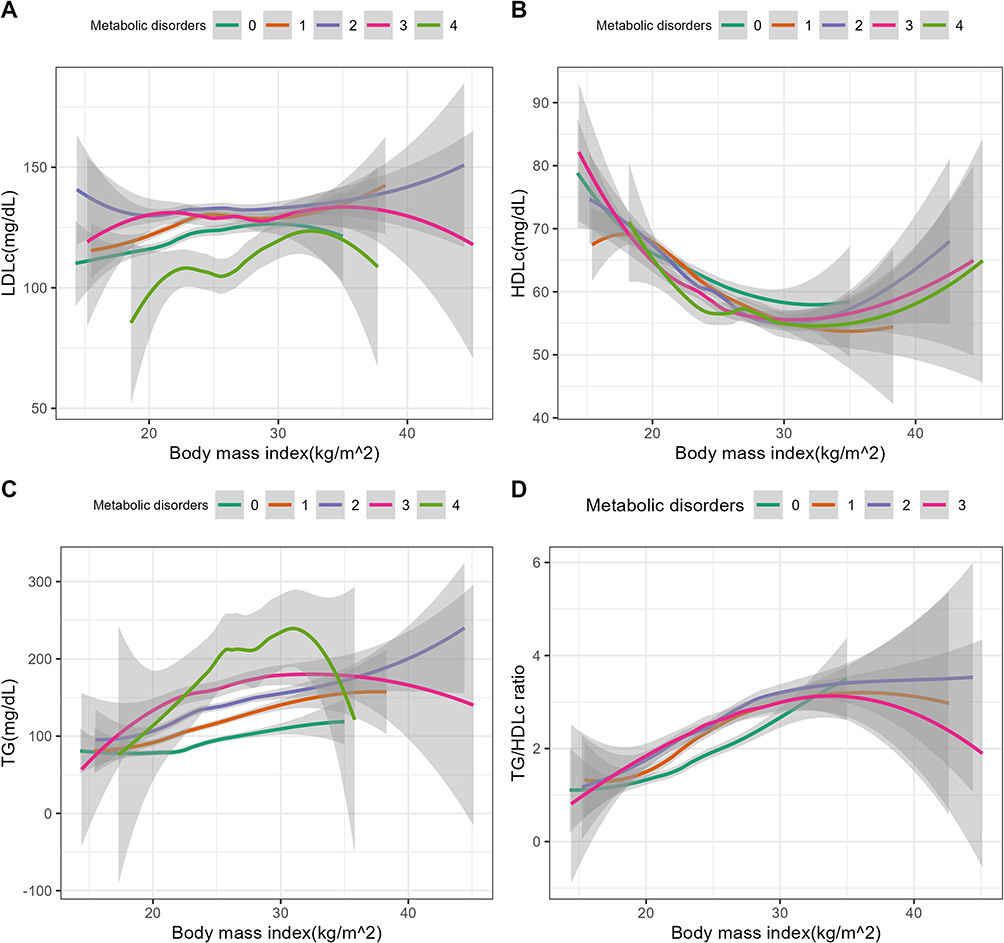 |
Figure 3 LOESS regressions between body mass index and lipids, stratified by number of metabolic disorders. (A) Body mass index and LDL cholesterol; (B) body mass index and HDL cholesterol; (C) body mass index and triglycerides; (D) body mass index and triglycerides-to-HDL cholesterol ratio. |
As shown in Supplementary Figures 2–5, stratified analyses by specific metabolic disorder showed that the BMI-LDLc association may be affected by any metabolic disorder, especially the decreased HDLc; the break point in the U-shaped relationship between BMI and HDLc occurred slightly quicker in the population with increased TG or increased blood pressure; the association between BMI and TG or TG/HDLc ratio may be affected by any metabolic disorder except increased LDLc. There were 183 (1.9%) participants who self-reported use of lipid-lowering drugs. Stratified analyses by lipid-lowering drug use found that all observed BMI-lipids relationships disappeared in lipid-lowering drug users (Supplementary Figure 6). In Supplementary Figure 7, contour plots from generalized additive models showed there were age- and sex-based differences in the level of lipids. In females, LDLc was increased across the increasing age and BMI with the highest level in older population with obesity, while in males, LDLc was increased across the increasing BMI with the highest level in obese population at age of below 55 years; HDLc decreased and TG or TG/HDLc increased with the increasing BMI in both women and men, and age played a small role in the level of atherogenic lipids. Stratified analyses by sex observed similar BMI-lipids relationships between women and men, while the break points occurred quicker in males (Supplementary Figure 8). Stratified analyses by age of 55 years showed that the slope of LDLc on BMI declined in older population, while the association was approximately linear in younger population; the break point for the loss of positive relationship between BMI and atherogenic lipids occurred earlier in older population; these results suggested that loss of BMI-lipids associations tended to appear in older population (Supplementary Figure 9). Stratified analyses by both sex and age found there were some differences in the BMI-lipids relationships between women and men, for example, an inverted U-shaped relationship between BMI and LDLc was found in younger men but not in younger women (Supplementary Figure 10). Finally, we found similar relationships in the prospective study among subpopulation with repeated measurements (Supplementary Figure 11). Most anthropometry-lipids associations attenuated to null in obese adults except for the relationships between BMI and TG or TG/HDLc ratio, which kept significant but the strength of association declined to some extent (Supplementary Table 3).
Discussion
In the present cross-sectional study, the associations between anthropometric indices and lipids were almost lost in participants with general or central obesity. The loss of association occurred quicker with LDLc than atherogenic lipids, for example, the break point for the loss of association was at BMI of 24 kg/m2 with LDLc, while at 28 kg/m2 with HDLC or TG, and at 30 kg/m2 with TG/HDLc ratio, indicating that the loss of anthropometry-lipids associations was related to the progression of obesity. Obesity is always concurrent with multiple metabolic disorders, and our study found that the presence of other metabolic disorders contributed to the loss of anthropometry-lipids relationships, suggesting that metabolic health plays a role in anthropometry-lipids associations, the loss of which may indicate the metabolic dysfunction. In addition, these findings suggest that longitudinal studies are needed to distinguish the benefit of weight control on cardiovascular disease prevention via lipids modulation according to the metabolic status in the future.
Obesity is a well-established risk factor of cardiovascular diseases, and a number of conventional cardiovascular factors have been proposed to be involved in the pathways between obesity and cardiovascular diseases, such as dyslipidemia, hypertension, diabetes and so on.1,3,13 The correlation between obesity and dyslipidemia has been reported for decades; however, emerging evidence suggests that the interpretation of the correlation between obesity-related indices and lipids is probably oversimplified.7–10,13–16 For example, a large-scale prospective study found that cholesterol had the least mediation effect on the association between BMI and cardiovascular diseases, far behind blood glucose and blood pressure, indicating a weaker-than-expected association between BMI and cholesterol.17 Recently, some studies have quantified the relationship between BMI and LDLc and found a non-linear association between BMI or WC and LDLc level.7,8 A cross-sectional study conducted in the US and Spanish populations observed an inverted U-shaped association between BMI and LDLc with the break point at 27.1 and 26.5 kg/m2, respectively.7 Another pooled cross-sectional study including 7485 participants from the China Health and Retirement Longitudinal Study (CHARLS) and 4788 participants from China Health and Nutrition Survey (CHNS) observed a similar inverted U-shaped association only in men, while an approximately linear relationship was found in women.8 Consistently, in the present study among population in Southern China, a non-linear association was found between BMI and LDLc but approximately in an inverted L shape with a clear break point at the BMI of 24 kg/m2, which is the cutoff point of overweight according to Chinese criteria.
Atherogenic dyslipidemia is known to be a component of metabolic syndrome, which is an obesity-driven complex disorder with a cluster of interconnected components.5,18 Although increased TG and decreased HDLc are common in obese adults, the paradox that TG may be lower in morbidly obese individuals than those who are less overweight has been occasionally reported in previous studies.10 However, few studies have quantified the relationship between anthropometric indices and atherogenic lipids. The present study found that the significant correlation was not always observed between anthropometric indices and atherogenic lipids. Both the positive association of BMI with TG or TG/HDLc ratio and the negative association of BMI with HDLc tended to disappear in obese adults with the break point at BMI of 28 or 30 kg/m2. Similar relationships were found for parameters of central obesity, including WC and WHR. Consistent findings across groups defined by BMI, WC and WHR provided a strong evidence for the observed loss of anthropometry-lipids relationships in obese population.
Previous studies reported that metabolic syndrome components played a role in the BMI-LDLc association, and in this study, metabolic disorders were also found to contribute to the loss of association between anthropometric indices and LDLc as well as atherogenic lipids.7,8 It is known that obese individuals are at a higher risk of metabolic dysfunction; thus, these findings suggested that the loss of anthropometry-lipids associations may be related to metabolic status. Besides, the loss of associations tended to appear in lipid-lowering drug users, in which around 98% had at least one metabolic disorder, while the percentage was around 87% in non-users. Thus, the loss of associations in lipid-lowering drug users may be related to the metabolic dysfunction, but given of the small sample size, false null results cannot be ruled out. Overall, the break points for the loss of relationships between anthropometric indices and LDLc occurred quicker than that with atherogenic lipids. These break points might be an early sign of the progression of metabolic impairment in overweight or obese population, in which the loss of anthropometry-atherogenic lipids associations may indicate a more severe metabolic dysfunction.
Prior studies have demonstrated a sex-based difference in lipid metabolism probably due to sex hormones.19 For example, higher LDLc has been previously reported in postmenopausal women than premenopausal women, which was also found in this study population; the mean value of LDL is 133 mg/dl or 114 mg/dl in postmenopausal or premenopausal women, respectively (Supplementary Table 4, P<0.001), supporting the potential role of sex hormones in lipid metabolism.20,21 The current study observed sex-specific distribution of lipid level across different ages; the unfavorable level of lipids tended to occur in older women and younger men, typically elevated LDLc. The break point for the loss of association between anthropometric indices and lipids occurred earlier in men than women, which may be related to the sex-difference in lipid metabolism. In addition, consistent with previous studies, we found that aging population was more susceptible to the loss of association between anthropometric indices and lipids, which was probably linked to the decline of metabolic function in older adults.7,8,22 The observed metabolism-dependent loss of anthropometry-lipids associations suggested that individuals with metabolic impairment induced by aging, obesity or other metabolic disorders may lead to a reduction in benefits from weight loss, while younger population who are less overweight and free of metabolic disorders may benefit most from weight loss in cardiovascular disease prevention via lipid modulation.
This study provided additional evidence for the anthropometry-LDLc relationship and reported a quantified non-linear association between anthropometric indices and atherogenic lipids. However, these findings should be interpreted with caution regarding the generalization as the study population is restricted to the Southern Chinese population. For example, the break points for the loss of associations probably varied across diverse populations because of different susceptibilities. Besides, the cross-sectional design precluded us to draw a causal relationship; however, we conducted a sensitivity analysis via prospective design in a subpopulation with repeated measurements over one-year period and found similar relationships, indicating a potential causal relationship. The observed associations should be further confirmed in large-scale prospective studies.
In conclusion, this study found that the relationships between anthropometric indices and lipids lost in obese adults, while the break points for the association loss varied by type of lipids, which were at BMI of 24 kg/m2 with LDLc and 28 kg/m2 with atherogenic lipids. In addition, the association loss appeared to be dependent on metabolic status. These findings suggested that the association loss might be an indication of the progression of metabolic impairment, which in turn indicated that metabolic status may influence the effect of weight control on cardiovascular disease prevention by lipid modulation.
Abbreviations
BMI, body mass index; CI, confidence interval; LDLc, low-density lipoprotein cholesterol; HDLc, high-density lipoprotein cholesterol; LOESS, locally weighted scatterplot smoothing; TG, triglycerides; WC, waist circumference; WHR, waist-to-hip ratio.
Data Sharing Statement
Data described in the manuscript, code book, and analytic code will be made available upon reasonable request to the corresponding authors.
Ethics Approval and Consent to Participate
The study has been approved by the Ethics Review Committee of Fujian Medical University (approval number, [2017-07] and [2020-58]). All procedures were performed following the guidelines of the Declaration of Helsinki. All participants in Fuqing cohort provided written informed consent.
Acknowledgments
We thank the participants and investigators who contributed to the Fuqing cohort.
Funding
This study was jointly supported by the Government of Fuqing city [grant number: 2019B003], Ministry of Science and Technology of the People’s Republic of China [grant number: 2017YFC0907102], Department of Science and Technology of Fujian, China [grant number: 2019L3006, 2019Y9021], and High-level Talents Research Start-up Project of Fujian Medical University (No. XRCZX2021026, No. XRCZX2017035 and No. XRCZX2020034). The funders had no role in the study design, data collection and interpretation, or the decision to submit the work for publication.
Disclosure
The authors declare no conflicts of interest in this work.
References
1. Powell-Wiley TM, Poirier P, Burke LE, et al. Obesity and cardiovascular disease: a scientific statement from the American heart association. Circulation. 2021;143(21):e984–e1010. doi:10.1161/CIR.0000000000000973
2. Pirillo A, Casula M, Olmastroni E, Norata GD, Catapano AL. Global epidemiology of dyslipidaemias. Nat Rev Cardiol. 2021;18(10):689–700. doi:10.1038/s41569-021-00541-4
3. Elagizi A, Kachur S, Lavie CJ, et al. An overview and update on obesity and the obesity paradox in cardiovascular diseases. Prog Cardiovasc Dis. 2018;61(2):142–150. doi:10.1016/j.pcad.2018.07.003
4. Xiao C, Dash S, Morgantini C, Hegele RA, Lewis GF. Pharmacological targeting of the atherogenic dyslipidemia complex: the next frontier in CVD prevention beyond lowering LDL cholesterol. Diabetes. 2016;65(7):1767–1778. doi:10.2337/db16-0046
5. Bamba V, Rader DJ. Obesity and atherogenic dyslipidemia. Gastroenterology. 2007;132(6):2181–2190. doi:10.1053/j.gastro.2007.03.056
6. Tall AR, Thomas DG, Gonzalez-Cabodevilla AG, Goldberg IJ. Addressing dyslipidemic risk beyond LDL-cholesterol. J Clin Invest. 2022;132:1. doi:10.1172/JCI148559
7. Laclaustra M, Lopez-Garcia E, Civeira F, et al. LDL cholesterol rises with BMI only in lean individuals: cross-sectional U.S. and Spanish representative data. Diabetes Care. 2018;41(10):2195–2201. doi:10.2337/dc18-0372
8. Li H, Ma J, Zheng D, et al. Sex differences in the non-linear association between BMI and LDL cholesterol in middle-aged and older adults: findings from two nationally representative surveys in China. Lipids Health Dis. 2021;20(1):162. doi:10.1186/s12944-021-01591-w
9. Shamai L, Lurix E, Shen M, et al. Association of body mass index and lipid profiles: evaluation of a broad spectrum of body mass index patients including the morbidly obese. Obes Surg. 2011;21(1):42–47. doi:10.1007/s11695-010-0170-7
10. Livingston EH, Chandalia M, Abate N. Do current body mass index criteria for obesity surgery reflect cardiovascular risk? Surg Obes Relat Dis. 2007;3(6):577–585. doi:10.1016/j.soard.2007.07.013
11. Su Q, Chen H, Du S, et al. Association between serum bilirubin, lipid levels, and prevalence of femoral and carotid atherosclerosis: a population-based cross-sectional study. Arterioscler Thromb Vasc Biol. 2023;43(1):136–145. doi:10.1161/ATVBAHA.122.318086
12. Ford ES. Prevalence of the metabolic syndrome defined by the international diabetes federation among adults in the U.S. Diabetes Care. 2005;28(11):2745–2749. doi:10.2337/diacare.28.11.2745
13. Sung KC, Ryu S, Reaven GM. Relationship between obesity and several cardiovascular disease risk factors in apparently healthy Korean individuals: comparison of body mass index and waist circumference. Metabolism. 2007;56(3):297–303. doi:10.1016/j.metabol.2006.09.016
14. Vierhapper H, Nardi A, Grösser P. Prevalence of paradoxically normal serum cholesterol in morbidly obese women. Metabolism. 2000;49(5):607–610. doi:10.1016/S0026-0495(00)80035-9
15. Hussain A, Ali I, Kaleem WA, Yasmeen F. Correlation between body mass index and lipid profile in patients with type 2 diabetes attending a tertiary care hospital in Peshawar. Pak J Med Sci. 2019;35(3):591–597. doi:10.12669/pjms.35.3.7
16. Terry RB, Wood PD, Haskell WL, Stefanick ML, Krauss RM. Regional adiposity patterns in relation to lipids, lipoprotein cholesterol, and lipoprotein subfraction mass in men. J Clin Endocrinol Metab. 1989;68(1):191–199. doi:10.1210/jcem-68-1-191
17. Lu Y, Hajifathalian K, Ezzati M, Woodward M, Rimm EB, Danaei G. Metabolic mediators of the effects of body-mass index, overweight, and obesity on coronary heart disease and stroke: a pooled analysis of 97 prospective cohorts with 1·8 million participants. Lancet. 2014;383(9921):970–983.
18. Alberti KG, Zimmet P, Shaw J. The metabolic syndrome--a new worldwide definition. Lancet. 2005;366(9491):1059–1062. doi:10.1016/S0140-6736(05)67402-8
19. Palmisano BT, Zhu L, Eckel RH, Stafford JM. Sex differences in lipid and lipoprotein metabolism. Mol Metab. 2018;15:45–55. doi:10.1016/j.molmet.2018.05.008
20. Perry AC, Applegate EB, Allison ML, Miller PC, Signorile JF. Relation between anthropometric measures of fat distribution and cardiovascular risk factors in overweight pre- and postmenopausal women. Am J Clin Nutr. 1997;66(4):829–836. doi:10.1093/ajcn/66.4.829
21. Matthews KA, Meilahn E, Kuller LH, Kelsey SF, Caggiula AW, Wing RR. Menopause and risk factors for coronary heart disease. N Engl J Med. 1989;321(10):641–646. doi:10.1056/NEJM198909073211004
22. Hu F, Liu F. Targeting tissue-specific metabolic signaling pathways in aging: the promise and limitations. Protein Cell. 2014;5(1):21–35. doi:10.1007/s13238-013-0002-3
 © 2023 The Author(s). This work is published and licensed by Dove Medical Press Limited. The full terms of this license are available at https://www.dovepress.com/terms.php and incorporate the Creative Commons Attribution - Non Commercial (unported, v3.0) License.
By accessing the work you hereby accept the Terms. Non-commercial uses of the work are permitted without any further permission from Dove Medical Press Limited, provided the work is properly attributed. For permission for commercial use of this work, please see paragraphs 4.2 and 5 of our Terms.
© 2023 The Author(s). This work is published and licensed by Dove Medical Press Limited. The full terms of this license are available at https://www.dovepress.com/terms.php and incorporate the Creative Commons Attribution - Non Commercial (unported, v3.0) License.
By accessing the work you hereby accept the Terms. Non-commercial uses of the work are permitted without any further permission from Dove Medical Press Limited, provided the work is properly attributed. For permission for commercial use of this work, please see paragraphs 4.2 and 5 of our Terms.