")
Back to Journals » Therapeutics and Clinical Risk Management » Volume 16
Longitudinal Progression of Estimated GFR in HIV-1-Infected Patients with Normal Renal Function on Tenofovir-Based Therapy in China
Authors Liu F, Xu A, Zhao H , Yang Z, Chen C , Ranieri B , Bao J, Zheng G, Wang M, Wang Y, Xun Y
Received 31 December 2019
Accepted for publication 27 March 2020
Published 17 April 2020 Volume 2020:16 Pages 299—310
DOI https://doi.org/10.2147/TCRM.S243913
Checked for plagiarism Yes
Review by Single anonymous peer review
Peer reviewer comments 2
Editor who approved publication: Dr Deyun Wang
Fang Liu,1 Aifang Xu,1 Huaqing Zhao,2 Zongxing Yang,3 Chen Chen,4 Brona Ranieri,4 Jianfeng Bao,5 Guoxiang Zheng,3 Miaochan Wang,1 Ying Wang,1 Yunhao Xun5
1Medical Laboratory, Xixi Hospital of Hangzhou, Hangzhou, People’s Republic of China; 2Temple University School of Medicine, Department of Clinical Sciences, Philadelphia, PA, USA; 3Department of Infectious Diseases, Xixi Hospital of Hangzhou, Hangzhou, People’s Republic of China; 4Department of Neuroscience, Temple University, Philadelphia, PA, USA; 5Department of Integrated Chinese and Western Medicine, Xixi Hospital of Hangzhou, Hangzhou, People’s Republic of China
Correspondence: Yunhao Xun
Department of Integrated Chinese and Western Medicine, Xixi Hospital of Hangzhou, Zhejiang Chinese Medical University Affiliated Sixth Hospital, 2 Hengbu Road, Hangzhou 310023, People’s Republic of China
Tel +86-571-86481581
Fax +86-571-86481822
Email [email protected]
Purpose: Estimated glomerular filtration rate (eGFR) decline in HIV-1-infected patients exposure to tenofovir disoproxil fumarate (TDF) has been widely assessed using linear models, but nonlinear assumption is not well validated. We constructed a retrospective cohort study to assess whether eGFR decline follows nonlinearity during antiviral therapy.
Patients and Methods: We examined 823 (299 of TDF users and 524 of non-TDF users) treatment-naïve HIV-1-infected participants (age ≥ 17 years, initial eGFR ≥ 90 mL/min/1.73m2). Estimated GFR trajectories were compared by one-linear and piecewise-linear mixed effects models, before and after propensity score matching, respectively. Whether the incidence of renal dysfunction (reduced renal function [RRF], eGFR < 90 mL/min/1.73 m2 and rapid kidney function decline [RKFD], eGFR > − 3 mL/min/1.73 m2/year) follows nonlinearity was assessed by logistic regression.
Results: The median follow-up time of this study was 10 (interquartile range, 2– 20) months, during which 178 (21.6%) experienced RRF, and 451 (54.8%) experienced RKFD. The slopes (mL/min/1.73 m2/year) of eGFR were − 5.31 (95% CI: − 6.57, − 4.06) before 1.40 years, 4.83 (95% CI: 1.38, 8.28) from years 1.40 to 2.30 and − 3.71 (95% CI: − 5.97, − 1.45) after 2.30 years among TDF users. Within years 1.40– 2.30, each year of TDF exposure was associated with a 78% decreased risk of RKFD (95% CI: − 91%, − 49%). In comparison, eGFR increased slightly at the initiation of antiviral therapy, declined after 2.15 years (− 4.96; 95% CI: − 5.76, − 4.17) among non-TDF users. Such a progression nonlinear trajectory was missed on the assumption of one-linearity, whether in TDF or non-TDF users.
Conclusion: Over the piecewise mixed-effects analyses with the advantage of revealing the true nature of the exposure outcome relationships, an interesting reverse S-shaped relationship was observed. A routine screen based on nonlinearity could be more helpful for patient management.
Keywords: nonlinear trajectory, renal function, human immunodeficiency virus-1
Introduction
The widespread use of combination antiretroviral therapy (cART) has essentially improved the life expectancy of human immunodeficiency virus (HIV)-positive individuals.1 Tenofovir disoproxil fumarate (TDF), an inhibitor of nucleotide analogue reverse transcriptase, which is widely used in most countries around the world as a conventional component of cART for HIV treatment and is considered as the most cost-effective drug against HIV.2,3 In addition, TDF has been approved as part of a pre-exposure prophylaxis (PreP) to prevent the spread of HIV in those who are at high risk for contracting this virus.4 However, TDF is similar to adefovir and cidofovir, which possess potential nephrotoxicity, lifelong use of TDF can cause or exacerbate renal impairment,5,6 and more and more concerns have been raised on renal toxicity of TDF to improve patients’ quality of life during this drug exposure. Thus, accurate predictive analyses of renal function overtime will be helpful for the management of these patients.
Estimated glomerular filtration rate (eGFR) is a common indicator of renal function.7,8 Studies have consistently demonstrated that TDF is associated with a decline of eGFR and renal dysfunction in a subpopulation.9–14 Delineating exactly the eGFR progression trajectories on TDF therapy through routine screening is undoubtedly helpful in this scenario. Since a linear figure seems convenient to interpret, most of the relevant studies so far considered the decline of eGFR to be approximately linear. The real trajectory of eGFR over time is however missed in these simplified models, thus hinders the optimization of TDF therapy based on renal function progression. In chronic kidney disease (CKD) population, several groups have reported nonlinear trajectories of eGFR in the past few years, its implications on risk estimation have gained interest and encouraged researchers to identify time-dependent factors associated with this phenomenon in CKD with different origins.15–17 However, no studies from HIV-1-infected patients have yet rigorously assessed the nonlinear changes of eGFR over time, especially in patients with normal eGFR on initiation of TDF-based antiviral therapy.
The objective of this study was to comprehensively analyze the trajectory of eGFR over time, and to compare the impact of regimens with or without TDF on this trajectory, in a Chinese cohort of treatment-naïve HIV-1-positive individuals. We also assessed the incidence of renal dysfunction based on nonlinear changes in eGFR, by using a two-piecewise logistic regression model.
Patients and Methods
Study Population
This is a retrospective, observational cohort study conducted at the infectious diseases department at Xixi Hospital of Hangzhou (Zhejiang, Southeast China). All treatment-naïve HIV-1-positive patients with records of cART initiation between January 26, 2010 and December 31, 2015 were screened for eligibility. All data were anonymized to comply with the provisions of personal data protection legislation. Due to the retrospective nature of this study and all data were collected anonymously, written informed consent was not required. This study was approved by the Institutional Review Board of Xixi Hospital.
Data Collection and Inclusion Criteria
Data extracted from the medical records included demographic parameters, date of cART initiation, details of the cART regimens, route of HIV-1 transmission, comorbidities, laboratory variables (HIV-1 RNA viral load, CD4+ lymphocyte cell count, and serum creatinine [SCr]) at baseline, and SCr at 2 weeks, 1 month, 2 months, 3 months, and every 3 months thereafter until January 2017. Isotope dilution mass spectrometry traceable calibration method was used to standardize the measurement of SCr. Baseline was defined as the date of starting cART. Each enrolled patient was 17 years old or more, had a normal baseline eGFR, and had at least one additional eGFR measurement since January 2010. The flowchart is detailed in Figure 1.
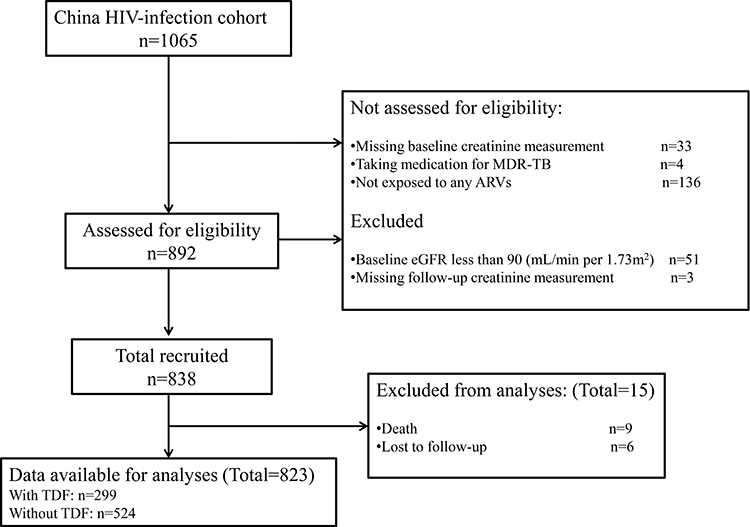 |
Figure 1 Study flow diagram. |
Quantitative Variables
The three-variable Modification of Diet in Renal Disease (MDRD) formula adjusted for Chinese populations was used to calculate the eGFR values, as the Chinese eGFR investigation collaboration recommend the use of MDRD equation for Chinese, rather than CKD-EPI.18–20
Combination ART was defined as the combined use of three or more ARVs from any drug class. Patients who took TDF alone or any TDF-containing regimen (TDF + lamivudine [3TC], or emtricitabine [FTC] + nevirapine [NVP], or efavirenz [EFV], or zidovudine [AZT]) were classified as TDF users. Patients exposed to any ARVs except TDF (AZT, or stavudine [d4T] + 3TC + NVP, or EFV) were classified as non-TDF users.
The two outcome definitions of this study were reduced renal function (RRF: eGFR ≥ 90 mL/min/1.73 m2 at baseline and eGFR < 90 mL/min/1.73 m2 during follow-up),21 and rapid kidney function decline (RKFD: with progression to CKD; eGFR decline > 3 mL/min/1.73 m2/year, estimated by least-squares regression).22
Statistical Analyses
Baseline characteristics were compared between TDF users and non-TDF users. Three models were used to analyze eGFR progression over time since ART initiation in each group (Table 1). Model 1, the crude one, was not adjusted for any covariates. Model 2 was adjusted for age, sex, weight, height, body mass index (BMI), CD4 count, eGFR, dyslipidemia, HIV/AIDS risk factors (sexual orientation and intravenous drug use), WHO stage (III/IV HIV/AIDS), hepatitis B positivity, hepatitis C positivity, anemia, diabetes, and HIV-1 RNA viral load at baseline. Model 3 used propensity score matching (PSM) to reduce preexisting imbalances in the covariates and potential confounding,23,24 and a covariate was considered well balanced when the P value was more than 0.05 (Table 2), more technical details were as in additional Table S1.
 |
Table 1 The Difference of Slopes Before and After Cutoff Times and Comparison of One-Linear and Piecewise-Linear Models |
 |
Table 2 Characteristics at Cohort Entry Stratified by Tenofovir Disoproxil Fumarate Before and After Propensity Score Matching |
The nonlinear trajectories of eGFR were determined by smooth curve fitting using a generalized additive model (GAM). Two methods were used to identify significant time points (inflection points on the smooth curves): one determined whether the difference of segmented slopes was equal to zero by the Wald test; the other applied a log likelihood ratio test to compare a nonlinear regression model with a one-linear regression model (Table 1). Eventually, the time points were determined by constructing a maximum likelihood model using a recursion method. A two-piecewise linear mixed effects model, with random intercepts, was applied to quantify the average change per year of eGFR during different periods on cART (Table 3). In addition, a two-piecewise logistic regression model based on Generalized Estimating Equation (GEE) was used to estimate the relationship of cART duration with RRF and with RKFD (Table 4). All multivariate regression models were adjusted for the covariates used in Model 2.
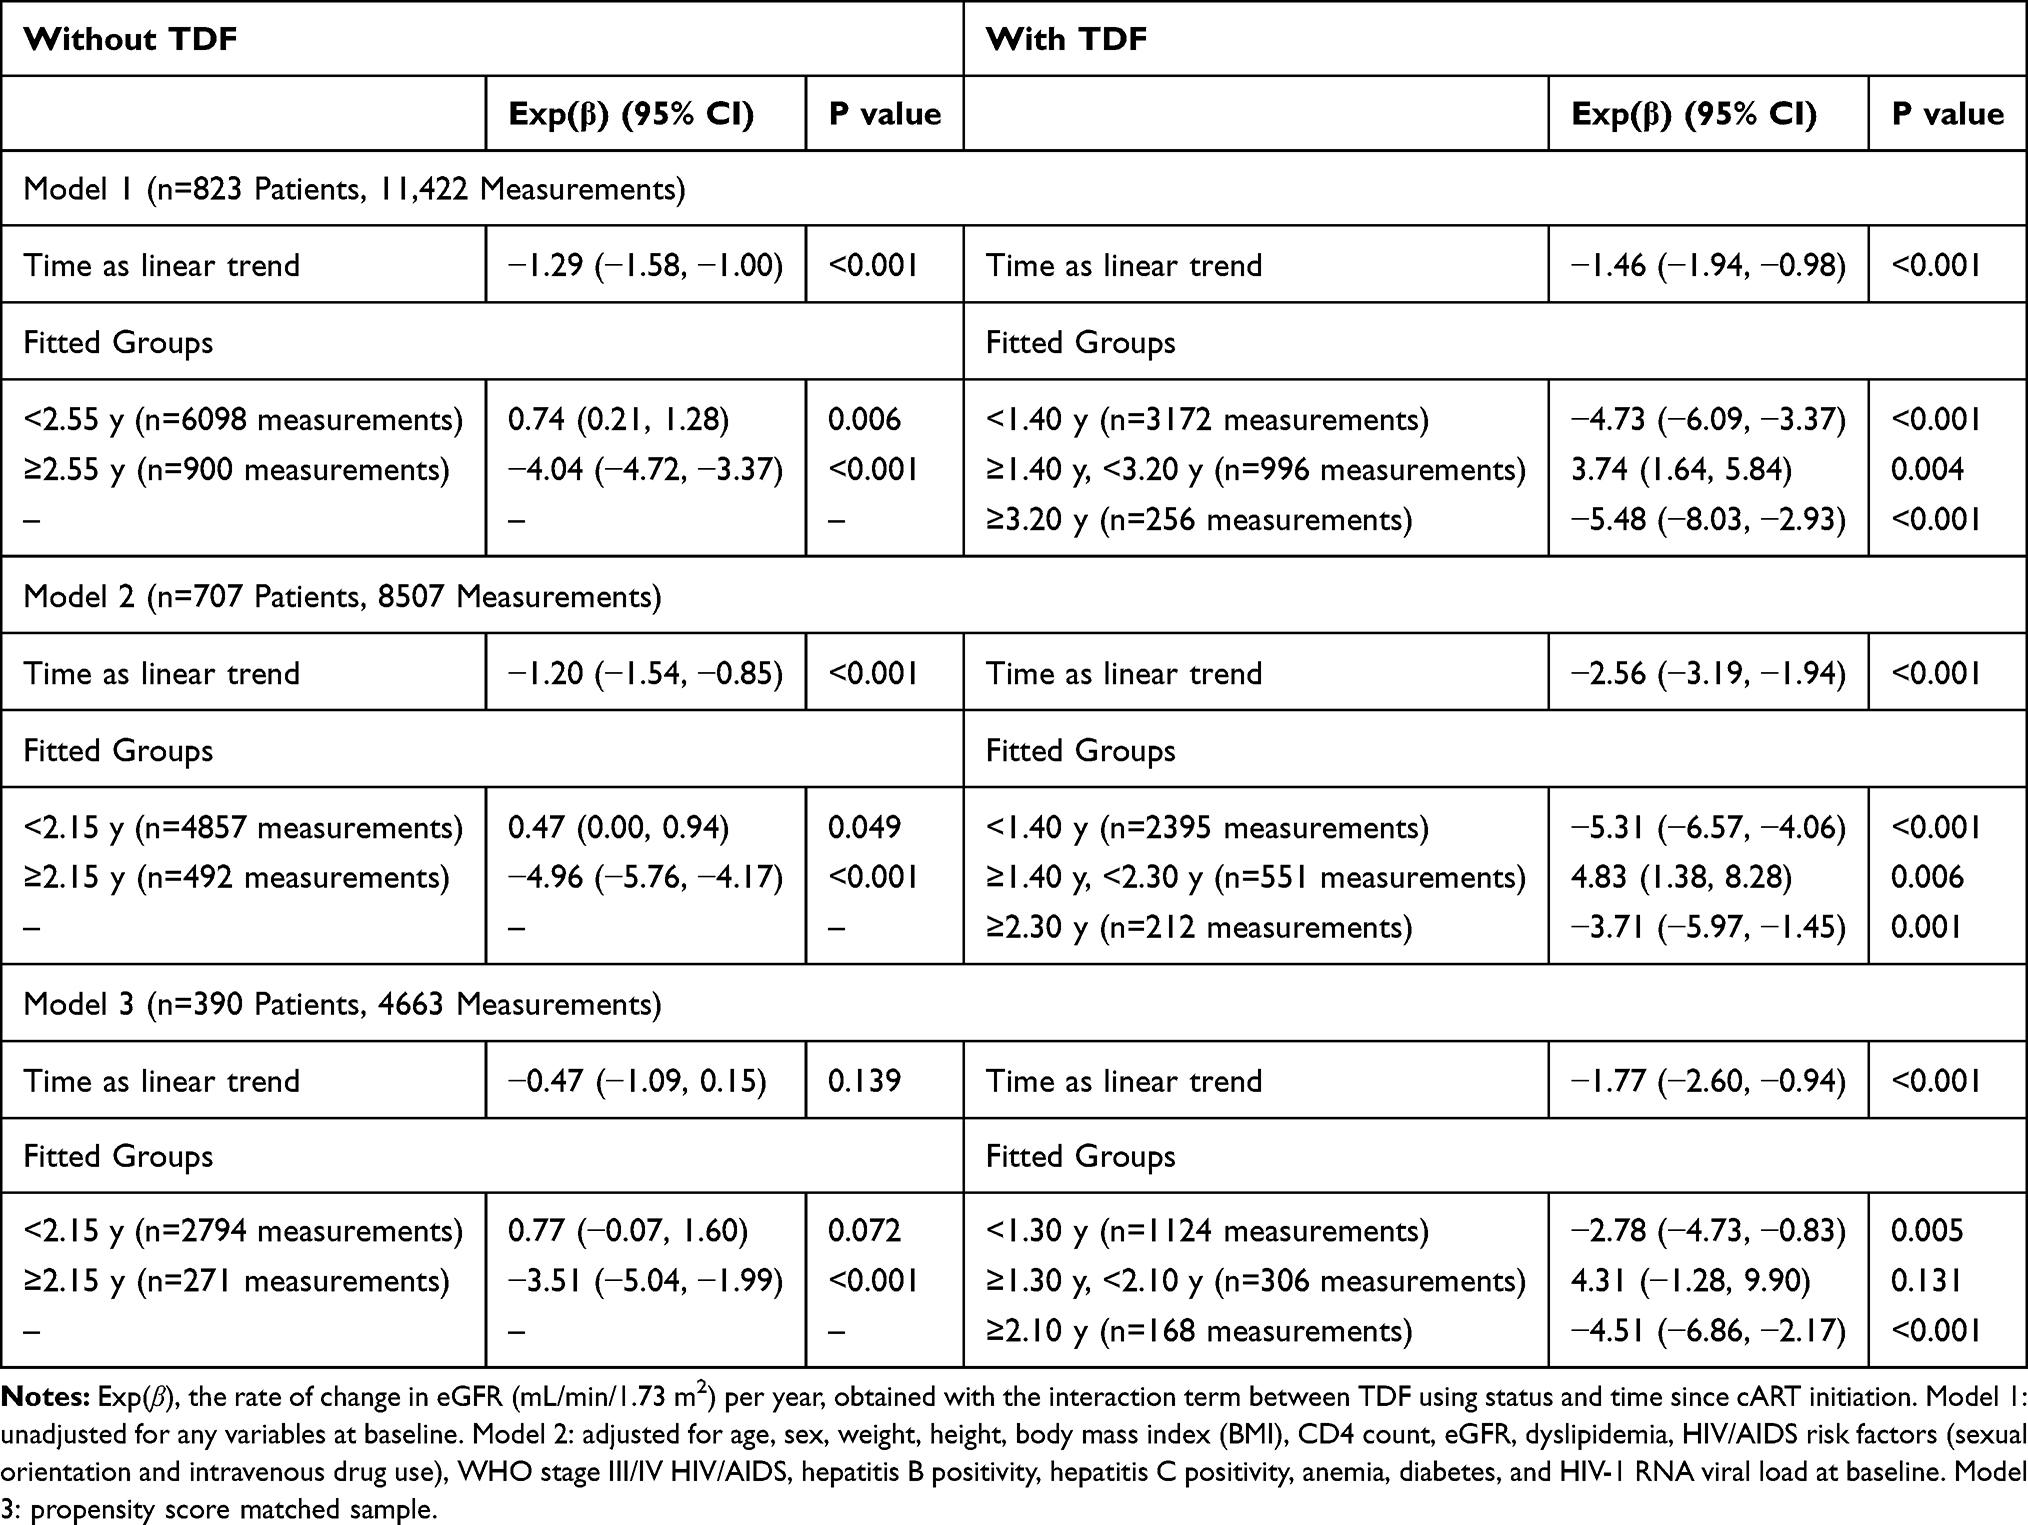 |
Table 3 Predicted eGFR Change Rates in the Piecewise-Linear Mixed Effects Model |
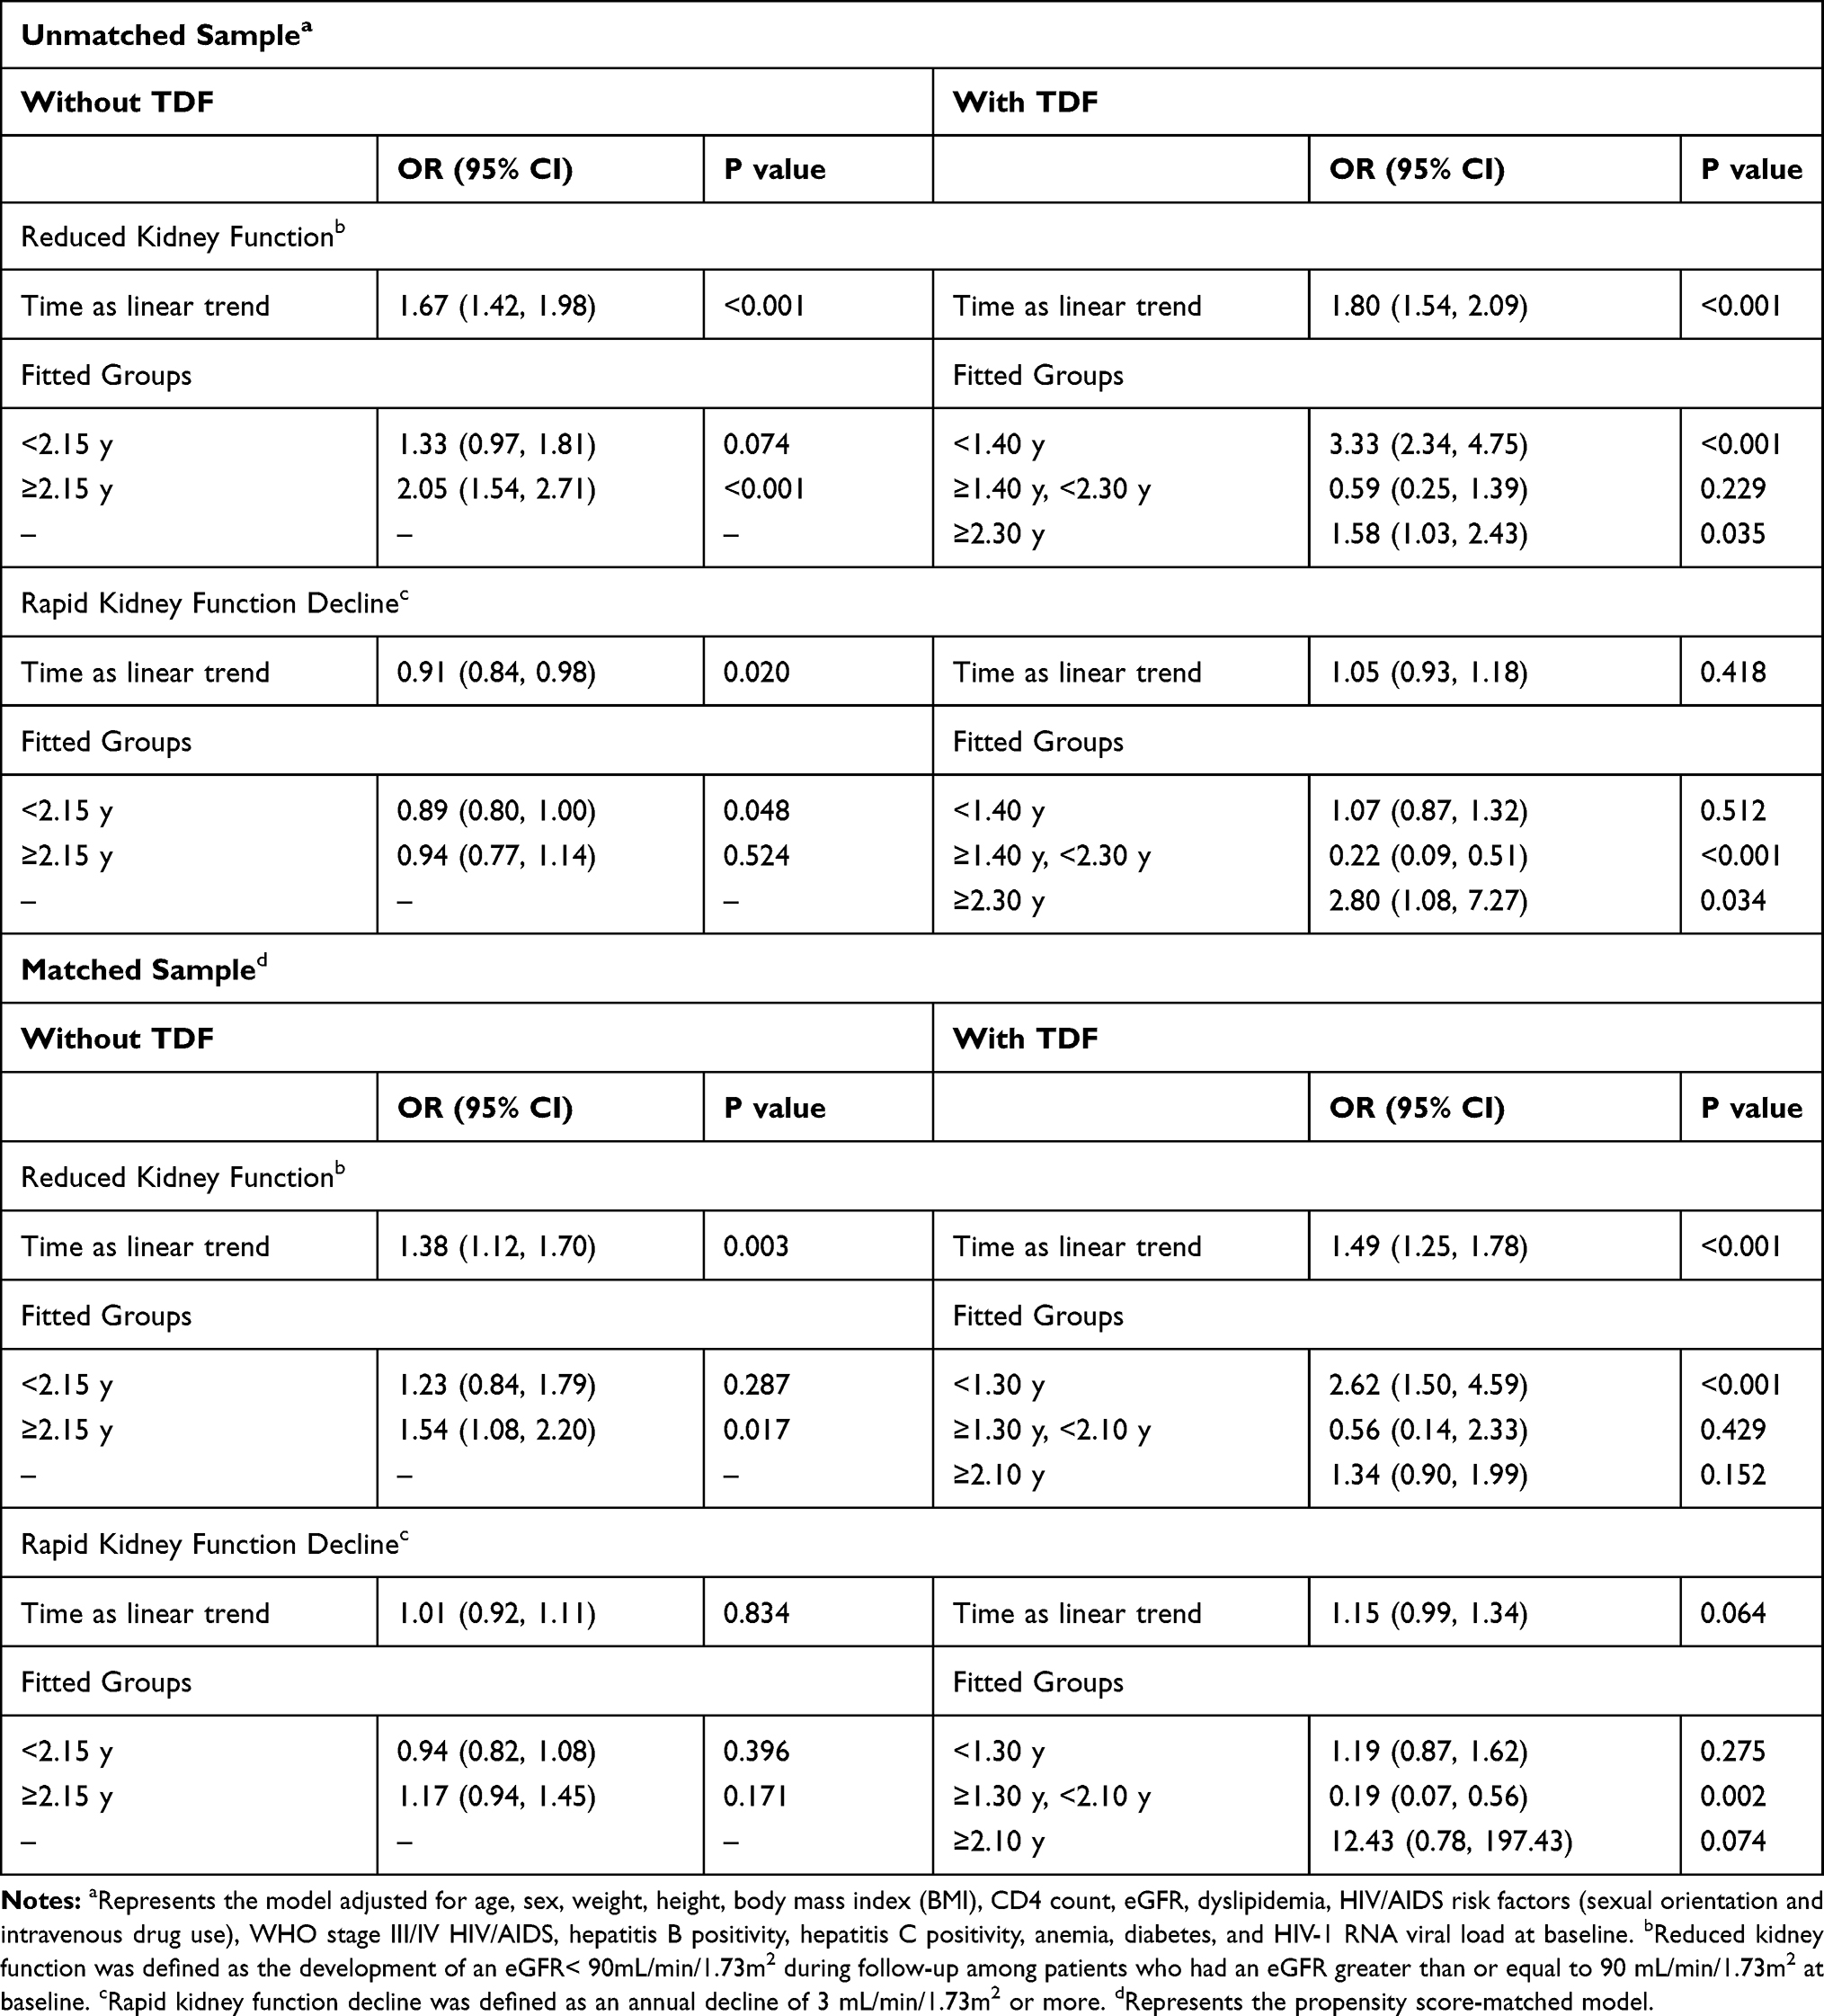 |
Table 4 Association of Antiretroviral Exposure (in Different Time Ranges) with Risk of Renal Impairment Outcomes |
Data on HIV-1 RNA viral load were not available in up to 50% of patients, so a missing value category was used in the main analyses.25,26 In addition, to reduce bias caused by exclusion of individuals with any missing data at baseline, five imputed datasets (established by multiple imputation with chained equations) were developed and run separately, and the results were combined using Rubin’s method (Supplementary file: Tables S2 and S3).27,28 Another sensitivity analysis was conducted to exclude patients receiving protease inhibitors (PIs), because of the possible association of these drugs with nephrotoxicity and impaired renal function (Supplementary file: Tables S4 and S5).29–31
All analyses were performed using the R software, version 3.3.1 (http://www.R-project.org). A result was considered statistically significant when the two-tailed P value was below 0.05.
Results
Patient Selection and Propensity Score Matching
As shown in the flowchart (Figure 1), a total of 1065 patients were screened and 823 patients were eligible for participation, 299 of whom (36.3%) started a TDF-containing cART. Table 2 shows the baseline characteristics of TDF users and non-TDF users before and after PSM. After matching, there were 130 (33.3%) patients in the TDF group, and all baseline variables were well balanced (P > 0.05 for all).
The median age was 30 years among TDF users, and 27 years among non-TDF users. Most enrolled patients were male and were infected via male-male sex. Of 823 patients, 178 (21.6%) experienced RRF, and 451 (54.8%) experienced RKFD over a median follow-up of 10 (interquartile range [IQR], 2–20; maximum 90) months. In TDF users, 97 experienced (32.4%) RRF, and 183 (61.2%) experienced RKFD. There were 4424 eGFR measurements for TDF users. For each group, there was a median of seven eGFR measurements per person (IQR, 3–11) and the median interval between eGFR measurements was 90 (IQR, 30–90) days.
Main Analyses
Comparison of One-Linear and Piecewise-Linear Mixed Effects Models
We compared eGFR trajectories by one-linear and piecewise-linear models (Table 1), with the piecewise model allowing a change of the eGFR slope at a given time point. Log likelihood ratio test between the two models indicated that the nonlinear trajectory of eGFR was a better fit than the traditional one assuming a single linear process across the entire period of observation (P < 0.001 for all).
Time Points on Nonlinear Trajectories of eGFR
For non-TDF users, the time points were 2.55 years (Table 1, model 1), 2.15 years (Table 1, model 2), and 2.15 years (Table 1, model 3). The difference of eGFR slopes was −4.79 (−5.84, −3.74), −5.43 (−6.47, −4.40) and −4.28 (−6.24, −2.33), respectively.
For TDF users, the time points on the nonlinear trajectory of eGFR were significantly different from that of non-TDF users. For example, the time points were 1.40 years and 2.30 years in model 2. The difference of eGFR slopes was −10.14 (−14.44, −5.85) at 1.40 years and −8.54 (−12.67, −4.41) at 2.30 years. Similar results were obtained in models 1 and 3 (Table 1).
The Relationship Between eGFR and Duration of cART
The eGFR changed over time in both groups (Figure 2, Supplementary file: Figures S1 and S2). There was a reverse S-shaped relationship between eGFR and duration of cART for TDF users, but a different temporal trajectory for non-TDF users, in all three models. The S-shaped trajectory was observed markedly in model 1 (Supplementary file: Figure S1B) and model 2 (Figure 2B).
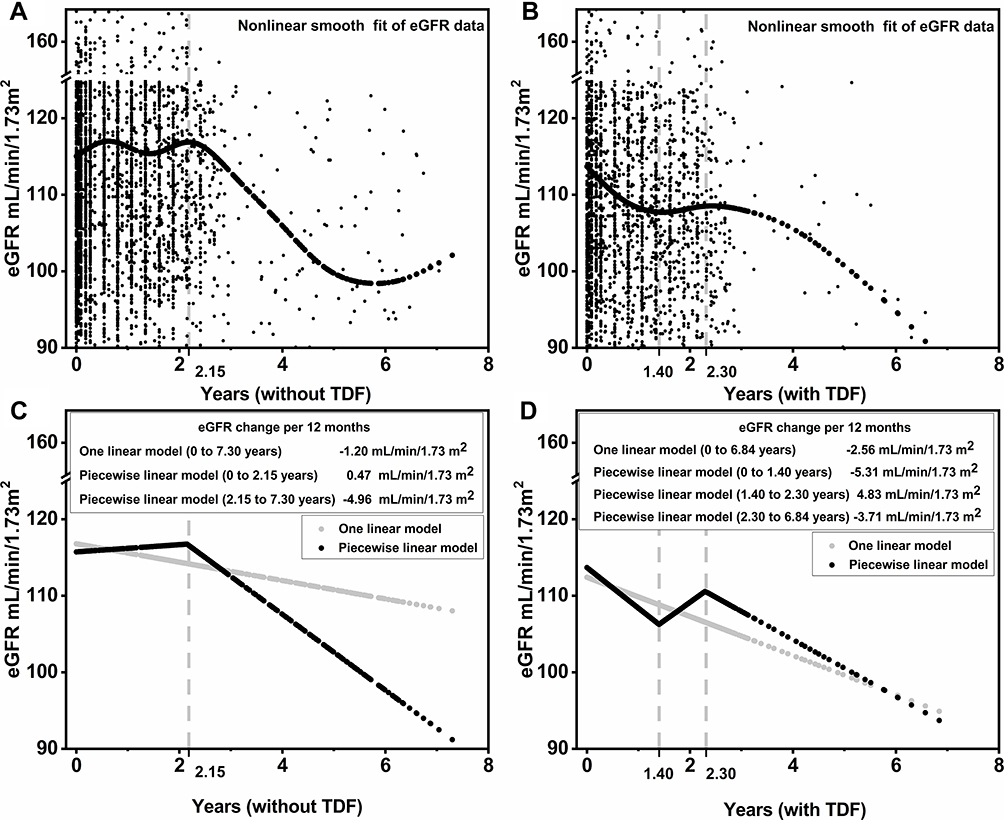 |
Figure 2 Nonlinear trajectory of eGFR among HIV-1-infected patients with or without TDF. Notes: Nonlinear eGFR changes over time can be approximated with a piecewise-linear mixed effects model. (A) and (B) show the adjusted smooth fit of eGFR data. (C) and (D) show the fit from the adjusted one linear and adjusted piecewise-linear mixed effects models. Models adjusted for age, sex, weight, height, BMI, CD4 count, eGFR, dyslipidemia, HIV/AIDS risk factors (sexual orientation and intravenous drug use), WHO stage III/IV HIV/AIDS, hepatitis B positivity, hepatitis C positivity, anemia, diabetes, and HIV-1 RNA viral load at baseline. |
Average Changes in eGFR Over Time on Different cART Duration Among TDF or Non-TDF Users
Table 3 shows average eGFR changes per year for the two groups according to cART duration. For TDF users, we obtained different results when the duration of cART was categorized using different time points in all three models. The exp(β) was −5.31 (95% CI: −6.57, −4.06) for cART less than 1.40 years and −3.71 (95% CI: −5.97, −1.45) for 2.30 years or more. However, the exp(β) was reverse, 4.83 (95% CI: 1.38, 8.28) for 1.40 to 2.30 years. For models 1 and 3, these time points were nearly the same, and similar trends were indicated in eGFR with increasing duration of cART (Table 3).
For non-TDF users, before the time points, a longer duration of cART was associated with a slight increased eGFR in all three models; after the time points, there was an inverse association between eGFR and duration of cART (Table 3).
Nonlinear Progression of Renal Function Over Time
Two outcome definitions, RRF and RKFD, were used to assess whether renal dysfunction progression consists of the nonlinear trajectory of eGFR (Table 4). For patients without TDF exposure, use of cART for 2.15 years or more, the risk of RRF increased steadily to 2.05 per year (95% CI: 1.54, 2.71). For patients using TDF, there was an increased risk of RRF for those using cART less than 1.40 years (adjusted odds ratio [aOR]: 3.33 per year; 95% CI: 2.34, 4.75) and for those using cART for 2.30 years or more (aOR: 1.58 per year; 95% CI: 1.03, 2.43). However, those using TDF for 1.40 to 2.30 years had a decreased risk of RRF (41% decrease per year; 95% CI: −75%, 39%).
There was no increased risk of RKFD among non-TDF users who received cART for 2.15 years or more, nor among TDF users who received cART for less than 1.40 years. But, each additional 1 year of TDF exposure was associated with a 78% (95% CI: −91%, −49%) decreased risk of RKFD from 1.40 to 2.30 years, and a nearly threefold (95% CI: 1.08, 7.27) increased risk of RKFD for those on TDF for more than 2.30 years. Similar trends were observed in PSM data (Table 4).
Sensitivity Analyses
Two sensitivity analyses, one conducted with imputed datasets and the other with patients not using PIs, indicated these results were robust (Supplementary file: Tables S2–S5).
Discussion
This was the first study, to our knowledge, to investigate whether eGFR progression follows a nonlinear trajectory in HIV-1-infected patients initiating cART with normal eGFR. We present evidence from two analyses (the piecewise-linear and logistic regression model) that the traditional assumption of a steady, linear decline does not apply to HIV-1 infected patients on treatment, especially those on TDF-based therapies. Our results showed that these patients experienced periods of acceleration or deceleration of kidney function decline. Analyses over nonlinear patterns seemly speak to the true nature of the exposure–outcome relationships.
The comparison of one-linear and piecewise-linear models suggested that the nonlinear trajectory of eGFR was more accurate than a single linear process (log likelihood ratio test: P < 0.001 for all). When a single slope was fitted to the data, eGFR decline was either over- or under- estimated during the partial period of cART. Intriguingly, nonlinear trajectories accurately depicted the periods of acceleration or deceleration of renal function decline, especially in TDF users who had an obvious heterogeneity in eGFR over time. This acceleration or deceleration, which was quantified by the piecewise-linear mixed effects model, could be clearly identified from the data and smooth curves (Table 3 and Figure 2). As illustrated for TDF users in model 2 (Table 3), there was an increase of eGFR for intermediate cART durations (1.40–2.30 years), comparing markedly with the significant decline of eGFR either for short (<1.40 years) or long cART durations (>2.30 years). Certainly, these findings were similar in model 1 and model 3.
As expected, the effects of nonlinearity of eGFR on renal dysfunction progression were well supported by the results of RRF and RKFD. In particular, the trends over time of RRF were completely consistent with nonlinear changes of eGFR (Table 4). This finding was also robust enough based on a range of sensitivity analyses. This phenomenon can not be explained explicitly thus far.32 A speculation of far from mature is that TDF, as a well-known nephrotoxic antiretroviral, causes a rapid stress in renal tubular at the beginning exposure followed by a transient recovery possibly from the self-repairing mechanisms of kidney; then, an inevitable damage occurs if beyond the ability of self repairment over time.33
Among TDF users, during the increasing period (1.40–2.30 years) of eGFR, the incidences of both outcomes, especially RKFD definitely declined (suggesting a recovery of renal function), even though TDF continued. This is consistent with previous studies suggested an overall limited effect of TDF on renal function decline.10,21 A meta-analysis that compared ART regimens with or without TDF demonstrated a mean difference in eGFR of only 3.92 mL/min/1.73 m2 on a short-term follow-up.10 Interestingly, a cohort study reported the cumulative decline of eGFR attributable to TDF was 3.05, 4.05 and 2.42 (mL/min/1.73 m2) at year 1, 2, 3, respectively; this indicates that the eGFR decline attributable to TDF was lower 3 years after than that of before, suggesting a partial eGFR recovery from years 2 to 3.21 However, specific time points for renal function recovery are difficult to obtain by their one-linear analysis of eGFR.
We also found that continuous TDF exposure inevitably led to renal impairment in a substantial population. TDF-induced nephrotoxicity was reported in 0.5–45% of HIV-positive patients.6 The wide range of prevalence is attributed to different populations and definitions of TDF-induced nephrotoxicity and duration of follow-up. Renal function assessment and monitoring at baseline and during TDF treatment is the main approach of prevention of TDF-induced nephrotoxicity. But how to monitor appropriately is a challenging issue in daily practice. The incidence of RRF – but not the severe RKFD – increased during the initial use of TDF, incidences of both outcomes increased significantly later, suggesting that persistent TDF exposure can lead to cumulative and irreversible renal impairment, even in those with a normal baseline renal function. This was in agreement with that of the prospective international cohort study published recently, the increased incidence of CKD per year of exposure to TDF was initially small (14%; 95% CI: 10%, 19%), yet doubled for a treatment period of 5 years.5 Regrettably, the authors used also the conventional linear analysis to address this issue, thereby the nonlinear trajectories of eGFR progression, if exist, remain unknown. As suggested by studies from CKD cohorts, linear regression methods do not exactly estimate kidney function trajectories,17 considering the big heterogeneity with respect to kidney function, dropout and number of kidney function estimates.34 Nonlinear statistical methods, such as piecewise-linear mixed effects model,16 are able to better characterize the different profiles of renal function progression, as well as to investigate specific risk factors associated with each profile.15,17 Therefore, our study provides a new avenue for this difficult task, at least in HIV patients with normal renal function. Future external validation with prospective international cohort like D:A:D Study would benefit a lot to characterize the real trajectories of eGFR progression, as well as the potential time window to salvage renal function and to investigate the underlying mechanisms of TDF related nephrotoxicity.
This present study has several implications for our understanding of renal dysfunction progression in HIV-1 infected patients during cART with initial normal renal function. First, periods of slight increasing eGFR followed by periods of eGFR decline and increasing risk of adverse events in non-TDF users suggesting that irrespective of the cART regimen (with or without TDF), loss of renal function to some extent seems inevitable following prolonged use of these drugs, especially after 2 years exposure or more. Screening frequencies on renal function should be planned according to this finding. Second, for TDF users, periods of rapid eGFR decline followed by periods of eGFR improvement, indicating that eGFR decline may sometimes be ameliorated over a given extended period. One should be aware of early loss of renal function may not reflect permanent loss of renal function. The S-shaped nonlinear trajectory of eGFR may also open new avenues of diagnostic and treatment options so as to delay the progression of renal impairment among these long-term users of TDF.
This study has several strengths. First, the research has longitudinal data for up to 7 years of follow-up and regular eGFR assessments every 3 months for characterizing nonlinear trajectories of eGFR during cART. Second, by using PSM, we were able to reduce confounding bias and balance the baseline characteristics of TDF exposure and non-exposure group. The results of this emulation of a randomized controlled trial were similar with model 1 and model 2, suggesting that our findings were robust. Third, the time points suggested by our study were determined by a range of powerful statistical analyses (Wald test, piecewise-linear mixed effects model along with maximum likelihood model and recursion method), together with two robust sensitivity analyses, thus is more accurate and powerful than the traditional paradigm based on clinical experience.5,14,21
Our study has several limitations. First, the inherent shortcomings belong to retrospective observational single-center study, small sample size and short-term follow-up make it difficult to address the causality between TDF and CKD and reach a firm conclusion, the powerful statistical analysis thus is a trade-off to minimize these biases and confounding. Second, the patients in this study came exclusively from China and mainly with no history of drug abusing which is a risk factor for HIV, the findings may not simply apply to other populations and thus further validations from different races are warranted. Third, nonlinear trajectory of eGFR progression in patients complicated with CKD at baseline needs further investigation, after all, an interesting curve has already been identified by our population characterized by normal renal function. Fourth, this study did not investigate the predictive factors that may contribute to nonlinearity patterns of renal function, as well as TDF induced nephrotoxicity other than glomerular filtration function. All above limitations require further study to be overcome, nonetheless, our primary results provided moderate yet important illumination for this topic.
Conclusion
The present study suggests that renal function progression exists heterogeneity in HIV-infected patients with a normal eGFR initiating ART in Chinese. There are significant differences in renal function trajectories between TDF and non-TDF therapy. Continuous TDF exposure inevitably led to renal impairment in a substantial population, but the changes in eGFR were inconsistent over time. Analyses assuming nonlinear patterns over piecewise mixed effects models speak to the true nature of the exposure–outcome relationships in this scenario. An interesting reverse S-shaped nonlinear trajectory, the transient yet definitely recovery of renal impairment about 1.4 years after TDF initiation, do exist and could be helpful for the management of HIV-1-infected patients on TDF.
Abbreviations
TDF, Tenofovir disoproxil fumarate; eGFR, Estimated glomerular filtration rate; RRF, Reduced renal function; RKFD, Rapid kidney function decline; IQR, Interquartile range; HIV, Human immunodeficiency virus-1; ART, Antiretroviral therapy; CKD, Chronic kidney disease; SCr, Serum creatinine; MDRD, Modification of diet in renal disease; ARVs, Antiretrovirals; 3TC, Lamivudine; FTC, Emtricitabine; NVP, Nevirapine; EFV, Efavirenz; AZT, Zidovudine; d4T, Stavudine; BMI, Body mass index; PSM, Propensity score matching; GAM, Generalized additive model; GEE, Generalized estimating equation; OR, Odds ratio; WHO, World health organization; NA, Not applicable; CI, Confidence interval; MDR-TB, Multi-drug-resistant tuberculosis.
Data Sharing Statement
The data set used for this manuscript will be available from the corresponding author upon reasonable request.
Ethics and Consent Statement
This study was approved by the Institutional Review Board of Xixi Hospital. All data were anonymized to comply with the provisions of personal data protection legislation. Due to the retrospective nature of this study and due to the fact that only historical medical data were collected, written informed consent was not required.
Acknowledgments
We thank all study participants and staff of all participating sites.
Author Contributions
All authors contributed to data analysis, drafting or revising the article, gave final approval of the version to be published, and agree to be accountable for all aspects of the work.
Funding
The study did not need and was not funded.
Disclosure
The authors declare that they have no competing interests in this work.
References
1. Nsanzimana S, Remera E, Kanters S, et al. Life expectancy among HIV-positive patients in Rwanda: a retrospective observational cohort study. Lancet Glob Health. 2015;3(3):e169–e177. doi:10.1016/S2214-109X(14)70364-X
2. Estrella MM, Moosa MR, Nachega JB. Editorial commentary: risks and benefits of tenofovir in the context of kidney dysfunction in Sub-Saharan Africa. Clin Inf Dis. 2014;58(10):1481–1483. doi:10.1093/cid/ciu123
3. Hirnschall G, Harries AD, Easterbrook PJ, Doherty MC, Ball A. The next generation of the World Health Organization’s global antiretroviral guidance. J Int AIDS Soc. 2013;16:18757. doi:10.7448/IAS.16.1.18757
4. Centers for Disease Control and Prevention (CDC) [website on the internet]. Pre-Exposure Prophylaxis (Prep). Atlanta, GA: Centers for Disease Control and Prevention (CDC); 2015. Available from: http://www.cdc.gov/hiv/prevention/research/prep/.
5. Mocroft A, Lundgren JD, Ross M, et al. Cumulative and current exposure to potentially nephrotoxic antiretrovirals and development of chronic kidney disease in HIV-positive individuals with a normal baseline estimated glomerular filtration rate: a prospective international cohort study. Lancet HIV. 2016;3(1):e23–e32. doi:10.1016/S2352-3018(15)00211-8
6. Atefeh J, Hossein K, Simin DK. Tenofovir-induced nephrotoxicity: incidence, mechanism, risk factors, prognosis and proposed agents for prevention. Eur J Clin Pharmacol. 2014;70(9):1029–1040. doi:10.1007/s00228-014-1712-z
7. Stevens LA, Coresh J, Greene T, Levey AS. Assessing kidney function–measured and estimated glomerular filtration rate. N Engl J Med. 2006;354(23):2473–2483. doi:10.1056/NEJMra054415
8. Levin A, Stevens PE, Bilous RW, et al.; Kidney disease: Improving global outcomes (KDIGO) CKD work group. KDIGO 2012 clinical practice guideline for the evaluation and management of chronic kidney disease. Kidney Int Suppl. 2013;3(1):1–150.
9. Nishijima T, Kawasaki Y, Tanaka N, et al. Long-term exposure to tenofovir continuously decrease renal function in HIV-1-infected patients with low body weight: results from 10 years of follow-up. AIDS. 2014;28(13):1903–1910. doi:10.1097/QAD.0000000000000347
10. Cooper RD, Wiebe N, Smith N, Keiser P, Naicker S, Tonelli M. Systematic review and Meta©\analysis: renal safety of tenofovir disoproxil fumarate in HIV©\Infected patients. Clin Inf Dis. 2010;51(5):496–505. doi:10.1086/655681
11. Yombi JC, Pozniak A, Boffito M, et al. Antiretrovirals and the kidney in current clinical practice. AIDS. 2014;28(5):621–632. doi:10.1097/QAD.0000000000000103
12. Joshi K, Boettiger D, Kerr S, et al. Changes in renal function with long-term exposure to antiretroviral therapy in HIV-infected adults in Asia. Pharmacoepidemiol Drug Saf. 2018;27(11):1209–1216. doi:10.1002/pds.4657
13. Horberg M, Tang B, Towner W, et al. Impact of tenofovir on renal function in HIV-infected, antiretroviral-naive patients. J Acquir Immune Defic Syndr. 2010;53(1):62–69. doi:10.1097/QAI.0b013e3181be6be2
14. De Waal R, Cohen K, Fox MP, et al. Changes in estimated glomerular filtration rate over time in South African HIV-1-infected patients receiving tenofovir: a retrospective cohort study. J Int AIDS Soc. 2017;20(1):B1. doi:10.7448/IAS.20.01/21317
15. Li L, Astor BC, Lewis J, et al. Longitudinal progression trajectory of GFR among patients with CKD. Am J Kidney Dis. 2012;59(4):504–512. doi:10.1053/j.ajkd.2011.12.009
16. Zhong Y, Munoz A, Schwartz GJ, Warady BA, Furth SL, Abraham AG. Nonlinear trajectory of GFR in children before RRT. J Am Soc Nephrol. 2014;25(5):913–917. doi:10.1681/ASN.2013050487
17. Weldegiorgis M, de Zeeuw D, Li L, et al. Longitudinal estimated GFR trajectories in patients with and without type 2 diabetes and nephropathy. Am J Kidney Dis. 2018;71(1):91–101. doi:10.1053/j.ajkd.2017.08.010
18. Shi H, Chen N, Zhang W. Evaluating and refitting the simplified equation of MDRD to predict glomerular filtration rate in Chinese patients with chronic kidney disease. Chin J Pract Int Med. 2006;26(9):665–669.
19. Chinese eGFR investigation collaboration. Modification and evaluation of MDRD estimating equation for Chinese patients with chronic kidney disease. Chin J Nephrol. 2006;22(10):589–595.
20. Chang H, Tan M. Application of modified glomerular filtration rate (GFR) estimation equations in Chinese diabetic patients with chronic kidney disease in diabetes. West Indian Med J. 2015;64(3):209.
21. Laprise C, Baril JG, Dufresne S, Trottier H. Association between tenofovir exposure and reduced kidney function in a cohort of HIV-positive patients: results from 10 years of follow-up. Clin Inf Dis. 2013;56(4):567–575. doi:10.1093/cid/cis937
22. Zachor H, Machekano R, Estrella MM, et al. Incidence of stage 3 chronic kidney disease and progression on tenofovir-based regimens. AIDS. 2016;30(8):1221–1228. doi:10.1097/QAD.0000000000001041
23. Dehejia RH, Wahba S. Propensity score-matching methods for nonexperimental causal studies. Rev Econ Stat. 2002;84(1):151–161. doi:10.1162/003465302317331982
24. Austin PC. Primer on statistical interpretation or methods report card on propensity-score matching in the cardiology literature from 2004 to 2006. Circ Cardiovasc Qual Outcomes. 2008;1(1):62–67. doi:10.1161/CIRCOUTCOMES.108.790634
25. Erviti J, Alonso L, Oliva B, et al. Oral bisphosphonates are associated with increased risk of subtrochanteric and diaphyseal fractures in elderly women: a nested case control study. BMJ Open. 2013;3(1):e002091. doi:10.1136/bmjopen-2012-002091
26. D’Agostinojr R, Rubin D. Estimating and using propensity scores with partially missing data. Publi Am Statist Assoc. 2000;95(451):749–759. doi:10.1080/01621459.2000.10474263
27. White IR, Patrick R, Wood AM. Multiple imputation using chained equations: issues and guidance for practice. Stat Med. 2011;30(4):377–399. doi:10.1002/sim.4067
28. Rubin DB. Multiple Imputation for Nonresponse in Surveys. Hoboken, N.J: Wiley-Interscience; 2004.
29. Young J, Schfer J, Fux CA, et al. Renal function in patients with HIV starting therapy with tenofovir and either efavirenz, lopinavir or atazanavir. AIDS. 2012;26(5):567–575. doi:10.1097/QAD.0b013e32834f337c
30. Ryom L, Mocroft A, Kirk O, et al. Association between antiretroviral exposure and renal impairment among HIV-positive persons with normal baseline renal function: the D:A:D study. J Inf Dis. 2013;207(9):1359–1369. doi:10.1093/infdis/jit043
31. Kearney BP, Mathias A, Mittan A, Sayre J, Ebrahimi R, Cheng AK. Pharmacokinetics and safety of tenofovir disoproxil fumarate on coadministration with lopinavir/ritonavir. J Acquir Immune Defic Syndr. 2006;43(3):278–283. doi:10.1097/01.qai.0000243103.03265.2b
32. Alfano G, Cappelli G, Fontana F, et al. Kidney disease in HIV infection. J Clin Med. 2019;8(8):1254. doi:10.3390/jcm8081254
33. Jose S, Hamzah L, Campbell LJ, et al. Incomplete reversibility of estimated glomerular filtration rate decline following tenofovir disoproxil fumarate exposure. J Infect Dis. 2014;210(3):363–373. doi:10.1093/infdis/jiu107
34. Janmaat CJ, van Diepen M, Tsonaka R, Jager KJ, Zoccali C, Dekker FW. Pitfalls of linear regression for estimating slopes over time and how to avoid them by using linear mixed-effects models. Nephrol Dial Transplant. 2019;34(4):561–566.
 © 2020 The Author(s). This work is published and licensed by Dove Medical Press Limited. The full terms of this license are available at https://www.dovepress.com/terms.php and incorporate the Creative Commons Attribution - Non Commercial (unported, v3.0) License.
By accessing the work you hereby accept the Terms. Non-commercial uses of the work are permitted without any further permission from Dove Medical Press Limited, provided the work is properly attributed. For permission for commercial use of this work, please see paragraphs 4.2 and 5 of our Terms.
© 2020 The Author(s). This work is published and licensed by Dove Medical Press Limited. The full terms of this license are available at https://www.dovepress.com/terms.php and incorporate the Creative Commons Attribution - Non Commercial (unported, v3.0) License.
By accessing the work you hereby accept the Terms. Non-commercial uses of the work are permitted without any further permission from Dove Medical Press Limited, provided the work is properly attributed. For permission for commercial use of this work, please see paragraphs 4.2 and 5 of our Terms.