")
Back to Journals » International Journal of Chronic Obstructive Pulmonary Disease » Volume 16
Longitudinal Imaging-Based Clusters in Former Smokers of the COPD Cohort Associate with Clinical Characteristics: The SubPopulations and Intermediate Outcome Measures in COPD Study (SPIROMICS)
Authors Zou C , Li F, Choi J , Haghighi B, Choi S, Rajaraman PK, Comellas AP , Newell Jnr JD, Lee CH, Barr RG, Bleecker E, Cooper CB , Couper D , Han M, Hansel NN, Kanner RE , Kazerooni EA, Kleerup EC, Martinez FJ , O'Neal W, Paine III R, Rennard SI, Smith BM, Woodruff PG, Hoffman EA , Lin CL
Received 19 January 2021
Accepted for publication 19 April 2021
Published 31 May 2021 Volume 2021:16 Pages 1477—1496
DOI https://doi.org/10.2147/COPD.S301466
Checked for plagiarism Yes
Review by Single anonymous peer review
Peer reviewer comments 4
Editor who approved publication: Dr Richard Russell
Chunrui Zou,1,2 Frank Li,2,3 Jiwoong Choi,1,4 Babak Haghighi,5 Sanghun Choi,6 Prathish K Rajaraman,1,2 Alejandro P Comellas,7 John D Newell Jnr,8 Chang Hyun Lee,8,9 R Graham Barr,10 Eugene Bleecker,11 Christopher B Cooper,12 David Couper,13 Meilan Han,14 Nadia N Hansel,15 Richard E Kanner,16 Ella A Kazerooni,17 Eric C Kleerup,18 Fernando J Martinez,19 Wanda O’Neal,20 Robert Paine III,16 Stephen I Rennard,21 Benjamin M Smith,22,23 Prescott G Woodruff,24 Eirc A Hoffman,3,7,8 Ching-Long Lin1– 3,8
1Department of Mechanical Engineering, University of Iowa, Iowa City, IA, USA; 2IIHR-Hydroscience & Engineering, University of Iowa, Iowa City, IA, USA; 3Department of Biomedical Engineering, University of Iowa, Iowa City, IA, USA; 4Department of Internal Medicine, School of Medicine, University of Kansas, Kansas City, KS, USA; 5Department of Radiology, Perelman School of Medicine, University of Pennsylvania, Philadelphia, PA, USA; 6School of Mechanical Engineering, Kyungpook National University, Daegu, Republic of Korea; 7Department of Internal Medicine, University of Iowa, Iowa City, IA, USA; 8Department of Radiology, University of Iowa, Iowa City, IA, USA; 9Department of Radiology, College of Medicine, Seoul National University, Seoul, Republic of Korea; 10Mailman School of Public Health, Columbia University, New York, NY, USA; 11Department of Medicine, The University of Arizona, Tucson, AZ, USA; 12Department of Physiology, UCLA, Los Angeles, CA, USA; 13Department of Biostatistics, University of North Carolina, Chapel Hill, NC, USA; 14Department of Internal Medicine, University of Michigan, Ann Arbor, MI, USA; 15School of Medicine, Johns Hopkins, Baltimore, MD, USA; 16School of Medicine, University of Utah, Salt Lake City, UT, USA; 17Department of Radiology, University of Michigan, Ann Arbor, MI, USA; 18Department of Medicine, UCLA, Los Angeles, CA, USA; 19Weill Cornell Medicine, Cornell University, New York, NY, USA; 20School of Medicine, University of North Carolina, Chapel Hill, NC, USA; 21Department of Internal Medicine, University of Nebraska College of Medicine, Omaha, NE, USA; 22Department of Medicine, College of Physicians and Surgeons, Columbia University, New York, NY, USA; 23Department of Medicine, McGill University Health Centre Research Institute, Montreal, Canada; 24Department of Medicine, University of California at San Francisco, San Francisco, CA, USA
Correspondence: Ching-Long Lin
2406 Seamans Center for the Engineering Art and Science, Iowa City, IA, 52242, USA
Tel +1 319 335 5673
Email [email protected]
Purpose: Quantitative computed tomography (qCT) imaging-based cluster analysis identified clinically meaningful COPD former-smoker subgroups (clusters) based on cross-sectional data. We aimed to identify progression clusters for former smokers using longitudinal data.
Patients and Methods: We selected 472 former smokers from SPIROMICS with a baseline visit and a one-year follow-up visit. A total of 150 qCT imaging-based variables, comprising 75 variables at baseline and their corresponding progression rates, were derived from the respective inspiration and expiration scans of the two visits. The COPD progression clusters identified were then associated with subject demography, clinical variables and biomarkers.
Results: COPD severities at baseline increased with increasing cluster number. Cluster 1 patients were an obese subgroup with rapid progression of functional small airway disease percentage (fSAD%) and emphysema percentage (Emph%). Cluster 2 exhibited a decrease of fSAD% and Emph%, an increase of tissue fraction at total lung capacity and airway narrowing over one year. Cluster 3 showed rapid expansion of Emph% and an attenuation of fSAD%. Cluster 4 demonstrated severe emphysema and fSAD and significant structural alterations at baseline with rapid progression of fSAD% over one year. Subjects with different progression patterns in the same cross-sectional cluster were identified by longitudinal clustering.
Conclusion: qCT imaging-based metrics at two visits for former smokers allow for the derivation of four statistically stable clusters associated with unique progression patterns and clinical characteristics. Use of baseline variables and their progression rates enables identification of longitudinal clusters, resulting in a refinement of cross-sectional clusters.
Keywords: computed tomography, emphysema, functional small airway disease, longitudinal clustering
Introduction
Chronic obstructive pulmonary disease (COPD) is a progressive disease that is characterized by irreversible limitation of airflow1 due to airway and/or alveolar abnormalities. Tobacco smoking is the main cause of the high prevalence of COPD, making it the third leading cause of death by disease worldwide.2 COPD is a complex disease and significant heterogeneity exists among COPD patients with respect to clinical representation, physiology, imaging, response to therapy, decline in lung function, survival and disease progression. Factors that can affect the heterogeneity of disease progression have not been well understood. Spirometry is widely adopted for the diagnosis of COPD. However, patients with the same severity level by spirometry show significantly different patterns of small airway disease and emphysema.3 Identification of COPD subgroups is thus important and can provide prognostic information to help determine more appropriate, patient-oriented therapies.
With the increasing availability of CT images, imaging-based measures are becoming an objective approach to assessing risk outcomes across multiple populations. Visual and quantitative evaluation of CT images can provide complementary COPD phenotyping.3–7 In NIH-funded multicenter studies, such as the SubPopulations and InteRmediate Outcome Measures in COPD Study (SPIROMICS) and the Genetic Epidemiology of COPD (COPDGene) Study, CT scans for large numbers of patients at multiple visits enabled interrogation of a broad sampling of the COPD population. With CT images combined with clinical variables, Quantitative computed tomography (qCT) imaging-based machine learning of diseased lungs has advanced recently, and multiscale imaging-based cluster analyses have provided clinically meaningful clusters in COPD cohorts.8–13
In this study, we performed a longitudinal cluster analysis of former smokers based on the imaging-derived variables at two visits with a one-year interval. We hypothesize that COPD progression patterns and disease severity are interdependent. Our study of longitudinal clustering aims to identify stable clusters associated with structural and functional progression patterns in the lung.
Methods
Human Subject Data and qCT Imaging
527 subjects were analyzed including 55 healthy never-smokers as a control group and 472 former smokers to derive COPD clusters. Table 1 shows the demographic and PFT measures for all selected subjects. These subjects were recruited in the NIH-funded SPIROMICS multicenter research study. Based on the SPIROMICS subject inclusion/exclusion criteria, subjects with non-COPD obstructive lung disease or a history of diseases or treatments likely to interfere with study interpretation were excluded from SPIROMICS.14 For example, smokers with current diagnosis of asthma were excluded and subjects with a history of interstitial lung diseases (ILDs) were also excluded.14 A subset of these subjects were utilized to derive cross-sectional cluster membership in the previous study,11 allowing for the comparison of longitudinal and cross-sectional clusters. All subjects had a baseline visit and a one-year follow-up visit. At each visit, subjects received pulmonary function tests (PFTs) and post-bronchodilator CT scans performed at total lung capacity (TLC) and residual volume (RV), respectively, according to the protocols approved by the Institutional Review Board (IRB). The SPIROMICS imaging protocol used a CT dose index for the scanned volume (CTDIvol) to standardize exposure across scanners.15 Three BMI ranges were selected to assess the subject size for the establishment of radiation doses. Compared with the inspiration, the expiration employed a low-dose radiation with lower CTDIvols for the same subject. Sieren et al detailed the exposure standardization and the complete parameters in the CT protocol for SPIROMICS.15 To minimize the uncertainty caused by breath-holding techniques, a standardized CT imaging protocol has been adopted for SPIROMICS with specific breathing/breath-hold instructions and the repeatability of total lung volumes, air volumes and tissue volumes at TLC and RV have been demonstrated.15 At each visit, additional clinical information and biomarkers were acquired for each subject.
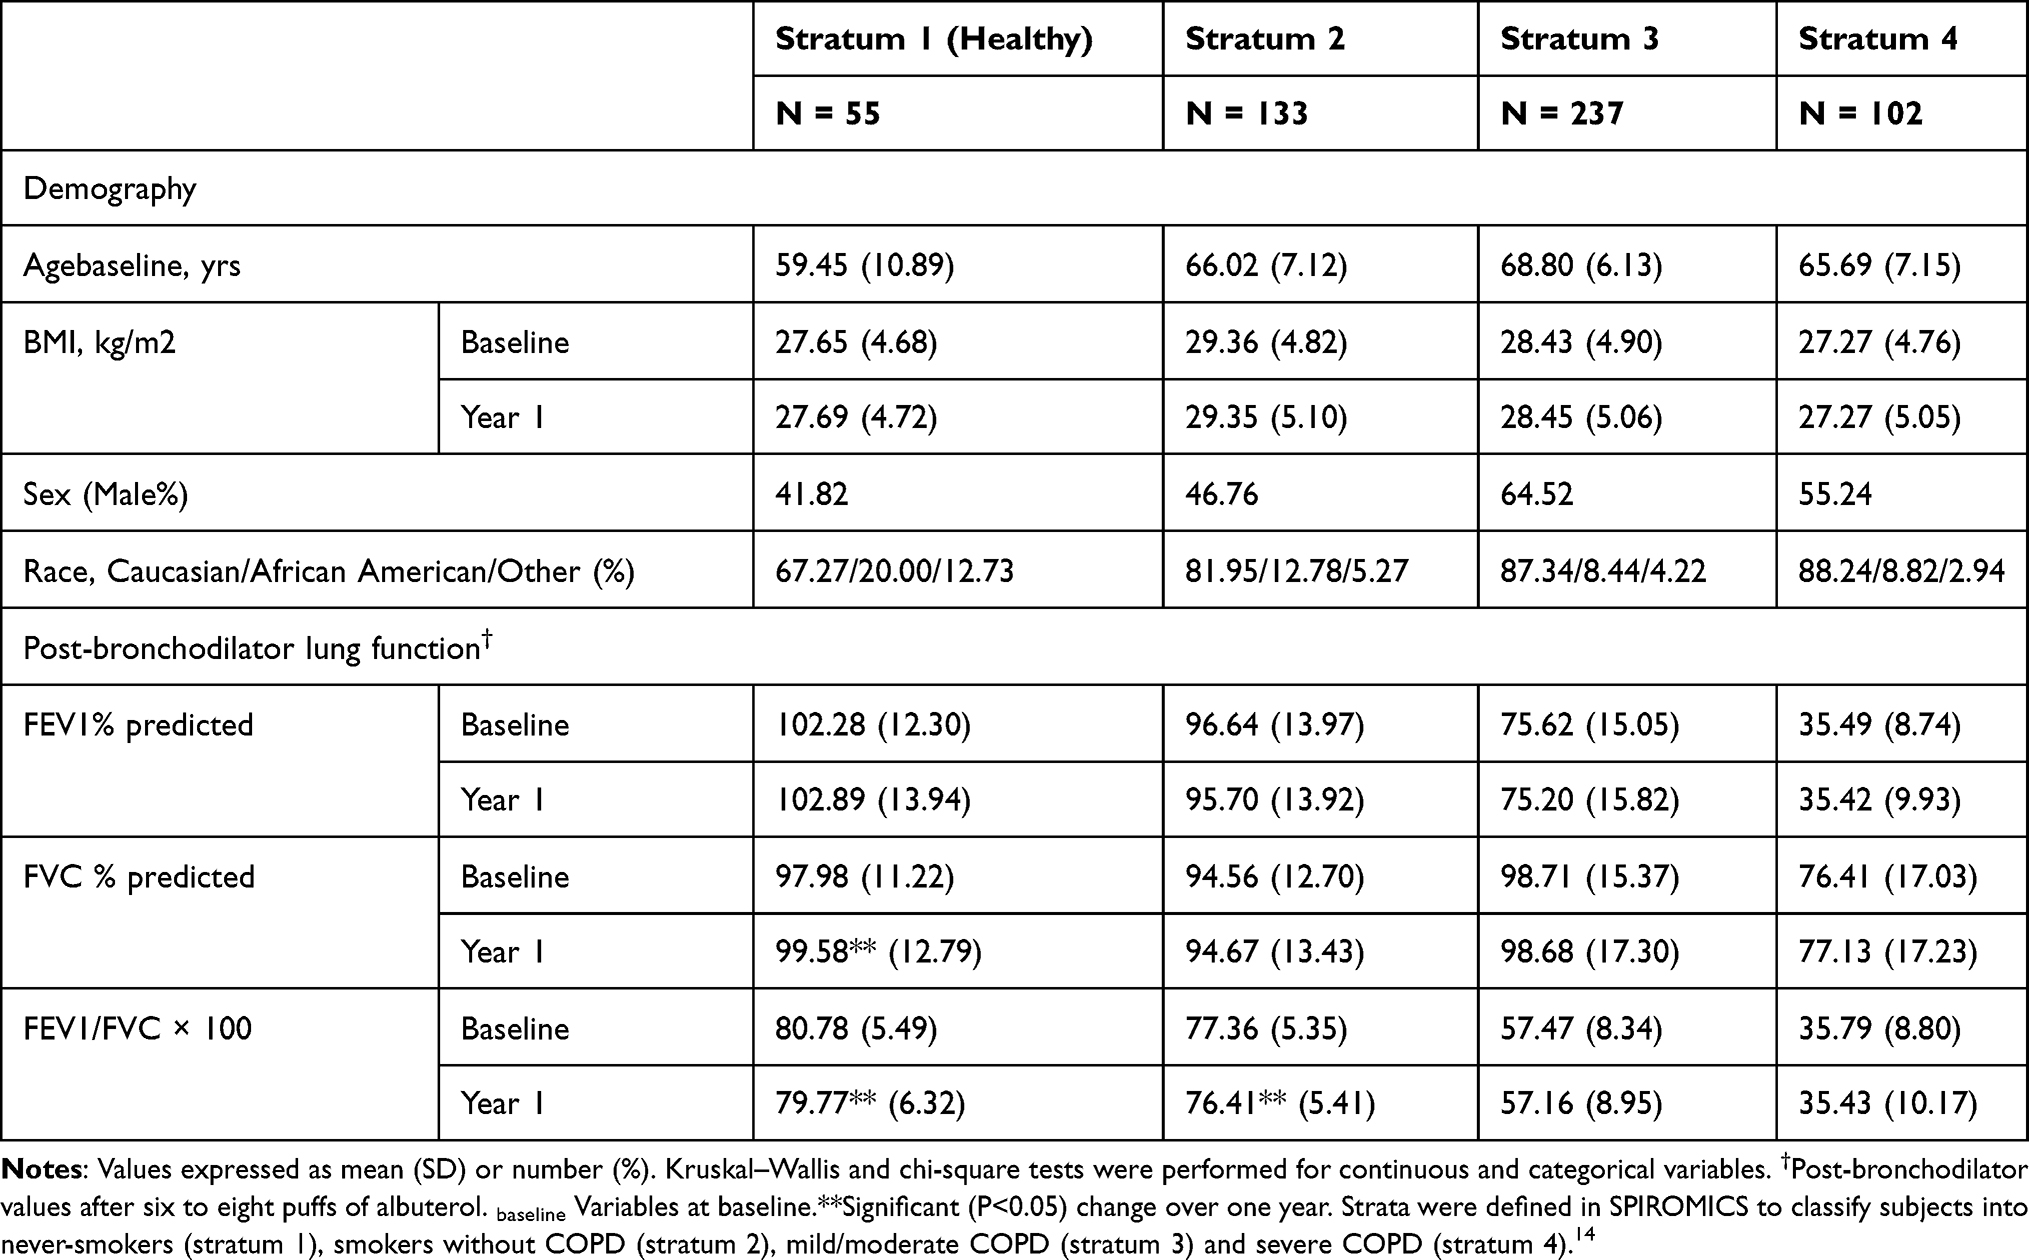 |
Table 1 Demography and Post-Bronchodilator Pulmonary Function Tests for 55 Stratum 1 (Healthy Never-Smokers), 133 Stratum 2, 237 Stratum 3 and 102 Stratum 4 Subjects |
Derivation of qCT Imaging-Based Variables
All CT scans were processed with an automated commercial pulmonary segmentation software (Apollo 2.0, VIDA Diagnostics) to segment the airways, vessel trees, and lobes. Images were registered with a non-rigid mass-preserving image registration technique.16–18 Subsequently, 75 qCT imaging-based variables (Figure 1) were derived from CT scans at TLC and RV to capture structural and functional alterations at both local and global scales at each visit.11 Of the 75 imaging-based variables, bifurcation angle ( ), airway circularity (Cr), wall thickness (WT) and hydraulic diameter (Dh) in multiple local regions were extracted to identify regional alterations of lung structures.13 WT and Dh were normalized as WT* and Dh* by their predicted values to reduce the inter-subject variability.13 Bifurcation angle was found to be significantly correlated with airflow limitation and CT emphysema index.19 Cr measures the degree of roundness of the airway lumen, with a circularity being 1 for perfectly circular lumen and 0 for a fully collapsed lumen. Cr was considered as an important factor to define localized disease and decreased Cr was observed with increased functional small airway disease (fSAD).20,21 WT* reflects airway remodeling distribution and affects mortality during the disease progression.22,23 Normalized hydraulic diameter Dh* is an equivalent diameter of a non-circular airway segment to a round tube. Use of Dh allows assessment of flow resistance and lung function using empirical relations derived based on the diameter of a round tube.24,25 WT* and Dh* signify the effects of wall thickening (a phenotype for inflammation) and luminal narrowing (hyper-responsiveness). The global structural variation of the lung shape was captured by the ratio of the apical-basal distance to the ventral-dorsal distance at TLC. To capture functional characteristics of lung deformation and ventilation, we included the fractional air volume change (
 ), the determinant of the Jacobian matrix (Jacobian), and the anisotropic deformation index (ADI) for strain-based metrics based on registered images. Fractional air volume change was introduced to study the lobar volume change due to COPD progression. The Jacobian is a measure of local specific volume change – a reciprocal of volume change, a physiologically meaningful parameter that can be used to assess the functional capacity of lung tissue. ADI is a measure of the magnitude of directional preference in volume change. Jacobian along with ADI accounted for the regional variations in volume change and orientational preferences during inspiration and expiration and was associated with COPD severity.26 Emphysema percentage (Emph%) and fSAD percentage (fSAD%) were included to quantify the heterogeneity of the emphysematous lung tissue destruction and fSAD. The separate quantification of emphysema and fSAD can dissociate the emphysematous region(s) from the air-trapped region(s).3 fSAD% and Emph% with the respective air-fraction threshold of 90% and 98.5% were employed to reduce the effects of scanners.10–12 Tissue fractions at TLC (
 ) and at RV (
 ) were introduced to measure the proportion of tissue volume in each voxel for detection of tissue destruction and air-trapping, respectively.11 The air volume distribution changes, comparing TLC and RV, were quantified by the ratio of the lobar volume to the whole lung volume (a total of five ratios for the five lobes) and the ratio of the volume of the upper lobes to the volume of the middle and lower lobes combined. Each functional metric was measured for lobes as well as the whole lung. In total, 40 structural variables and 35 functional variables were derived from each CT pair per visit.
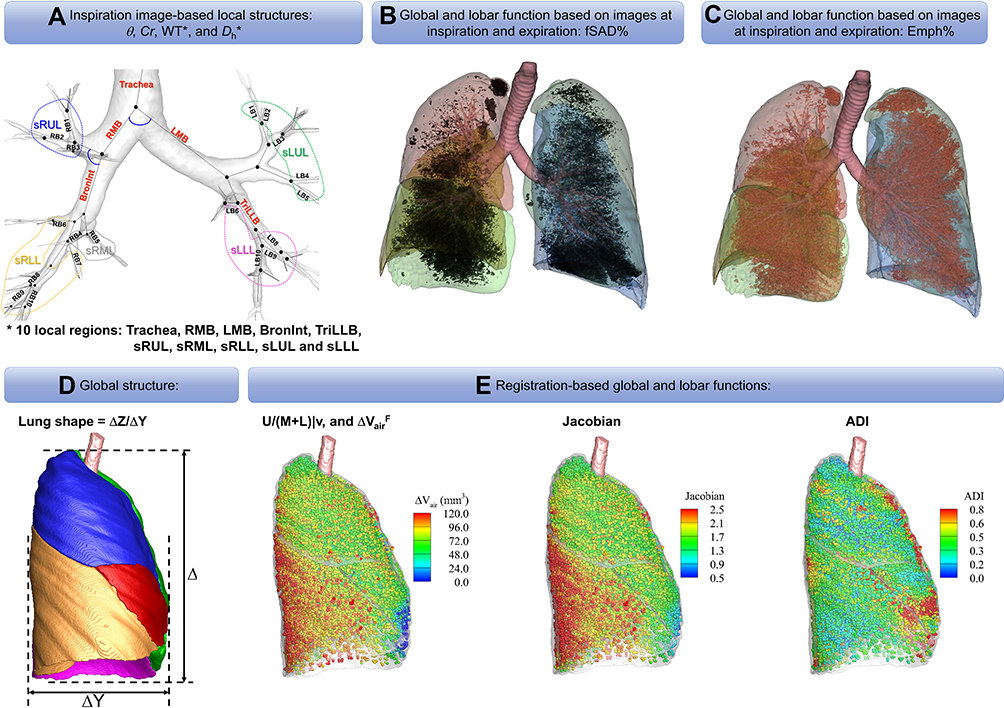 |
Figure 1 An expanded set of imaging-based metrics. (A) Local structures based on the image at inspiration: θ, Cr, WT*, and Dh*. (B) Global and lobar function based on images at inspiration and expiration: fSAD%. (C) Global and lobar function based on images at inspiration and expiration: Emph%. (D) Global structure. (E) Registration-based global and lobar functions. |
Concatenation of qCT Variables at Baseline and Their Percentage Changes
We concatenated the baseline imaging-based variables  and their percentage changes/progression rates
  into one feature vector. The
  is the row vector of the 75 defined imaging-based variables and
  is the row vector of the percentage changes with respect to the baseline variables over one year (Supplementary Materials). If we define the corresponding vector for 75 imaging-based variables at the second visit as
  , the
, the  is defined as:

where  represents the element-wise division between two vectors. The division by baseline imaging-based variables can be deemed as a method to reduce the dependence of the progression information on the baseline data. The feature vector
  for subject
  is then denoted as:
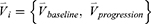
The feature vector  is then composed of a total of 150 qCT imaging-based variables, including 75 variables at baseline and their corresponding progression rates.
Cluster and Statistical Analysis
We first applied principal component analysis (PCA) to reduce multicollinearity among 150 qCT imaging-based variables and derive 150 uncorrelated principal components (PCs). We then used a subset of the first 16 PCs ranked by eigenvalues, which measured their contributions to the total variances, for clustering. Horn’s parallel analysis was applied to determine the optimal number of PCs to retain in the cluster analysis.27 Clustering methods, including hierarchical, K-means and Gaussian finite mixture model-based methods, were evaluated by connectivity, Silhouette width and Dunn indices.28 The stability for different numbers of clusters based on different clustering methods was tested using a nonparametric bootstrap analysis with 200 bootstrapped datasets. The mean of Jaccard similarity coefficients was computed to find the good stability cluster number.29 Considering all the above-mentioned indices, the K-means method with 16 PCs and a cluster number of 4 yielded the best results (Supplementary Materials).
With the data collected and processed in progress, various variables were available when the study was conducted which contained demographic variables including age, gender and race, clinical variables including spirometry, 6-minute walk test results, body mass index (BMI), GOLD stage, BODE index, CAT score, smoking pack years, symptoms including wheezing and whistling in the chest, sleep apnea, diagnosed disease at baseline including chronic bronchitis, emphysema, COPD, disease history including history of diagnosed asthma. In total, 87 comparisons of variables between clusters were performed in our analysis Kruskal–Wallis and Pearson’s chi-square tests were employed to compare differences of continuous and categorical variables, respectively. P=0.05 was taken as the significant level for all tests. In addition, Benjamini-Hochberg procedure was employed with a resultant false discovery rate (FDR) 5.4% for the entire study.30 Since our study is an exploratory research, pre-selecting variables of interest is difficult, so we accept an FDR of 5.4%. Blood biomarkers, visual diagnostics (VD) and emphysematous subtypes were also compared in Supplementary Materials.
Results
The cluster analysis identified four stable clusters 1, 2, 3, and 4 with the sizes of 124 (26.27%), 136 (28.81), 77 (16.31%), and 135 (28.60%), respectively. The major characteristics of each cluster are summarized in Figure 2.
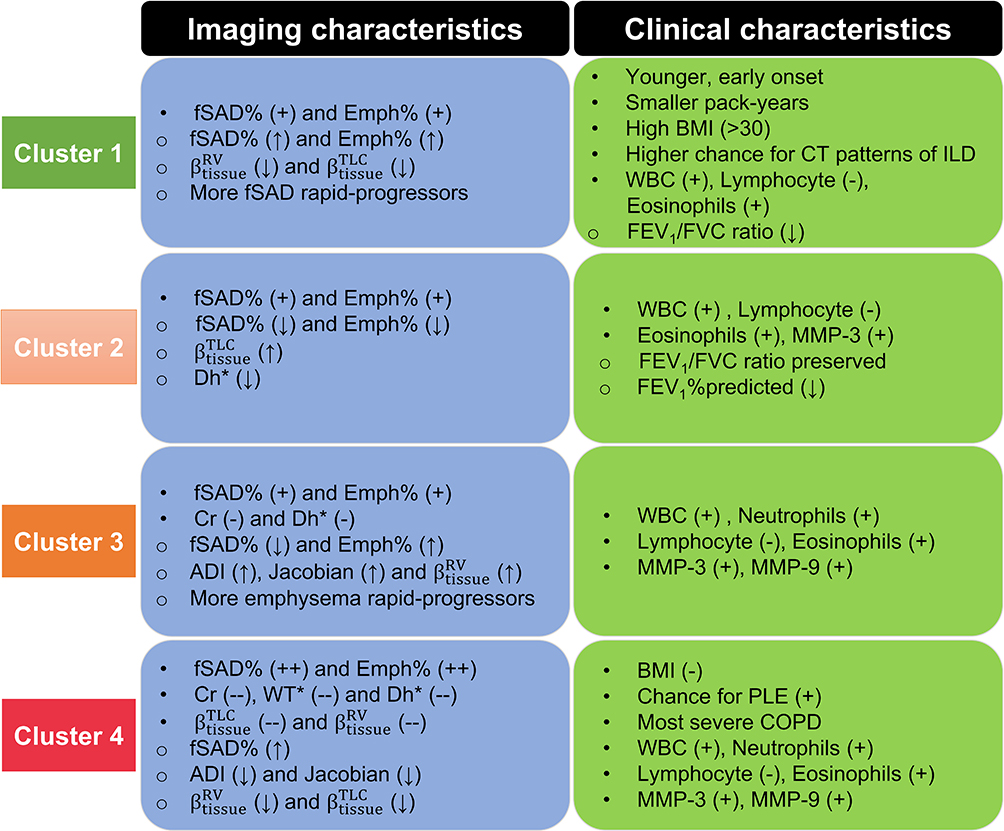 |
Figure 2 A summary of imaging and associated clinical characteristics between clusters. ●Baseline variables. ○One-year change variables. +Bigger than that of healthy never-smokers. ++Biggest among clusters. –Smaller than that of healthy never-smokers. –Smallest among clusters. ↑Increased over one year. ↓Decreased over one year. |
Imaging-Based Characteristics
Wilk’s λ method identified the first 20 most significant variables (Table 2).31 The result showed that functional variables and their progression rates over one year were more dominant in separating subgroups within patients. Baseline fSAD% and Emph% increased with increasing cluster number (Table 3, Figure 3), signifying the growing severity of COPD from cluster 1 to cluster 4. Cluster 1 was at an early stage of COPD with statistically significant progression (Figure 4) of fSAD% (Table 4) and Emph% (Table 5). Cluster 2 was marked by decreased fSAD% and paradoxically decreased Emph% over one year since emphysema cannot be reversed. Cluster 3 showed an attenuation of fSAD% and rapid progression of Emph% over one year. Using the image voxels of fSAD and emphysema for cluster-representative subjects in a coronal plane at baseline and follow-up visits shown in Figure 5, fSAD was observed to change into emphysema in the upper and middle lobes of cluster 3. Cluster 4 was characterized by increased fSAD% over one year.
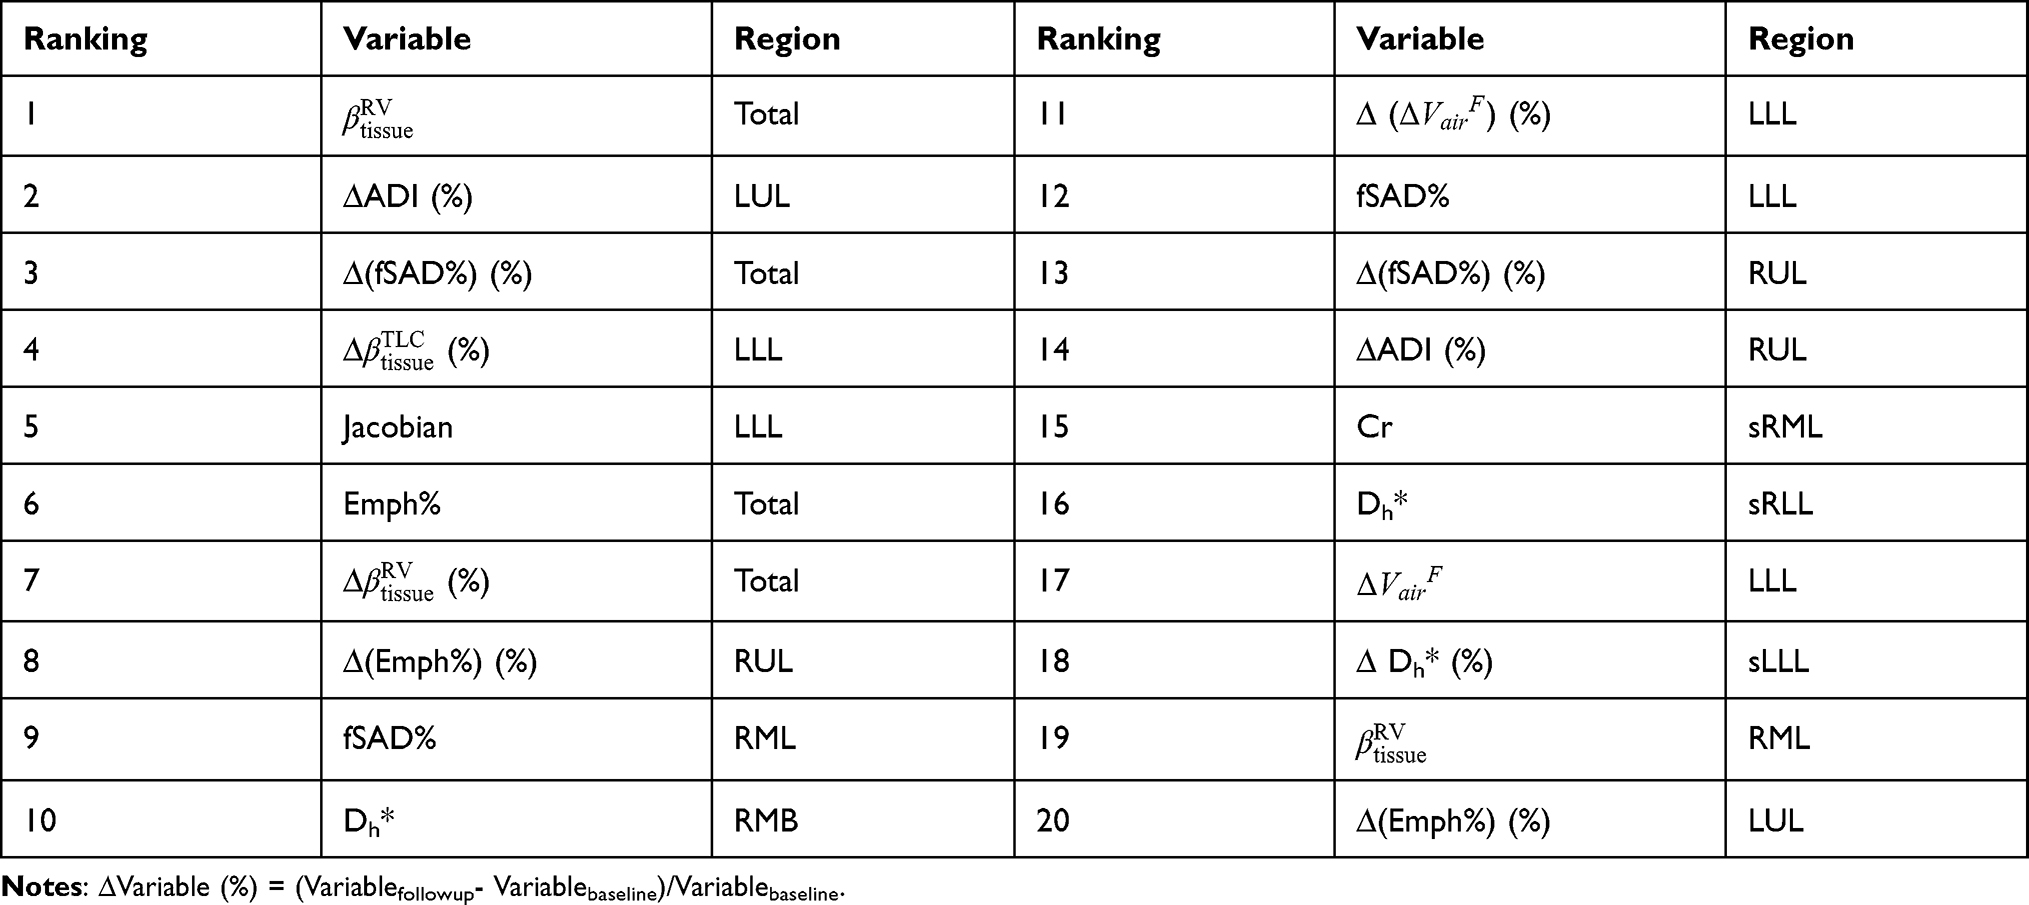 |
Table 2 Major Imaging-Based Features Selected by Wilk’s λ Method in Four Imaging-Based Clusters. The Importance of Variables is Decreasing from Left to Right and Top to Bottom |
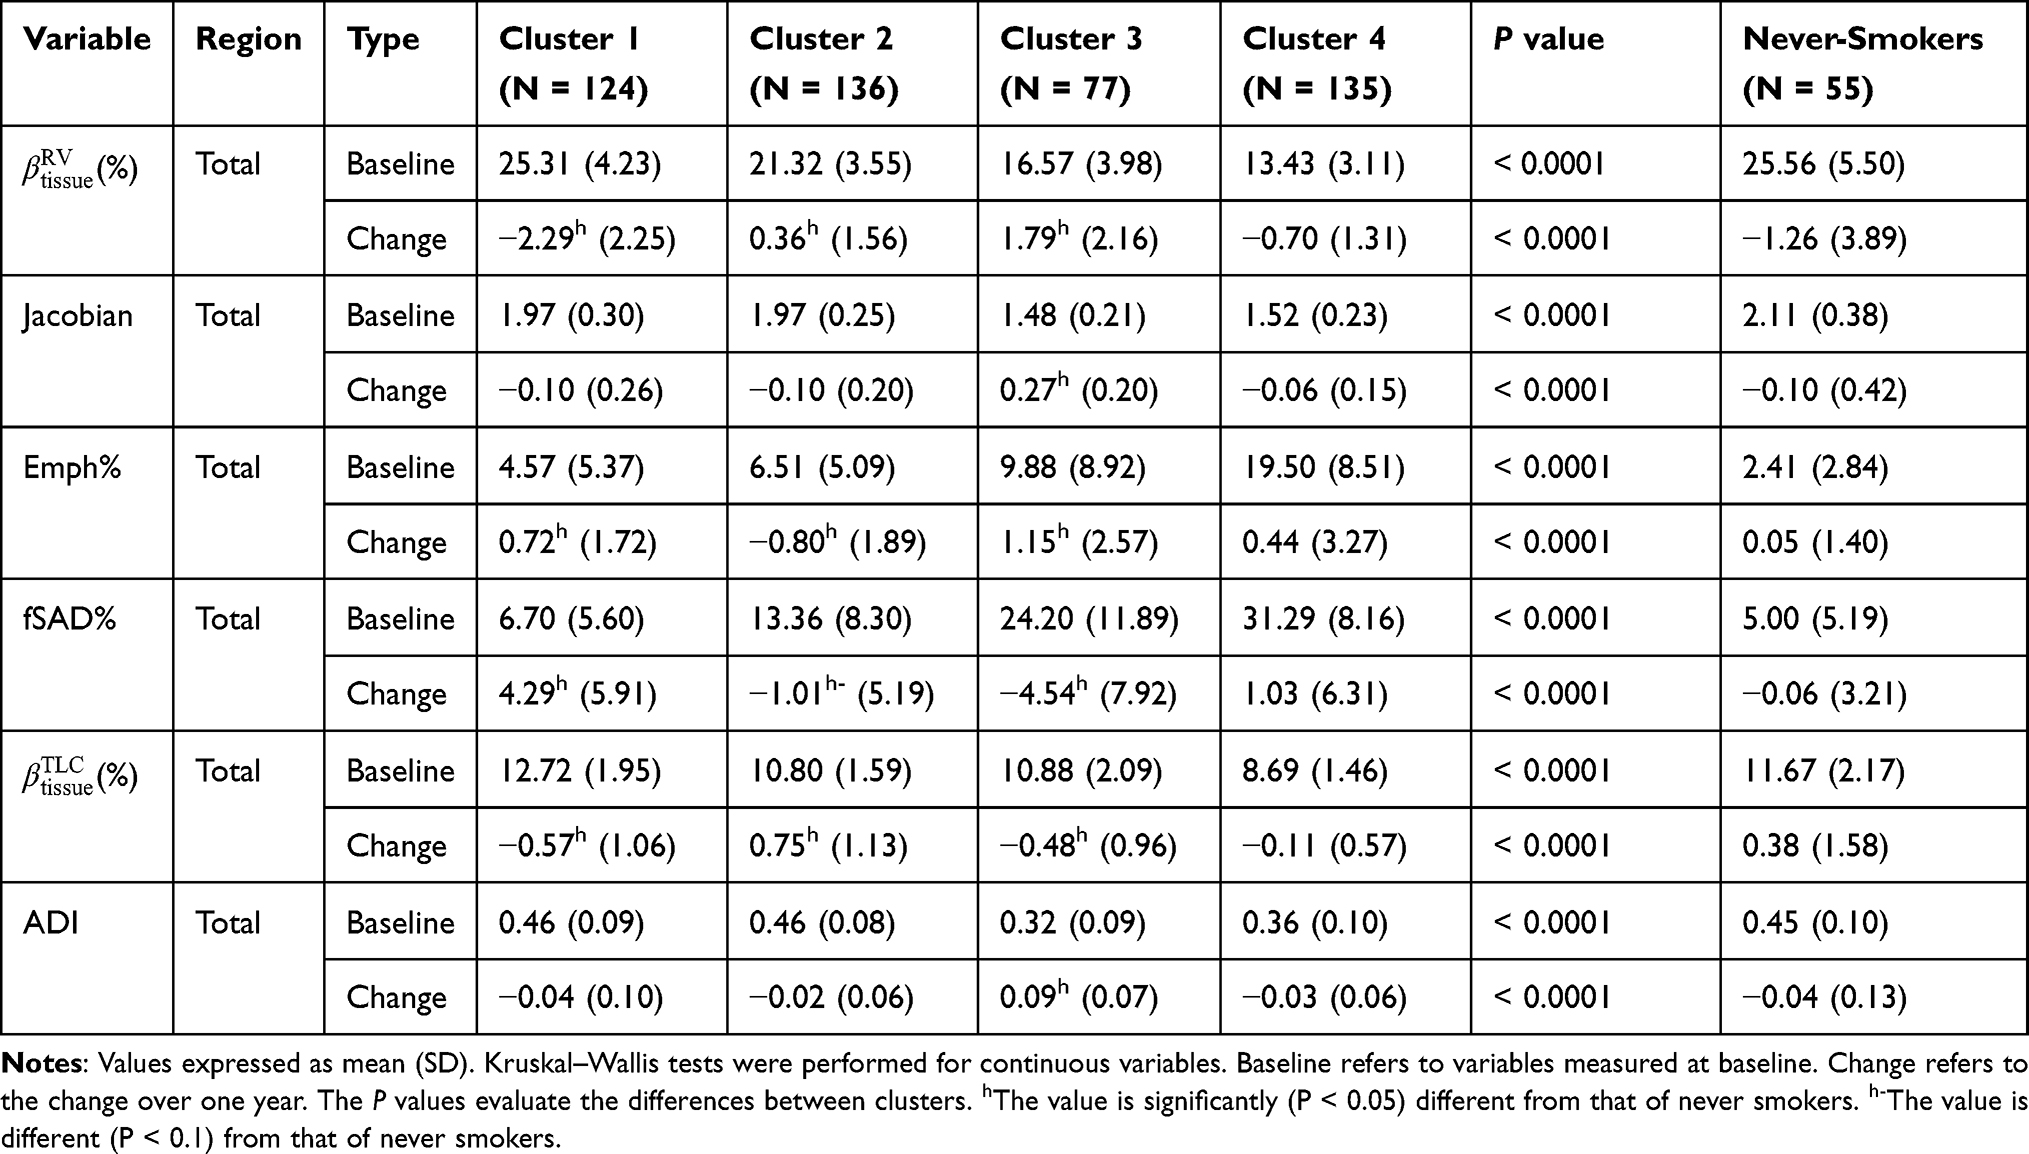 |
Table 3 Major Functional Features in Four Imaging-Based Clusters and Never Smokers (Stratum 1) |
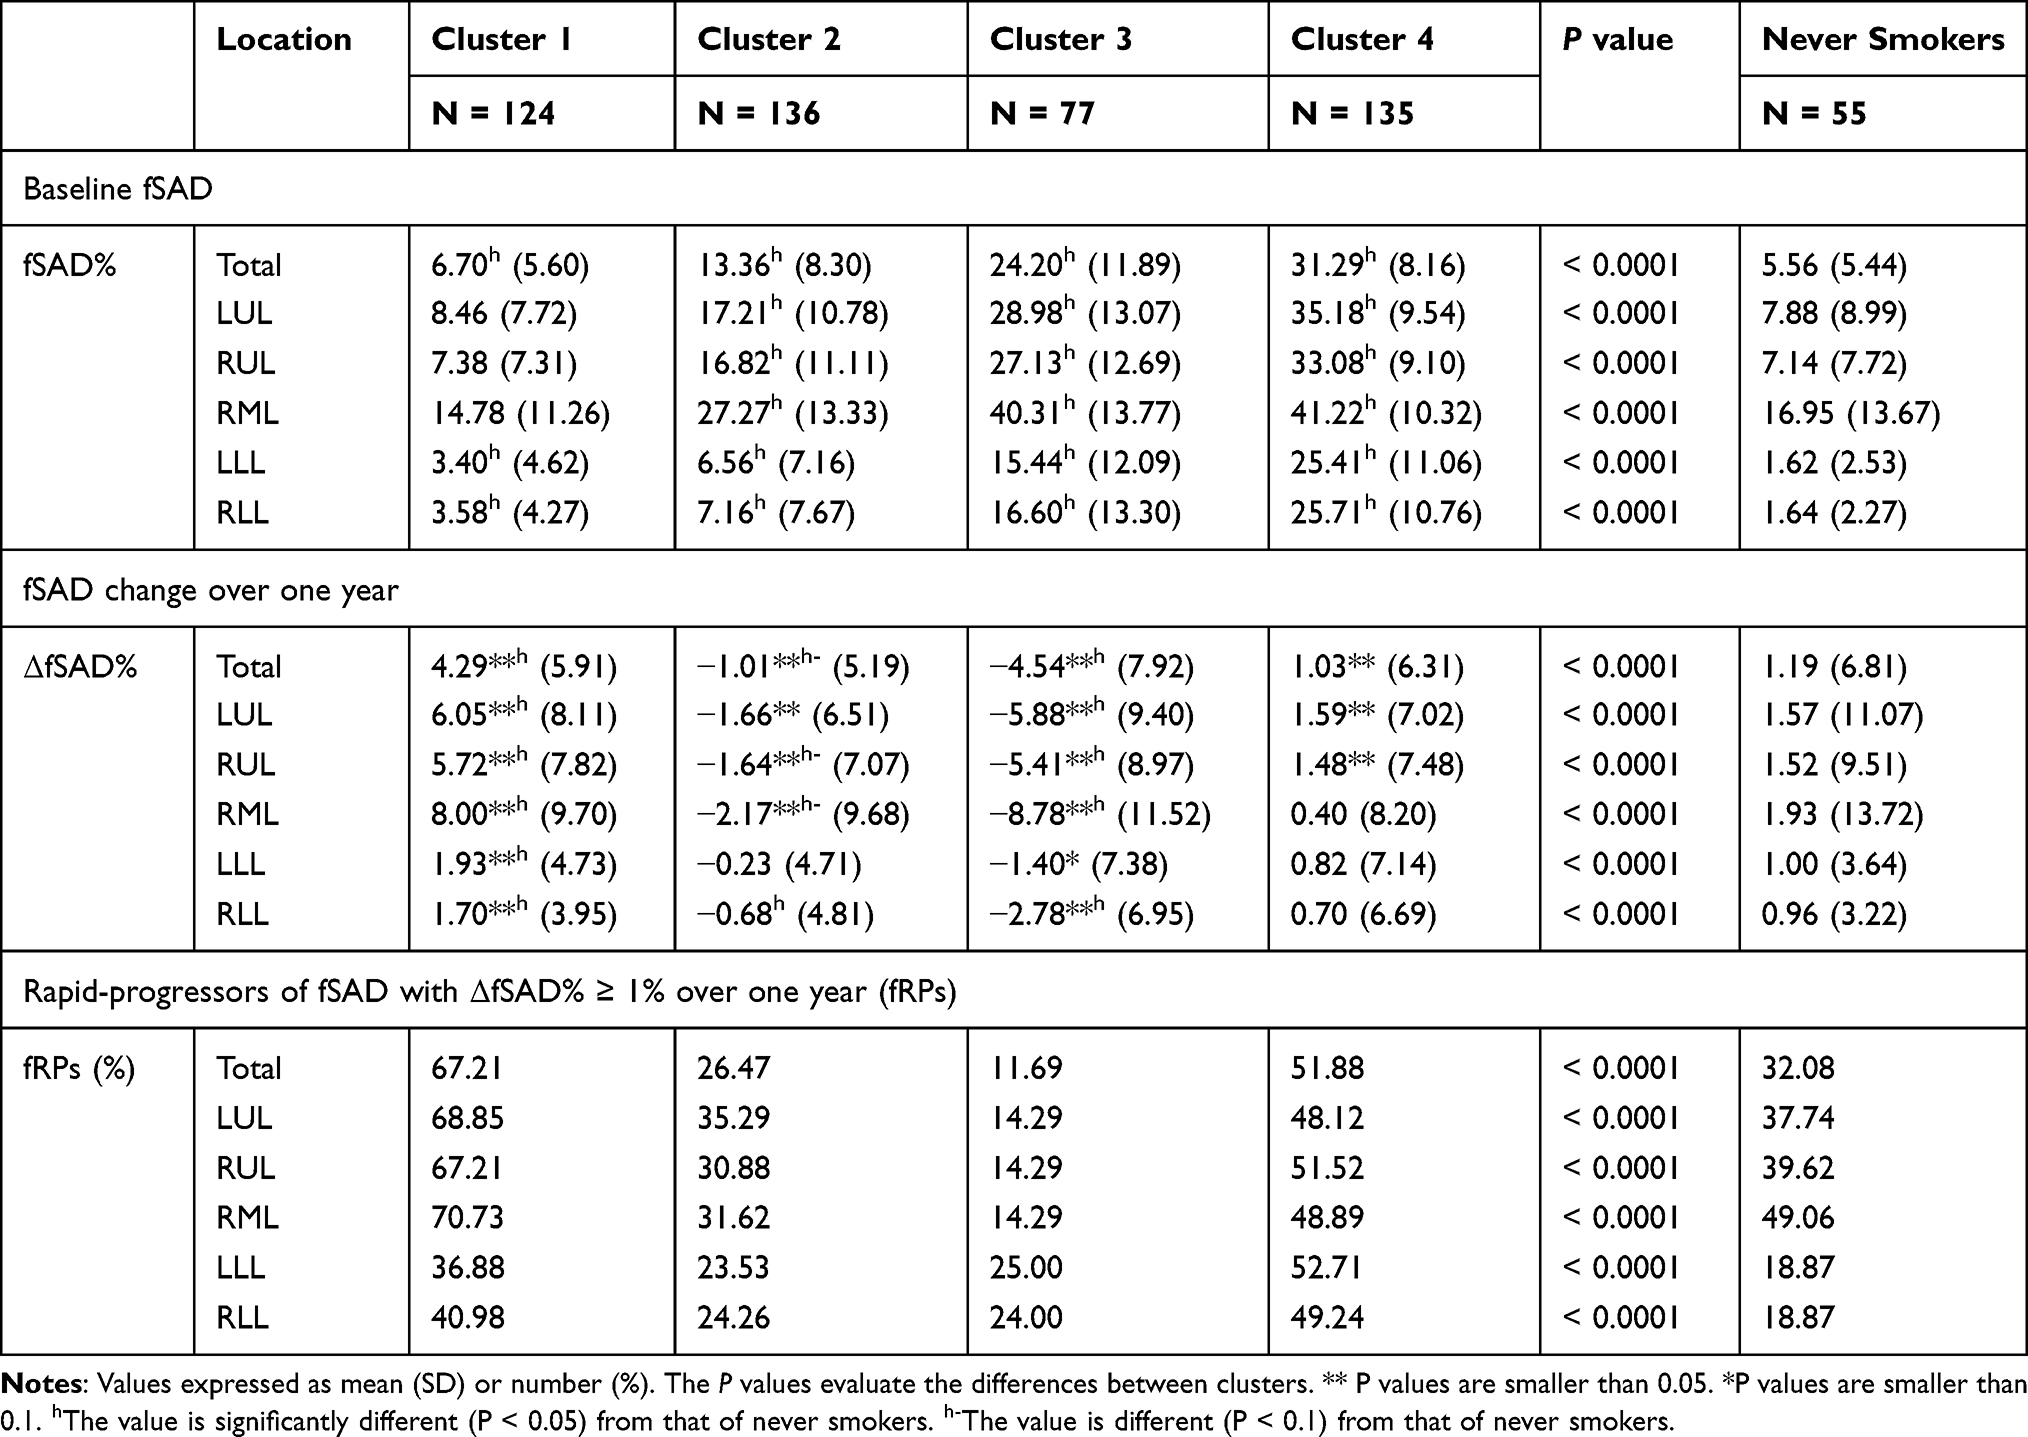 |
Table 4 Baseline fSAD and Its Progression in Each Cluster |
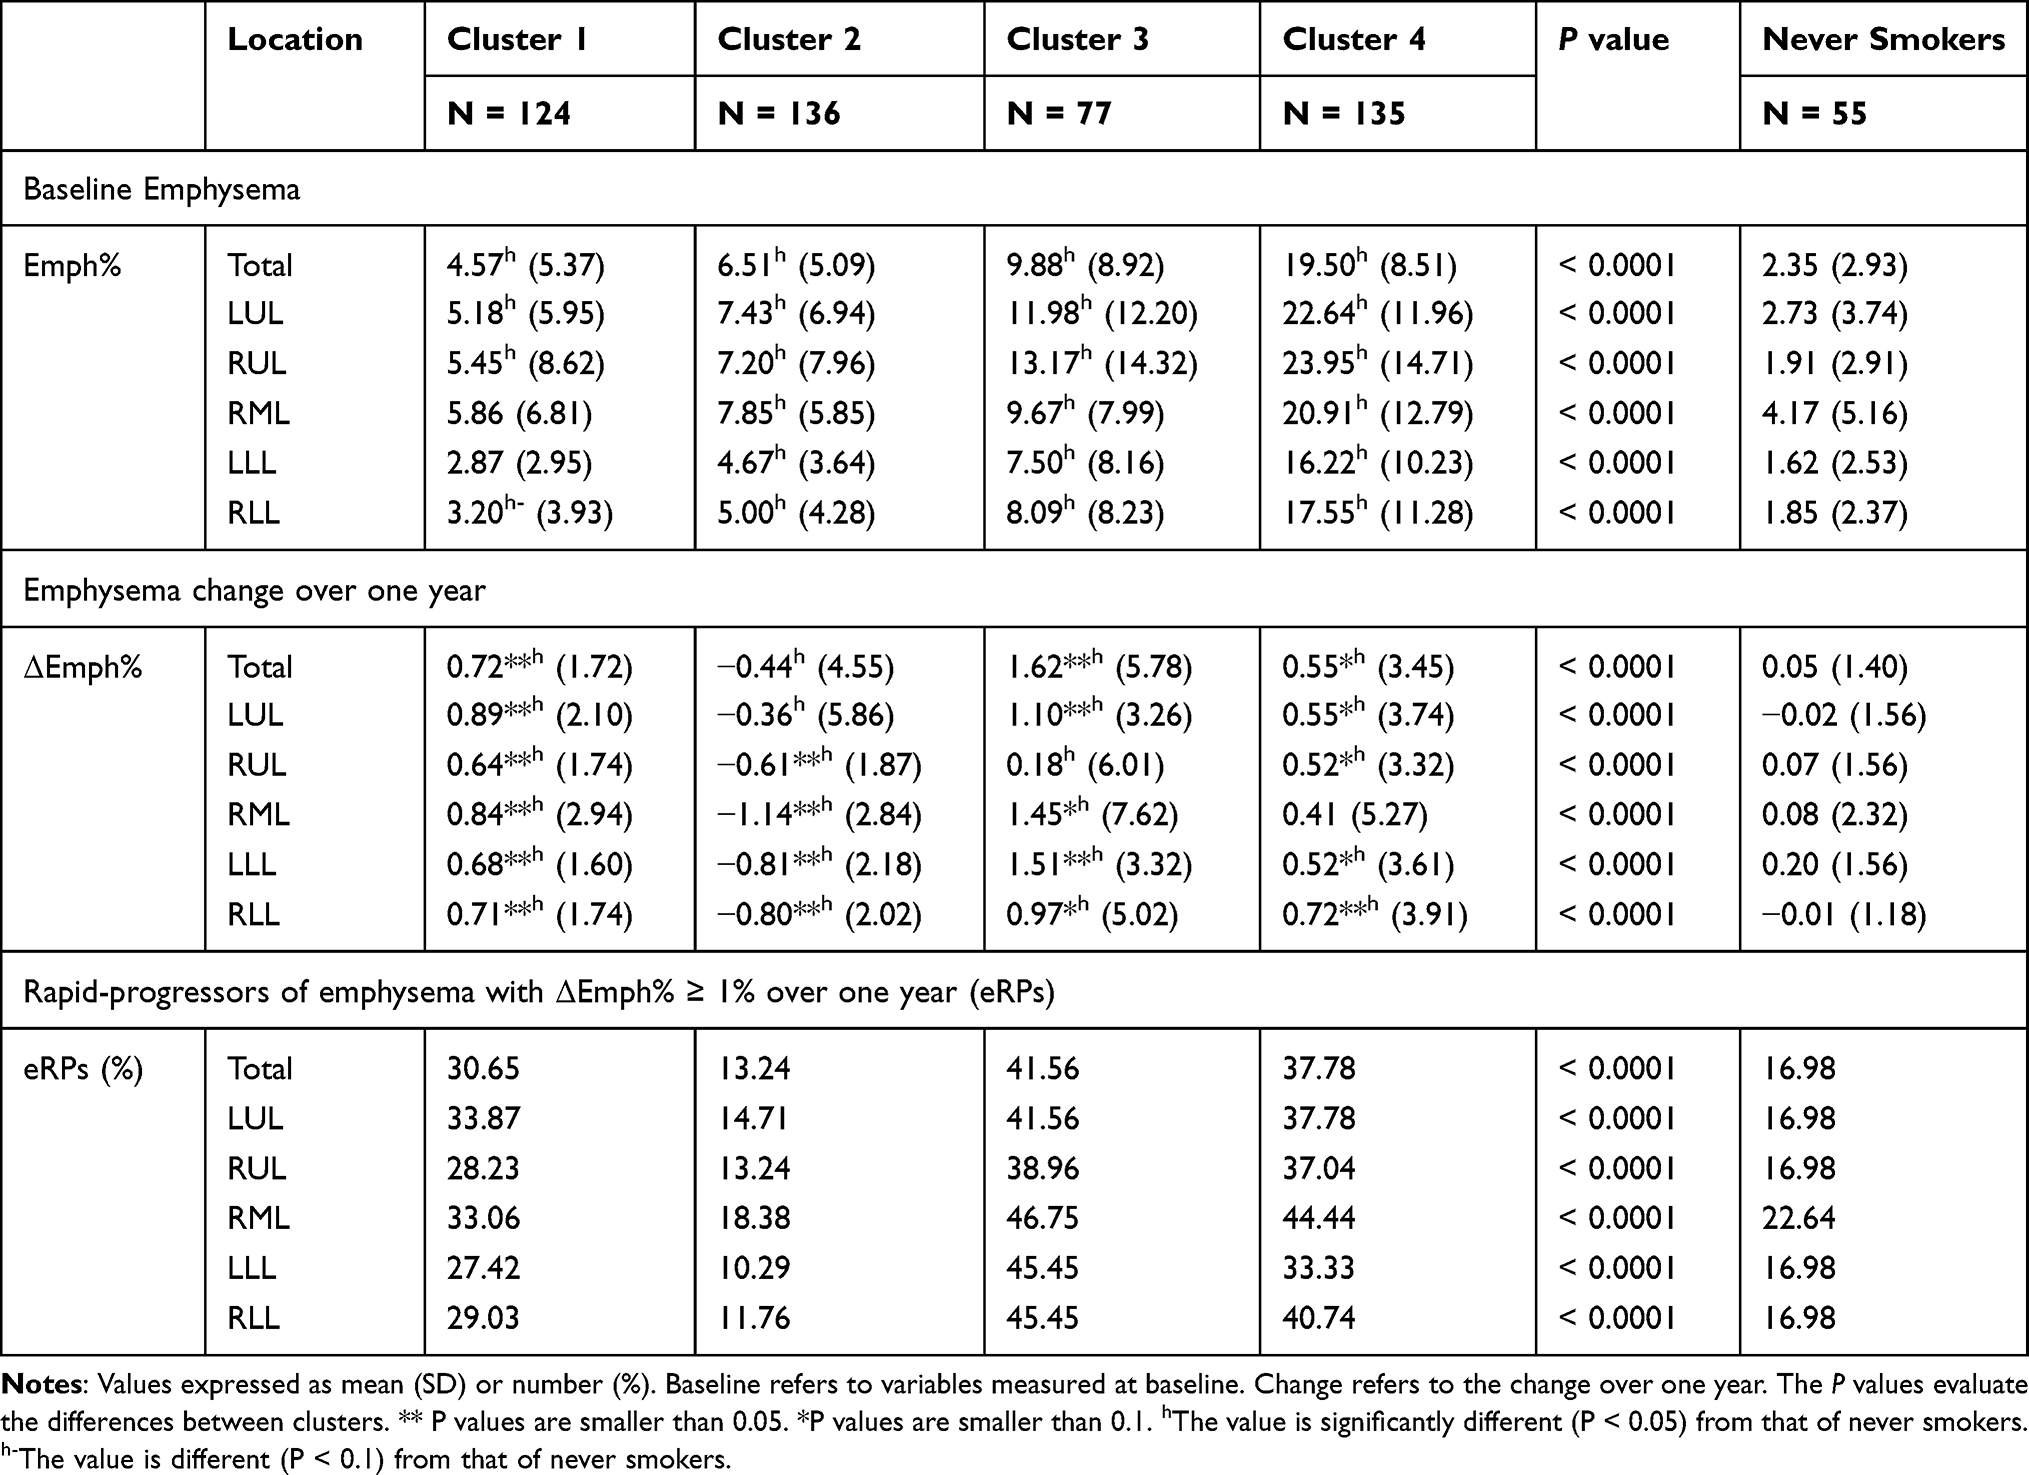 |
Table 5 Baseline Emphysema and Its Progression in Each Cluster |
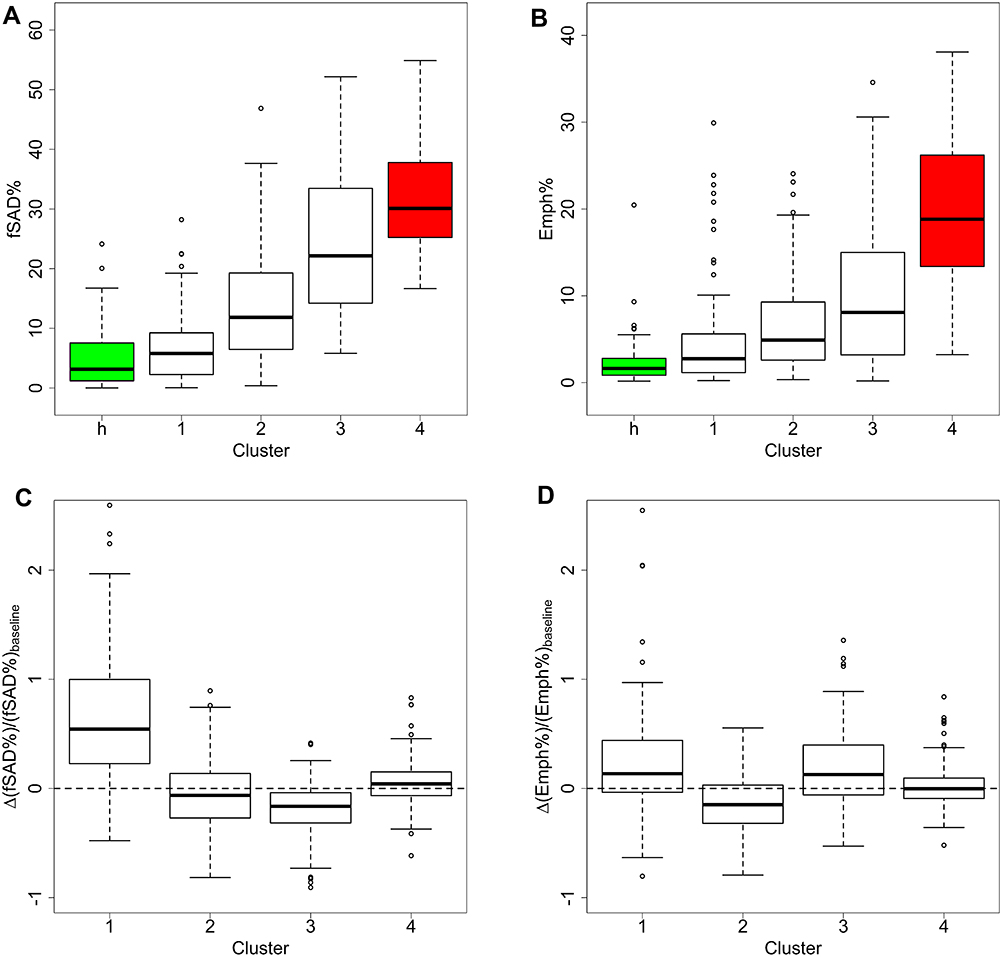 |
Figure 3 Baseline fSAD% and Emph% and their change over one year. (A) fSAD% for four clusters and the healthy control group (green and represented by cluster h). (B) Emph% for four clusters and the healthy control group (green). (C) Percentage of change of fSAD% with respect to baseline fSAD% in total lung. (D) Percentage of change of Emph% with respect to baseline Emph% in total lung. |
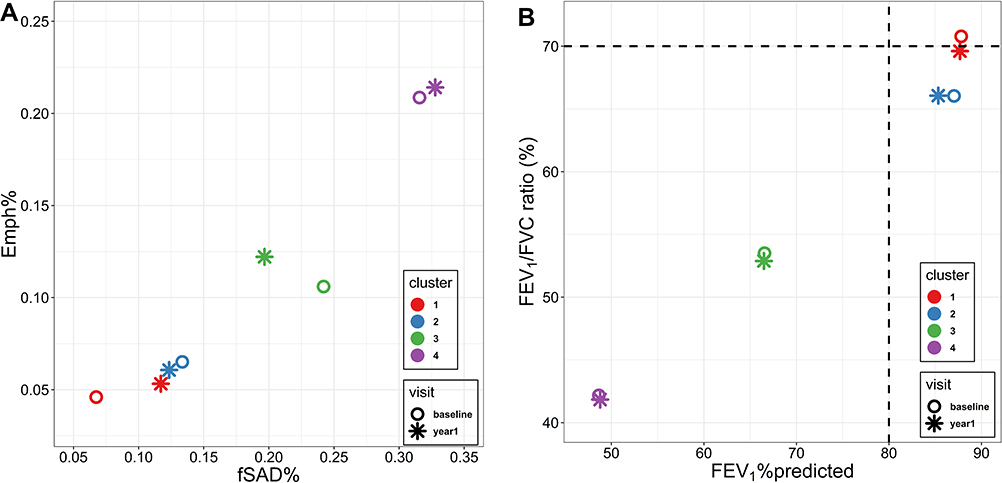 |
Figure 4 Changes of PFTs measures, fSAD% and Emph% over one year. (A) The average fSAD% and Emph% at baseline and follow-up visits. (B) The mean post-bronchodilator FEV1%predicted and FEV1/FVC ratio at baseline and follow-up visits. |
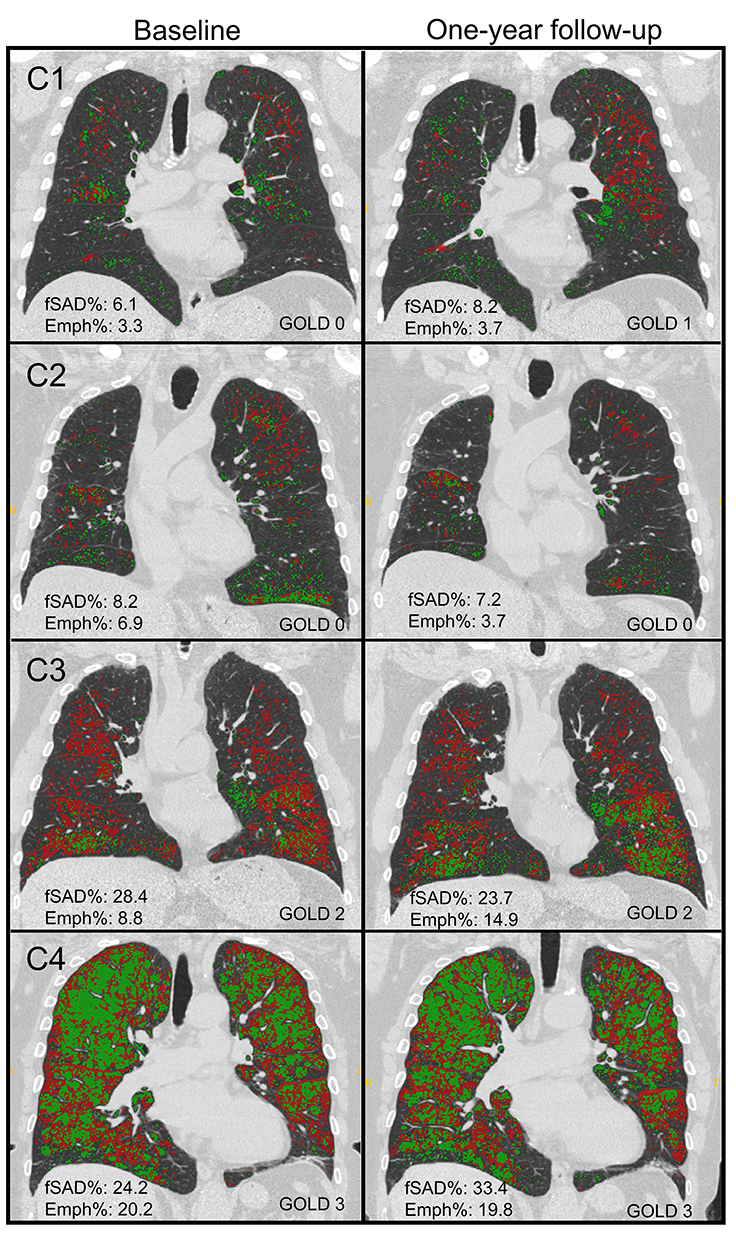 |
Figure 5 Baseline (left column) and one-year follow-up (right column) fSAD (red) and emphysematous regions (green) of cluster-representative subjects. (C1, C2, C3, and C4) refer to cluster 1, cluster 2, cluster 3, and cluster 4, respectively. |
There are no common standards to determine the progression of Emph% as rapid progression. The annual change of Emph% for ex-smokers who quitted smoking for more than 5 years was reported to be around 1%.32 And the emphysema rapid-progressors (eRPs) were defined as having a one-year increase greater than 1%.33 Based on the above two references, we adopted the threshold of 1% to define eRPs. Likewise, the rapid-progressors of fSAD (fRPs) were defined as having a one-year increase greater than 1%. Clusters 1 and 4 had a much higher proportion of fRPs than clusters 2 and 3 (Table 4). Cluster 2 had the smallest proportion of eRPs, while cluster 3 was characterized by the largest proportion of eRPs (Table 5). Baseline  decreased with cluster number. However,
  in cluster 2 increased over one year, while it decreased in other clusters (Figure 6). Baseline
  was ranked the most significant variable in Wilk’s
  method (Table 2), which consistently decreased with cluster number and was associated with more severe air-trapping at baseline. The progression of
  , an indicator of progression of air trapping, implies that air trapping progressed faster in clusters 1 and 4.
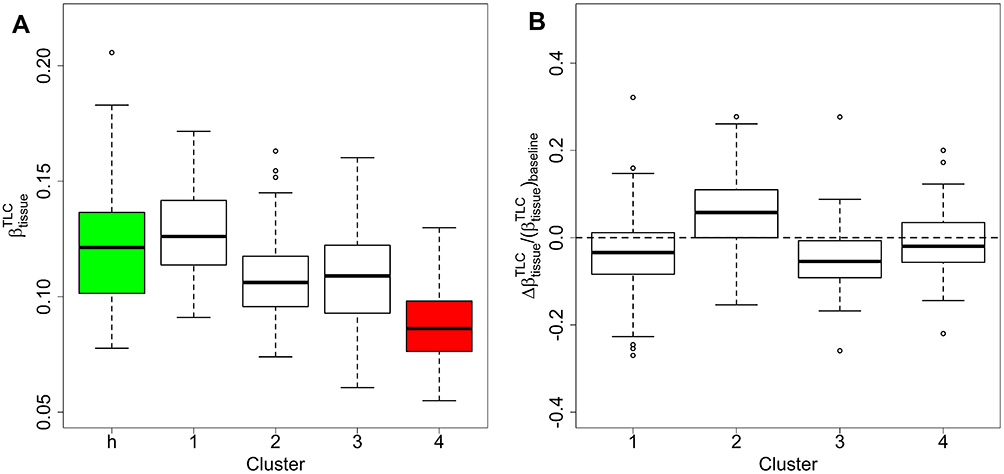 |
Figure 6 Baseline |


Structural alterations were also observed between clusters (Table 6). In clusters 1 and 2, WT*Dh* and Cr were close to healthy never-smokers in most of the lung regions at baseline. Over one year, WT*Dh* and Cr showed no significant change in most of the regions in cluster 1. Cluster 2 was characterized by airway narrowing, viz, decreased Dh*in almost all regions (Table 6, Table S1). Cluster 3 demonstrated decreased Dh* and Cr at baseline with no significant change over one year for most lung regions. Cluster 4 showed decreased WT*Dh* and Cr in most of the lung regions compared with healthy never-smokers at baseline and the changes over one year were not significant in most regions.
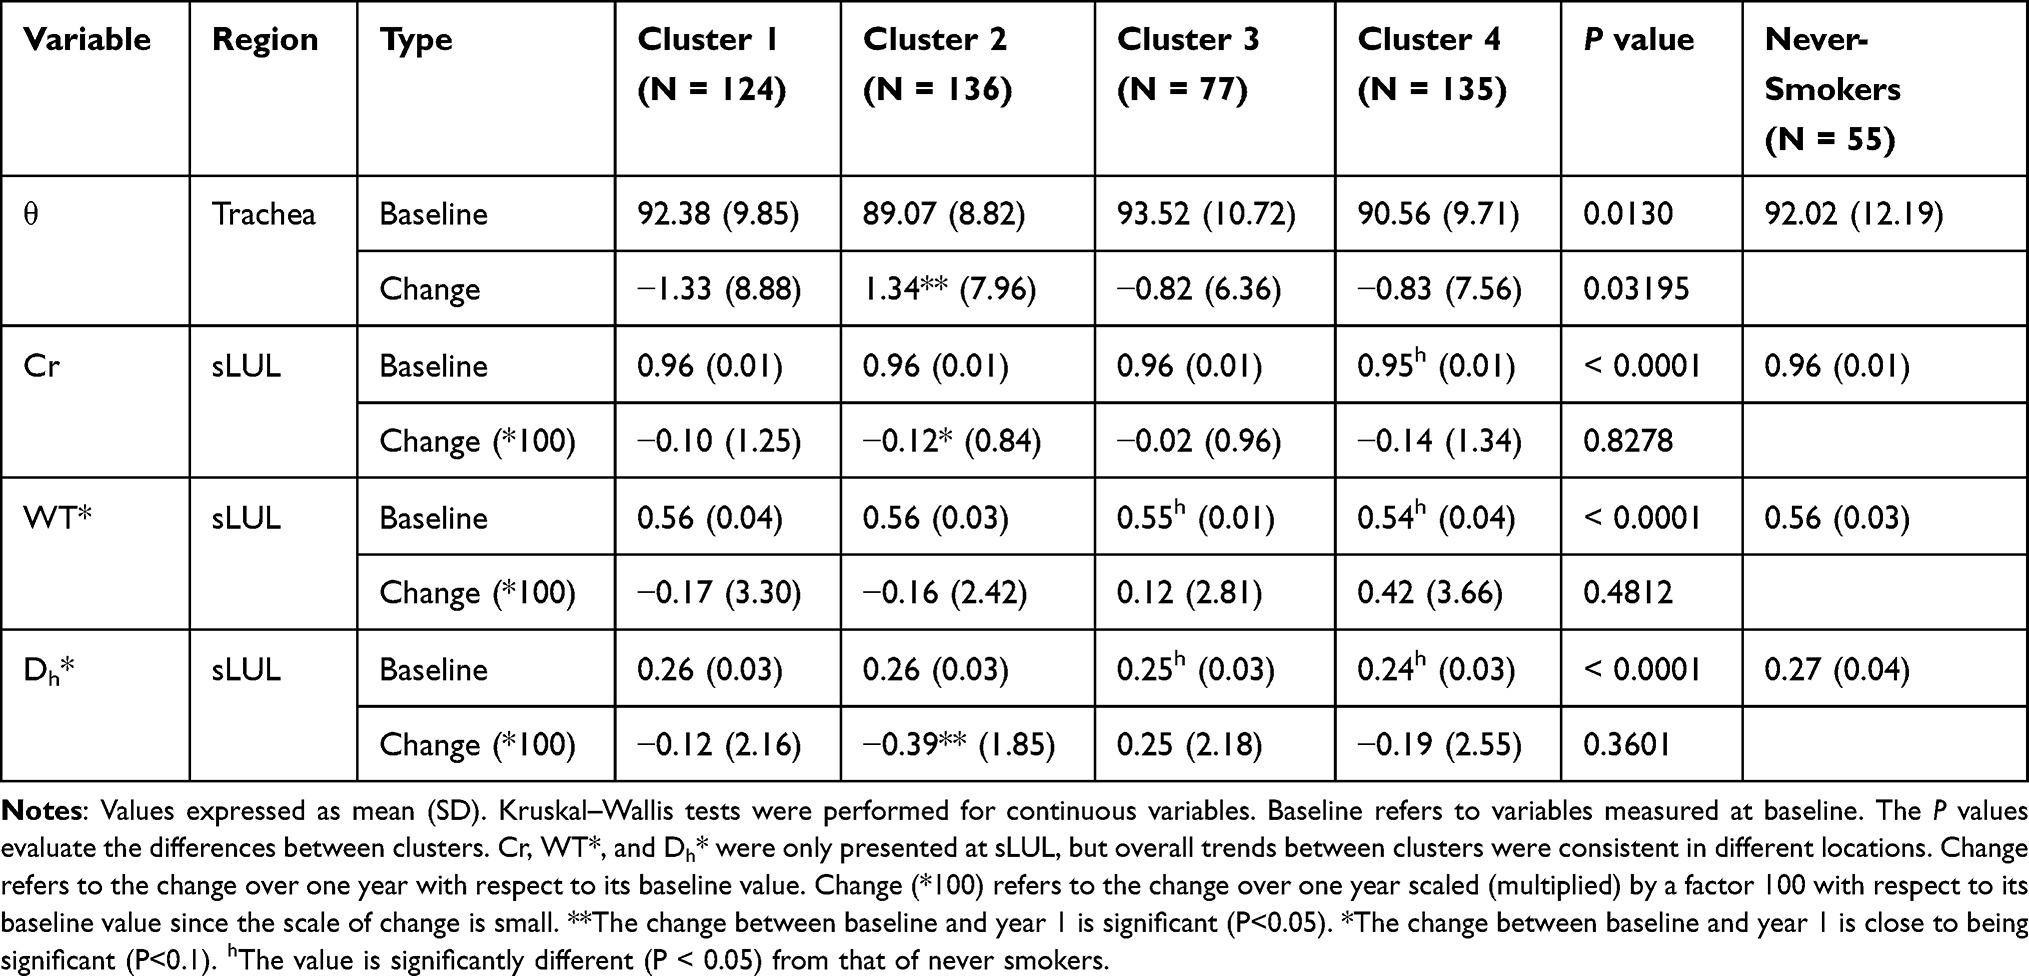 |
Table 6 Segmental Airway Features at Specific Regions |
We performed an additional lung volume analysis. Lung volumes estimated by CT scans for each cluster were presented in Table S2. Over one year, clusters 1 and 3 showed increased TLC while cluster 2 displayed decreased TLC (P<0.05). Over one year, clusters 1 and 4 showed increased RV, while cluster 3 showed decreased RV (P<0.05). For former smokers, the change of RV was correlated (r=0.61, P<0.05) with the change of fSAD% and the change of TLC was mildly correlated (r=0.34, P<0.05) with change of Emph% for the total lung. Though TLC was correlated (P<0.05) with the Dh* at baseline, the change of TLC was not significantly correlated with the change of Dh* over one year.
Clinical Features and Biomarkers
With increasing cluster number, the cohort demonstrated growing severity at baseline based on GOLD stages (Table 7) and increasing impact level of COPD based on CAT scores (Table 8).34 Although these clusters appeared in patients at all levels of severity, subjects in cluster 1 (51%) and cluster 2 (40%) were predominantly classified as GOLD 0. The baseline post-bronchodilator FEV1%predicted and FVC%predicted were relatively high in clusters 1 and 2 compared with clusters 3 and 4 (Table 7, Figure 4). Cluster 1 demonstrated a decreased post-bronchodilator FEV1/FVC ratio over one year with preserved FEV1%predicted (Table 7). Cluster 2 demonstrated that FEV1%predicted decreased by 1.95% (P<0.05) and FVC%predicted decreased by 1.92% (P=0.11) with preserved FEV1/FVC ratio over one year. Additionally, the yearly change in the average FEV1 for each cluster was reported in (Table S3). Although the subjects in cluster 2 were “relatively stable” based on the criteria of fRPs and eRPs, they had the highest rate of functional decline in FEV1 over one year (−86 mL/year). Clusters 3 and 4 showed no significant change of FEV1%predicted and FVC%predicted over one year.
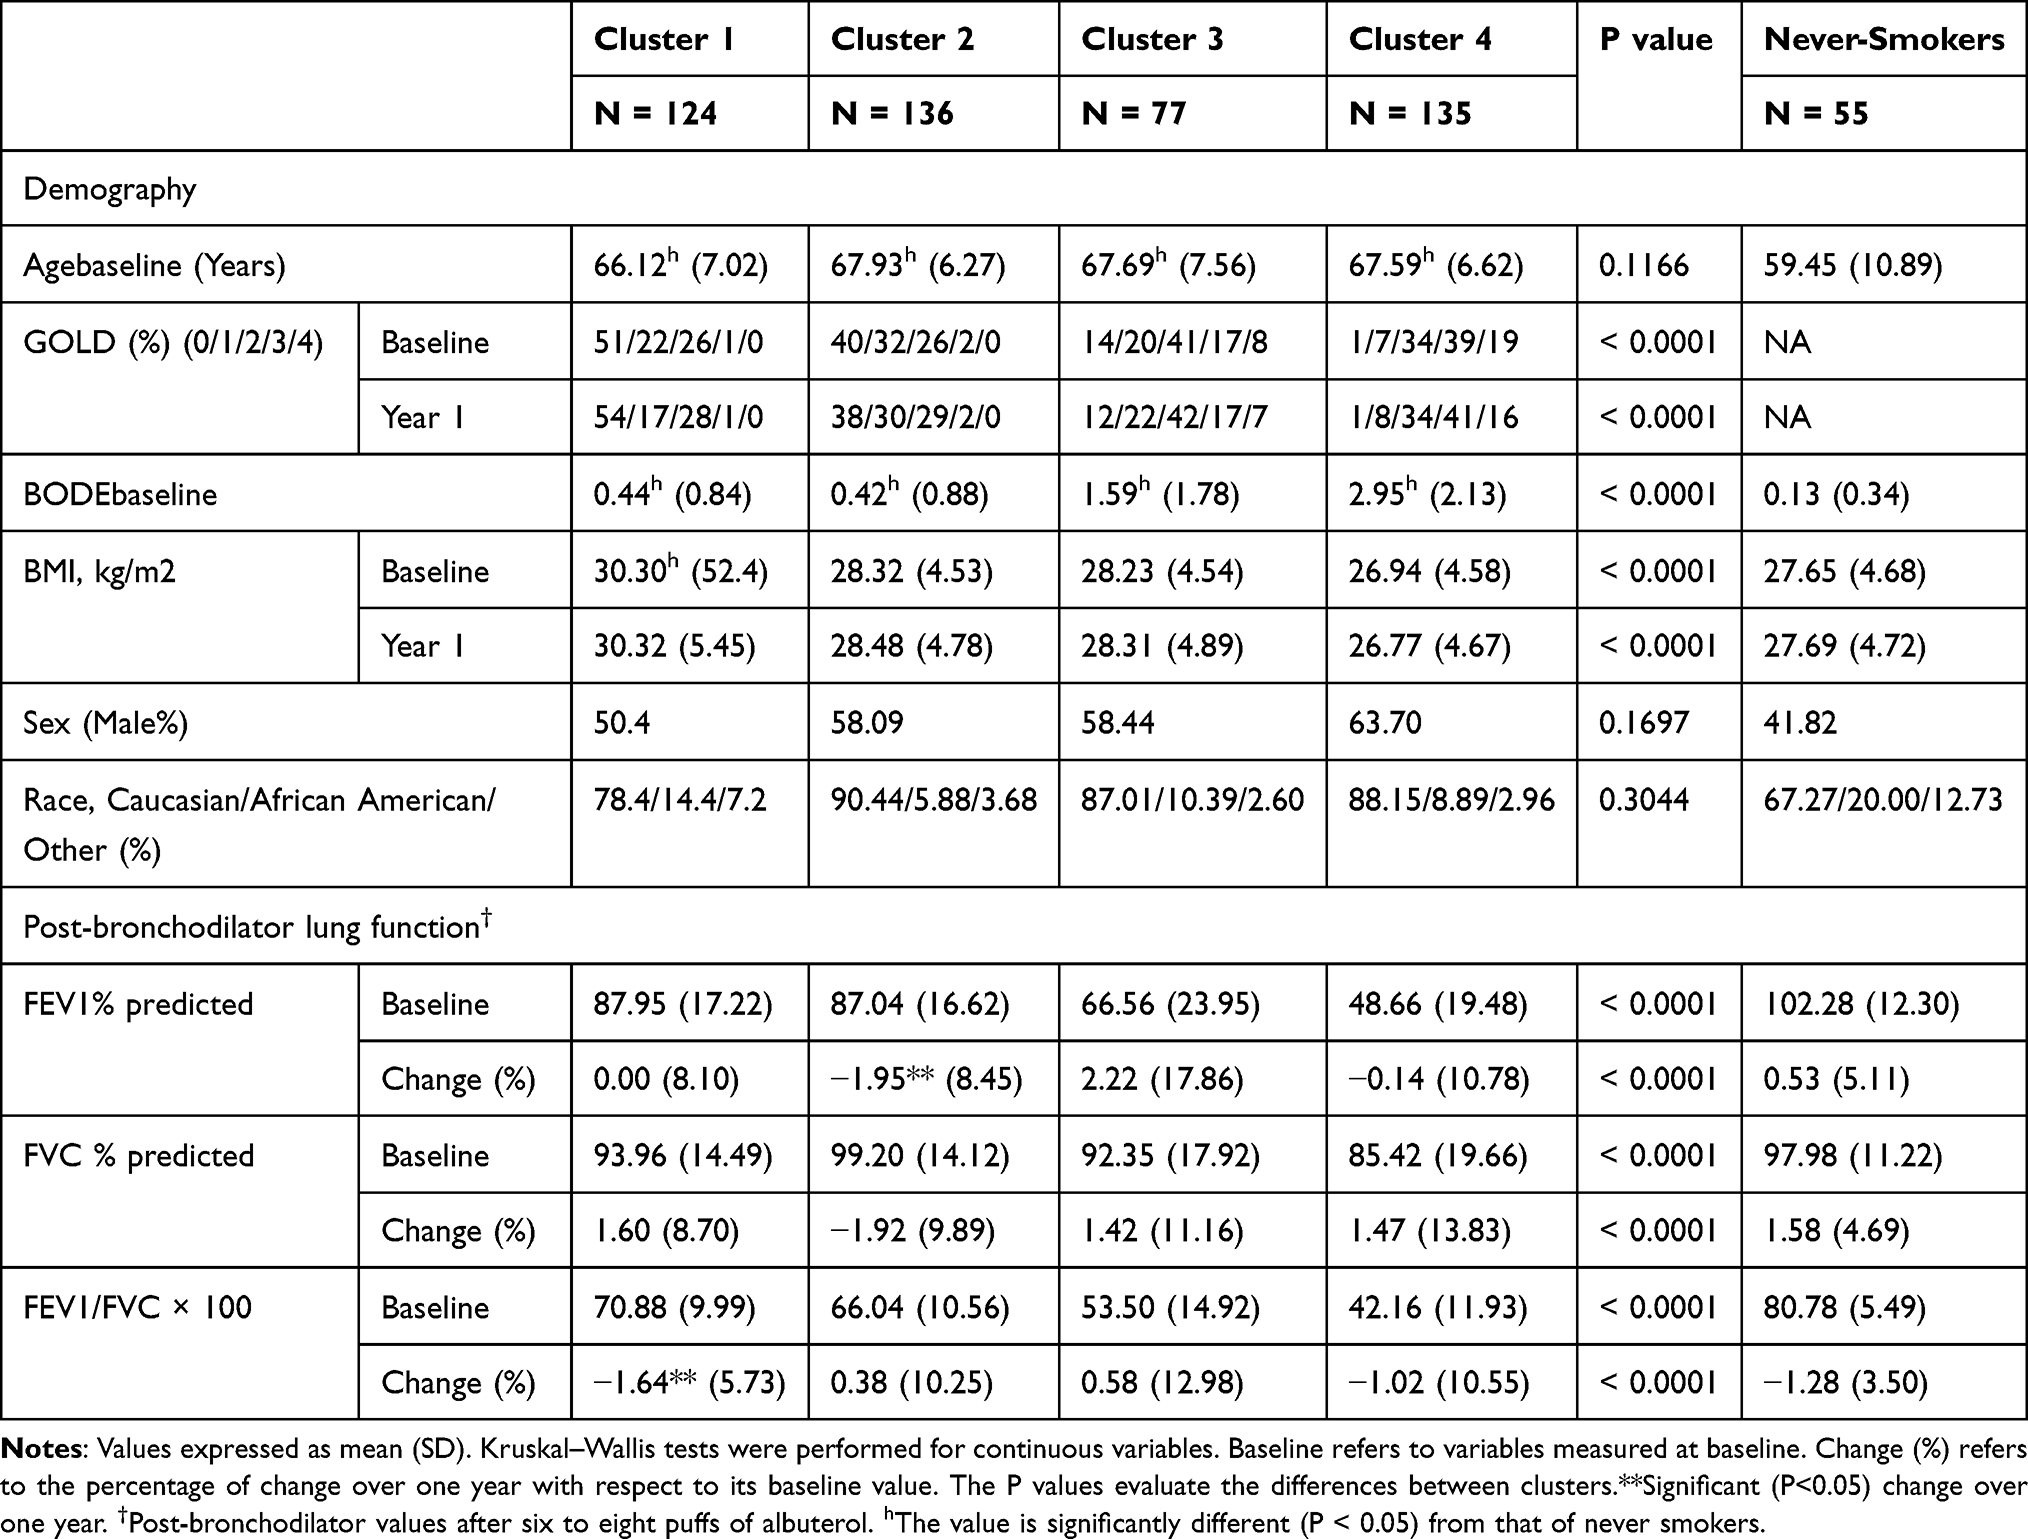 |
Table 7 Demography, Post-Bronchodilator PFTs in Four Imaging-Based Clusters |
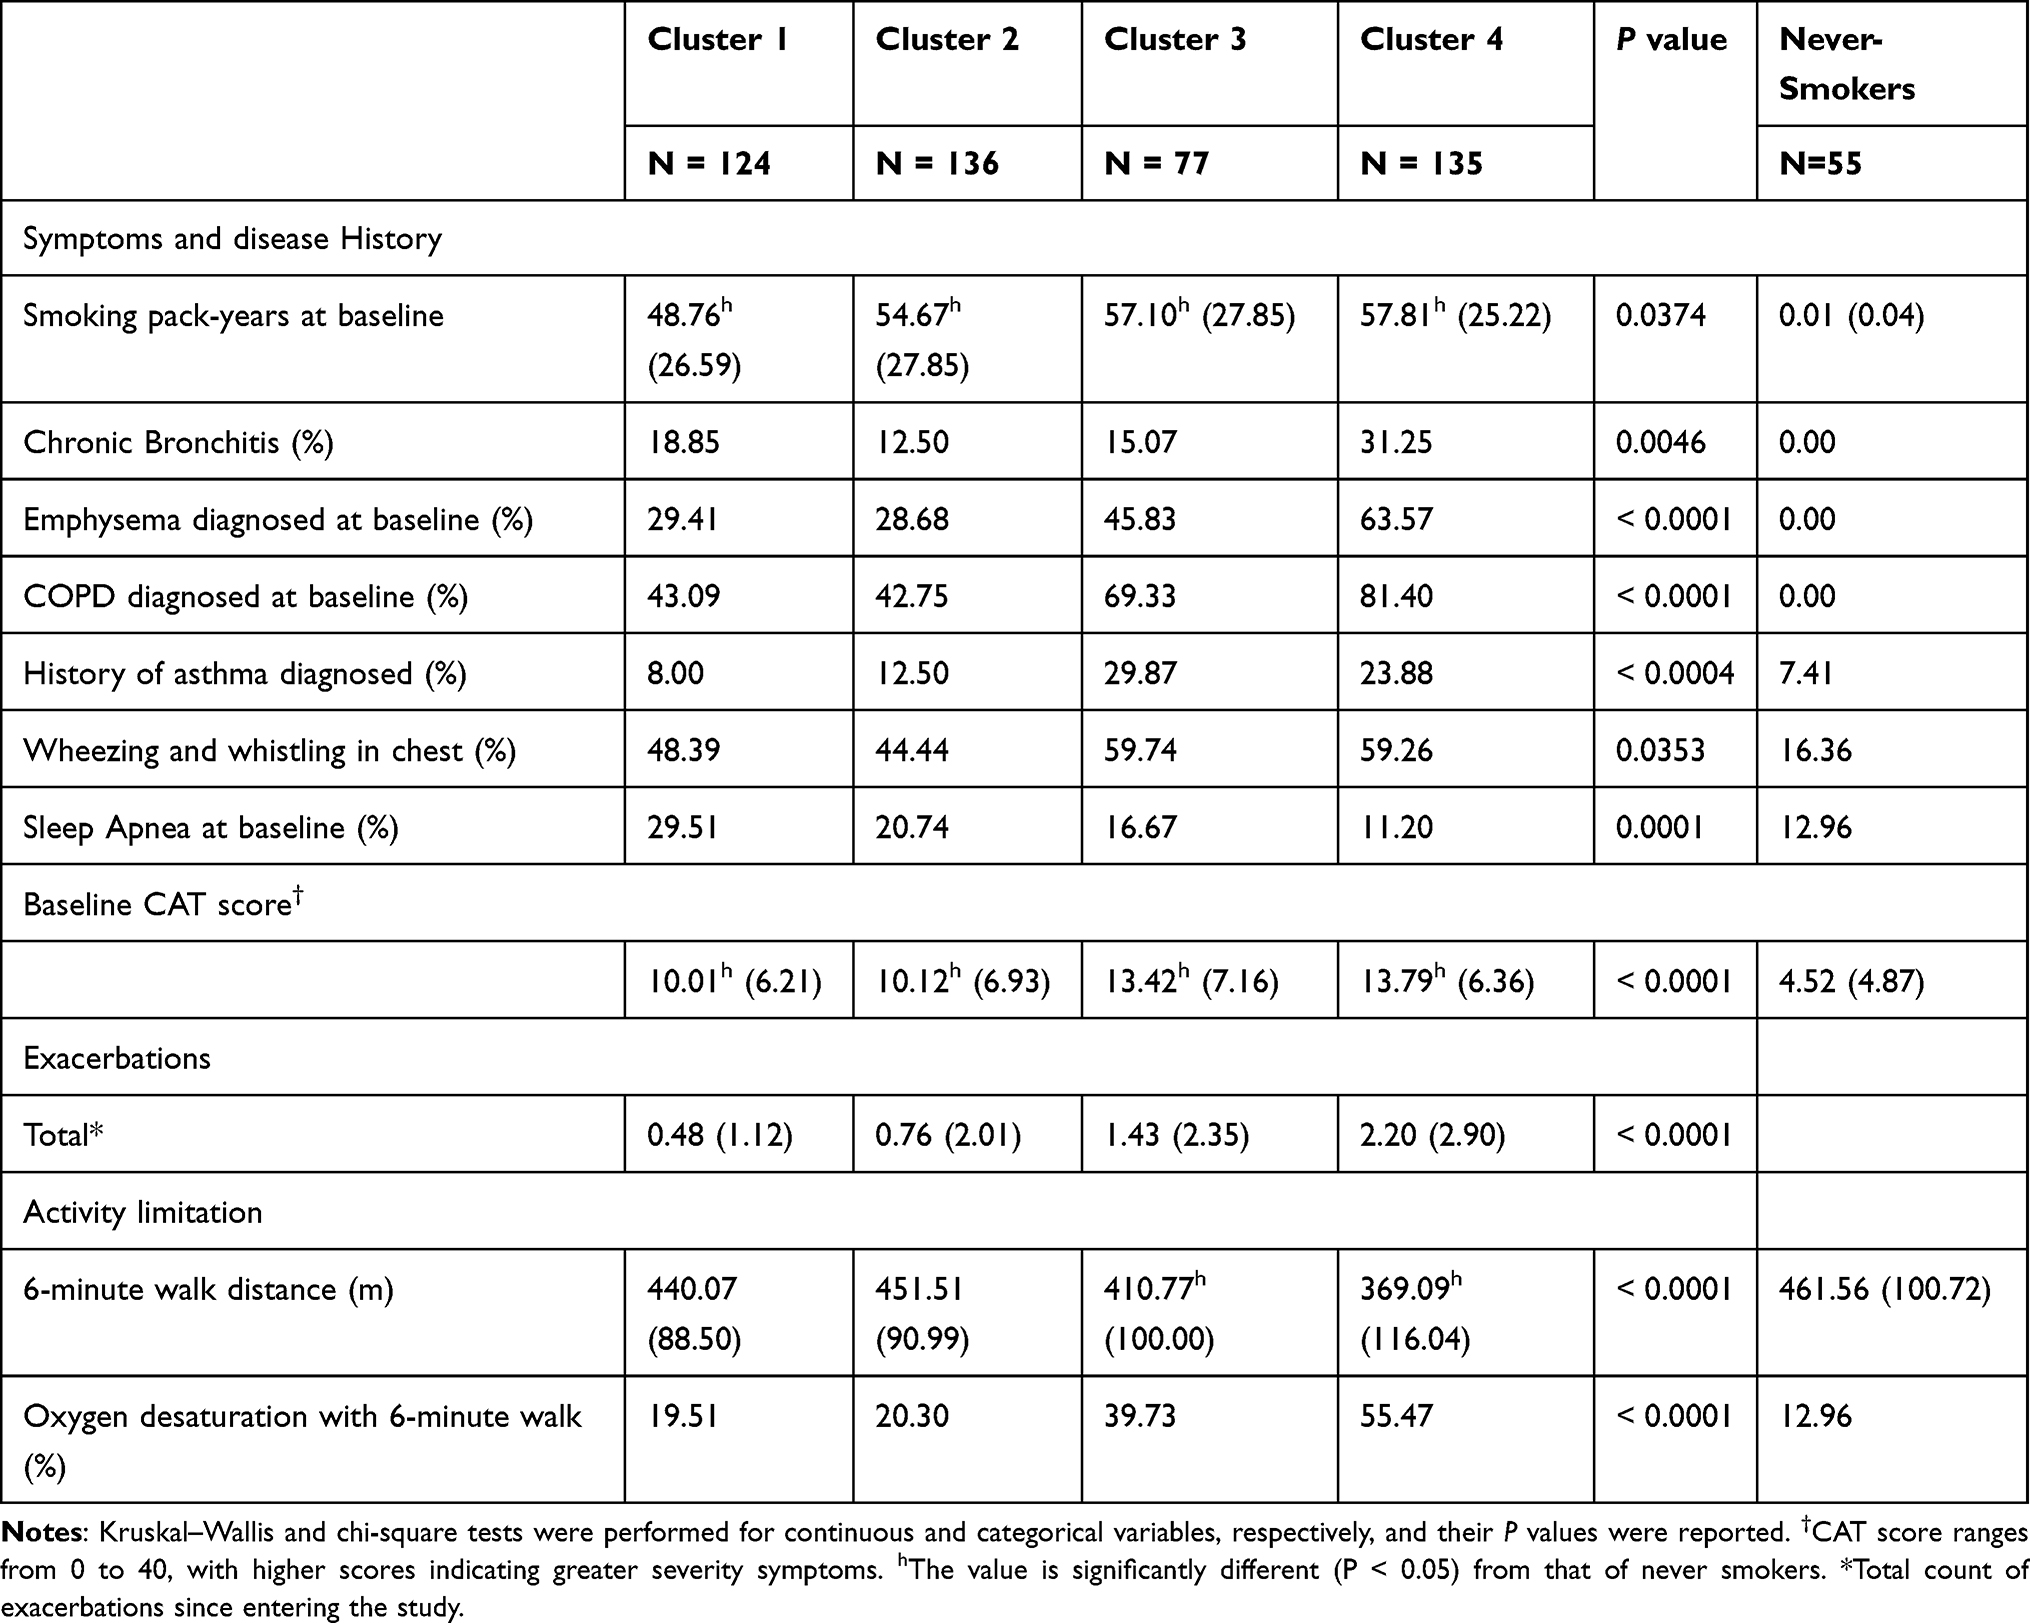 |
Table 8 Associations of Symptoms and Disease Histories with Cluster Membership |
Cluster 1 had the highest BMI (Table 7) compared with other clusters and the healthy control group. A significant difference in BMI between clusters 1 and 2 existed only among patients in GOLD 1 and GOLD 2 (Table S4). Cluster 1 showed a larger portion of patients diagnosed with sleep apnea (Table 8) and CT patterns of ILD (Table S5) compared with other clusters. Specific pulmonary matrix metalloproteinases (MMPs) including MMP-3 and MMP-9 are the lowest in cluster 1 (Table 9). Clusters 1 and 2 were associated with lower WBC, neutrophils, and higher lymphocytes than clusters 3 and 4. Cluster 2 was the only subgroup with a significant increase of lectin-like oxidized low-density-lipoprotein receptor (LOX-1) over one year (Table S6). Clusters 3 and 4 demonstrated shorter six-minute walk distance and more exacerbations since entering the SPIROMICS study than clusters 1 and 2 (Table 8). Other COPD-related biomarkers are found in Table S6.
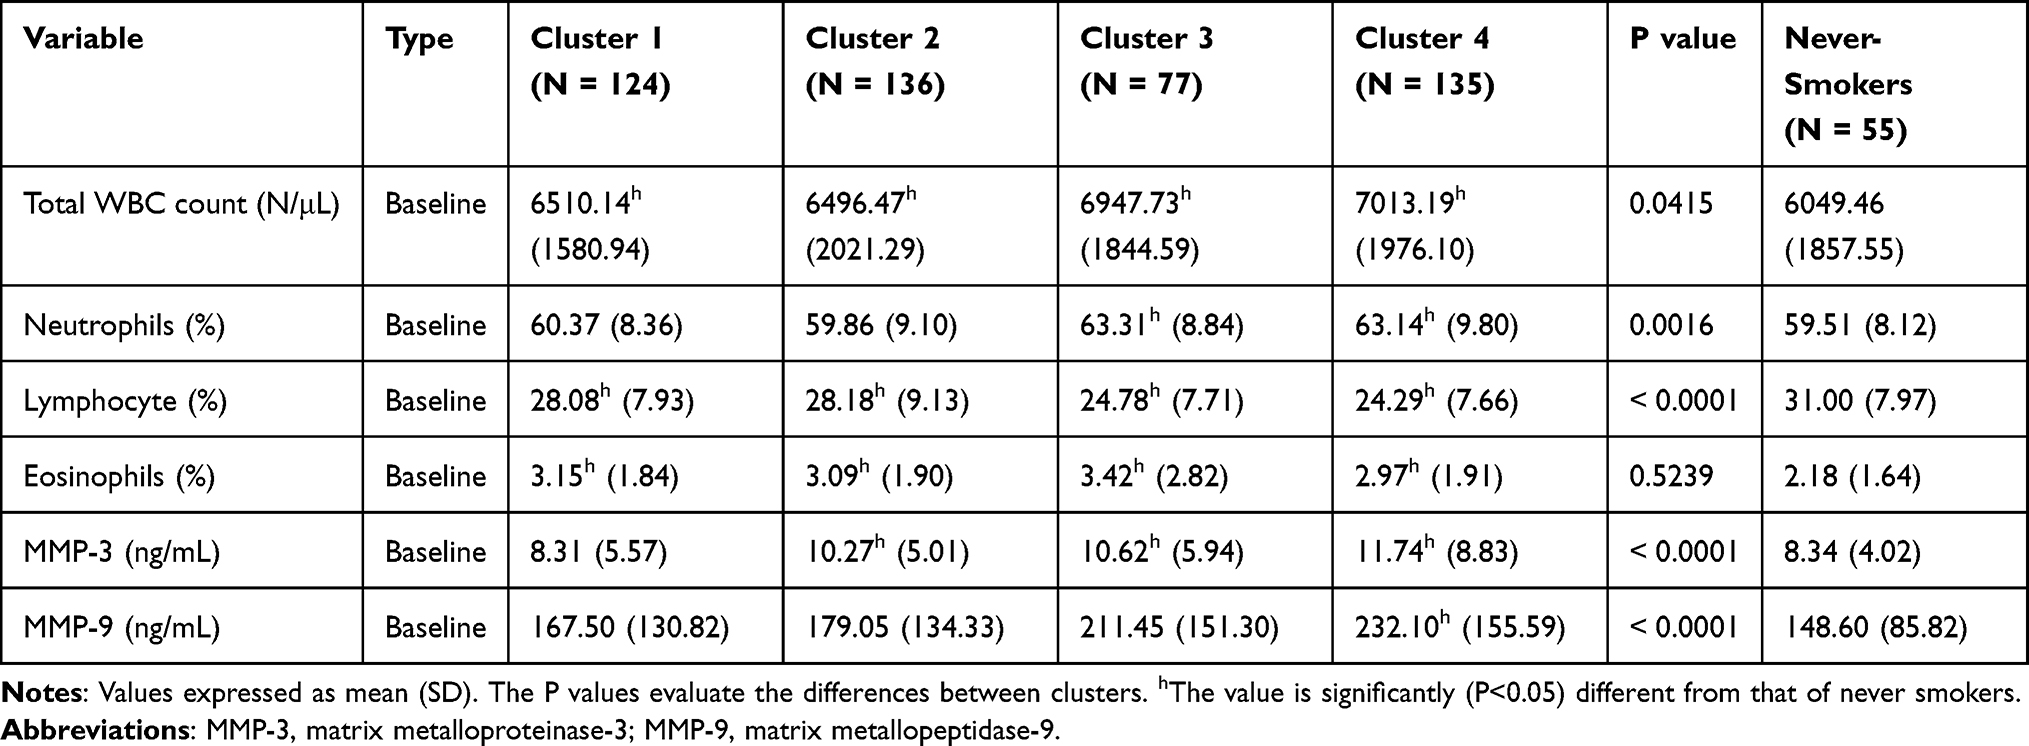 |
Table 9 Biomarkers for Longitudinal Clusters |
We compared the cross-sectional clustering11 with our longitudinal clustering by studying the 269 participants who were in both studies (Supplementary Materials). All the average baseline variables showed bigger inter-cluster difference in cross-sectional clustering than longitudinal clustering. For example, baseline CAT scores in the four cross-sectional clusters were 10.73, 9.36, 10.96, and 17.07, respectively, while baseline CAT scores in the four longitudinal clusters were 10.00, 10.12, 13.42, and 13.79. Moreover, unlike cross-sectional clusters, longitudinal clusters exhibited neither sex nor race dominance (Table 7). We also compared the percentage of eosinophils between longitudinal clusters and cross-sectional clusters (Table S7). The difference between clusters in eosinophils is reduced in longitudinal clusters.
Random Forest Analysis
After performing clustering analysis with 150 qCT imaging-based variables, we developed a simplified predictive model which utilized only a fraction of the original variables for classification with high accuracy. Specifically, we employed random forest as the classification algorithm and took all 150 CT variables as input and the cluster memberships as output to obtain a testing accuracy of 90%. We then built a random forest model with only 23 variables (Table S8) to obtain a similar testing accuracy of 89.47%. Similar techniques were employed in our cross-sectional study.8,10
Discussion
In this study, we aimed to identify functionally meaningful former-smoker longitudinal clusters (progression subtypes) using qCT imaging-based variables acquired at baseline and 1-year follow-up visits. The rationale behind qCT phenotyping is its sensitivity to capture any alteration over a short period of about one year for early detection of any abnormality before reflecting on spirometry. We analyzed former smokers independently of current smokers because smoking status may have a significant effect on lung density, and cessation of smoking can be deemed as an effective intervention,35 resulting in different progression patterns. Four longitudinal clusters with distinct characteristics were identified. Cluster 1 was a subgroup at an early stage of COPD with a high BMI (> 30, obese) and fSAD% and Emph% rapid progression. Cluster 2 was characterized by airway narrowing and fSAD% and Emph% attenuation. Cluster 3 had relatively high fSAD and emphysema at baseline and was characterized with fSAD% attenuation and rapid Emph% progression. Cluster 4 was severe emphysema and fSAD individuals with severe structural alterations.
Features of Respective Clusters
Cluster 1: A Subgroup at an Early Stage of COPD with High BMI (>30, Obese) and fSAD% and Emph% Rapid Progression
Cluster 1 is the most obese subgroup at an early stage of COPD characterized by the rapid progression of fSAD and emphysema, especially in the upper and middle lobes, with no significant alterations of airway structure. The potential association between obesity and COPD is increasingly recognized.36,37 Obesity has a paradoxical influence on COPD at different GOLD stages. It can act as a protective factor for obese patients with GOLD stage 3–4 and it can also increase the relative risk for mortality in those with GOLD stage 1–2.36 A significant difference in BMI at baseline between clusters 1 and 2 was observed only in GOLD 1 and GOLD 2 patients and hence, the obesity may increase the risk for these patients in cluster 1. The largest proportion of patients with sleep apnea in cluster 1 may support the observation that obesity is a well-recognized risk factor for sleep apnea.37 In addition, the largest proportion of patients with CT patterns of ILD observed in cluster 1 may indicate that CT patterns of ILD was associated with less amount of emphysema. MMP-3 and MMP-9 are known to cause morphological changes in the lungs and contribute significantly to the COPD state.38 The lowest MMP-3 and MMP-9 in cluster 1 also suggested the lowest emphysema among all clusters.
Cluster 2: A Subgroup with Airway Narrowing and fSAD% and Emph% Attenuation
Cluster 2 is a subgroup characterized by fSAD% and Emph% attenuation. The decreased fSAD% and Emph% over one year could be caused by less air in the lung at RV and TLC, respectively. Hence, the observed decrease in TLC over one year (P<0.05) may contribute to the decrease of Emph% since Emph% was measured at TLC. However, we did not observe significantly decreased RV (P>0.05) over one year in cluster 2. Thus, the decreased fSAD% cannot be explained by lung volumes changes. An anti-inflammatory effect of smoking cessation may yield a paradoxical fall of lung density, while inflammation can mask the presence of emphysema.35 LOX-1 acts as a pro-inflammatory factor in vascular disease and is viewed as a vascular disease biomarker.39 The decreased Emph%, the increased  and the elevated LOX-1 level suggested inflammatory responses in cluster 2 over one year. Cluster 2 may be regarded as a subgroup of patients non-susceptible to emphysema development due to the decreased Emph%. In recent studies on lung perfusion scans, Alford et al found that hypoxic pulmonary vasoconstriction (HPV) is blocked in the presence of inflammation in non-susceptible smokers to emphysema development and the nonsusceptibility was shown to be associated with less heterogeneity in pulmonary blood flow perfusion than emphysema-susceptible subjects.5 In this study, perfusion scans and dual energy CT scans were not acquired for the subjects. Thus, the emphysema-nonsusceptibility of cluster 2 in relation to regional pulmonary vascular function requires further investigation.
Cluster 2 was also characterized by large airway narrowing and reduced FEV1%predicted (or FEV1) over one year. These characteristics are indicative of the large airway hyper-responsiveness in cluster 2 – a disease mechanism different from those associated with clusters 1 and 3.40 In addition, Dh* was reported to be significantly correlated with FVC%predicted and FEV1%predicted (or FEV1).9,13 The significant airway narrowing in cluster 2 might explain the highest FEV1 decline over one year among all clusters. Since the change of Dh* was not correlated with the change of TLC over one year, the observed airway narrowing might not be caused by the TLC change.
Cluster 3: A Subgroup with Relatively High fSAD and Emphysema at Baseline and Characterized with fSAD% Attenuation and Rapid Emph% Progression
The decreased fSAD% and the change of fSAD into emphysema in cluster 3 suggested the destruction of small airways, leading to the development of emphysema. This supports the notion that small airway disease is a pathological feature of patients with mild and moderate COPD before emphysematous destruction.41 Though clusters 2 and 3 had most subjects at early GOLD stages, they exhibited significantly different emphysema progression patterns. Cluster 2 represented an emphysema-non-susceptible subgroup of patients, while cluster 3 was an emphysema-susceptible subgroup. Thus, subjects at early stages of COPD may follow different disease trajectories, although cluster 3 might be at a more severe stages than cluster 2. Namely, the susceptibility to emphysema in subjects may also depend on the disease severity.
Cluster 4: Severe Emphysema and fSAD Individuals with Severe Structural Alterations
Cluster 4 is a subgroup with the most severe COPD. The significant increase in fRPs and eRPs suggested that this subgroup is characterized by a mixture of fSAD and emphysema, and the change in fSAD can also serve as an important indicator of disease progression in addition to emphysema development.3 Significant structural alterations in cluster 4 indicated that severe COPD altered airway geometry significantly. The decreased Dh* in clusters 3 and 4 suggested that airway narrowing not only happened in small airways42 but also in large airways, which might further contribute to the decline of lung function by increasing the airway resistance. In addition to airway narrowing, geometry changes for central airways will ensue, including decreased WT* and Cr for severe COPD.
The lowest BMI and shorter 6-minute walk distance in cluster 4 suggested the increased risk of mortality at severe COPD stages.36,43 The severity of COPD in cluster 4 was also reflected on biomarkers such as higher WBC count, neutrophils, MMP-9 and lower lymphocytes than clusters 1 and 2.
Expanding Prior Knowledge
In general, COPD heterogeneity can be characterized as emphysema-predominant and airway-predominant disease.44,45 In their cross-sectional study, Castaldi et al identified four clusters from the COPDGene cohort.46 Their airway disease-predominant cluster was characterized by thicker airway walls and the lowest average emphysema, resembling those of the cross-sectional imaging cluster 1 identified by Haghighi et al11 (our previous clustering analysis using baseline data only). In this longitudinal study, cluster 2 exhibited the feature of airway narrowing with non-susceptible to emphysema development and the highest rate of FEV1 decline. Airway narrowing is indicative of large airway hyper-responsiveness – a disease mechanism different from those associated with clusters 1 and 3. While more research is needed to better understand the longitudinal cluster 2, the results obtained from both previous cross-sectional studies and the current longitudinal study suggested that cluster 2 in this study may be a subtype under the general classification of airway-predominant disease. This may also explain why cluster 2 is a relatively stable cluster in terms of fSAD% and Emph% progression because cluster 2 does not belong to emphysema-predominant disease.
Celli et al established the correlation between the frequency of exacerbation and the rate of decline in FEV1 in patients with moderate or severe COPD (GOLD stages 2 and 3).47 In this study, clusters 3 and 4 had more patients at GOLD stages 2 and 3. Cluster 4 had more exacerbation frequencies and higher rates of decline in FEV1 than cluster 3, being consistent with Celli et al Additionally, their study showed that the rate of decline in FEV1 for former smokers was −36.6 mL/year, being comparable to to −31.12 mL/year for our cluster 4. As for clusters 1 and 2, patients were predominantly at risk or mild with GOLD stages 0 and 1 (Table 7). qCT phenotyping was able to identify progression subtypes at early stages which were characterized by high rates of decline in FEV1 over a short period. This implies that short-term imaging-based progression phenotypes may provide new insights for subclinical pathophysiology.
We compared the eosinophils (%) between longitudinal clusters and cross-sectional clusters. The reduced difference between clusters in longitudinal clusters suggests that subtyping based on the rates of progression depends less on eosinophils (%). Likewise, longitudinal clusters exhibited neither sex nor race dominance, in contrast to cross-sectional clusters. This implies that eosinophils (%) might serve as a biomarker for disease severity, but not for disease progression. Additionally, there existed a linear relationship between exacerbation rates and airway inflammation when eosinophils count reached a threshold value of 300 N/μL.48,49 However, the eosinophils counts for the four cluster did not reach this threshold value (205.07, 200.74, 237.61, and 208.29 N//μL for cluster 1, 2, 3, and 4, respectively). This may explain the weak correlation between eosinophils (%) and exacerbation rates.
In summary, each cluster showed a unique progression pattern. The imaging-based variables were previously employed in cross-sectional cluster analysis and these variables were found to be a sensitive means of differentiating subgroups in COPD and asthma cohorts.8,10,11 However, cross-sectional clustering was based on static disease stage and did not consider disease progression. The evidence has shown that the disease progression depends on the subject’s current stage and even at the same disease stage the progression patterns may differ.3 Comparatively, longitudinal clustering aims to identify COPD progression clusters, which are more dependent upon disease progression than severity. The clinical implication is that there could be rapid progressors and relatively stable patients at all levels of severity. Thus, staging a trial to alter natural history (progression)50–52 should not be stratified by severity, but rather by parameters that will relate to progression cluster. Another potential application of imaging clusters is to bridge the gap between individual and population-based studies. In clinical practice, we can focus on a subset of patients with unique structural and functional alterations (clusters). New subjects can be assigned cluster memberships using a simplified model such as the random forest.8 In conjunction with computational fluid dynamics (CFD) lung models, the cluster information allows exploring the notion of a cluster-guided approach to predict deposition of inhaled drug aerosols using CFD and improve the efficacy of drug delivery in cluster subjects towards personalized therapeutic decisions.53,54
Conclusion
We performed a longitudinal clustering analysis of the former smoker cohort and derived four stable clusters based on baseline imaging-derived variables and their progression information. The four clusters were characterized by a combination of their baseline disease severity and disease progression patterns. Progression information may result in a refinement of cross-sectional clusters. The current study allows grouping of COPD subjects with similar imaging-based structural, functional changes, and clinical characteristics bridging the gap between individual and population-based studies. Deep learning based tissue-pattern phenotypes can be further combined with qCT imaging-based variable for subtyping.55 Identification of longitudinal COPD subgroups may help us understand the path of disease progression and provide prognostic information to help determine more appropriate, patient-oriented therapies.
Abbreviations
ADI, anisotropic deformation index; BMI, body mass index; BronInt, right intermediate bronchus; CAT, COPD Assessment Test; Cr, airway luminal circularity; CT, computed tomography; Dh, hydraulic luminal diameter; Dh*, normalized hydraulic luminal diameter; Emph%, emphysema percentage; eRP, rapid-progressor of emphysema; FEV1, forced expiratory volume in one second; fRP, rapid-progressor of fSAD; fSAD, functional small airway disease percentage; FVC, forced vital capacity; ILD, interstitial lung disease; Jacobian, determinant of Jacobian matrix; LLL, left lower lobe; LMB, left main bronchus; LUL, left upper lobe; MMP, matrix metalloprotease; PC, principal component; PCA, principal component analysis; PFT, pulmonary functional test; qCT, quantitative computed tomography; RLL, right lower lobe; RMB, right main bronchus, RML, right middle lobe; RUL, right upper lobe; RV, residual volume; sLLL, subgrouped left lower lobe with branches of LB6, and LB8 to LB10; sLUL, subgrouped left upper lobe with branches of LB1 to LB5; SPIROMICS, subpopulations and intermediate outcome measures in COPD study; sRLL, subgrouped right lower lobe with branches of RB6 to RB10; sRML, subgrouped right middle lobe with branches of RB4 to RB5; sRUL, subgrouped right upper lobe with branches of RB1 to RB3; TLC, total lung capacity; TriLLB, trifurcation of left lower lobe; U/(M+L)|v, the ratio of air volume changes in upper lobes to those in middle and lower lobes; WBC, white blood cell; WT, airway wall thickness;  , tissue fraction at TLC;
  , tissue fraction at RV; θ, bifurcation angle between two daughter branches; ΔVairF, lobar fraction of air volume change between TLC and RV.
Ethics Approval and Informed Consent
All methods followed the relevant guidelines and regulations. The SPIROMICS protocol was approved by the institutional review boards of all participating institutions (Columbia University IRB 2, University of Iowa IRB-01, Johns Hopkins IRB-5, University of California Los Angeles Medical IRB 1, University of Michigan IRBMED B1 Board, National Jewish Health IRB, University of California San Francisco IRB Parnassus Panel, Temple University IRB A2, University of Alabama at Birmingham IRB #2, University of Illinois IRB #3, University of Utah IRB Panel Review Board 5, Wake Forest University IRB #5, University of North Carolina at Chapel Hill Non-Biomedical IRB). Written informed consent was obtained from all participants prior to the study.
This study was conducted in accordance with the Declaration of Helsinki.
Consent for Publication
The paper was approved by SPIROMICS publications and presentation committee.
Acknowledgments
The authors thank the SPIROMICS participants and participating physicians, investigators and staff for making this research possible. More information about the study and how to access SPIROMICS data is at www.spiromics.org. We would like to acknowledge the following current and former investigators of the SPIROMICS sites and reading centers: Neil E Alexis, MD; Wayne H Anderson, PhD; Mehrdad Arjomandi, MD; Igor Barjaktarevic, MD, PhD; R Graham Barr, MD, DrPH; Lori A Bateman, MSc; Surya P Bhatt, MD; Eugene R Bleecker, MD; Richard C Boucher, MD; Russell P Bowler, MD, PhD; Stephanie A Christenson, MD; Alejandro P Comellas, MD; Christopher B Cooper, MD, PhD; David J Couper, PhD; Gerard J Criner, MD; Ronald G Crystal, MD; Jeffrey L Curtis, MD; Claire M Doerschuk, MD; Mark T Dransfield, MD; Brad Drummond, MD; Christine M Freeman, PhD; Craig Galban, PhD; MeiLan K Han, MD, MS; Nadia N Hansel, MD, MPH; Annette T Hastie, PhD; Eric A Hoffman, PhD; Yvonne Huang, MD; Robert J Kaner, MD; Richard E Kanner, MD; Eric C Kleerup, MD; Jerry A Krishnan, MD, PhD; Lisa M LaVange, PhD; Stephen C Lazarus, MD; Fernando J Martinez, MD, MS; Deborah A Meyers, PhD; Wendy C Moore, MD; John D Newell Jr, MD; Robert Paine, III, MD; Laura Paulin, MD, MHS; Stephen P Peters, MD, PhD; Cheryl Pirozzi, MD; Nirupama Putcha, MD, MHS; Elizabeth C Oelsner, MD, MPH; Wanda K O’Neal, PhD; Victor E Ortega, MD, PhD; Sanjeev Raman, MBBS, MD; Stephen I. Rennard, MD; Donald P Tashkin, MD; J Michael Wells, MD; Robert A Wise, MD; and Prescott G Woodruff, MD, MPH. The project officers from the Lung Division of the National Heart, Lung, and Blood Institute were Lisa Postow, PhD, and Lisa Viviano, BSN; SPIROMICS was supported by contracts from the NIH/NHLBI (HHSN268200900013C, HHSN268200900014C, HHSN268200900015C, HHSN268200900016C, HHSN268200900017C, HHSN268200900018C, HHSN268200900019C, HHSN268200900020C), grants from the NIH/NHLBI (U01 HL137880 and U24 HL141762), and supplemented by contributions made through the Foundation for the NIH and the COPD Foundation from AstraZeneca/MedImmune; Bayer; Bellerophon Therapeutics; Boehringer-Ingelheim Pharmaceuticals, Inc.; Chiesi Farmaceutici S.p.A.; Forest Research Institute, Inc.; GlaxoSmithKline; Grifols Therapeutics, Inc.; Ikaria, Inc.; Novartis Pharmaceuticals Corporation; Nycomed GmbH; ProterixBio; Regeneron Pharmaceuticals, Inc.; Sanofi; Sunovion; Takeda Pharmaceutical Company; and Theravance Biopharma and Mylan.
Author Contributions
All authors made substantial contributions to conception and design, acquisition of data, or analysis and interpretation of data; took part in drafting the article or revising it critically for important intellectual content; agreed to submit to the current journal; gave final approval for the version to be published; and agreed to be accountable for all aspects of the work.
Funding
Supports for this study were provided, in part, by NIH grants U01-HL114494, R01-HL112986 and S10-RR022421, T32-HL-144461 and by Basic Science Research Program through the National Research Foundation of Korea (NRF) funded by the Ministry of Education (NRF-2017R1D1A1B03034157) and by the Korea Ministry of Environment (MOE) as the Environmental Health Action Program (RE201806039).
Disclosure
Prof. Dr. Jiwoong Choi reported grants from Korea Environmental and Industrial Technology Institute, during the conduct of the study;
Prof. Dr. Alejandro P Comellas reported grants from NIH, personal fees from GSK, personal fees from Astra Zeneca, outside the submitted work;
Prof. Dr. John D Newell Jnr reported grants from NIH, personal fees, non-financial support, Paid Consultant Medical Advisor Shared Patent Holder Travel Expenses Honoraria from VIDA, Writing Book on Lung CT AI from Elsevier, during the conduct of the study; personal fees, non-financial support, Medical Advisor Paid Consultant Shared Patent Holder Travel Expenses Honoraria from VIDA, outside the submitted work; In addition, Prof. Dr. John D Newell Jnr has a patent VIDA issued, a patent Elsevier licensed;
Prof. Dr. R Graham Barr reported grants from NIH, grants from COPD Foundation, during the conduct of the study; grants from NIH, outside the submitted work;
Prof. Dr. Eugene Bleecker reported personal fees from AstraZeneca, personal fees MedImmune, personal fees from Boehringer Ingelheim, personal fees from Genentech, personal fees from Novartis, personal fees from Regeneron, personal fees from Sanofi Genzyme, personal fees from ALK-Abello, personal fees from Glaxo Smith Kline, personal fees from TEVA, outside the submitted work;
Professor Christopher B Cooper reported personal fees from MGC Diagnostics, Chair, Clinical Events Committee from NUVAIRA, Global Medical Expert from GlaxoSmithKline, Chair, Clinical Events Committee from PulmonX, outside the submitted work;
Prof. Dr. David Couper reported grants from NHLBI, grants from COPD Foundation, during the conduct of the study;
Prof. Dr. Meilan Han reported personal fees from GSK, BI, AZ, Verona, Teva, Merck, grants from Sunovion, supply of study drug for clinical trial from Novartis, grants, personal fees from Sanofi, outside the submitted work;
Prof. Dr. Nadia N Hansel reported grants, personal fees from AstraZeneca, personal fees from Mylan, grants from NIH, grants from COPD Foundation, grants, personal fees from GSK, grants, personal fees from Boehringer Ingelheim, during the conduct of the study;
Prof. Dr. Eric C Kleerup reported grants from NIH, and Foundation for the NHLBI, non-financial support from GlaxoSmithKline, Supplied inhalers for PFT testing from Boehringer Ingelheim, during the conduct of the study;
Prof. Dr. Fernando J Martinez reported grants, personal fees, non-financial support from AstraZeneca, Teleconference from Bayer, grants, personal fees, non-financial support from Boehringer Ingelheim, Advisory Board and Steering Committee from Chiesi, Advisory Board from Gala, grants, personal fees from GlaxoSmithKline, non-financial support from Novartis, non-financial support from Sanofi/Regeneron, Advisory Board from Sunovion, Teva, and Verona, during the conduct of the study;
Prof. Dr. Robert Paine III reported grants from NHLBI, COPD Foundation, during the conduct of the study; grants from Department of Veterans Affairs, personal fees from Partner Therapeutics, outside the submitted work;
Prof. Dr. Stephen I Rennard reported SR and was an employee of AstraZeneca from 2015 to 2019 and owns shares received as part of his compensation, personal fees from Bergenbio, Consultant from Verona Pharma, Consultant from NovoVentures, Consultant from GSK, outside the submitted work;
Dr. Benjamin M Smith reported grants from NIH, during the conduct of the study; grants from CIHR, outside the submitted work;
Prof. Dr. Prescott G Woodruff reported grants from NIH, COPD Foundation, during the conduct of the study; personal fees from Sanofi, Consulting from Regeneron, Consulting from Glenmark Pharmaceuticals, Consulting from Theravance, Consulting from GSK, Consulting from NGM Pharma, outside the submitted work;
Prof. Dr. Eirc A Hoffman reported grants from NIH, during the conduct of the study; Founder and Shareholder from VIDA Diagnostics, outside the submitted work;
The authors reported no other conflicts of interest in this work.
References
1. Rabe KF, Watz H. Chronic obstructive pulmonary disease. The Lancet. 2017;389(10082):1931–1940. doi:10.1016/S0140-6736(17)31222-9
2. Quaderi SA, Hurst JR. The unmet global burden of COPD. Glob Health Epidemiol Genomics. 2018;3(3). doi:10.1017/gheg.2018.1
3. Galbán CJ, Han MK, Boes JL, et al. Computed tomography–based biomarker provides unique signature for diagnosis of COPD phenotypes and disease progression. Nat Med. 2012;18(11):1711–1715. doi:10.1038/nm.2971
4. Friedlander AL, Lynch D, Dyar LA, Bowler RP. Phenotypes of Chronic Obstructive Pulmonary Disease. J Chronic Obstr Pulm Dis. 2007;4(4):355–384. doi:10.1080/15412550701629663
5. Alford SK, van Beek EJR, McLennan G, Hoffman EA. Heterogeneity of pulmonary perfusion as a mechanistic image-based phenotype in emphysema susceptible smokers. Proc Natl Acad Sci. 2010;107(16):7485–7490. doi:10.1073/pnas.0913880107
6. Iyer KS, Newell JD, Jin D, et al. Quantitative dual-energy computed tomography supports a vascular etiology of smoking-induced inflammatory lung disease. Am J Respir Crit Care Med. 2016;193(6):652–661. doi:10.1164/rccm.201506-1196OC
7. Smith BM, Traboulsi H, Austin JHM, et al. Human airway branch variation and chronic obstructive pulmonary disease. Proc Natl Acad Sci. 2018;115(5):E974–81. doi:10.1073/pnas.1715564115
8. Choi S, Hoffman EA, Wenzel SE, et al. Quantitative computed tomographic imaging–based clustering differentiates asthmatic subgroups with distinctive clinical phenotypes. J Allergy Clin Immunol. 2017;140(3):690–700. doi:10.1016/j.jaci.2016.11.053
9. Choi S, Haghighi B, Choi J, et al. Differentiation of quantitative CT imaging phenotypes in asthma versus COPD. BMJ Open Respir Res. 2017;4(1):e000252. doi:10.1136/bmjresp-2017-000252
10. Haghighi B, Choi S, Hoffman EA, et al. Imaging-based clusters in current smokers of the COPD cohort associate with clinical characteristics: the subpopulations and intermediate outcome measures in COPD Study. Respir Res. 2018;19(1):178. doi:10.1186/s12931-018-0888-7
11. Haghighi B, Choi S, Choi J, et al. Imaging-based clusters in former smokers of the COPD cohort associate with clinical characteristics: the SubPopulations and intermediate outcome measures in COPD study (SPIROMICS). Respir Res. 2019;20(1). doi:10.1186/s12931-019-1121-z.
12. Choi S, Hoffman EA, Wenzel SE, Castro M, Lin C-L. Improved CT-based estimate of pulmonary gas trapping accounting for scanner and lung-volume variations in a multicenter asthmatic study. J Appl Physiol. 2014;117(6):593–603. doi:10.1152/japplphysiol.00280.2014
13. Choi S, Hoffman EA, Wenzel SE, et al. Quantitative assessment of multiscale structural and functional alterations in asthmatic populations. J Appl Physiol. 2015;118(10):1286–1298. doi:10.1152/japplphysiol.01094.2014
14. Couper D, LaVange LM, Han M, et al. Design of the Subpopulations and Intermediate Outcomes in COPD Study (SPIROMICS). Thorax. 2014;69(5):492–495.
15. Sieren JP, Newell JD, Barr RG, et al. SPIROMICS protocol for multicenter quantitative computed tomography to phenotype the lungs. Am J Respir Crit Care Med. 2016;194(7):794–806. doi:10.1164/rccm.201506-1208PP
16. Yin Y, Hoffman EA, Lin C-L. Mass preserving nonrigid registration of CT lung images using cubic B-spline: mass preserving nonrigid registration of CT lung images. Med Phys. 2009;36(9Part1):4213–4222. doi:10.1118/1.3193526
17. Haghighi B, D. ellingwood N, Yin Y, Hoffman EA, Lin C-L. A GPU-based symmetric non-rigid image registration method in human lung. Med Biol Eng Comput. 2018;56(3):355–371. doi:10.1007/s11517-017-1690-2
18. Choi J, Hoffman EA, Lin C-L, et al. Quantitative computed tomography determined regional lung mechanics in normal nonsmokers, normal smokers and metastatic sarcoma subjects. PLoS One. 2017;12(7).
19. Onoe R, Yamashiro T, Handa H, et al. 3D-measurement of tracheobronchial angles on inspiratory and expiratory chest CT in COPD: respiratory changes and correlation with airflow limitation. Int J Chron Obstruct Pulmon Dis. 2018;13:2399–2407. doi:10.2147/COPD.S165824
20. Vasilescu DM, Martinez FJ, Marchetti N, et al. Noninvasive imaging biomarker identifies small airway damage in severe chronic obstructive pulmonary disease. Am J Respir Crit Care Med. 2019;200(5):575–581. doi:10.1164/rccm.201811-2083OC
21. Herth FJF, Kirby M, Sieren J, et al. The modern art of reading computed tomography images of the lungs: quantitative CT. Respiration. 2018;95(1):8–17. doi:10.1159/000480435
22. Johannessen A, Skorge TD, Bottai M, et al. Mortality by level of emphysema and airway wall thickness. Am J Respir Crit Care Med. 2013;187(6):602–608. doi:10.1164/rccm.201209-1722OC
23. Dournes G, Laurent F, Coste F, et al. Computed tomographic measurement of airway remodeling and emphysema in advanced chronic obstructive pulmonary disease. correlation with pulmonary hypertension. Am J Respir Crit Care Med. 2015;191(1):63–70. doi:10.1164/rccm.201408-1423OC
24. Kaminsky DA. What does airway resistance tell us about lung function? Respir Care. 2012;57(1):85–99. doi:10.4187/respcare.01411
25. Kaczka DW, Ingenito EP, Suki B, Lutchen KR. Partitioning airway and lung tissue resistances in humans: effects of bronchoconstriction. J Appl Physiol. 1997;82(5):1531–1541. doi:10.1152/jappl.1997.82.5.1531
26. Amelon R, Cao K, Ding K, et al. Three-dimensional characterization of regional lung deformation. J Biomech. 2011;44(13):2489–2495. doi:10.1016/j.jbiomech.2011.06.009
27. Courtney MGR. Determining the number of factors to retain in EFA: using the SPSS R-menu v2.0 to make more judicious estimations. Pract Assess Res Eval. 18(1):8.
28. Brock G, Pihur V, Datta S, Datta S. clValid: an R package for cluster validation. J Stat Softw. 2008;25(4). doi:10.18637/jss.v025.i04
29. Hennig C. Cluster-wise assessment of cluster stability. Comput Stat Data Anal. 2007;52(1):258–271. doi:10.1016/j.csda.2006.11.025
30. Benjamini Y, Hochberg Y. Controlling the false discovery rate: a practical and powerful approach to multiple testing. J R Stat Soc Ser B Methodol. 1995;57(1):289–300.
31. Todorov V. Robust selection of variables in linear discriminant analysis. Stat Methods Appl. 2007;15(3):395–407. doi:10.1007/s10260-006-0032-6
32. Mohamed Hoesein FA, Zanen P, de Jong PA, et al. Rate of progression of CT-quantified emphysema in male current and ex-smokers: a follow-up study. Respir Res. 2013;14(1):55. doi:10.1186/1465-9921-14-55
33. Dougherty T, Iyer KS, Jin D, et al. Total pulmonary vascular volume and one year progression of CT-assessed emphysema in the SPIROMICS cohort. Am Thorac Soc. 2015;A2436–A2436.
34. Ghobadi H, Ahari SS, Kameli A, Lari M. The relationship between COPD assessment test (CAT) scores and severity of airflow obstruction in stable COPD patients. Tanaffos. 2012;11(2):22.
35. Shaker SB, Stavngaard T, Laursen LC, Stoel BC, Dirksen A. Rapid fall in lung density following smoking cessation in COPD. COPD J Chronic Obstr Pulm Dis. 2011;8(1):2–7. doi:10.3109/15412555.2010.541306
36. Franssen FME, O’Donnell DE, Goossens GH, Blaak EE, Schols AMWJ. Obesity and the lung: 5·obesity and COPD. Thorax. 2008;63(12):1110–1117. doi:10.1136/thx.2007.086827
37. Poulain M, Doucet M, Major GC, et al. The effect of obesity on chronic respiratory diseases: pathophysiology and therapeutic strategies. Can Med Assoc J. 2006;174(9):1293–1299. doi:10.1503/cmaj.051299
38. Srivastava PK, Dastidar SG, Ray A. Chronic obstructive pulmonary disease: role of matrix metalloproteases and future challenges of drug therapy. Expert Opin Investig Drugs. 2007;16(7):1069–1078. doi:10.1517/13543784.16.7.1069
39. Dunn S, Vohra RS, Murphy JE, et al. The lectin-like oxidized low-density-lipoprotein receptor: a pro-inflammatory factor in vascular disease. Biochem J. 2008;409(2):349–355. doi:10.1042/BJ20071196
40. Postma DS, Kerstjens HAM. Characteristics of airway hyperresponsiveness in asthma and Chronic Obstructive Pulmonary Disease. Am J Respir Crit Care Med. 1998;158(supplement_2):S187–92. doi:10.1164/ajrccm.158.supplement_2.13tac170
41. Koo H-K, Vasilescu DM, Booth S, et al. Small airways disease in mild and moderate chronic obstructive pulmonary disease: a cross-sectional study. Lancet Respir Med. 2018;6(8):591–602. doi:10.1016/S2213-2600(18)30196-6
42. Hogg JC, McDonough JE, Suzuki M. Small airway obstruction in COPD. Chest. 2013;143(5):1436–1443. doi:10.1378/chest.12-1766
43. Celli B, Tetzlaff K, Criner G, et al. The 6-minute-walk distance test as a chronic obstructive pulmonary disease stratification tool. Insights from the COPD biomarker qualification consortium. Am J Respir Crit Care Med. 2016;194(12):1483–1493. doi:10.1164/rccm.201508-1653OC
44. Burrows B, Niden AH, Fletcher CM, Jones NL. CLINICAL TYPES OF CHRONIC OBSTRUCTIVE LUNG DISEASE IN LONDON AND IN CHICAGO. A STUDY OF ONE HUNDRED PATIENTS. Am Rev Respir Dis. 1964;90:14–27.
45. Burrows B, Fletcher CM, Heard BE, Jones NL, Wootliff JS. The emphysematous and bronchial types of chronic airways obstruction. A clinicopathological study of patients in London and Chicago. Lancet Lond Engl. 1966;1(7442):830–835. doi:10.1016/S0140-6736(66)90181-4
46. Castaldi PJ, Dy J, Ross J, et al. Cluster analysis in the COPDGene study identifies subtypes of smokers with distinct patterns of airway disease and emphysema. Thorax. 2014;69(5):415–422. doi:10.1136/thoraxjnl-2013-203601
47. Celli BR, Thomas NE, Anderson JA, et al. Effect of pharmacotherapy on rate of decline of lung function in chronic obstructive pulmonary disease: results from the TORCH study. Am J Respir Crit Care Med. 2008;178(4):332–338. doi:10.1164/rccm.200712-1869OC
48. Yun JH, Lamb A, Chase R, et al. Blood eosinophil count thresholds and exacerbations in patients with chronic obstructive pulmonary disease. J Allergy Clin Immunol. 2018;141(6):2037–2047.e10. doi:10.1016/j.jaci.2018.04.010
49. Tashkin DP, Wechsler ME. Role of eosinophils in airway inflammation of chronic obstructive pulmonary disease. Int J Chron Obstruct Pulmon Dis. 2018;17(13):335–349. doi:10.2147/COPD.S152291
50. Reyfman PA, Washko GR, Dransfield MT, et al. Defining Impaired Respiratory Health. A Paradigm Shift for Pulmonary Medicine. Am J Respir Crit Care Med. 2018;198(4):440–446. doi:10.1164/rccm.201801-0120PP
51. Agustí A, Hogg JC. Update on the Pathogenesis of Chronic Obstructive Pulmonary Disease. N Engl J Med. 2019;381(13):1248–1256. doi:10.1056/NEJMra1900475
52. Rennard SI, Drummond MB. Early chronic obstructive pulmonary disease: definition, assessment, and prevention. Lancet Lond Engl. 2015;385(9979):1778–1788. doi:10.1016/S0140-6736(15)60647-X
53. Choi J, LeBlanc LJ, Choi S, et al. Differences in particle deposition between members of imaging-based asthma clusters. J Aerosol Med Pulm Drug Deliv. 2019;32(4):213–223. doi:10.1089/jamp.2018.1487
54. Rajaraman PK, Choi J, Hoffman EA, et al. Transport and deposition of hygroscopic particles in asthmatic subjects with and without airway narrowing. J Aerosol Sci. 2020;146:105581. doi:10.1016/j.jaerosci.2020.105581
55. Li F, Choi J, Zou C, et al. Latent traits of lung tissue patterns in former smokers derived by dual channel deep learning in computed tomography images. Sci Rep. 2021;11(1):4916. doi:10.1038/s41598-021-84547-5
 © 2021 The Author(s). This work is published and licensed by Dove Medical Press Limited. The full terms of this license are available at https://www.dovepress.com/terms.php and incorporate the Creative Commons Attribution - Non Commercial (unported, v3.0) License.
By accessing the work you hereby accept the Terms. Non-commercial uses of the work are permitted without any further permission from Dove Medical Press Limited, provided the work is properly attributed. For permission for commercial use of this work, please see paragraphs 4.2 and 5 of our Terms.
© 2021 The Author(s). This work is published and licensed by Dove Medical Press Limited. The full terms of this license are available at https://www.dovepress.com/terms.php and incorporate the Creative Commons Attribution - Non Commercial (unported, v3.0) License.
By accessing the work you hereby accept the Terms. Non-commercial uses of the work are permitted without any further permission from Dove Medical Press Limited, provided the work is properly attributed. For permission for commercial use of this work, please see paragraphs 4.2 and 5 of our Terms.