")
Back to Journals » OncoTargets and Therapy » Volume 9
Long-term survival and prognosis for primary clear cell carcinoma of the liver after hepatectomy
Authors Chen Z, Zhu S, Qi L, Li L
Received 22 January 2016
Accepted for publication 19 March 2016
Published 6 July 2016 Volume 2016:9 Pages 4129—4135
DOI https://doi.org/10.2147/OTT.S104827
Checked for plagiarism Yes
Review by Single anonymous peer review
Peer reviewer comments 2
Editor who approved publication: Professor Min Li
Zu-Shun Chen,* Shao-Liang Zhu,* Lu-Nan Qi,* Le-Qun Li
Department of Hepatobiliary Surgery, Affiliated Tumor Hospital of Guangxi Medical University, Nanning, People’s Republic of China
*These authors contributed equally to this work
Background: The aim of this study was to investigate the long-term survival and prognosis for primary clear cell carcinoma of the liver (PCCCL) of the liver after hepatectomy.
Methods: Our study retrospectively analyzed the clinicopathological data of 64 patients with PCCCL (PCCCL group) and 247 with nonclear cell hepatocellular carcinoma (NHCC group) after hepatectomy between January 1996 and December 2006. The overall survival (OS) and disease-free survival of the two groups was compared using the Kaplan–Meier method. Prognostic factors of survival were identified by multivariate analysis.
Results: The 1-, 3-, and 5-year OS (P=0.016) and disease-free survival (P<0.001) of the PCCCL group were significantly higher than that of the NHCC group. In mutivariate analysis, tumor size >5 cm, presence of portal vein tumor thrombosis and proportion of clear cells ≤70% were risk factors for OS of the PCCCL group. The prognosis of a subgroup with higher proportion of clear cells was markedly better than that of the subgroup with a lower proportion of clear cells.
Conclusion: Our results suggested that the prognosis of patients with PCCCL was better than that of the patients with NHCC. The higher the proportion of clear cells, the better the prognosis.
Keywords: primary clear cell carcinoma, hepatectomy, prognosis, overall survival, disease-free survival
Introduction
Hepatocellular carcinoma (HCC) is one of the most common causes of cancer death worldwide.1 According to the histological architecture or cytological features, HCC can be classified into various cytological types such as clear cell type, spindle cell type, giant cell type, small cell type, and squamous cell type.2,3 It was reported by previous studies that each subtype has a different prognosis.4,5 Primary clear cell carcinoma of the liver (PCCCL), with the frequency ranging from 0.4% to 37% in the previous studies,6–12 is generally reported to have a favorable prognosis compared with that of nonclear cell HCC (NHCC).13 It is a particular histological type of HCC, in which a large number of cells show clear cytoplasm that does not stain with hematoxylin and eosin and is generally diagnosed when the tumor contains >30% clear cells.12,14 However, some other studies diagnosed PCCCL when the tumor contained >50% clear cells.10,15,16 A recent study by Ji et al16 suggested that cases with clear cells ≥70% had significantly longer survival than those with clear cells <70% in their research and another study of their own10 stressed that the criteria for the diagnosis of PCCCL should be revised to the proportion of clear cells ≥75% and more studies should be designed to confirm the results of their research. Studies of this kind are quite limited and clinical prognostic features of PCCCL are not fully clarified.
Therefore in the present study, we investigated the long-term survival and prognosis for primary clear cell carcinoma of the liver after hepatectomy. In addition, the long-term survival and prognosis of cases with different proportion of clear cells were also analyzed.
Materials and methods
Patients
From January 1996 to December 2006, a total of 975 HCC patients with newly diagnosed HCC in the department of hepatobiliary surgery at our Hospital were enrolled and retrospectively analyzed (Figure 1). Of these, 392 patients who received other treatment such as transarterial chemoembolization, local ablation therapy, systematic chemotherapy, sorafenib therapy, or supportive care were excluded. Among the remaining 483 patients who underwent hepatectomy, 46 were excluded because of incomplete data or extrahepatic metastasis. Of the remaining 308 patients, 64 patients with proportions of clear cells >30% were postoperatively diagnosed as PCCCL (PCCCL group, Figure 2A–C) and we diagnosed PCCCL when it contained >30% of clear cells.12,13 The other 244 patients were diagnosed as NHCC group (Figure 3). HCC and PCCCL diagnosis was confirmed after hepatectomy by histopathological examination of surgical samples. HCC and PCCCL diagnosis were confirmed by at least two pathologists. The clinicopathological characteristics of the two groups were compared (Table 1).
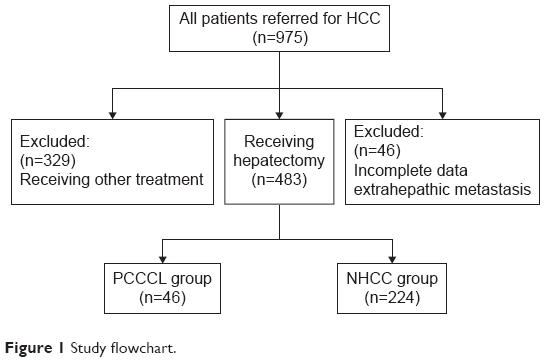 | Figure 1 Study flowchart. |
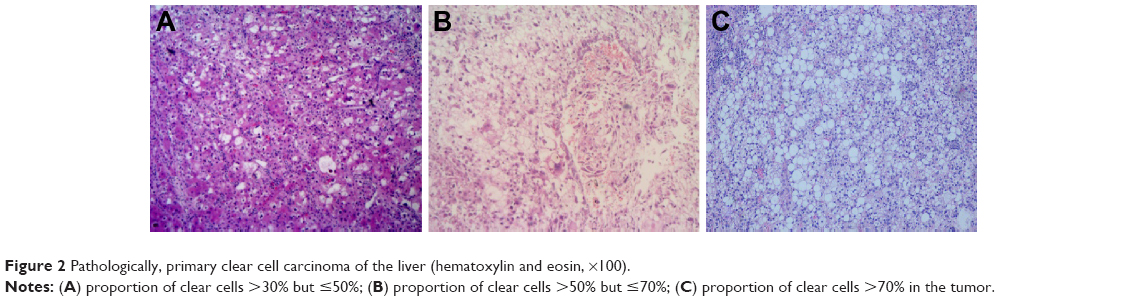 | Figure 2 Pathologically, primary clear cell carcinoma of the liver (hematoxylin and eosin, ×100). |
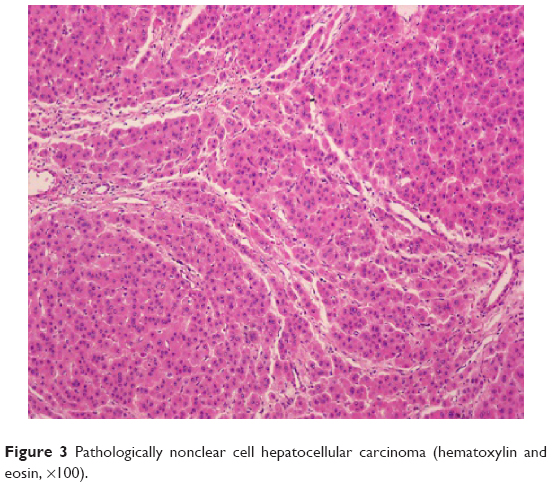 | Figure 3 Pathologically nonclear cell hepatocellular carcinoma (hematoxylin and eosin, ×100). |
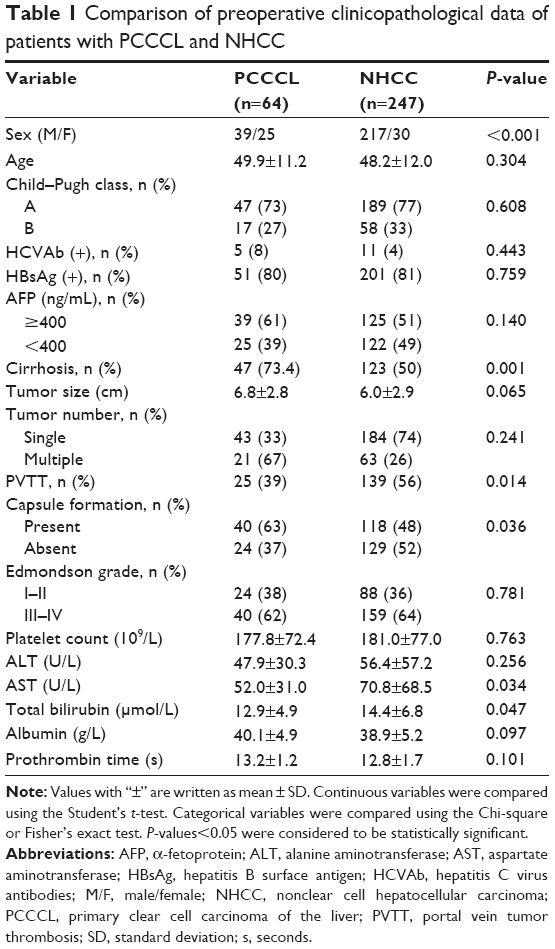 | Table 1 Comparison of preoperative clinicopathological data of patients with PCCCL and NHCC |
Hepatectomy
Liver resection was the treatment proposed to all patients with a Child–Pugh class A or B, a Model for End-stage Liver Disease score <8 points. Intraoperative ultrasound was routinely performed to determine tumor location and assess the vascular anatomy of the liver. A decision was then made on the type of liver resection that would allow a clear margin around the tumor with maximum preservation of remnant liver volume. Hepatic resection was performed following the techniques described previously.17,18 In almost all hepatic resections, intermittent Pringle’s maneuvers consisting of clamping the portal triad for <20 minutes and then releasing the clamp at 5-minute intervals or hemivascular occlusions were applied.19 Encountered large vessels and bile ducts were ligated separately during liver dissection. Liver parenchyma was transected gradually from front to back, from shallow to deep, and the tumor was cutoff eventually.
Follow-up
After treatment, follow-up of all surviving patients included a liver function test, estimation of serum α-fetoprotein (AFP) levels, dynamic liver CT, MRI, liver ultrasonography, and chest radiography at an interval of 2–3 months, especially during the first 2 years. The overall survival (OS) was defined as the period from the date of hepatectomy. Disease-free survival (DFS) was defined as the period from the date of hepatectomy until imaging study detected recurrence. When recurrence was confirmed, secondary hepatectomy, radiofrequency ablation, or transcatheter arterial chemoembolization was the treatment of choice.
Statistical analysis
Continuous variables were expressed as mean ± standard deviation (SD) and compared using the t-test. Categorical variables were compared using the chi-square test or Fisher’s exact test. Survival analysis was calculated by the Kaplan–Meier method and group results were compared using the log-rank test. Multivariate analysis to identify independent prognostic factors was carried out using the Cox proportional hazards mode. All statistical analyses were performed with SPSS (version 19.0, IBM Corporation, Armonk, NY, USA). For all tests, a P-value <0.05 was considered to be statistically significant.
Ethics statement
First, this study was conducted in accordance with the Declaration of Helsinki. Second, written informed consent was given by all participants for their clinical records to be used in this study. Lastly, it was approved by the Institutional Review Board of Affiliated Tumor Hospital of Guangxi Medical University.
Results
Clinicopathological characteristics of the PCCCL and NHCC groups
The clinicopathological characteristics of two groups are shown in Table 1. There were no significant differences in age, liver function, proportion of hepatitis B surface antigen (+), tumor size, tumor number, Edmondson grade, and preoperative levels of AFP, platelet count, alanine aminotransferase level, and albumin. A total of 25 patients (39%) in the PCCCL group were female and this proportion was significantly higher than that in the NHCC group (12.1%). In addition, a higher incidence of cirrhosis (P=0.001), capsule formation (P=0.036), and a lower rate of portal vein tumor thrombosis (PVTT) (P=0.014) was observed in the PCCCL group.
Postoperative follow-up of the PCCCL and NHCC groups
The median follow-up of the PCCCL and NHCC groups were 46.3 and 34.1 months, respectively. The 1-year (82.8%), 3-year (56.3%), and 5-year (35.9%) OS of the PCCCL group were significantly higher than that of the NHCC group (1-year OS: 63.3%, 3-year OS: 38.1%, 5-year OS: 28.9%) (P=0.002, Figure 4). The 1-, 3-, and 5-year DFS rates of the PCCCL group (76.6%, 53.1%, and 28.1%, respectively) were significantly higher than that of the NHCC group (44.4%, 23.9%, and 18.9%, respectively; P<0.001, Figure 5).
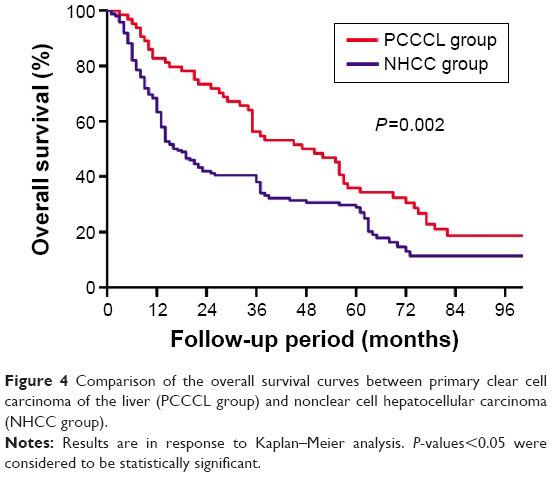 | Figure 4 Comparison of the overall survival curves between primary clear cell carcinoma of the liver (PCCCL group) and nonclear cell hepatocellular carcinoma (NHCC group). |
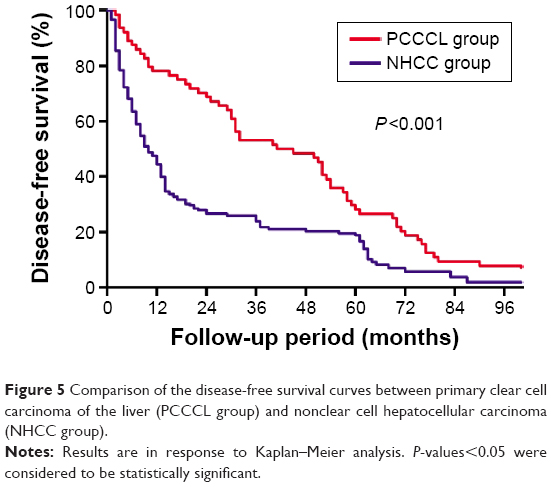 | Figure 5 Comparison of the disease-free survival curves between primary clear cell carcinoma of the liver (PCCCL group) and nonclear cell hepatocellular carcinoma (NHCC group). |
Postoperative follow-up of the PCCCL subgroups
The PCCCL group was subdivided into three subgroups according to the proportion of clear cells in the tumor. Subgroup A (n=7) has a proportion of clear cells >30% but ≤50% (Figure 2A), the 1-, 3-, and 5-year OS and DFS were 42.9%, 14.3%, and 14.3% (mean ± SD, 23.3±8.8 months) and 42.9%, 14.3%, and 14.3% (mean ± SD, 18.7±8.0 months), respectively. Subgroup B (n=15) has a proportion of clear cells >50% but ≤70% (Figure 2B) and the 1-, 3-, and 5-year OS and DFS were 73.3%, 46.7%, and 20.0% (mean ± SD, 37.8±6.4 months) and 73.3%, 33.3%, and 20.0% (mean ± SD, 33.5±6.6 months), respectively. Subgroup C (n=42) has a proportion of clear cells >70% (Figure 2C) and the 1-, 3-, and 5-year OS and DFS were 92.9%, 66.7%, and 45.2% (mean ± SD, 60.7±5.7 months) and 85.7%, 66.7%, and 33.3% (mean ± SD, 53.8±5.1 months), respectively.
The OS plots for patients between different subgroups were significantly different (P=0.002, Figure 6). Differences of OS plots between patients of subgroups A and B were not statistically significant (P=0.282). While patients in subgroup C had a significantly longer OS than subgroups A (P=0.006) and B (P=0.049).
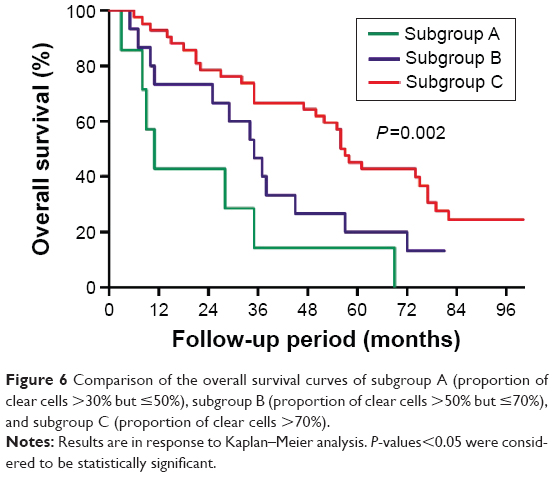 | Figure 6 Comparison of the overall survival curves of subgroup A (proportion of clear cells >30% but ≤50%), subgroup B (proportion of clear cells >50% but ≤70%), and subgroup C (proportion of clear cells >70%). |
The DFS plots for patients between different subgroups were significantly different (P=0.001, Figure 7). Differences of DFS plots between patients of subgroups A and B were not statistically significant (P=0.102). While patients in subgroup C had a significantly longer DFS than subgroups A (P=0.001) and B (P=0.031).
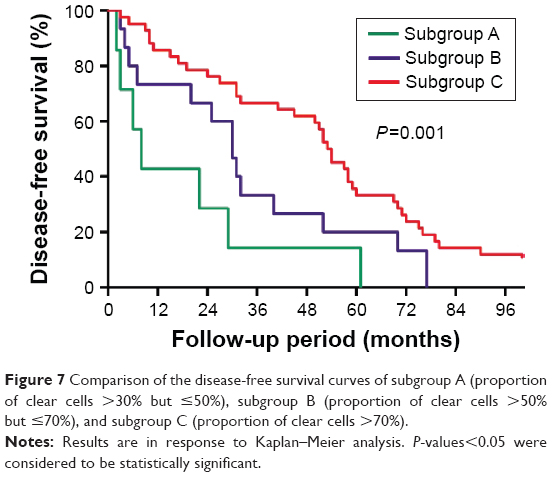 | Figure 7 Comparison of the disease-free survival curves of subgroup A (proportion of clear cells >30% but ≤50%), subgroup B (proportion of clear cells >50% but ≤70%), and subgroup C (proportion of clear cells >70%). |
Identification of prognostic factors for OS of PCCCL
Prognostic factors for OS of PCCCL are listed in Table 2. For the univariate analysis, preoperative AFP ≥400 ng/mL, tumor size >5 cm, presence of PVTT, and proportion of clear cells <70% were the risk factors of OS of the PCCCL group. The earlier predictive factors in univariate analysis were contained in the mutivariate analysis. A total of three factors still independently predicted poorer OS of the PCCCL group, including tumor size >5 cm (hazard ratio [HR] =2.698, 95% confidence interval [CI]: 1.489–4.889, P=0.034), presence of PVTT (HR =1.066, 95% CI: 1.002–1.134, P=0.001), and proportion of clear cells ≤70% (HR =2.008, 95% CI: 1.077–3.741, P=0.028).
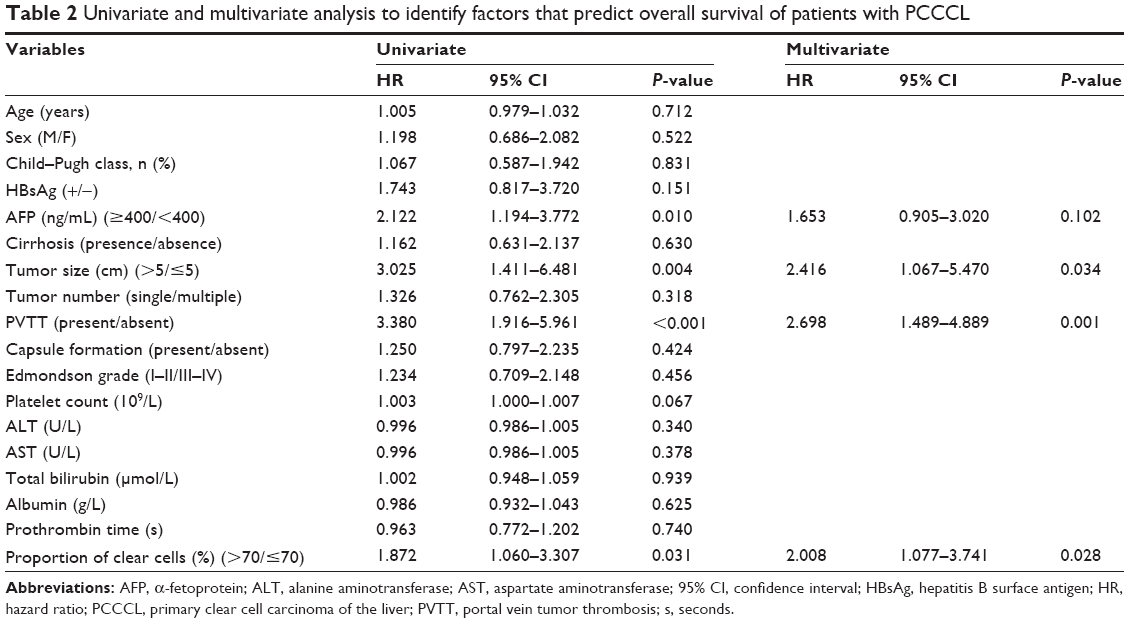 | Table 2 Univariate and multivariate analysis to identify factors that predict overall survival of patients with PCCCL |
Discussion
PCCCL is a particular and relatively rare histological type of HCC and has different clinicopathological features and better prognosis from NHCC.13 It was reported by some studies to have a higher rate of hepatitis C virus (HCV) infection, female prevalence, capsule formation, cirrhosis, less involved with vascular invasion, mid-range degree of differentiation, and low-grade malignancy;10,11 however, there is still controversy. Similarly in the present study, significant higher morbidity of female patients (P<0.001), ratio of patients with liver cirrhosis (P=0.001), incidence of tumor capsule formation (P=0.036), and lower rate of PVTT (P=0.014) were found in the PCCCL group than that in the NHCC group. Besides, the rate of HCV infection in the PCCCL group was higher (8% vs 4%), but the difference was not significant (P=0.443). This finding may be different from some of the previous studies from Western countries, in which the rate of HCV infection may exceed 40%. It can be explained by the different related etiology of HCC in different regions.
Considering the high incidence of tumor capsule formation, hepatectomy would be an optimal approach for PCCCL. Lao et al11 have reported that surgical resection is an effective way to achieve favorable outcomes and even long-term survival of the patients with PCCCL. Most studies have reported that prognosis of PCCCL was better than NHCC. Lai et al7 reported that the presence of clear cells was the only histologic feature of prognostic significance in their patients. A more recent series from Liu et al10 have reported the 1-, 3-, and 5-year OS (81%, 53%, 39% vs 76%, 46%, 32%, P=0.034) and DFS (72%, 48%, 35% vs 66%, 34%, 25%, P=0.021) of the PCCCL group were higher than that of the common-type HCC group. However, the prognosis of patients with PCCCL is still controversial. Some other studies12,20 found that the prognosis of PCCCL showed no significant difference or was worse than NHCC. Yang et al20 reported in their series that the 3- and 5-year survival rates, and no recurrence time were 54.5%, 33.3%, and 564 days, respectively, lower than the findings of 74.3%, 46.1%, and 770 days for NHCC. However, there is no significant difference. In the present studies, the median OS of the PCCCL group was 47 months, the 1-, 3-, and 5-year OS and DFS in the PCCCL group were significantly higher than that in the NHCC group (1-, 3-, and 5-year OS: 82.8%, 56.3%, 35.9% vs 63.3%, 38.1%, 28.9%, P=0.016; 1-, 3-, and 5-year DFS: 76.6%, 53.1%, 28.1% vs 44.4%, 23.9%, 18.9%, P<0.001). Our findings supported the former view that prognosis of PCCCL was better than NHCC.
Some authors diagnose PCCCL when the tumor contains >30% clear cells,12,14,20 whereas others consider <30% of clear cells within the tumor as sufficient.7 Moreover, some other studies diagnosed PCCCL when the tumor contains >50% clear cells. In the present study, we diagnosed PCCCL when it contained >30% of clear cells. Notably, a study of Qiang Li et al10 reported that proportion of clear cells was a prognostic factor associated with OS and DFS of the patients with PCCCL. Besides, the PCCCL group was subdivided into two subgroups on the basis of the proportion of clear cells (≥75%/<75%) in the tumor in their research and they found the prognosis of the patients with a higher proportion of clear cells were better than the patients with a lower proportion of clear cells and only the subgroup with the proportion of clear cells ≥75% showed a better prognosis than the NHCC group. Thus, they stressed that the criteria for the diagnosis of PCCCL should be revised to the proportion of clear cells ≥75%. Similarly, a more recent series from Ji et al16 found proportion of clear cells was a prognostic factor independently predicted cumulative survival and the group with a proportion of clear cells ≥70% had significantly longer survival than the group with a proportion of clear cells <70%. Their findings suggested that the prognosis was related to the proportion of clear cells. The greater the number of clear cells, the better the prognosis. In our study, we found proportion of clear cells >70% predicted better OS of the PCCCL group. Besides, the PCCCL group was subdivided into three subgroups according to the proportion of clear cells in the tumor. Subgroup A (n=7) had a proportion of clear cells >30% but ≤50%; subgroup B (n=15) had a proportion of clear cells >50% but ≤70%; and subgroup C (n=42) had a proportion of clear cells >70%. It can be found that subgroup C had significantly longer OS and DFS than the subgroups B and A. Furthermore, only subgroup C showed a better prognosis than the NHCC group (1-, 3-, and 5-year OS: 92.9%, 66.7%, 45.2% vs 63.3%, 38.1%, 28.9%), while the prognosis of subgroups A and B were poorer than the NHCC group. These findings were consistent with the results of Liu et al10 and Ji et al16 and supported the view that higher the proportion of clear cells, the better the prognosis.
Limitations
There were still some limitations in the present study. First, it was a single-center study performed in the Asia-Pacific region with significantly higher prevalence of hepatitis B virus infection (>80%) than most Western countries. Therefore, the results may not be representative of all PCCCL patients. Second, the samples of subgroups A and B were relatively small, therefore in the future, we would expand our sample and more studies should be designed to confirm these findings.
Conclusion
Our results suggest that patients in the PCCCL group had a higher rate of female prevalence, liver cirrhosis, tumor capsulation formation, and a lower rate of PVTT. The prognosis of patients with PCCCL was better than that of the patients with NHCC. Patients with smaller tumor size, absence of PVTT, and higher clear cell ratio had better prognosis. The higher the proportion of clear cells, the better the prognosis. However, these findings require further validation.
Acknowledgment
This study was supported by the National Science and Technology Major Special Project, No 2012ZX10002010001009.
Disclosure
The authors report no conflicts of interest in this work.
References
Siegel R, Ma J, Zou Z, Jemal A. Cancer statistics, 2014. CA Cancer J Clin. 2014;64:9–29. | ||
Cong WM, Zhang SH. Introduction of the rare types of HCC. Chin J Pathol. 2002;31:457–460. | ||
Chung YE, Park M, Park YN, et al. Hepatocellular carcinoma variants: radiologic-pathologic correlation. AJR Am J Roentgenol. 2009;193:W7–W13. | ||
Chedid A, Ryan LM, Dayal Y, Wolf BC, Falkson G. Morphology and other prognostic factors of hepatocellular carcinoma. Arch Pathol Lab Med. 1999;123:524–528. | ||
Ross JS, Kurian S. Clear cell hepatocellular carcinoma: sudden death from severe hypoglycemia. Am J Gastroenterol. 1985;80:188–194. | ||
Kashala LO, Conne B, Kalengayi MM, Kapanci Y, Frei PC, Lambert PH. Histopathologic features of hepatocellular carcinoma in Zaire. Cancer. 1990;65:130–134. | ||
Lai CL, Wu PC, Lam KC, Todd D. Histologic prognostic indicators in hepatocellular carcinoma. Cancer. 1979;44:1677–1683. | ||
Emile JF, Lemoine A, Azoulay D, Debuire B, Bismuth H, Reynès M. Histological, genomic and clinical heterogeneity of clear cell hepatocellular carcinoma. Histopathology. 2001;38:225–231. | ||
Adamek HE, Spiethoff A, Kaufmann V, Jakobs R, Riemann JF. Case report: primary clear cell carcinoma of noncirrhotic liver (immunohistochemical discrimination of hepatocellular and cholangiocellular origin). Dig Dis Sci. 1998;43:33–38. | ||
Liu Z, Ma W, Li H, Li Q. Clinicopathological and prognostic features of primary clear cell carcinoma of the liver. Hepatol Res. 2008;38:291–299. | ||
Lao X, Zhang Y, Jin X, et al. Primary clear cell carcinoma of liver: clinicopathologic features and surgical results of 18 cases. Hepatogastroenterology. 2005;53:128–132. | ||
Buchanan TF Jr, Huvos AG. Clear-cell carcinoma of the liver. A clinicopathologic study of 13 patients. Am J Clin Pathol. 1974;61:529–539. | ||
Li T, Fan J, Qin L, et al. Risk factors, prognosis, and management of early and late intrahepatic recurrence after resection of primary clear cell carcinoma of the liver. Ann Surg Oncol. 2011;18:1955–1963. | ||
Wu PC, Lai CL, Lam KC, et al. Clear cell carcinoma of liver. An ultrastructural study. Cancer. 1983;52:504–507. | ||
Liu J, Tsai H, Hsu S, Hu DH, Chen SS. Clear cell and non-clear cell hepatocellular carcinoma: a case report and literature review. Kaohsiung J Med Sci. 2004;20:78–81. | ||
Ji S, Li Q, Dong H. Therapy and prognostic features of primary clear cell carcinoma of the liver. World J Gastroenterol. 2010;16:764. | ||
Zhu SL, Zhong JH, Ke Y, Ma L, You XM, Li LQ. Efficacy of hepatic resection vs transarterial chemoembolization for solitary huge hepatocellular carcinoma. World J Gastroenterol. 2015;21:9630–9637. | ||
Zhu SL, Ke Y, Peng YC, et al. Comparison of long-term survival of patients with solitary large hepatocellular carcinoma of BCLC stage A after liver resection or transarterial chemoembolization: a propensity score analysis. PLoS One. 2014;9:e115834. | ||
Belghiti J, Noun R, Malafosse R, et al. Continuous versus intermittent portal triad clamping for liver resection: a controlled study. Ann Surg. 1999;229:369. | ||
Yang SH, Watanabe J, Nakashima O, Kojiro M. Clinicopathologic study on clear cell hepatocellular carcinoma. Pathol Int. 1996;46:503–509. |
 © 2016 The Author(s). This work is published and licensed by Dove Medical Press Limited. The full terms of this license are available at https://www.dovepress.com/terms.php and incorporate the Creative Commons Attribution - Non Commercial (unported, v3.0) License.
By accessing the work you hereby accept the Terms. Non-commercial uses of the work are permitted without any further permission from Dove Medical Press Limited, provided the work is properly attributed. For permission for commercial use of this work, please see paragraphs 4.2 and 5 of our Terms.
© 2016 The Author(s). This work is published and licensed by Dove Medical Press Limited. The full terms of this license are available at https://www.dovepress.com/terms.php and incorporate the Creative Commons Attribution - Non Commercial (unported, v3.0) License.
By accessing the work you hereby accept the Terms. Non-commercial uses of the work are permitted without any further permission from Dove Medical Press Limited, provided the work is properly attributed. For permission for commercial use of this work, please see paragraphs 4.2 and 5 of our Terms.