")
Back to Journals » ClinicoEconomics and Outcomes Research » Volume 13
Long-Term Outcomes of Previously Treated Adult and Adolescent Patients with Severe Hemophilia A Receiving Prophylaxis with Extended Half-Life FVIII Treatments: An Economic Analysis from a United Kingdom Perspective
Authors Benson G, Morton T, Thomas H, Lee XY
Received 28 September 2020
Accepted for publication 15 December 2020
Published 18 January 2021 Volume 2021:13 Pages 39—51
DOI https://doi.org/10.2147/CEOR.S280574
Checked for plagiarism Yes
Review by Single anonymous peer review
Peer reviewer comments 3
Editor who approved publication: Professor Giorgio Colombo
Gary Benson,1 Tim Morton,2 Huw Thomas,3 Xin Ying Lee4
1Northern Ireland Haemophilia Comprehensive Care Centre and Thrombosis Unit, Belfast City Hospital, Belfast, UK; 2DRG, Bicester, UK; 3Biopharm, Novo Nordisk Ltd, Gatwick, UK; 4Biopharm Access, Novo Nordisk A/S, Søborg, Denmark
Correspondence: Xin Ying Lee
Novo Nordisk A/S, Vandtårnsvej 114, Søborg DK-2860, Denmark
Tel +45 30777030
Email [email protected]
Background: The standard of care for patients with hemophilia A is prophylaxis with factor VIII (FVIII) therapies. Extended half-life (EHL) FVIII products offer a reduced infusion burden compared with standard FVIII treatments. However, comparative evidence between EHLs is lacking.
Objective: To develop a pharmacodynamic–pharmacokinetic decision model to predict comparative bleed outcomes of adolescents and adults with hemophilia A receiving treatment with various EHL FVIII therapies, capturing differences in cumulative bleeding episodes, breakthrough bleed resolution and resource costs, as well as quality-adjusted life years (QALYs).
Methods: The patient population from the pathfinder 2 Phase III clinical trial was used to understand the link between FVIII levels and annual bleeding rates (ABRs). Pharmacokinetic/pharmacodynamic modeling was subsequently applied to estimate FVIII levels for four EHL FVIII treatments (turoctocog alfa pegol [Esperoct®], rurioctocog alfa pegol [Adynovi®], efmoroctocog alfa [Elocta®], and damoctocog alfa pegol [Jivi®]) to predict comparative ABRs. FVIII consumption costs (due to prophylactic treatment and breakthrough bleed resolution) and resource costs, as well as QALYs, were subsequently estimated from a UK NHS perspective over a 70-year time horizon.
Results: Turoctocog alfa pegol prophylaxis resulted in 8– 19% fewer cumulative bleeding episodes versus comparators in the base case scenario. Assuming parity in annual prophylaxis costs, turoctocog alfa pegol prophylaxis reduced the cost of product and resource use to resolve a breakthrough bleed by 9– 25% versus comparators. Prophylaxis with turoctocog alfa pegol was also associated with the most QALYs, representing a discounted QALY gain of 0.35– 1.05 compared with the other treatments.
Conclusion: Using a pharmacodynamic–pharmacokinetic decision model, turoctocog alfa pegol prophylaxis was associated with fewer cumulative bleeds, as well as lower product and resource costs related to resolving a breakthrough bleed and most QALYs versus comparators.
Keywords: hemophilia A, prophylaxis, factor VIII, FVIII, cost-effectiveness model, turoctocog alfa pegol, Esperoct®
Introduction
Congenital hemophilia A is an inherited bleeding disorder resulting from a deficiency of coagulation factor VIII (FVIII) caused by mutations of the F8 gene. In most cases, it is an inherited X-linked recessive trait, although in some cases it can arise from a spontaneous mutation.1 Hemophilia is characterized by repeated bleeding, especially into vulnerable or “target” joints, which can lead to permanent joint damage. The prevalence of hemophilia A is commonly reported as one in 5000 males;2 however, studies show considerable variation among countries.3
Hemophilia A may be classified depending on FVIII activity in the blood.4 Patients with severe hemophilia (defined as <0.01 IU mL−1 [<1%] baseline clotting factor) suffer from frequent spontaneous bleeding episodes (ie, without obvious cause), often into joints and muscles. Those with moderate hemophilia (0.01 to 0.05 IU mL−1 [1% to 5%] clotting factor) generally experience bleeding episodes after injuries, and only very rarely have spontaneous joint bleeds. People with mild hemophilia (defined as >0.05 to 0.50 IU mL−1 [>5% to <50%] clotting factor) typically only experience bleeds following serious injury, surgery or trauma.4,5
The standard of care for patients with hemophilia A is replacement therapy with FVIII products, which may be plasma-derived or recombinant.6 Recent technological developments have led to the commercial availability of extended half-life (EHL) factor concentrates with improved pharmacokinetic (PK) profiles and less-frequent dosing, which may reduce annual bleeding rates (ABRs) while reducing infusion burden.7,8 FVIII replacement therapies can be used on-demand (administered in response to a bleeding episode) or as prophylaxis (administered at regular intervals to prevent bleeding). Prophylaxis has improved the quality of life and life expectancy of patients with severe hemophilia,7 and is recommended by groups including the World Federation of Hemophilia (WFH), the United Kingdom Hemophilia Centre Doctors’ Organisation (UKHCDO) and National Hemophilia Foundation Medical and Scientific Advisory Council (NHF MASAC).6,9,10 In the UK, it is estimated that 78% of adult patients with hemophilia receive prophylaxis.11
Many studies in hemophilia, as well as those in other fields of coagulation research, require analysis of bleeding frequencies.12 Due to a lack of head-to-head trials in hemophilia, indirect comparisons are required to generate comparative efficacy evidence of the various available treatment options relative to each other.13 However, randomized trial designs that can facilitate traditional indirect treatment comparisons are not frequently used in rare diseases such as hemophilia.14 The European Medicines Agency (EMA) has stated that appropriate PK data (incremental recovery, half-life, area under the curve, and clearance) are the most important surrogate endpoints for efficacy of a new FVIII product.15
Several studies in hemophilia A have shown factor levels to be correlated with the frequency of patient bleeds.5,16,17 Building on this relationship, some studies have used factor levels to predict bleeding rates for FVIII treatments. Miners et al developed a decision model that used FVIII PK parameters and knowledge of the link between time spent below 1% FVIII trough levels and bleeding frequency, to predict bleeding frequency for standard half-life FVIII treatments.18
A recent study by van Keep et al19 reported a pharmacodynamic (PD)–PK modeling approach to compare clinical outcomes of an EHL coagulation factor IX (FIX) product to a standard-acting FIX product. To predict the long-term outcomes of patients, the van Keep study used a Markov model structure and tracked a simulated cohort of patients over time. The authors used multivariate regression modeling to estimate the statistical link between FIX activity and bleeding frequencies. Patient levels of FIX activity were not measured continuously in the pivotal trial but were estimated from patients’ dosing diary records using published PK parameters observed from single doses in the trial. The profiles of predicted FIX activity were then superimposed on the bleeding episode records, establishing a correlation between annualized bleed rates and FIX activity levels. Negative binomial regression models were fitted to assess the number of total, spontaneous, and traumatic bleeding episodes within specific FIX activity level categories, adjusted for age and whether patients had target joints.
We used patient data from the pathfinder 2 phase III clinical trial for the EHL FVIII turoctocog alfa pegol (Esperoct®)20,21 to understand the link between FVIII levels and ABRs in patients with severe hemophilia A. The regression analysis and model structure used in the van Keep study could not be exactly replicated as target joint data was not collected in the pathfinder 2 trial. Thus, a new regression analysis was proposed to inform an alternate model structure. With this knowledge, we utilized a decision model to estimate FVIII levels and long-term bleeding outcomes of adolescents and adults with severe hemophilia A receiving treatment with the four EHL FVIII therapies currently licensed by the EMA – turoctocog alfa pegol, rurioctocog alfa pegol (Adynovi®), efmoroctocog alfa (Elocta®), and damoctocog alfa pegol (Jivi®). We captured differences in cumulative bleeding episodes, breakthrough bleed resolution and resource costs, and quality-adjusted life-years (QALYs), from a UK NHS perspective. QALYs are a measure of the state of health of a person or group in which the benefits, in terms of length of life, are adjusted to reflect the quality of life. One QALY is equal to 1 year of life in perfect health. It is often measured in terms of the person’s ability to carry out the activities of daily life without pain or mental disturbance.22 To the best of our knowledge, this is the first health economic analysis in hemophilia A to use PK data from a clinical study population to predict comparative ABRs across EHL FVIII products, and the first published health economics analysis for turoctocog alfa pegol.
Methods
A PD–PK decision model was developed to predict the long-term outcomes of adults and adolescents with severe hemophilia A receiving prophylaxis with EHL FVIII products. The primary outcome of the model was the number of bleeds over the model time horizon. The following three levels of modeling were undertaken:
- PD modeling to estimate the exposure–response relationship between FVIII levels and ABRs
- PK modeling (using clearance, dose, mean residence time, incremental recovery, time since dose, dosing interval and volume of distribution at steady state [VSS]) to predict FVIII levels for all treatments
- Decision modeling to estimate the impact of PD and PK modeling on cumulative number of bleeding episodes, total costs and QALYs
PD Modeling to Estimate Annualized Bleeding Rate for Each FVIII Activity Category
Factor VIII activity levels were categorized into five clinically meaningful groups (0–1%, >1–5%, >5–20%, >20–50%, and >50%), based on those utilized by Groth et al23 and the National Hemophilia Foundation.4 The mild hemophilia activity category used by the National Hemophilia Foundation (6–49%) was split into two sub-categories (>5–20% and >20–50%) to provide greater depth of analysis. ABRs of treatment-requiring bleeding episodes were estimated for the FVIII activity categories using a negative binomial regression model and data from all patients in the pathfinder 2 clinical trial.24 Pathfinder 2 was a Phase III, multinational, open-label, non-randomized trial evaluating the safety, PK and clinical efficacy of turoctocog alfa pegol when used for prophylaxis and treatment of bleeds in PTPs aged ≥12 years with severe hemophilia A.21 Turoctocog alfa pegol, damoctocog alfa pegol, and rurioctocog alfa pegol are not licensed for use in patients aged less than 12 years; therefore, the analysis is on a simulated cohort who start treatment at age 12. Patient-level efficacy data were taken from the main phase and first extension phase of this trial. Additionally, using the ABRs for each of the FVIII categories and the PK profiles for turoctocog alfa pegol and comparators, the relative bleeding rates of patients were calculated based upon the amount of time spent in each category.
Poisson and negative binomial distribution models are often used in the analysis of count data such as bleeding episodes.5,19 However, when the duration of observation is relatively short compared with the frequency of events, count data become right-skewed with a large proportion of zero values, which violates the Poisson distribution assumption that the mean and variance of the data are approximately equal.19 To account for over-dispersed data in this analysis, negative binomial regression was therefore employed, similar to the methodology utilized by van Keep.19
In the negative binomial regression models, the response variable was the number of total, spontaneous, and traumatic bleeding episodes for each patient. FVIII activity (categorized as 0–1%, >1–5%, >5–20%, >20–50%, and >50%) was included as covariate in the model. As the number of bleeding episodes in each FVIII activity category is highly dependent on the number of days spent in each category, a regression model with the number of days as exposure or offset was constructed. To adjust for clustering, subject ID was specified as the cluster identifier variable.
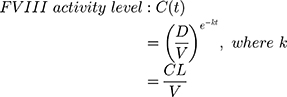
FVIII activity was not directly measured frequently during the pathfinder 2 trial. FVIII activity levels were therefore estimated on an hourly basis for each patient using dosing data reported in their patient diaries and Equation 1, where CL is clearance (mL/h/kg), D is the dose (IU/kg), K is the elimination rate, t is the time since dose (h), and V is the volume of distribution (mL/kg). It was assumed that turoctocog alfa pegol distribution and elimination follow single compartmental PK. When the time of bleed and time of injection were the same, it was assumed that the bleeding episode occurred immediately before the infusion. To prevent FVIII activity falling below a patient’s own endogenous FVIII level, minimum FVIII activity levels were capped at individual patient baseline levels.
For the subgroup of patients who were part of the single-dose PK assessments in pathfinder 2, individual PK parameter estimates (CL and V) from Visit 2 in the PK profiling calculations were used. For patients who were not part of the PK sub-trials, CL and V were estimated using individual patient weight data and population PK model outputs from the pathfinder 1 Phase I trial.25 Further details are provided in the supporting information (refer to Equations S1 and S2, and Table S3).
ABRs from negative binomial regression for each FVIII activity group are reported in Table S1 (supporting information). With respect to all bleeds, estimated ABRs ranged from 13.21 (95% confidence interval [CI]: 8.78, 19.86) for FVIII activity levels ≤1% to 1.19 (95% CI: 0.88, 1.61) for FVIII activity levels >50% in pathfinder 2. As the estimated FVIII activity level decreased, the ABR increased.
PK Modeling to Predict Steady State FVIII Profiles for EHL Products
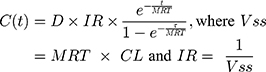
Time spent within each FVIII activity level category for each treatment was estimated on an hourly basis using the PK parameters in Table 1 and Equation 2, where MRT is the mean residence time (h), IR is the incremental recovery ([IU/mL]/[IU/kg]), τ is the dosing interval (h), and VSS is the volume of distribution at steady state (mL/kg). A follow-up of 28 days was applied to align with the cycle length used in the decision model. It was assumed that the distribution and elimination of all modelled treatments follow single compartmental PKs and that steady state conditions had been achieved, and therefore, no additional accumulation occurred.
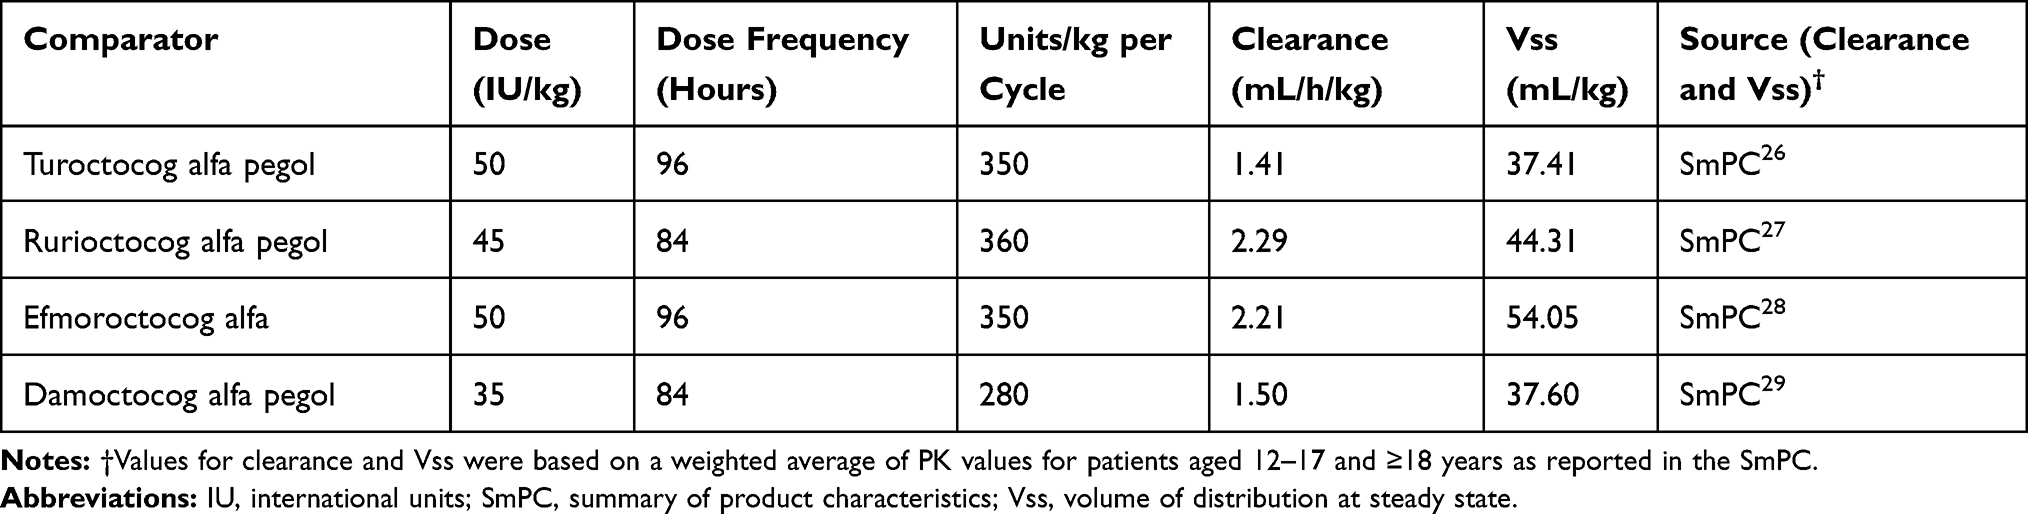 |
Table 1 Prophylaxis Dosing and PK Parameters Used for Modeling |
Dose (IU/kg) and dose frequency for each treatment were sourced from EMA summaries of product characteristics (SmPCs) using the midpoint of the dosing ranges.26–29 Our decision to use the midpoint of the dosing range reported in the SmPCs was guided by discussion with payers, and takes into account the fact that the mean consumption of product in clinical trials is not uniformly reported for all of the comparators. When dose frequency was expressed in terms of doses per week, it was assumed that all doses were administered at regular intervals.
The amount of time over 28 days with factor VIII activity levels below 1%, 5%, 20%, and 50%, and above 50% for all treatments is reported in Table S4 (supporting information).
The clinical trials for each of the studied treatments had similar inclusion/exclusion criteria and we are not aware of any specific factors that might disproportionately influence the overall PK parameters for a particular comparator. Thus, in the absence of a head-to-head comparison or crossover trial, we feel this approach is reasonable.
Decision Modeling
Decision modeling was used to predict the long-term outcomes of patients with severe hemophilia A, receiving prophylaxis with EHL FVIII products over a 70-year time horizon. The primary outcome of the model was the number of bleeds over the model time horizon. The health states used in the model were stratified by factor activity levels (Figure 1). These were defined according to the National Hemophilia Foundation guidelines, which categorize the severity of hemophilia into severe (<1% FVIII activity), moderate (1% to 5% FVIII activity), mild (>5% to 49% FVIII activity), and normal (>50% FVIII activity).4 Patients could enter the “Death” health state at any time. All-cause mortality was based on data from UK national life tables for males;30 a disease-specific mortality ratio was not applied to the population receiving prophylaxis as it was assumed that the life expectancy for these patients was equivalent to that of the general population.31
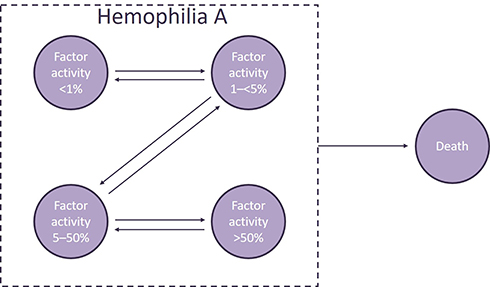 |
Figure 1 Health states in the model. |
Patients entered the model at age 12. Although in clinical practice many patients start FVIII prophylaxis earlier than age 12, this is the age at which patients are eligible for treatment with turoctocog alfa pegol, damoctocog alfa pegol, and rurioctocog alfa pegol in the UK.26,27,29 Therefore, age 12 is the earliest age from which these drugs can be used and is an appropriate starting age of patients in the model.
Given the small number of adolescent patients in the Pathfinder 2 trial, adults and adolescents were not distinguished in the analysis. Each model cycle lasted 28 days; this time period was chosen as it was a multiple of the dosing frequencies (every 4 days and twice weekly dosing) for all four products studied in the model, enabling comparability. During each 28-day cycle, patients’ factor activity levels varied based on the PK profile estimations for each comparator. A patient’s FVIII activity levels increase upon receiving a new dose of an EHL FVIII drug. After this initial increase, FVIII activity levels gradually decline through each FVIII health state. The proportion of time spent in each FVIII health state was then used to inform the number of bleeding events, breakthrough bleed resolution and resource costs, and QALYs. Bleeds (and therefore costs and QALYs) were discounted at 3.5%, in line with the UK National Institute for Health and Care Excellence (NICE) methods guide.32
Only previously treated patients (PTPs) were considered in the model due to the lack of safety and efficacy data with turoctocog alfa pegol in previously untreated patients (PUPs). The presence of FVIII inhibitors was excluded from this analysis, in part due to the very low rate of inhibitor development reported in PTPs.33,34
Bleeding Episodes
To estimate the annual bleed rates for each treatment, a weighted average of the time spent in each FVIII state and the ABRs for each FVIII state was taken. Cycle bleeding rates (all, traumatic and spontaneous bleeds) were calculated as the annual bleed rate divided by the number of cycles per year. It was assumed that the modelled relationship between FVIII and ABR with turoctocog alfa pegol in pathfinder 2 was consistent for the included FVIII comparators.
Data on patient activity levels and progression of target joints were not captured in the pathfinder 2 clinical trial. It was therefore not possible to stratify based on activity levels or link joint bleeding episodes to target joints and any long-term consequences thereof. In the pathfinder 2 clinical trials, the proportion of bleeding episodes located in the joint was 66%. It was assumed that this proportion of joint bleeds also applied for each treatment and therefore, was applied to the predicted number of total bleeds over the modelled time horizon to estimate number of joint bleeds in the modelled time horizon; however, long-term consequences on joint health and its impact on costs and utilities were not modelled.
Bleeding severity was used in the model to inform the dose of FVIII required to treat breakthrough bleeds. The pathfinder 2 clinical trial reported the proportion of bleed severity as minor/moderate (1407 of 1422 bleeds; 99%) or major (15 of 1422 bleeds; 1%) but did not differentiate between minor and moderate bleeds. Mild and moderate bleeds are defined as bleeding episodes that are uncomplicated joint bleeds, muscular bleeds without compartment syndrome, mucosal- or subcutaneous bleeds. Major bleeds include all intracranial, retroperitoneal, iliopsoas and neck bleeds. Muscle bleeds with compartment syndrome and bleeds associated with a significant decrease in the hemoglobin level (>3g/dl) are also included. Traumatic bleeds at other locations than described above could also be considered major bleeds. To estimate the number of minor, moderate and major bleeds, the predicted number of “all bleeds” was divided based on the minor/moderate and major split from Pathfinder 2 and the minor/moderate split from the SPINART study,35 which investigated the benefits of routine prophylaxis compared with on-demand treatment in a cohort of adults with severe hemophilia A. In the prophylaxis group, 44% of the bleeds in the prophylaxis group were minor and 36% were moderate. This ratio was applied to the number of bleeds reported in the pathfinder 2 clinical trial, giving the proportion of minor and moderate bleeds as 54.4% and 44.5%, respectively. This derived split between minor, moderate and major bleeds was then applied equally for all comparators.
The model was used to predict the number of breakthrough bleeds using the PK profiles and negative binomial regression results. It was assumed that breakthrough bleeds were either controlled in 1–2 injections of FVIII (mean of 1.5 doses) or were classified as uncontrolled and required further treatment with the same dose of FVIII. The proportion of bleeds which were not controlled in 1.5 injections was the inverse of the proportion of bleeds controlled in 1.5 injections as reported in the SmPC for each product. Re-treatment of breakthrough bleeds with another 1.5 injections of FVIII was assumed to be 100% effective. Dosing for breakthrough bleeds is presented in Table 2.
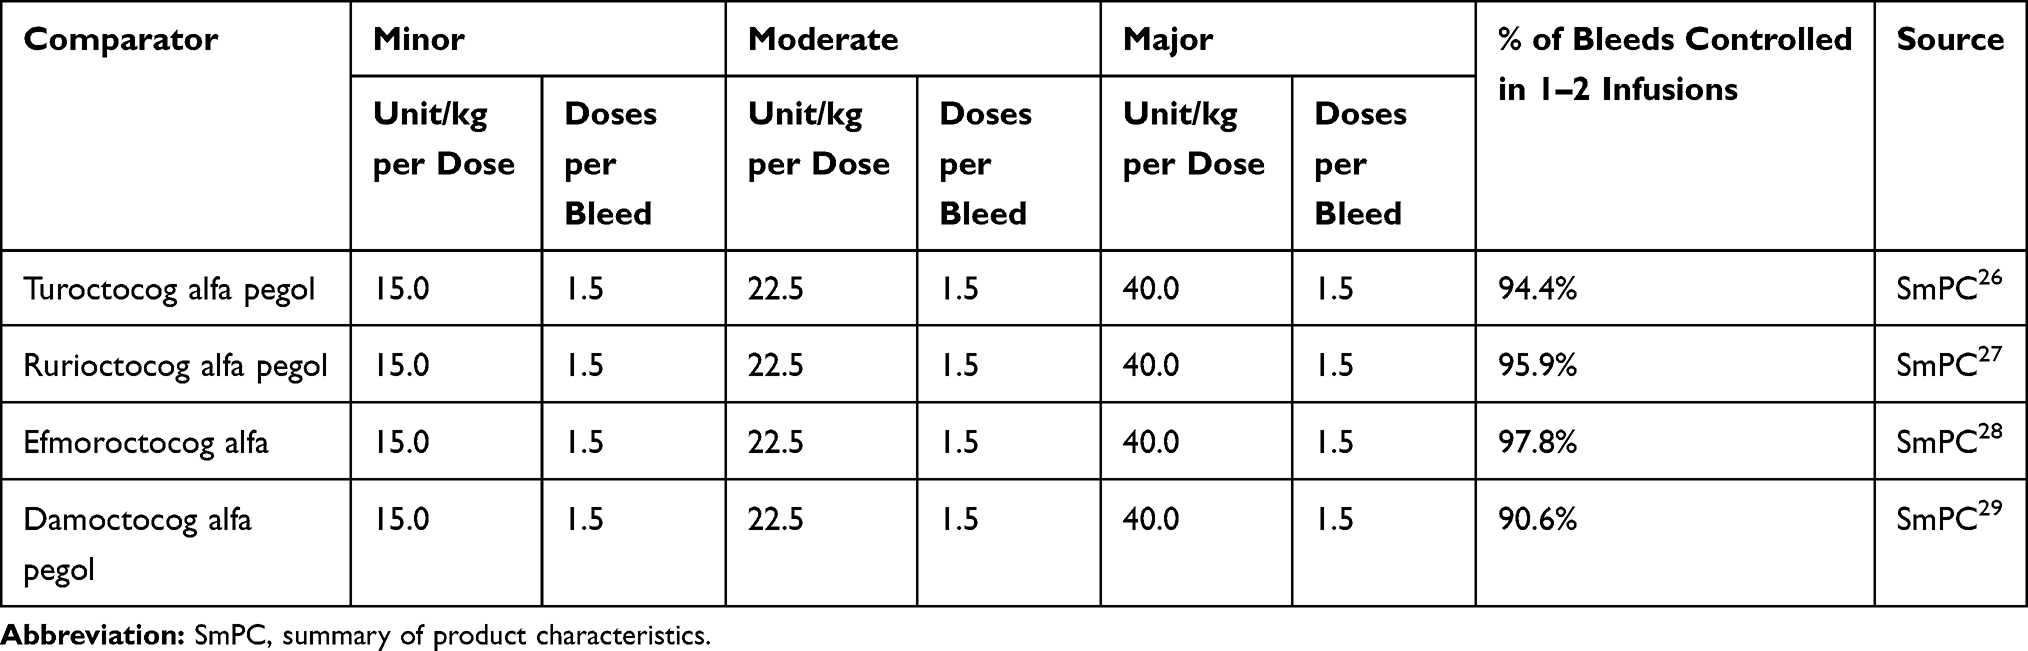 |
Table 2 Dosing for Breakthrough Bleeds |
Real-world evidence on the proportion of patients receiving each of the three licensed dosing schedules for damoctocog alfa pegol (twice weekly, every 5 days, every 7 days) was not available. Clinical trial information was therefore used to determine the proportion of patients on each dosing schedule. Damoctocog alfa pegol has 3 dosing schedules tested in the PROTECT-VIII trials: 30–40 IU/kg twice a week, 45–60 IU/kg every 5 days, and 60 IU/kg once weekly. This was modelled as three separate dosing arms using the mid-point of these dosing ranges, with patients allocated to damoctocog alfa pegol receiving either the twice weekly dose, the every 5-day dose or the every 7-day dose. The efficacy of all doses was assumed to be the same, as the clinical trial design ensured patients moved to a more frequent dosing regimen if they experienced more bleeds.29,36,37 The efficacy used for all three dosing regimens was the PK modelled efficacy of the twice weekly dosing. The twice weekly dose was used as the base case for the PK modeling, since that is the regimen tested in both frequent bleeders (patients with ≥2 bleeds in the run-in period) and infrequent bleeders (patients with ≤1 bleed in the run-in period) in the PROTECT VIII trial, whereas the every 5 days and every 7 days regimens were only tested in infrequent bleeders. A proportion of patients receiving the every 5 days and every 7 days regimens was used in the cost component of the base case modeling, i.e., the prophylaxis cost was based on a combination of patients receiving twice weekly, every 5 days and every 7 days dosing. The model assumed that the proportion of adult patients receiving the every 5-day and every 7-day dose was 23.1% and 14.5%, respectively. These proportions were calculated according to Equations S3 and S4 (see supporting information). As the damoctocog alfa pegol trial design did not allow for patients to choose whether to be re-randomized to the less frequent dosing regimen,37 the proportion of patients who would have chosen to be re-randomized if given the choice was assumed to be the same as for turoctocog alfa pegol (55/120).38 To calculate the proportion of adult patients receiving each dose, this percentage was multiplied by the proportion of patients who were eligible for re-randomization in PROTECT VIII (97/114),37 multiplied by the proportion of patients eligible for receiving each dosing regimen and who ended the trial on this dosing regimen.37 The remaining proportion of patients receiving the twice weekly dose was therefore assumed to be 62.4%. It is noted that the recommended dosing schedule for damoctocog alfa pegol is 45–60 IU/kg every 5 days, to be adjusted to 60 IU/kg every 7 days or 30–40 IU/kg twice weekly29 and as such, the proportion receiving the twice weekly dose is likely to be lower in clinical practice than in this analysis.
Economic Evaluation
Costs and utilities were calculated based on the number of bleeds experienced in each cycle, and time spent in each health state throughout the cycle, aggregated over the model time horizon. Cost outcomes included total and disaggregated costs, total FVIII prophylaxis costs, breakthrough bleed resolution costs, and resource use costs (consultations, specialists [excluding diet and nutrition support], blood tests, other tests and bleed-related hospitalizations).
The cost of FVIII prophylactic treatment per cycle was calculated using the number of units used per cycle. FVIII treatment costs used in the economic model were based on the SmPC range mid-point, which was also used for the recent commissioning process. Pricing assumptions were required due to the operation of a tender system in the UK, and lack of publicly available prices for all comparator treatments. As UK costs per unit were not available for rurioctocog alfa pegol, efmoroctocog alfa, and damoctocog alfa pegol, these were calculated by assuming parity in annual prophylaxis treatment costs to turoctocog alfa pegol, which has a UK list price of £0.85 per unit (Table 3). Our analysis assumed equivalence in annual prophylaxis costs rather than IU price, as any analysis assuming the same IU price would not account for differences in recommended prophylaxis dosing. Health Survey for England (HSE) statistics were used to populate the mean weight in kilograms for patients in the model (Table S2; supporting information) and therefore, calculate the total FVIII consumption per patient.39,40
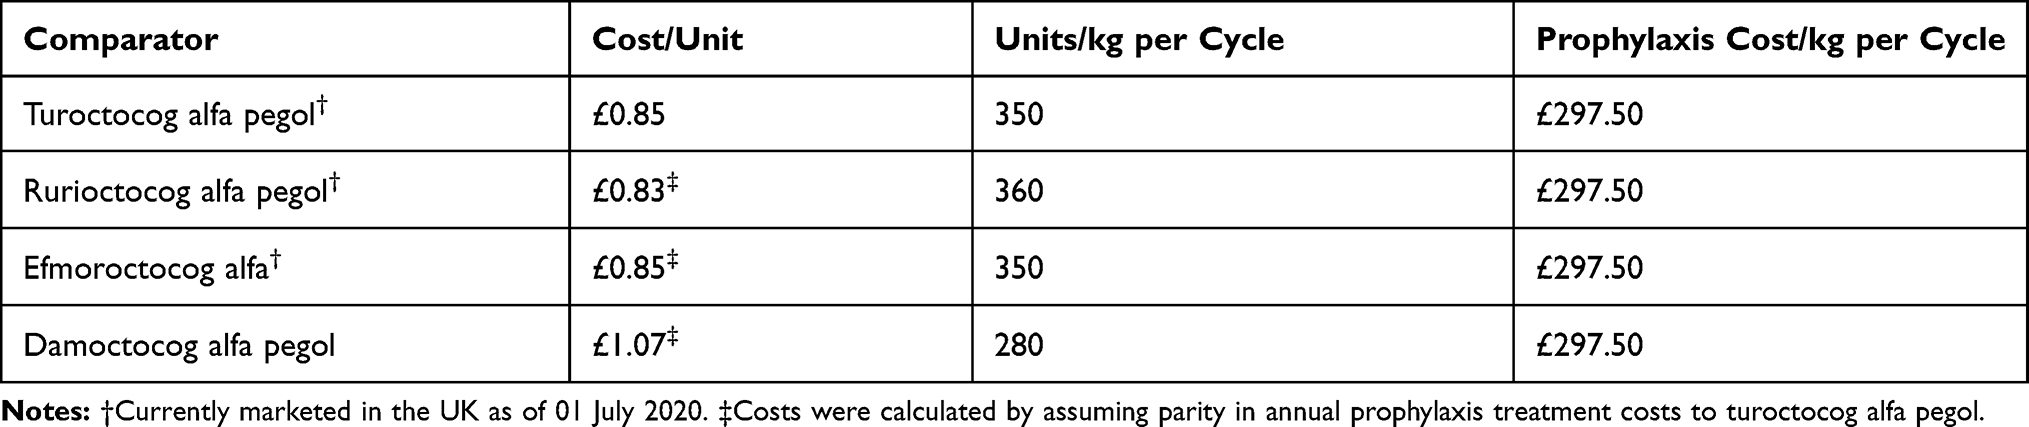 |
Table 3 FVIII Treatment Costs Used in the Economic Model |
Breakthrough bleed costs are informed by the treatment cost associated with the FVIII product used to resolve the bleed and result in an increased resource use along with a reduction in utility on the day of the bleed. Dosing for breakthrough bleeds was assumed to be the same for each treatment, with the proportion of bleeds controlled in 1–2 injections sourced from the respective SmPC.
Resource use costs were applied per cycle for all patients with severe hemophilia as a background cost, and also per severe bleeding event (Table S7; supporting information). Estimates for these costs were informed by interviews with three UK clinical experts, and included costs due to hematologist consultation, hospital days, physiotherapist visits, X-ray, MRI, ultrasonography and coagulation tests. Based on these estimates, patients with severe hemophilia incurred a total medical resource use cost of £64.95 per 28-day cycle (ie, applied equally for all FVIII therapies). Additional resource use costs of £566.47 were also applied for each severe bleed event. In this analysis, no additional resource use costs were applied to minor/moderate bleeds.
Population utility values in the model were calculated as a function of age-specific general population utility values, health state disutility and the disutility associated with bleeding episodes. Utility values for the “Normal” (FVIII >50%) health state were calculated from age-adjusted and sex-adjusted UK general population data, using regression coefficients.41 UK-specific utility and disutility values for hemophilia were derived from a published utility valuation study in hemophilia.42 The utility/disutility values and general population utility regression model coefficients used in the economic model are reported in the supporting information (refer to Table S6 and Figure S1).
Bleeding related disutilities were applied to spontaneous and traumatic bleeds. For each spontaneous or traumatic bleed a patient experienced, the model applied a short-term reduction in utility for one day, as it was assumed that bleeds would be treated and resolved in this time. Values informing these disutilities are presented in Table S5 (supporting information).
Given that each treatment has an explicit dosing range within the respective EMA SmPCs, a scenario analysis was conducted considering the lowest and highest recommended doses.
Incremental cost-effectiveness ratio (ICER) values have not been reported in our analyses because prophylaxis costs per FVIII therapy are assumed to be equivalent to turoctocog alfa pegol (per cycle), since factor prophylaxis costs are usually the primary cost driver in hemophilia,43 and therefore it is anticipated that there is limited value in presenting resulting ICER values.
Results
Number of Bleeds
Discounted, cumulative bleeding episodes per patient over the 70-year time horizon are summarized in Table 4. Turoctocog alfa pegol prophylaxis resulted in the fewest traumatic, spontaneous, and joint bleeds of the four EHL FVIII treatments modelled. Prophylaxis with this EHL FVIII treatment was associated with a reduction in total traumatic and spontaneous bleeds of between 8% and 19% compared with rurioctocog alfa pegol, efmoroctocog alfa and damoctocog alfa pegol, and a reduction in spontaneous bleeds of between 6% and 11%. It should be noted that the number of traumatic and spontaneous bleeds may not sum to “all bleeds” as these items were derived from separate regressions.
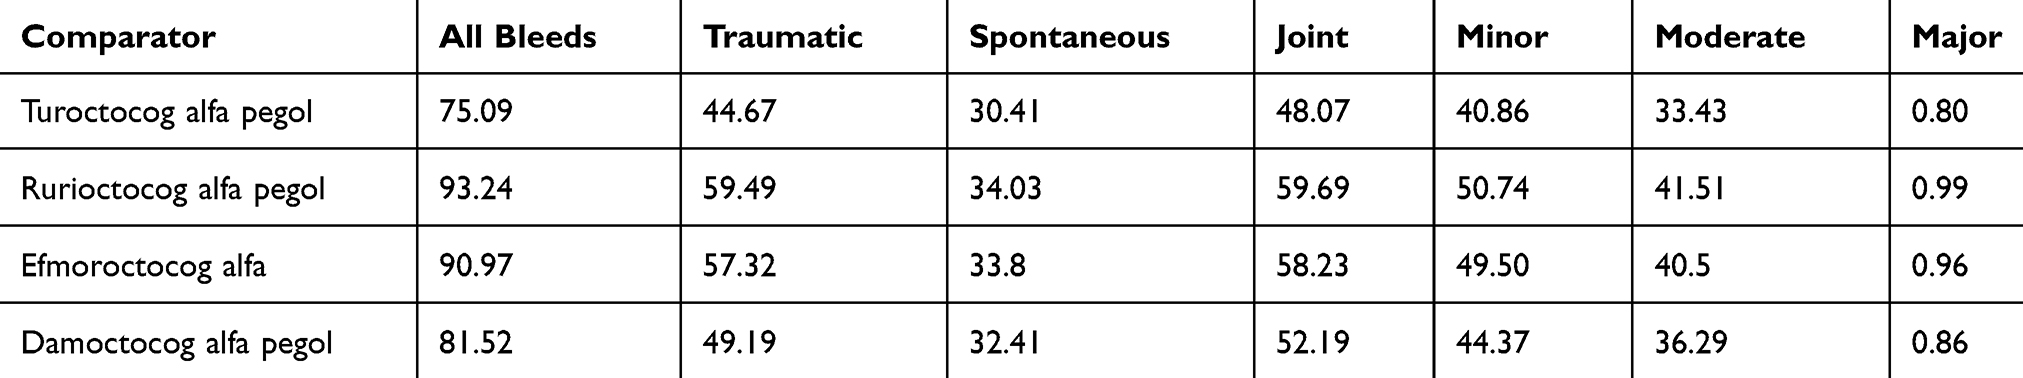 |
Table 4 Modelled Bleeding Episodes per Patient Over a 70-Year Time Horizon (Discounted) |
Costs
Modelled discounted costs are summarized in Table 5. In all cases, the cost of FVIII prophylaxis accounted for the largest share (97%) of total costs, and resource use the smallest share (0.67–0.68%). Breakthrough bleed resolution costs accounted for 1.9–2.7% of total costs. Costs due to FVIII prophylaxis were the same for each treatment, as the cost/unit values for rurioctocog alfa pegol, efmoroctocog alfa and damoctocog alfa pegol were calculated by assumed price matching to turoctocog alfa pegol on an annual prophylaxis cost basis. Prophylaxis with turoctocog alfa pegol resulted in the lowest breakthrough bleed resolution costs and lowest resource use costs of all the EHL FVIII treatments modelled. Combined breakthrough bleed resolution and resource use costs were 9–25% lower for turoctocog alfa pegol versus comparators.
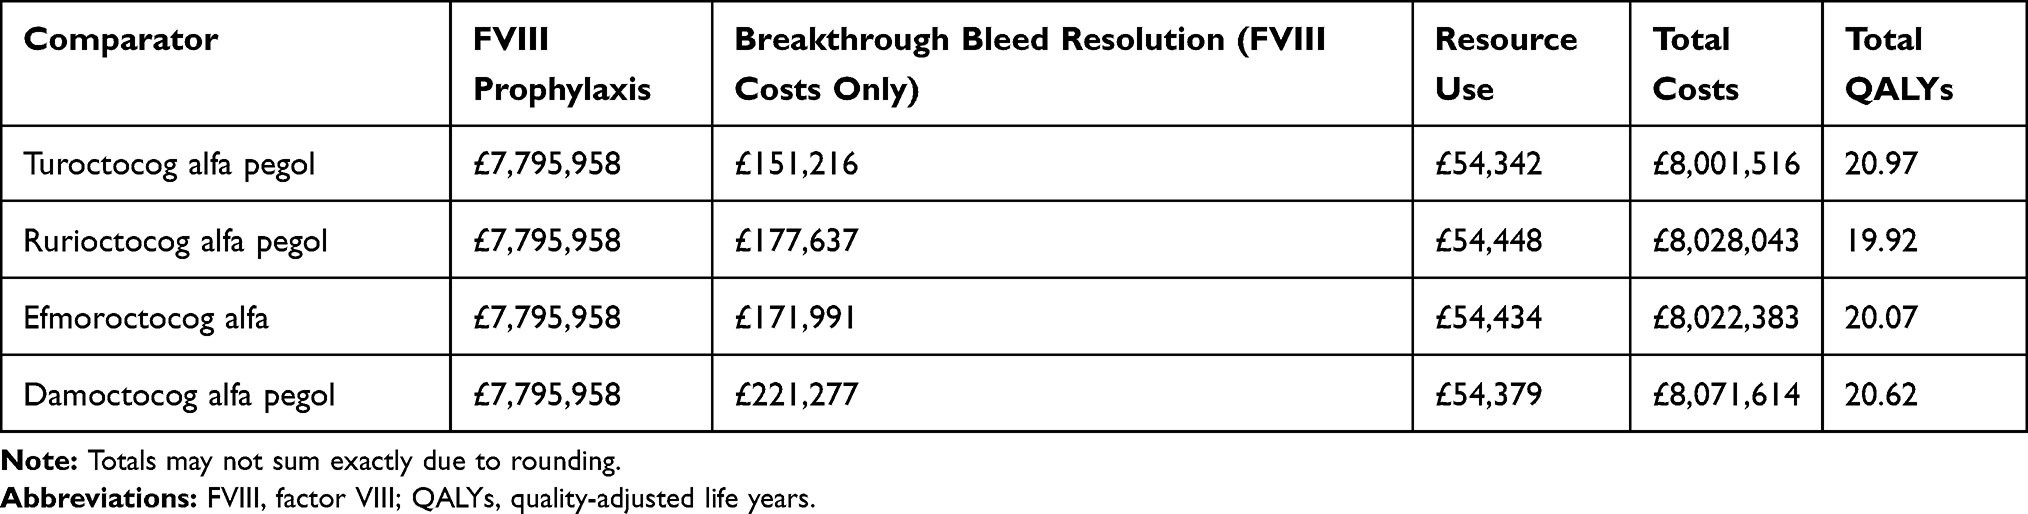 |
Table 5 Modelled Costs and QALYs per Patient Over a 70-Year Time Horizon, by Category (Discounted) |
Total QALYs
Modelled discounted QALYs are presented in Table 5. In the base case scenario, prophylaxis with turoctocog alfa pegol was associated with the most QALYs of the comparators studied, representing a discounted QALY gain of 0.35–1.05 compared with the other treatments. Rurioctocog alfa pegol prophylaxis resulted in the least QALYs.
Dosing Scenario Analysis
A scenario analysis was undertaken to model bleeds, costs and QALYs using low and high dosing regimens stated in the EMA SmPCs for each product (Table 6). Only one dosing regimen was stated in the SmPC for turoctocog alfa pegol; the dosing parameters, and therefore modelled outcomes, were the same for this treatment as those presented in the base case. Unlike the base case for damoctocog alfa pegol, it was assumed that varying the dose impacts the efficacy.
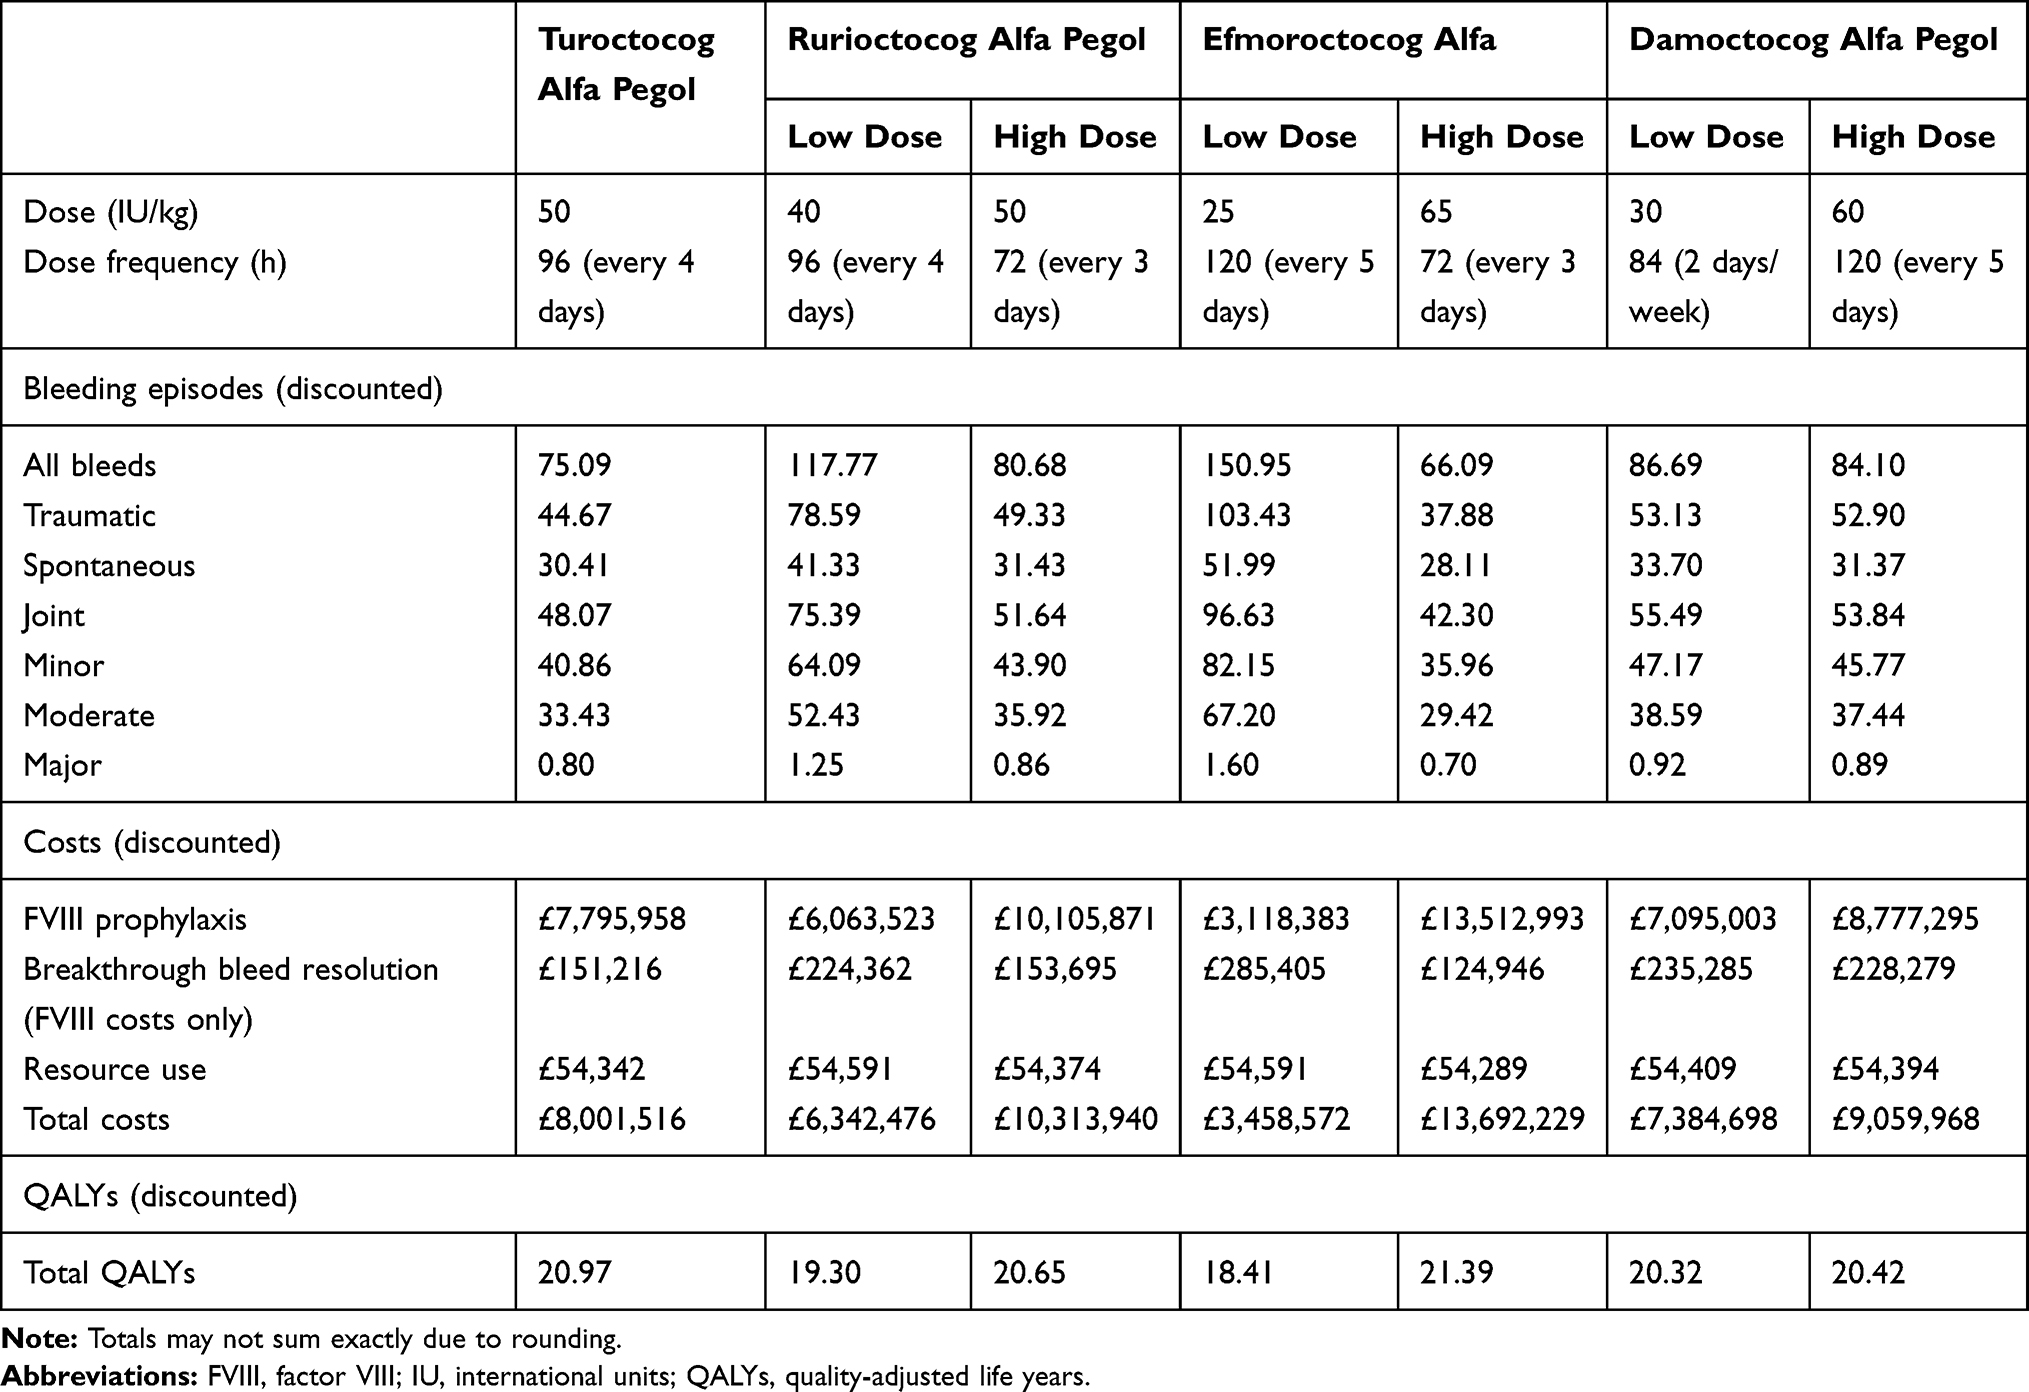 |
Table 6 Low and High Dosing Scenarios: Summary of Discounted Bleeds, Costs and QALYs per Patient, Over a 70-Year Time Horizon |
In the low-dose scenario, turoctocog alfa pegol prophylaxis resulted in the fewest cumulative bleeding episodes (representing a reduction in bleeds of between 13% and 50% vs comparators) and highest QALYs (an incremental gain of between 0.65 and 2.56) of the modelled treatments. Treatment with turoctocog alfa pegol was also associated with the highest total costs in this scenario, having the largest prophylaxis costs of the comparators.
In the high-dose scenario, prophylaxis with efmoroctocog alfa resulted in the fewest cumulative bleeds of the studied treatments (12% fewer bleeding episodes than with turoctocog alfa pegol). Despite utilizing the higher dosing parameters stated in the SmPC for rurioctocog alfa pegol, prophylaxis with turoctocog alfa pegol still resulted in 7% fewer cumulative bleeds and an incremental QALY gain of 0.32 compared with rurioctocog alfa pegol, and 11% fewer cumulative bleeds and an incremental QALY gain of 0.55 compared with damoctocog alfa pegol. Turoctocog alfa pegol prophylaxis was also associated with the lowest total costs in this dosing scenario.
Discussion
The model presented here used clinical data from the pathfinder 2 phase III trial to predict FVIII levels and comparative bleed outcomes for four EHL FVIII treatments. Breakthrough bleed resolution and resource costs, as well as QALYs, were subsequently estimated from a UK NHS perspective over a 70-year time horizon. To the best of our knowledge, this is the first health economics analysis in hemophilia A to use PK data from a clinical study population to predict comparative ABRs across EHL FVIII products, and the first published health economics analysis for turoctocog alfa pegol.
In the base-case scenario, prophylactic use of turoctocog alfa pegol in adult and adolescent patients with severe hemophilia A was found to be both more efficacious and cost-saving versus other EHL FVIII treatments. Dose and dose frequency are major drivers of bleeding frequency, costs and QALYs, as indicated by the scenario analysis, underlying the potential uncertainty in reported results based on any local variation in dose and dose frequency.
It is important to note that although the mainstay of FVIII prophylaxis in hemophilia A has aimed to maintain FVIII levels above a target threshold, factor activity alone is not the only component of effective treatment but also joint status, individual bleed patterns, lifestyle and physical activity. As reported through the pathfinder clinical trial program, effective prophylaxis with turoctocog alfa pegol was achieved with simplicity of dosing. Real-world evidence is needed for all four comparator treatments to confirm the results from the analysis.
The model presented here is associated with a number of important limitations. Although factor activity is a strong determinant of bleed risk, bleeding may be influenced by patient baseline joint health and physical activity levels. Data on target joints were not captured in the Pathfinder 2 trial, and thus the long-term consequences of joint bleeds were not captured in the model. Studies from Spain44 and Sweden45 show that early long-term high-dose prophylaxis preserves normal joint health and therefore we assumed that long-term consequences of joint bleeds may not occur in our modelled cohort of patients. Moreover, joint damage is progressive, and differences between treatments would not be observed over a clinical trial timeframe. Most patients enrolled in Pathfinder 2 will have received secondary prophylaxis, and will have experienced an element of joint damage before the first joint bleed. The long-term impact of joint bleeds should be considered as an aspect of future work.
It was also assumed that the modelled relationship between ABR and FVIII levels based on Pathfinder 2 trial data was consistent for all FVIII comparators, given that all comparator trials considered a severe hemophilia A patient cohort, with similar inclusion and exclusion criteria. We anticipate that further research into the relationship between FVIII activity and bleeding frequency across the FVIII comparators within this analysis will serve to enhance the validity of the model. In addition, it was assumed that the published PK parameters for each comparator used in this analysis are directly comparable as the inclusion/exclusion criteria for the trials from which the PK data came from are similar. We are not aware of any outliers or specific factors that might disproportionately influence the overall PK parameters for a particular comparator. In the absence of a head-to-head comparison or crossover trial, we believe that our approach is appropriate. The model also used utilities obtained using health state vignettes which were valued by the general population using a time trade-off method. The validity of the obtained utilities is therefore very dependent upon the health state vignettes that were used to elicit the values. Furthermore, greater standardization of trial designs would support more consistent reporting of outcomes such as joint bleeds, allowing for accurate modeling comparisons of long-term joint bleed impact between comparators.
Pricing assumptions were required for the cost analysis due to the lack of availability of publicly available prices for all comparators in the UK. Consequently, treatment costs were calculated for comparators by assuming parity in annual prophylaxis treatment costs to turoctocog alfa pegol, and may not be reflective of realized tender prices. For this reason, ICER outcomes are not reported. Furthermore, perioperative care resulting from joint surgery due to long-term joint damage was not modelled in our analysis, and therefore the true costs to the healthcare system for treatments may be underestimated. It should also be noted that the model covers severe patients only, as clinical trial data for the studied treatments are only available for this population. Patients with mild or moderate hemophilia A may also require prophylaxis treatment, but these patients have not been considered within this analysis.
Cost-effectiveness is one key factor among several considered by decision-makers in national reimbursement processes, including those of the UK. Taking into account the pricing and other assumptions summarized above, our model highlights the potential for cost savings with turoctocog alfa pegol compared to comparators. These cost savings could, for example, be reinvested in the management of hemophilia A or applied elsewhere in the healthcare system.
If accurate prophylaxis pricing data were available across all FVIII comparators within the UK, the approach reported within this analysis may be extended to perform a full cost-effectiveness analysis to produce ICER results and potentially guide reimbursement decisions. We anticipate that a similar modeling approach may be used to predict comparative bleed outcomes in other bleeding disorders, including hemophilia B, where there is a similar lack of comparative evidence.
Conclusions
A PD–PK decision model was developed to predict comparative bleed outcomes of adolescents and adults with hemophilia A receiving treatment with various EHL FVIII therapies. In the base case scenario, prophylaxis with turoctocog alfa pegol resulted in the fewest cumulative bleeds, lowest breakthrough bleed resolution and resource costs, and most QALYs of the EHL FVIII treatments modelled.
Abbreviations
ABR, annual bleeding rate; EHL, extended half-life; EMA, European Medicines Agency; FVIII, factor VIII; FIX, factor IX; HSE, Health Survey for England; ICER, incremental cost-effectiveness ratio; NHF-MASAC, National Hemophilia Foundation Medical and Scientific Advisory Council; NICE, National Institute for Health and Care Excellence; PD, pharmacodynamic; PK, pharmacokinetic; PTPs, previously treated patients; PUPs, previously untreated patients; QALYs, quality-adjusted life years; SmPC, summary of product characteristics; UKHCDO, United Kingdom Haemophilia Centre Doctors’ Organisation; VSS, volume of distribution at steady state; WFH, World Federation of Hemophilia.
Acknowledgments
We acknowledge Richard Massey and James Baker-Knight (Decision Resources Group) for medical writing support.
Author Contributions
All authors made a significant contribution to the work reported, whether that is in the conception, study design, execution, acquisition of data, analysis and interpretation, or in all these areas; took part in drafting, revising or critically reviewing the article; gave final approval of the version to be published; have agreed on the journal to which the article has been submitted; and agree to be accountable for all aspects of the work.
Funding
This project was fully funded by Novo Nordisk A/S. Decision Resources Group received a consultancy fee for model development and medical writing.
Disclosure
Gary Benson is an employee of Northern Ireland Haemophilia Comprehensive Care Centre and Thrombosis Unit, Belfast City Hospital, Belfast, UK. Tim Morton is an employee of DRG, Bicester, UK. Huw Thomas is an employee of Novo Nordisk Ltd., Gatwick, UK. Xin Ying Lee is an employee of Novo Nordisk A/S, Søborg, Denmark. The authors report no other conflicts of interest in this work.
References
1. Friedman KDRGM. Inherited coagulation disorders. In: Wilkins LW, editor. Wintrobes Clinical Hematology.
2. Berntorp E, Shapiro AD. Modern haemophilia care. Lancet. 2012;379(9824):1447–1456. doi:10.1016/S0140-6736(11)61139-2
3. Stonebraker JS, Bolton-Maggs PHB, Michael Soucie J, Walker I, Brooker M. A study of variations in the reported haemophilia A prevalence around the world. Haemophilia. 2010;16(1):20–32. doi:10.1111/j.1365-2516.2009.02127.x
4. National Hemophilia Foundation. Hemophilia A. https://www.hemophilia.org/Bleeding-Disorders/Types-of-Bleeding-Disorders/Hemophilia-A.
5. den Uijl IE, Fischer K, Van Der Bom JG, Grobbee DE, Rosendaal FR, Plug I. Analysis of low frequency bleeding data: the association of joint bleeds according to baseline FVIII activity levels. Haemophilia. 2011;17(1):41–44. doi:10.1111/j.1365-2516.2010.02383.x
6. Srivastava AB, Mauser-Bunschoten AK, Key EP, Kitchen NS, Llinas S. A; et al. Guidelines for the management of hemophilia. Haemophilia. 2013;19(1):e1–e47.
7. Kumar RD, Dunn A, Carcao M. Changing paradigm of hemophilia management: extended half-life factor concentrates and gene therapy. Semin Thromb Hemost. 2016;42(1):18–29. doi:10.1055/s-0035-1568877
8. Shah A, Coyle T, Lalezari S, et al. BAY 94-9027, a PEGylated recombinant factor VIII, exhibits a prolonged half-life and higher area under the curve in patients with severe haemophilia A: comprehensive pharmacokinetic assessment from clinical studies. Haemophilia. 2018;24(5):733–740. doi:10.1111/hae.13561
9. Keeling DT, Tait C, Makris M. Guideline on the selection and use of therapeutic products to treat haemophilia and other hereditary bleeding disorders. A United Kingdom Haemophilia Center Doctors‘ Organisation (UKHCDO) guideline approved by the British Committee for Standards in Haematology.. Haemophilia. 2008;14(4):671–684. doi:10.1111/j.1365-2516.2008.01695.x
10. National Hemophilia Foundation Medical and Scientific Advisory Council (MASAC). MASAC Recommendations Concerning Products Licensed for the Treatment of Hemophilia and Other Bleeding Disorders; 2018. Available from: https://www.hemophilia.org/Researchers-Healthcare-Providers/Medical-and-Scientific-Advisory-Council-MASAC/MASAC-Recommendations/MASAC-Recommendations-Concerning-Products-Licensed-for-the-Treatment-of-Hemophilia-and-Other-Bleeding-Disorders.
11. World Federation of Hemophilia. Report on the Annual Global Survey 2018; October 2019; 2019; http://www1.wfh.org/publications/files/pdf-1731.pdf.
12. European Medicines Agency. Guideline on the clinical investigation of recombinant and human plasma-derived factor VIII products; 26 July 2018. Available from: https://www.ema.europa.eu/documents/scientific-guideline/draft-guideline-clinical-investigation-recombinant-4-human-plasma-derived-factor-viii-products_en.pdf.
13. Iorio A, Krishnan S, Myrén KJ, et al. Indirect comparisons of efficacy and weekly factor consumption during continuous prophylaxis with recombinant factor VIII Fc fusion protein and conventional recombinant factor VIII products. Haemophilia. 2017;23(3):408–416. doi:10.1111/hae.13160
14. Pai M, Yeung CHT, Akl EA, et al. Strategies for eliciting and synthesizing evidence for guidelines in rare diseases. BMC Med Res Methodol. 2019;19(1):67. doi:10.1186/s12874-019-0713-0
15. European Medicines Agency. Guideline on clinical investigation of recombinant and human plasma-derived factor VIII products; 26 July 2018. Available from https://www.ema.europa.eu/en/documents/scientific-guideline/guideline-clinical-investigation-recombinant-human-plasma-derived-factor-viii-products-revision-2_en.pdf.
16. Oldenburg J. Optimal treatment strategies for hemophilia: achievements and limitations of current prophylactic regimens. Blood. 2015;125(13):2038–2044. doi:10.1182/blood-2015-01-528414
17. Manco-Johnson MJ, Abshire TC, Shapiro AD, et al. Prophylaxis versus episodic treatment to prevent joint disease in boys with severe hemophilia. N Eng J Med. 2007;357(6):535–544. doi:10.1056/NEJMoa067659
18. Miners AH, Krishnan S, Pasi KJ. Predicting the outcomes of using longer-acting prophylactic factor VIII to treat people with severe hemophilia A: a hypothetical decision analysis. J Thrombosis Haemostasis. 2016;14(11):2141–2147. doi:10.1111/jth.13440
19. van Keep M, Hoxer CS, Hemstock M, Groth AV, Knight C. A new modeling approach allowing prediction and comparison of the long-term outcomes of treatments for hemophilia B. J Comp Eff Res. 2017;7(1):39–48. doi:10.2217/cer-2017-0028
20. Novo Nordisk A/S. Data on File. Evaluation of Safety and Efficacy, Including Pharmacokinetics, of NNC 0129-0000-1003 When Administered for Treatment and Prophylaxis of Bleeding in Subjects with Haemophilia a (Pathfinder™2). Novo Nordisk A/S; 2018.
21. Giangrande PA, Chowdary T, Ehrenforth P, Hanabusa S, Leebeek H. FW; et al. Clinical evaluation of glycoPEGylated recombinant FVIII: efficacy and safety in severe haemophilia A. Thromb Haemost. 2017;117(2):252–261. doi:10.1160/TH16-06-0444
22. NICE. NICE glossary. Available from: https://www.nice.org.uk/glossary?letter=q.
23. Groth AV, Agersø H, Matytsina I, Tripkovic N, Overgaard RV. Effect of Factor VIII Coagulation Activity (FVIII:C) on the Risk of Spontaneous Bleeding Following Treatment with rFVIII (Turoctocog Alfa) in Patients with Severe Hemophilia A. Poster Presented at the World Federation of Hemophilia World Congress, July 24-26, 2016. Orlando, FL. USA; 2016.
24. Hilbe J Negative Binomial Regression 2011: 1–14.
25. Tiede A, Brand B, Fischer R, et al. Enhancing the pharmacokinetic properties of recombinant factor VIII: first-in-human trial of glycoPEGylated recombinant factor VIII in patients with hemophilia A. J Thrombosis Haemostasis. 2013;11(4):670–678. doi:10.1111/jth.12161
26. European Medicines Agency. Summary of product characteristics - Esperoct (EU). Available from https://www.ema.europa.eu/en/documents/product-information/esperoct-epar-product-information_en.pdf.
27. European Medicines Agency. Summary of product characteristics - ADYNOVI (EU). Available from https://www.ema.europa.eu/en/documents/product-information/adynovi-epar-product-information_en.pdf.
28. European Medicines Agency. Summary of product characteristics - ELOCTA (EU). Available from https://www.ema.europa.eu/en/documents/product-information/elocta-epar-product-information_en.pdf.
29. European Medicines Agency. Summary of product characteristics - Jivi (EU). Available from https://www.ema.europa.eu/en/documents/product-information/jivi-epar-product-information_en.pdf.
30. National life tables - 2015-2017; 2019. Available from https://www.ons.gov.uk/peoplepopulationandcommunity/birthsdeathsandmarriages/lifeexpectancies/datasets/nationallifetablesunitedkingdomreferencetables.
31. Tagliaferri A, Rivolta GF, Iorio A, et al. Mortality and causes of death in Italian persons with haemophilia, 1990–2007. Haemophilia. 2010;16(3):437–446. doi:10.1111/j.1365-2516.2009.02188.x
32. National Institute for Health and Care Excellence. Guide to the methods of technology appraisal 2013. Available from: https://www.nice.org.uk/process/pmg9/chapter/the-reference-case.
33. Fischer K, Lassila R, Peyvandi F, et al. Inhibitor development in haemophilia according to concentrate. Thromb Haemost. 2015;113(05):968–975. doi:10.1160/TH14-10-0826
34. Kempton CL. Inhibitors in previously treated patients: a review of the literature. Haemophilia. 2010;16(102):61–65. doi:10.1111/j.1365-2516.2010.02235.x
35. Manco-Johnson MJ, Kempton CL, Reding MT, et al. Randomized, controlled, parallel-group trial of routine prophylaxis vs. on-demand treatment with sucrose-formulated recombinant factor VIII in adults with severe hemophilia A (SPINART). J Thrombosis Haemostasis. 2013;11(6):1119–1127. doi:10.1111/jth.12202
36. US Food and Drug Administration. Clinical review – JIVI; August 23, 2018. Available from https://www.fda.gov/media/116354/download.
37. Reding MT, Ng HJ, Poulsen LH, et al. Safety and efficacy of BAY 94-9027, a prolonged-half-life factor VIII. J Thrombosis Haemostasis. 2017;15(3):411–419. doi:10.1111/jth.13597
38. Curry N, Albayrak C, Escobar M, et al. Once-weekly prophylaxis with glycoPEGylated recombinant factor VIII (N8-GP) in severe haemophilia A: safety and efficacy results from pathfinder 2 (randomized phase III trial). Haemophilia. 2019;25(3):373–381. doi:10.1111/hae.13712
39. Digital NHS. Health Survey for England, 2017: children’s health - tables. Weight for age - boys (0-15 years). Available from: https://digital.nhs.uk/data-and-information/publications/statistical/health-survey-for-england/2017.
40. Shetty A, Syn WK. Health and economic burden of nonalcoholic fatty liver disease in the United States and its impact on veterans. Fed. 2019;36(1):14–19.
41. Ara R, Brazier JE. Populating an economic model with health state utility values: moving toward better practice. Value Health. 2010;13(5):509–518. doi:10.1111/j.1524-4733.2010.00700.x
42. Hoxer CS, Zak M, Benmedjahed K, Lambert J. Utility valuation of health states for haemophilia and related complications in Europe and in the United States. Haemophilia. 2019;25(1):92–100. doi:10.1111/hae.13634
43. O’Hara J, Hughes D, Camp C, Burke T, Carroll L, Diego D-AG. The cost of severe haemophilia in Europe: the CHESS study. Orphanet J Rare Dis. 2017;12(1):106. doi:10.1186/s13023-017-0660-y
44. Lucia JF, Aznar JA, ABAD-FRANCH L. Prophylaxis therapy in haemophilia A: current situation in Spain. Haemophilia. 2011;17(1):75–80. doi:10.1111/j.1365-2516.2010.02378.x
45. Khawaji MA, Astermark J, Berntorp E. Lifelong prophylaxis in a large cohort of adult patients with severe haemophilia: a beneficial effect on orthopaedic outcome and quality of life. Eur J Haematol. 2012;88(4):329–335. doi:10.1111/j.1600-0609.2012.01750.x
 © 2021 The Author(s). This work is published and licensed by Dove Medical Press Limited. The full terms of this license are available at https://www.dovepress.com/terms.php and incorporate the Creative Commons Attribution - Non Commercial (unported, v3.0) License.
By accessing the work you hereby accept the Terms. Non-commercial uses of the work are permitted without any further permission from Dove Medical Press Limited, provided the work is properly attributed. For permission for commercial use of this work, please see paragraphs 4.2 and 5 of our Terms.
© 2021 The Author(s). This work is published and licensed by Dove Medical Press Limited. The full terms of this license are available at https://www.dovepress.com/terms.php and incorporate the Creative Commons Attribution - Non Commercial (unported, v3.0) License.
By accessing the work you hereby accept the Terms. Non-commercial uses of the work are permitted without any further permission from Dove Medical Press Limited, provided the work is properly attributed. For permission for commercial use of this work, please see paragraphs 4.2 and 5 of our Terms.