")
Back to Journals » OncoTargets and Therapy » Volume 9
Long noncoding RNA expression profile analysis of colorectal cancer and metastatic lymph node based on microarray data
Authors Yang P, Xu Z, Chen T , He Z
Received 11 December 2015
Accepted for publication 17 February 2016
Published 26 April 2016 Volume 2016:9 Pages 2465—2478
DOI https://doi.org/10.2147/OTT.S102348
Checked for plagiarism Yes
Review by Single anonymous peer review
Peer reviewer comments 2
Editor who approved publication: Professor Min Li
Peng Yang,1,* Zi-Peng Xu,1,* Tao Chen,1 Zhen-Yu He2
1The Second Clinical Medical College of Nanjing Medical University, 2Department of General Surgery, The Second Affiliated Hospital of Nanjing Medical University, Nanjing, Jiangsu Province, People’s Republic of China
*These authors contributed equally to this work
Abstract: Long noncoding RNAs (lncRNAs) are emerging as an important part of biological progress in cancers, yet the aberrant lncRNAs implicated in colorectal cancer (CRC) with lymph node metastasis remain unknown. In this study, a total of 390 lncRNA transcripts and 508 mRNA transcripts were dysregulated in tumor tissues compared with paired metastatic lymph nodes. Functional prediction showed that lots of lncRNAs might be involved in biological pathways related to CRC metastasis by cis-regulation and trans-regulation of coexpressed genes. As a representative, ENST00000430471 was associated with cell proliferation and invasion of CRC cells. These results provided support for further investigations of the metastatic pathogenesis of CRC.
Keywords: colorectal cancer, lymph node metastasis, long noncoding RNA, microarray, ENST00000430471
Introduction
Colorectal cancer (CRC) is one of the most common causes of cancer-related deaths in the world, leading to 600,000 deaths each year worldwide.1,2 Clinically, a considerable number of CRC patients with metastasis, such as blood metastasis and lymph node metastasis, fail to respond well with the help of current treatment regimens. Lymph node metastasis is the most common metastatic site, and ~50% of CRC patients with lymph node metastasis experience disease recurrence.3,4 Therefore, disclosing the molecular mechanisms underlying metastasis is urgently needed for developing effective therapies and improving patients’ prognosis.
Long noncoding RNAs (lncRNAs), unable to be translated into proteins and >200 nt in length, have emerged as an important aspect of biology.5,6 Evidences suggest that they are capable of controlling protein-coding and noncoding genes and interacting with known cancer genes.7–9 For instance, HOTAIR, highly expressed in breast tumors, could promote metastasis through reprogramming the chromatin state.10 Several lncRNAs that play significant roles in tumorigenesis and might be potential biomarkers for CRC diagnostic and prognosis have been proposed in our previous study.11 However, the roles that lncRNAs play in the progress of lymph node metastasis of CRC remain unknown.
To profile the lncRNA expression patterns in tumor tissues of CRC compared with paired metastatic lymph node (MLN), the lncRNA microarray expression profile in three pairs of CRC tumor tissues compared with MLNs was presented in this study. Then, we predicted the potential functions of differentially expressed lncRNAs based on their coexpressed protein-coding genes. Next, a novel lncRNA, ENST00000430471, that displayed a higher expression level in MLNs compared with tumor tissues was selected for functional analysis and further study.
Patients and methods
Tissue collection
A total of 26 CRC patients who underwent surgical resections at The Second Affiliated Hospital of Nanjing Medical University from 2011 to 2012 were recruited for our study. These patients received neither chemotherapy nor radiotherapy prior to the operation. A written informed consent was obtained from all the patients, and approval was obtained from the ethics committee of The Second Affiliated Hospital of Nanjing Medical University. Two experienced pathologists collected lymph nodes from the CRC patients during the operation and stained them with hematoxylin and eosin. According to the hematoxylin and eosin staining results, the lymph nodes were divided into MLNs and normal lymph nodes. All samples were frozen in liquid nitrogen until further analysis. For microarray analysis, three pairs of samples (three tumor tissues and three MLNs) from the CRC patients were used.
Microarray expression profiling
Three pairs of CRC tumor tissues and MLNs were used to synthesize double-stranded complementary DNA (cDNA), which was labeled and hybridized on the SurePrint G3 Human Gene Expression 8x60K v2 Microarray (Agilent Technologies, Santa Clara, CA, USA). Processed slides were scanned with the Agilent G2505C Microarray Scanner (Agilent Technologies) after hybridization and washing. Raw data were extracted using Feature Extraction (version 10.7.1.1; Agilent Technologies). Then, quantification of normalization and subsequent data processing were performed using the GeneSpring software (version 12.0; Agilent Technologies). After that, raw signals from the microarray were log2 transformed and specific expression of mRNAs and lncRNAs were defined when the absolute value of fold change was >2 and P-value was <0.05. The microarray profiling was conducted by the OE Biotechnology Company (Shanghai, People’s Republic of China).
Coexpression network and functional prediction
According to the specific expressed genes, coexpression networks were built to identify the interactions among genes.12 First, Pearson’s correlation coefficient of the dysregulated lncRNA compared with that of each dysregulated mRNA was calculated to find its coexpressed mRNAs. The absolute value of 0.8 with a correlation P-value <0.05 was considered statistically significant. Then lncRNA gene functions were predicted using the hypergeometric cumulative distribution function based on the coexpression of mRNA using Gene Ontology (GO) and Kyoto Encyclopedia of Genes and Genomes (KEGG) annotations. The threshold of statistical significance was set as a P-value <0.05 and false discovery rate <0.01.
Evidence shows that several lncRNAs can exert their cis-regulating functions by recruiting remodeling factors to local chromatin.13 We defined cis-regulated genes as protein-coding genes coexpressed with one dysregulated lncRNA and within 300 kbp upstream or downstream in genomic distance in the same allele.
The core transcription factors (TFs) are trans-regulated by specific lncRNAs to participate in certain biological pathways.14,15 Thus, we compared the coexpressed mRNAs of these lncRNAs with the mRNAs that were regulatory targets of certain TFs to predict that these lncRNAs possibly participate in pathways regulated by these TFs. The lncRNA–TF network was constructed using hypergeometric cumulative distribution function of MATLAB 2012b (MathWorks, Natick, MA, USA). The graph of the lncRNA–TF network was drawn using Cytoscape 3.01 (Agilent Technologies and IBS; Agilent Technologies, Santa Clara, CA, USA).
As the lncRNA coexpression genes might participate in lncRNA-mediated gene regulation, we constructed the “TF–lncRNA–genes” network based on the interactions of lncRNAs and target coexpression genes as previously described.16 The three groups were generated based on the “TF–lncRNA” two-element network with the help of Cytoscape software.
RNA extraction and quantitative real-time polymerase chain reaction analysis
Total RNA was extracted from 26 snap frozen subsets and cultured cells using TRIzol reagent (Thermo Fisher Scientific, Waltham, MA, USA) according to the manufacturer’s protocol. For quantitative real-time polymerase chain reaction (qRT-PCR) analyses, RNA was reverse transcribed to cDNA by using a reverse transcription kit (Takara Biotechnology, Dalian, People’s Republic of China). Then, qRT-PCR was performed using SYBR Green (Takara Biotechnology) according to the manufacturer’s instructions. The qRT-PCR results were normalized to glyceraldehyde-3-phosphate dehydrogenase.
Cell culture
Three human CRC cell lines SW480, HCT116, and SW620 were obtained from the Cell Bank of the Chinese Academy of Medical Sciences (Shanghai, People’s Republic of China). Cells were cultured in Dulbecco’s Modified Eagle’s Medium (Thermo Fisher Scientific) in an atmosphere of 5% CO2 at 37°C. All the media were supplemented with 10% fetal bovine serum, penicillin, and streptomycin (Thermo Fisher Scientific).
Plasmid DNA transfection
According to the full-length ENST00000430471 sequence in Ensembl, the ENST00000430471 sequence was synthesized and subcloned into a pCDNA3.1 vector (Thermo Fisher Scientific). The empty vector was used as the control. The pCDNA-ENST00000430471 and empty vector were transfected into HCT116 cells seeded at six-well plates using Lipofectamine 2000 (Thermo Fisher Scientific), according to the manufacturer’s suggested protocol. The expression level of ENST00000430471 was detected by qRT-PCR.
Cell proliferation assay
The viability of HCT116 cells was assessed using the Cell Counting Kit-8 (CCK-8; Dojindo, Kumamoto, Japan) following the manufacturer’s instructions. CCK-8 solution was used to measure cell viability at 24 hours, 48 hours, and 72 hours after transfection. The absorbance value of each well was measured at 450 nM. For the colony formation assay, a total of 500 cells were seeded in six-well plates to allow colony formation for 2 weeks. The colonies were fixed with methanol and stained with Giemsa, and the number of colonies was counted after 20 minutes.
Flow-cytometric analysis
For the cell cycle analysis, transfected cells were fixed in 75% ethanol overnight. The cells were stained for 30 minutes with propidium iodide (50 μg/mL; Sigma-Aldrich Co., St Louis, MO, USA) and 0.25 mg/mL of RNase A (Sigma-Aldrich Co.). Next, the cells were analyzed by flow cytometry (FACScan; BD Biosciences, San Jose, CA, USA) using CellQuest software (BD Biosciences). The percentage of the cells in G0–G1, S, and G2–M phases was counted and compared.
For the cell apoptosis assay, the cells were treated with fluorescein isothiocyanate-Annexin V and propidium iodide in the dark, according to the manufacturer’s instructions. Then the cells were detected by flow cytometry with the help of CellQuest software. Cells were discriminated into dead cells, viable cells, early apoptotic cells, and late apoptotic cells. Next, the percentage of early apoptotic cells and late apoptotic cells was compared with empty vector from each experiment. Each assay was repeated in triplicate.
Cell migration and invasion assays
In migration assays, 3×10⁴ cells at 48 hours after transfection were seeded in the upper chamber of the wells in a 200 μL serum-free medium (8 μm pore size; EMD Millipore, Billerica, MA, USA); for the invasion assays, 1×10⁵ cells in serum-free medium were seeded in the upper chamber coated with Matrigel (BD Biosciences). The lower chambers were filled with 800 μL of 20% medium containing 20% fetal bovine serum. Following the incubation for 24 hours, cells on the filter surface were fixed with methanol, stained with 0.1% crystal violet, and photographed with a phase-contrast inverted microscope. Experiments were independently repeated three times.
Statistical analysis
The statistical significance of differences between groups was estimated by Student’s t-test on SPSS software (version 18.0; SPSS Inc., Chicago, IL, USA). A P-value of <0.05 was chosen for statistical significance. The results are reported as mean ± SD. All experiments were performed at least three times.
Results
lncRNA and mRNA expression profiles
Differentially expressed lncRNAs and mRNAs (fold change ≥2, P≤0.05) were observed in Figure 1. A total of 53 lncRNAs exhibited upregulated expression levels and 337 lncRNAs exhibited downregulated expression levels, whereas 102 mRNAs exhibited upregulated expression levels and 406 mRNAs exhibited downregulated expression levels in the tumor tissues compared with MLNs (Table 1). Among the dysregulated lncRNA transcripts, the most upregulated lncRNA was uc010fsr.1 (up 46.06), whereas ENST00000430471 (down 9.50) was the most downregulated lncRNA. These results suggested that these lncRNAs and mRNAs might also have common functions in facilitating the transfers of CRC tumor cells from the primary tumor to lymph nodes. Table 1 lists the top 20 dysregulated lncRNAs from our microarray. A novel lncRNA, ENST00000430471, that displayed the lowest expression in tumor tissues compared with MLNs was selected for further study.
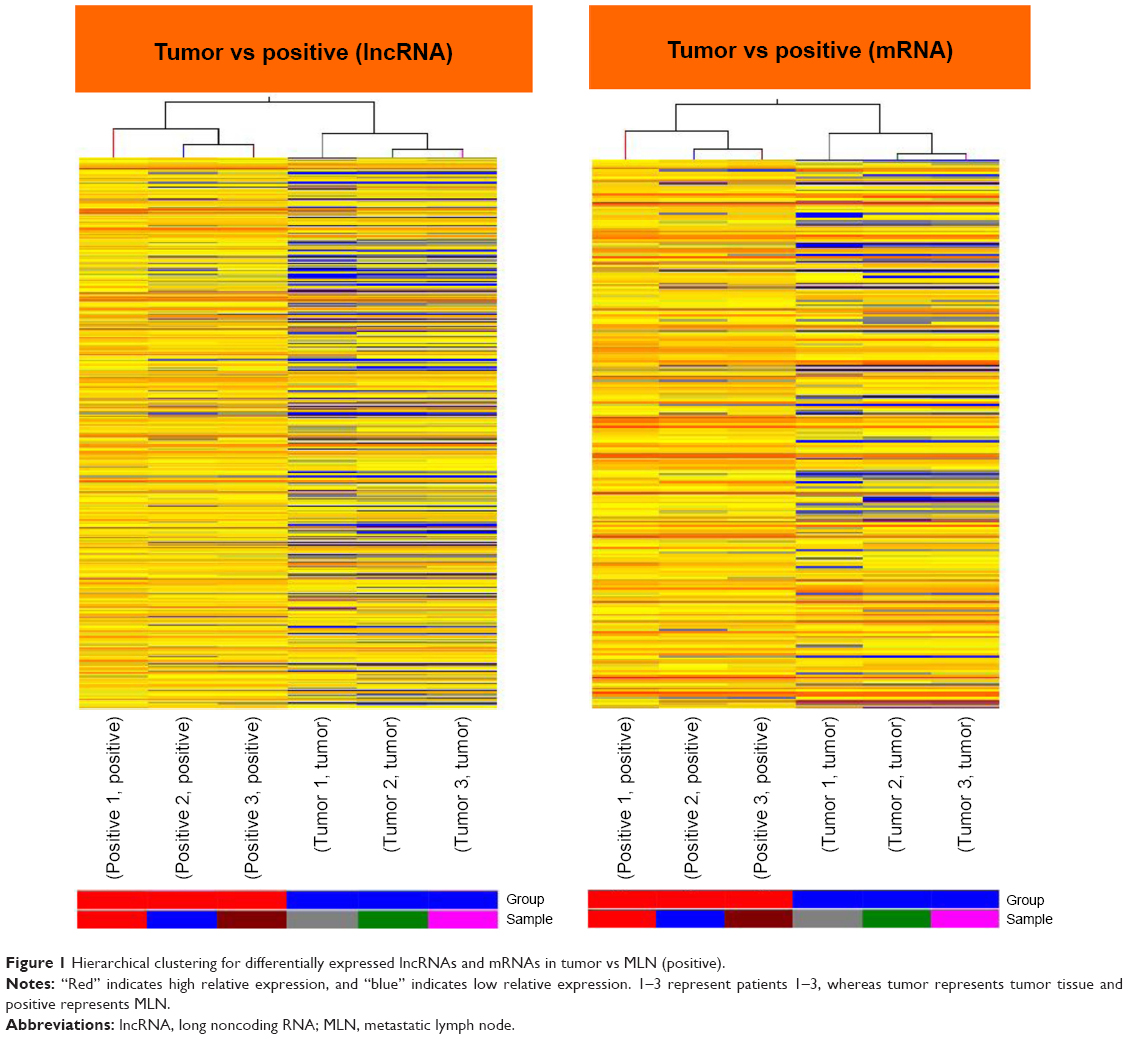 | Figure 1 Hierarchical clustering for differentially expressed lncRNAs and mRNAs in tumor vs MLN (positive). |
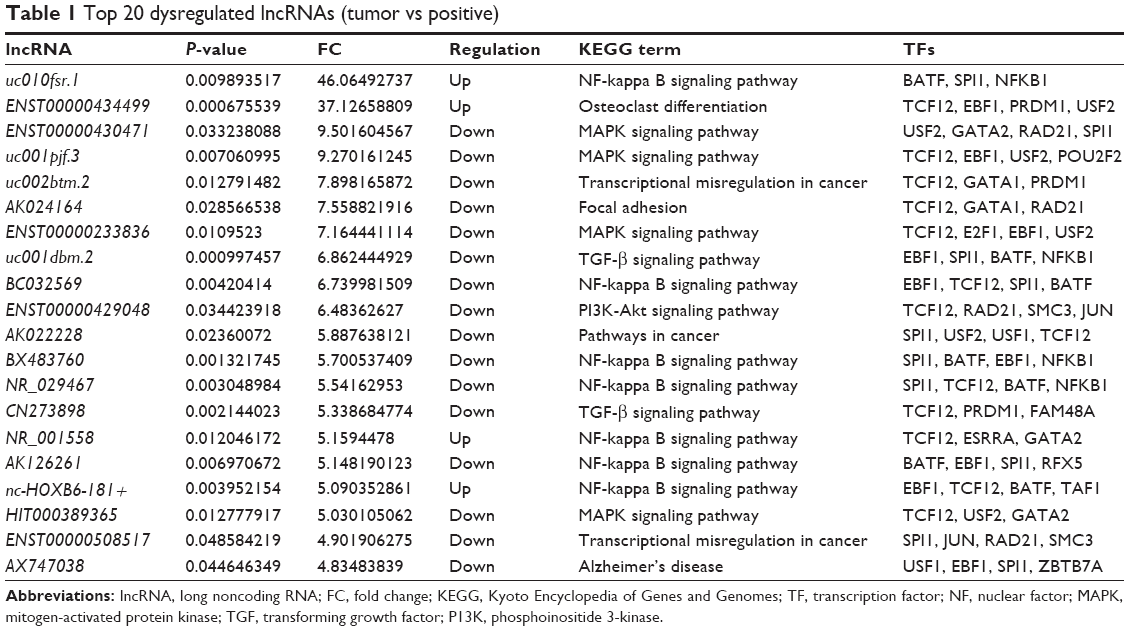 | Table 1 Top 20 dysregulated lncRNAs (tumor vs positive) |
Coexpression profiles and the lncRNA function prediction
One lncRNA can be coexpressed with hundreds of mRNAs. For instance, uc010fsr.1 was coexpressed with 666 mRNA transcripts and ENST00000430471 with 3,749 mRNA transcripts. A heat map was build to show the relationships between every differentially expressed lncRNAs and its coexpression mRNAs using the unsupervised hierarchical clustering analysis. We exhibited the map of ENST00000430471 with its coexpression mRNAs in Figure S1.
The functions of differentially expressed lncRNAs were predicted by the GO and KEGG pathway annotations of their coexpressed mRNAs. According to the P-value and enrichment, we counted and summarized the top 200 and 500 credible annotations for coexpressed and aberrant lncRNA genes, respectively. In the GO pathway analyses, the most frequently predicted functions of aberrant lncRNAs were “transforming growth factor beta (TGF-β)-activated receptor activity”, “DNA binding TF activity”, “transmembrane signaling receptor activity”, “protein binding”, and “DNA binding” (Figure 2A and B), while the most common pathways involved in the KEGG pathway were “transcriptional misregulation in cancer”, “osteoclast differentiation”, “mitogen-activated protein kinase (MAPK) signaling pathway”, and “nuclear factor-kappa B signaling pathway” as shown in Figure 2C and D. We listed the representative KEGG terms of the top 20 dysregulated lncRNAs in Table 1.
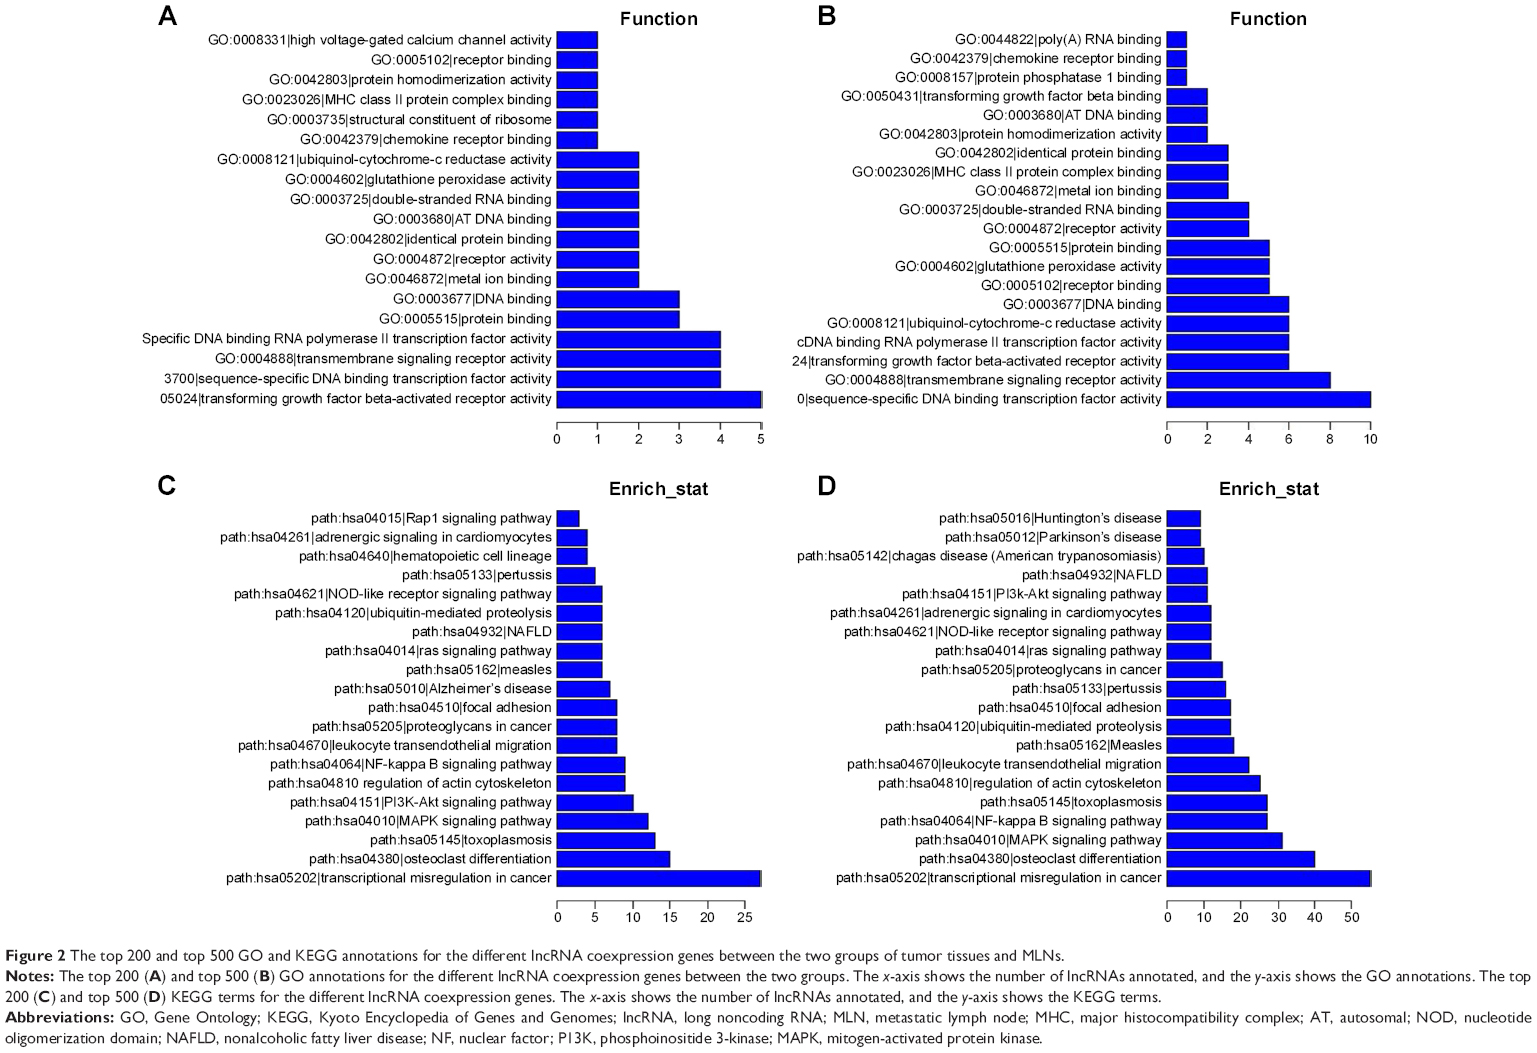 | Figure 2 The top 200 and top 500 GO and KEGG annotations for the different lncRNA coexpression genes between the two groups of tumor tissues and MLNs. |
The lncRNA ENST00000430471 was also annotated using GO and KEGG pathway analyses. According to the aforementioned selection criteria, the top 20 enrichment KEGG terms are listed in Table 2, indicating that ENST00000430471 was associated with “adrenergic signaling in cardiomyocytes”, “MAPK signaling pathway”, “regulation of actin cytoskeleton”, and “pathways in cancer”. The results of the pathway analyses consistently showed that ENST00000430471 is associated with the pathogenesis of CRC.
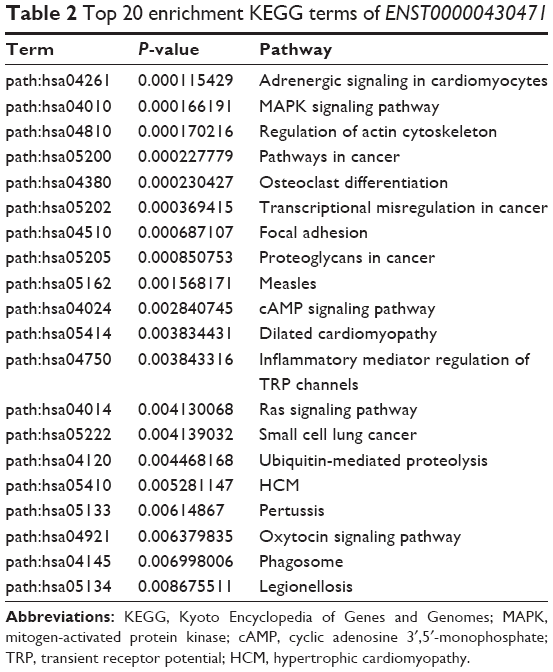 | Table 2 Top 20 enrichment KEGG terms of ENST00000430471 |
Cis-regulation of lncRNA
According to the aforementioned criteria, a total of 104 lncRNA transcripts with their predicted cis-regulating protein-coding genes were found through accurate genomic mapping. The “cis” analyses of some representative lncRNAs are shown in Table 3.
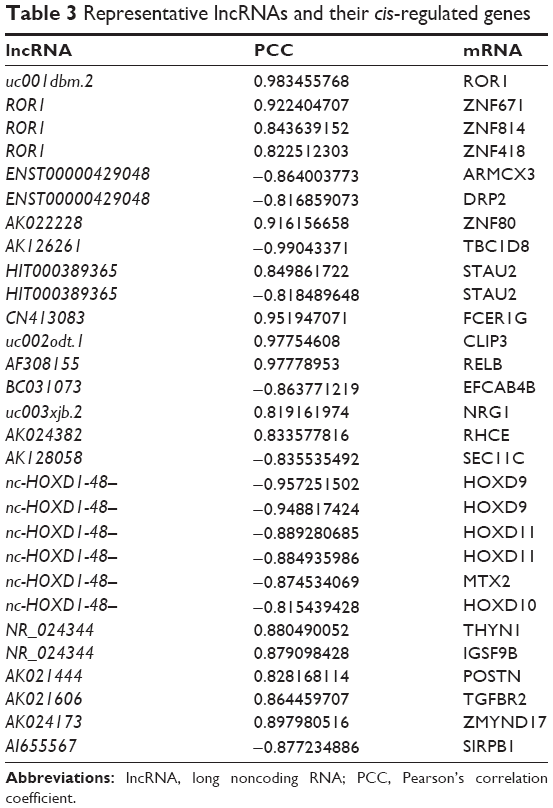 | Table 3 Representative lncRNAs and their cis-regulated genes |
Trans-regulation of lncRNA
Because many lncRNAs were involved, we generated a core network map using the top 100 lncRNA–TF pairs in Figure 3. The map displayed that the TF TCF12 modulated the expression of 33 lncRNAs, whereas the TF SPI1 modulated the expression of 21 lncRNAs and the TF EBF1 the expression of 16 lncRNAs. As shown in Table 1, the relative TFs of the top 20 dysregulated lncRNAs were provided. Then, in order to determine the “TF–lncRNA–genes” relationship, we selected the top 1,500 target genes into the “TF–lncRNA” network based on the results of lncRNA coexpression analysis (Figure S2). In short, valuable information about TFs, lncRNAs, and target genes were provided in these maps.
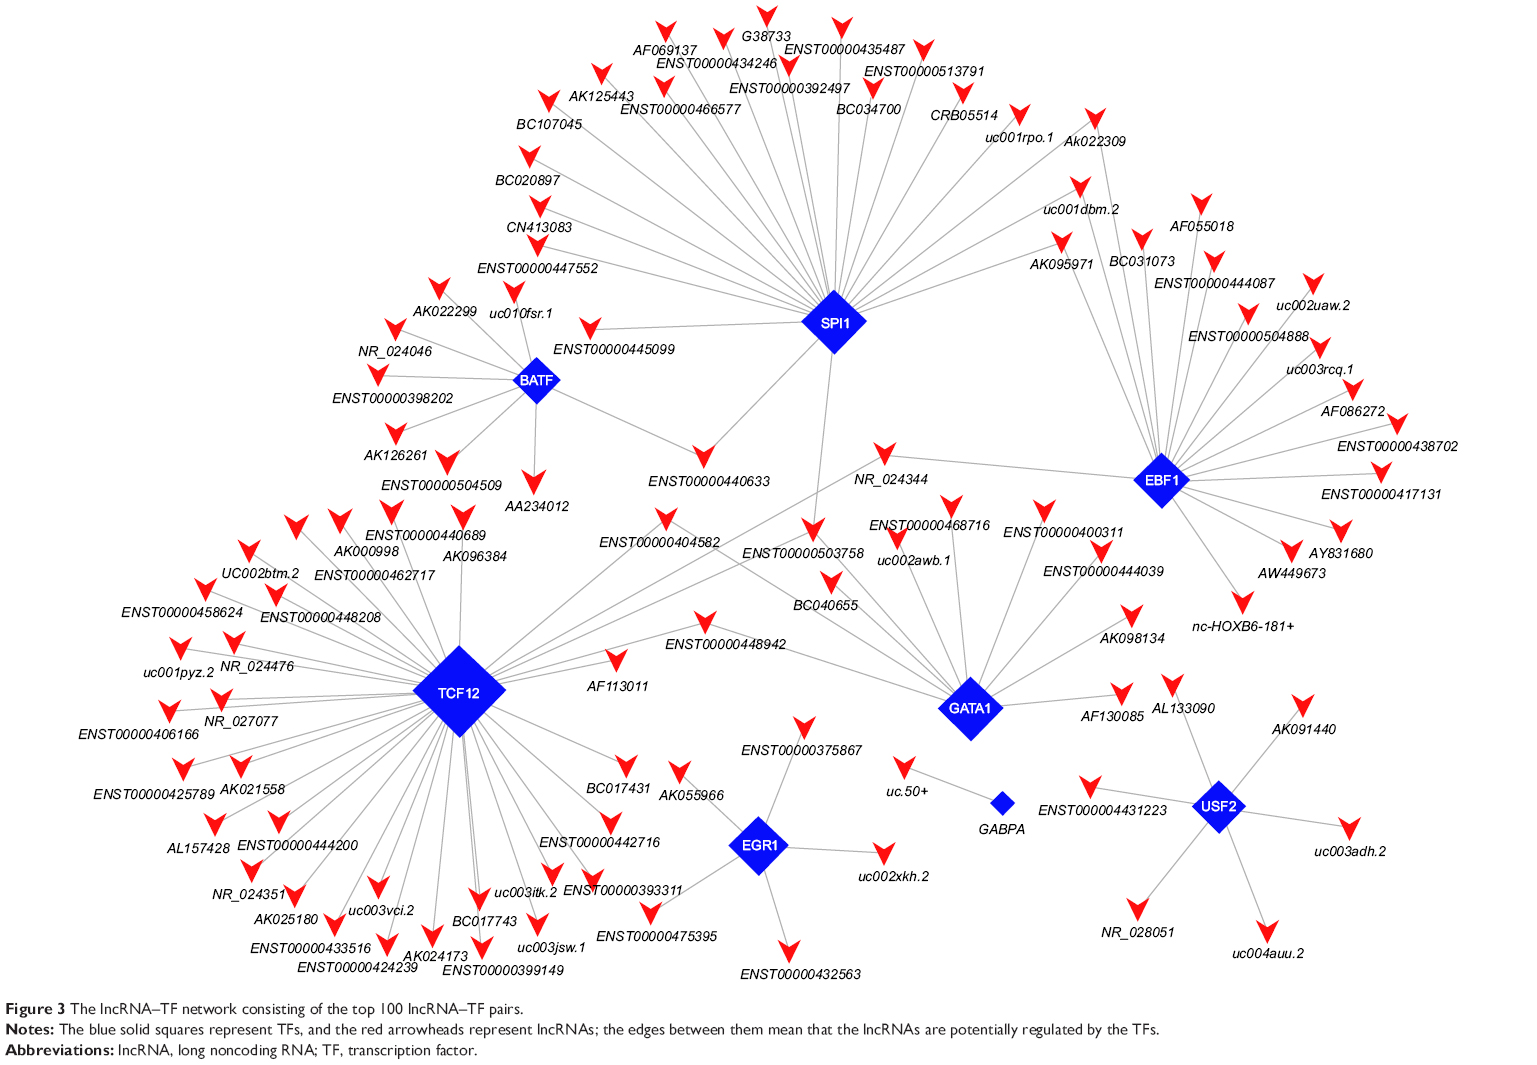 | Figure 3 The lncRNA–TF network consisting of the top 100 lncRNA–TF pairs. |
ENST00000430471 is upregulated in CRC
To validate the differential expression of ENST00000430471, we performed qRT-PCR assay in 26 CRC tumor tissues, paired normal tissues, and corresponding MLNs (Figure 4A). The qRT-PCR data showed that ENST00000430471 was significantly upregulated in MLN tissues with an average increasing fold of 3.57 and 6.89 (P<0.01), compared with paired tumor tissues and normal tissues. These results indicated that ENST00000430471 might be significantly related to the progress of lymph node metastasis of CRC.
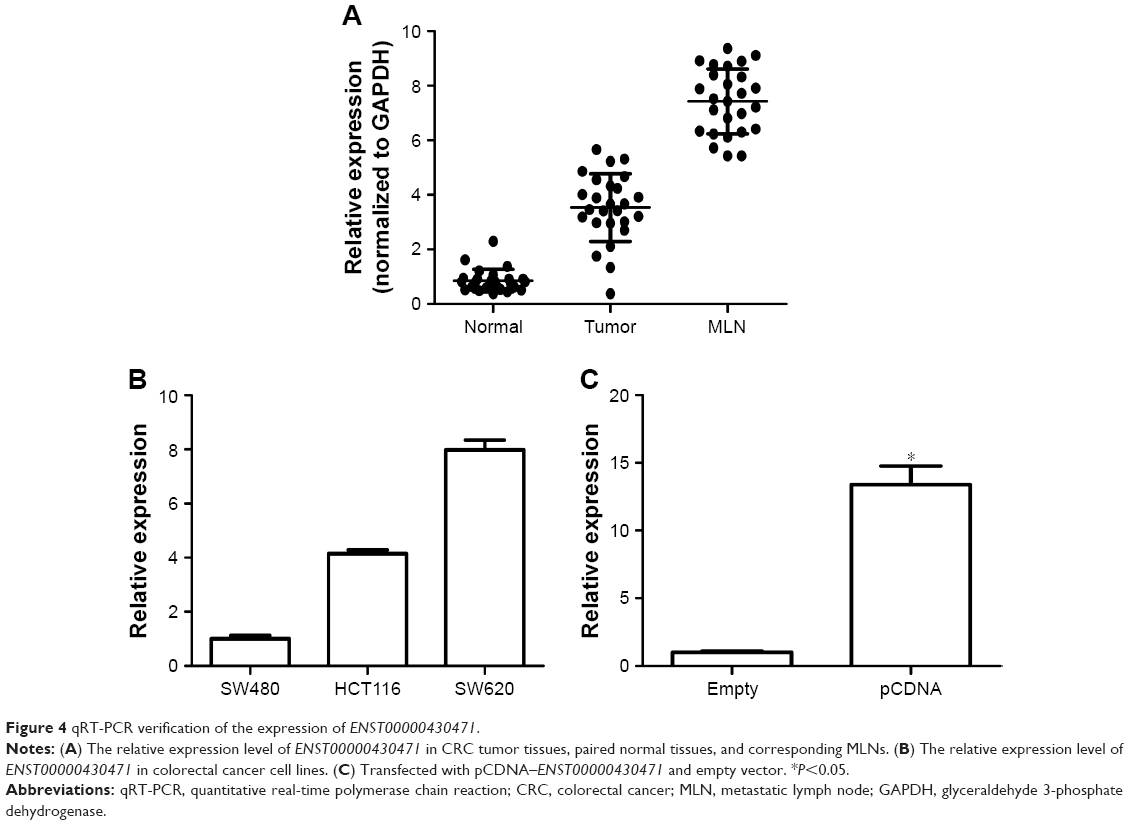 | Figure 4 qRT-PCR verification of the expression of ENST00000430471. |
ENST00000430471 promotes proliferation in HCT116 cells
To investigate the functional role of lncRNA ENST00000430471 in CRC cells, first, ENST00000430471 expression was detected by qRT-PCR in three human CRC cell lines (Figure 4B). Notably, SW480 cells expressed relatively lower levels of ENST00000430471 compared with HCT116 and SW620 cells. Then we put our efforts to discover how the CRC cell behavior changes when upregulating the expression of the lncRNA ENST00000430471. After transfection, the results of CCK-8 assays revealed that the growth of HCT116 cells with pCDNA–ENST00000430471 was promoted compared with control cells (P<0.05; Figure 5A). The colony formation assays were performed to find that the ability of colony formation of pCDNA–ENST00000430471 cells was significantly stronger than the negative groups (P<0.05; Figure 5B). Taken together, ENST00000430471 was involved in CRC cell proliferation.
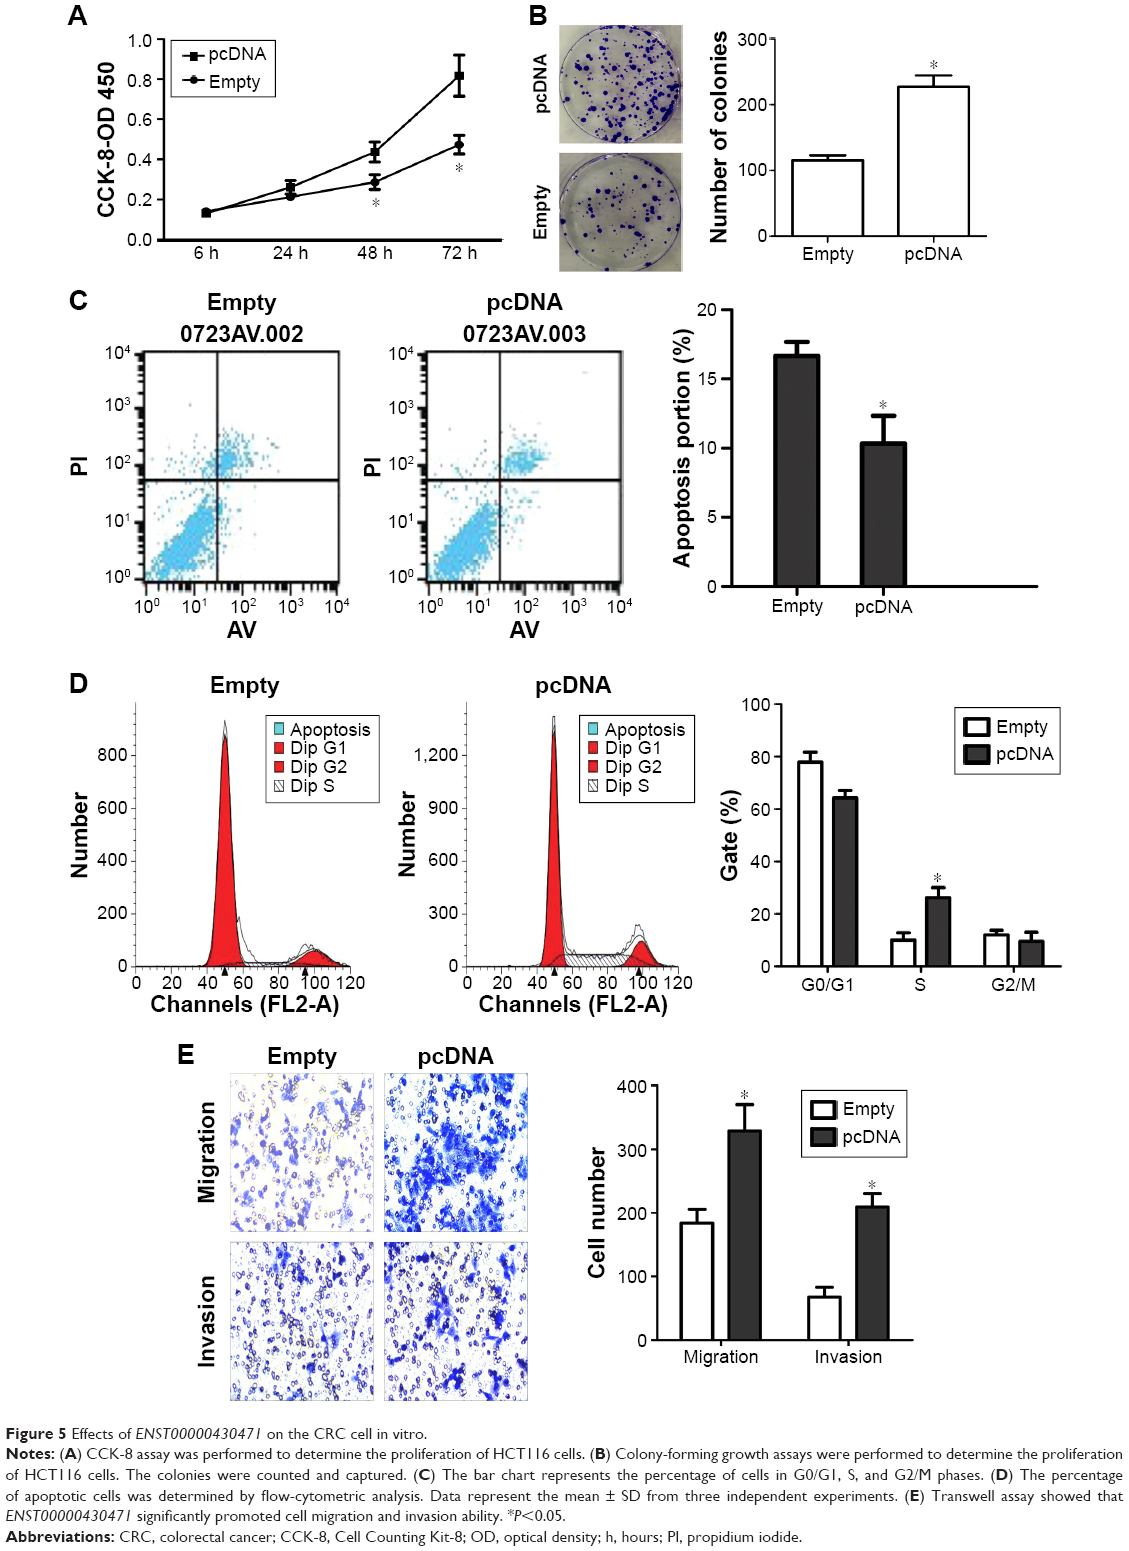 | Figure 5 Effects of ENST00000430471 on the CRC cell in vitro. |
ENST00000430471 promotes S-phase arrest and inhibits apoptosis
To determine whether the effects of ENST00000430471 on the proliferation of CRC cells were mediated by changing the cell cycle progression, we followed cell cycle progression in HCT116 cells with flow cytometry. After treatment with pCDNA–ENST00000430471 or empty vector for 48 hours, the results demonstrated that pCDNA–ENST00000430471 led to a significant accumulation of cells at the S-phase (P<0.05; Figure 5C). Next, we investigated the effects of overexpression of ENST00000430471 on apoptosis. As shown, the percentages of apoptotic cells were significantly decreased in the pCDNA–ENST00000430471 group compared to the control group (P<0.05; Figure 5D). These results suggest that ENST00000430471 treatment could induce S-phase arrest and diminish CRC cell apoptosis.
Effect of ENST00000430471 on migration and invasion
In order to examine whether ENST00000430471 has a role in regulating CRC cell migration and invasion, we evaluated HCT116 cell invasion through Matrigel and migration through transwell. The results showed that upregulation of ENST00000430471 significantly promoted the migration of HCT116 cells compared with that of the control. Similarly, invasion of HCT116 cells was increased following overexpression of ENST00000430471 (Figure 5E). These data indicate that ENST00000430471 could promote migration and invasion of colon cancer cells.
Discussion
Despite recent studies have shown the critical roles of lncRNA on tumorigenesis in different kinds of cancers, few lncRNAs have been characterized in lymph node metastasis of CRC.17–19 In this study, we first assessed genome-wide lncRNA microarray expression patterns in CRC tumor tissues compared with paired MLNs and explored their possible functions. We found that 390 lncRNA and 508 mRNA transcripts are dysregulated. A novel lncRNA ENST00000430471, which was upregulated in MLNs, was chosen for further study.
At present, only a small part of known lncRNAs have functional annotations, so we predict the lncRNA functions based on coexpression gene GO and KEGG pathway annotations in this study. As shown in Figure 2, the top predicted pathways of these lncRNAs were TGF-β-activated receptor activity, transcriptional misregulation in cancer, DNA binding TF activity, and MAPK signaling pathway, which correspond well with the pigenetic regulation role of lncRNAs.20 For example, reports have showed that MAPK signaling pathway and TGF-β signaling pathway are related to cell proliferation, invasion, metastasis signaling pathways.21,22 ENST00000430471 was also associated with MAPK signaling pathway and pathways in cancer, which displayed its potential pathogenesis of CRC.
In our study, cis-regulation and trans-regulation mechanisms were used to get additional information of dysregulated lncRNAs. In all, 104 lncRNAs were predicted to cis-regulate their nearby protein-coding genes, and the outstanding lncRNAs are listed in Table 3. The TF–lncRNA and TF–lncRNA–gene networks were constructed with the help of the “trans” analysis. The core TF–lncRNA–gene network (Figure S1) showed that TFs, including TCF12, SPI1, and EBF1, regulated lncRNA expression in CRC. TCF12 is reported to be associated with the occurrence of CRC metastasis by suppressing the expression of E-cadherin.23 The most relevant with ENST00000430471, USF2, is vital for the transcriptional activation of aspartyl (asparaginyl) β-hydroxylase and its truncated homologue humbug.24 Interestingly, humbug over expression is positively associated with tumor grade and inversely with survival in stage II colon cancers.25 Therefore, information of the cis and trans analyses promoted to interpret lncRNA functions and the pathogenesis of CRC.
A novel lncRNA, ENST00000430471, the most upregulated lncRNA in MLNs compared with tumor tissues caught our attention among most of the uncharacterized lncRNAs. In our functional study, ENST00000430471 overexpression in HCT116 cells promoted cell proliferation and increased colony formation. The results of flow cytometry, ENST00000430471 overexpression, led to a significant S-phase arrest and a related decrease in apoptosis, revealing that ENST00000430471 might impact the proliferation of CRC by influencing cell cycle progression and apoptosis. Additionally, transwell assay demonstrated that ENST00000430471 promoted migration and invasion ability of colorectal cell, suggesting that ENST00000430471 may be involved in the metastasis of CRC. The effects of ENST00000430471 on CRC cell laid a good foundation for the next research of CRC with regulation mechanism.
Tumor cells usually transfer from the primary tumor to the lymph nodes. To determine whether certain lncRNA would be involved in the lymph node metastasis of CRC, we identified lncRNA–ENST00000430471 that was most upregulated in MLNs than the tumor tissues. Then we found that ENST00000430471 played a partial role in the progress of metastasis of HCT116 cells. However, more studies are needed to expand the sample size for clinical research and determine whether ENST00000430471 can serve as a new diagnostic biomarker and therapeutic target for lymph node metastasis of CRC.
Conclusion
We identified a group of aberrant lncRNAs in tumor tissues and MLNs from three CRC patients. The functional and biological processes of many lncRNAs in the pathogenesis of CRC were determined by cis-regulating and trans-regulating based on the coexpression genes. Finally, we concluded that ENST00000430471 might be a novel prognostic marker in CRC.
Acknowledgments
This study is supported by the Natural Science Foundation Project of Jiangsu Province (BK2012872) and the Science and Technology Projects, Health Department of Jiangsu Province (H201207).
Author contributions
P Yang and Z-Y He designed the research. Z-P Xu and T Chen performed the research and analyzed the data. P Yang and Z-P Xu wrote the paper. All authors contributed toward data analysis, drafting and critically revising the paper and agree to be accountable for all aspects of the work.
Disclosure
The authors report no conflicts of interest in this work.
References
Sostres C, Gargallo CJ, Lanas A. Aspirin, cyclooxygenase inhibition and colorectal cancer. World J Gastrointest Pharmacol Ther. 2014;5(1):40–49. | ||
Ung L, Lam AK, Morris DL, Chua TC. Tissue-based biomarkers predicting outcomes in metastatic colorectal cancer: a review. Clin Transl Oncol. 2014;16(5):425–435. | ||
Nicastri DG, Doucette JT, Godfrey TE, Hughes SJ. Is occult lymph node disease in colorectal cancer patients clinically significant? A review of the relevant literature. J Mol Diagn. 2007;9(5):563–571. | ||
Jemal A, Siegel R, Ward E, Murray T, Xu J, Thun MJ. Cancer statistics, 2007. CA Cancer J Clin. 2007;57(1):43–66. | ||
Batista PJ, Chang HY. Long noncoding RNAs: cellular address codes in development and disease. Cell. 2013;152(6):1298–1307. | ||
Ponting CP, Oliver PL, Reik W. Evolution and functions of long noncoding RNAs. Cell. 2009;136(4):629–641. | ||
Huang J, Zhou N, Watabe K, et al. Long non-coding RNA UCA1 promotes breast tumor growth by suppression of p27 (Kip1). Cell Death Dis. 2014;5:e1008. | ||
Huarte M, Guttman M, Feldser D, et al. A large intergenic noncoding RNA induced by p53 mediates global gene repression in the p53 response. Cell. 2010;142(3):409–419. | ||
Geisler S, Lojek L, Khalil AM, Baker KE, Coller J. Decapping of long noncoding RNAs regulates inducible genes. Mol Cell. 2012;45(3):279–291. | ||
Li D, Feng J, Wu T, et al. Long intergenic noncoding RNA HOTAIR is overexpressed and regulates PTEN methylation in laryngeal squamous cell carcinoma. Am J Pathol. 2013;182(1):64–70. | ||
Han J, Rong LF, Shi CB, et al. Screening of lymph nodes metastasis associated lncRNAs in colorectal cancer patients. World J Gastroenterol. 2014;20(25):8139–8150. | ||
Liao Q, Liu C, Yuan X, et al. Large-scale prediction of long non-coding RNA functions in a coding-non-coding gene co-expression network. Nucleic Acids Res. 2011;39(9):3864–3878. | ||
Guenzl PM, Barlow DP. Macro lncRNAs: a new layer of cis-regulatory information in the mammalian genome. RNA Biol. 2012;9(6):731–741. | ||
Guttman M, Amit I, Garber M, et al. Chromatin signature reveals over a thousand highly conserved large non-coding RNAs in mammals. Nature. 2009;458(7235):223–227. | ||
Guttman M, Donaghey J, Carey BW, et al. lincRNAs act in the circuitry controlling pluripotency and differentiation. Nature. 2011;477(7364):295–300. | ||
Joung JG, Hwang KB, Nam JW, Kim SJ, Zhang BT. Discovery of microRNA-mRNA modules via population-based probabilistic learning. Bioinformatics. 2007;23(9):1141–1147. | ||
Gupta RA, Shah N, Wang KC, et al. Long non-coding RNA HOTAIR reprograms chromatin state to promote cancer metastasis. Nature. 2010;464(7291):1071–1076. | ||
Tahira AC, Kubrusly MS, Faria MF, et al. Long noncoding intronic RNAs are differentially expressed in primary and metastatic pancreatic cancer. Mol Cancer. 2011;10:141. | ||
Qiu MT, Hu JW, Yin R, Xu L. Long noncoding RNA: an emerging paradigm of cancer research. Tumour Biol. 2013;34(2):613–620. | ||
Lee JT. Epigenetic regulation by long noncoding RNAs. Science. 2012;338(6113):1435–1439. | ||
Miyazono K. Transforming growth factor-beta signaling in epithelial-mesenchymal transition and progression of cancer. Proc Jpn Acad Ser B Phys Biol Sci. 2009;85(8):314–323. | ||
Wang H, An H, Wang B, et al. miR-133a represses tumour growth and metastasis in colorectal cancer by targeting LIM and SH3 protein 1 and inhibiting the MAPK pathway. Eur J Cancer. 2013;49(18):3924–3935. | ||
Lee CC, Chen WS, Chen CC, et al. TCF12 protein functions as transcriptional repressor of E-cadherin, and its overexpression is correlated with metastasis of colorectal cancer. J Biol Chem. 2012;287(4):2798–2809. | ||
Finotti A, Treves S, Zorzato F, Gambari R, Feriotto G. Upstream stimulatory factors are involved in the P1 promoter directed transcription of the A beta H-J-J locus. BMC Mol Biol. 2008;9:110. | ||
Wang J, de la Monte SM, Sabo E, et al. Prognostic value of humbug gene overexpression in stage II colon cancer. Hum Pathol. 2007;38(1):17–25. |
Supplementary materials
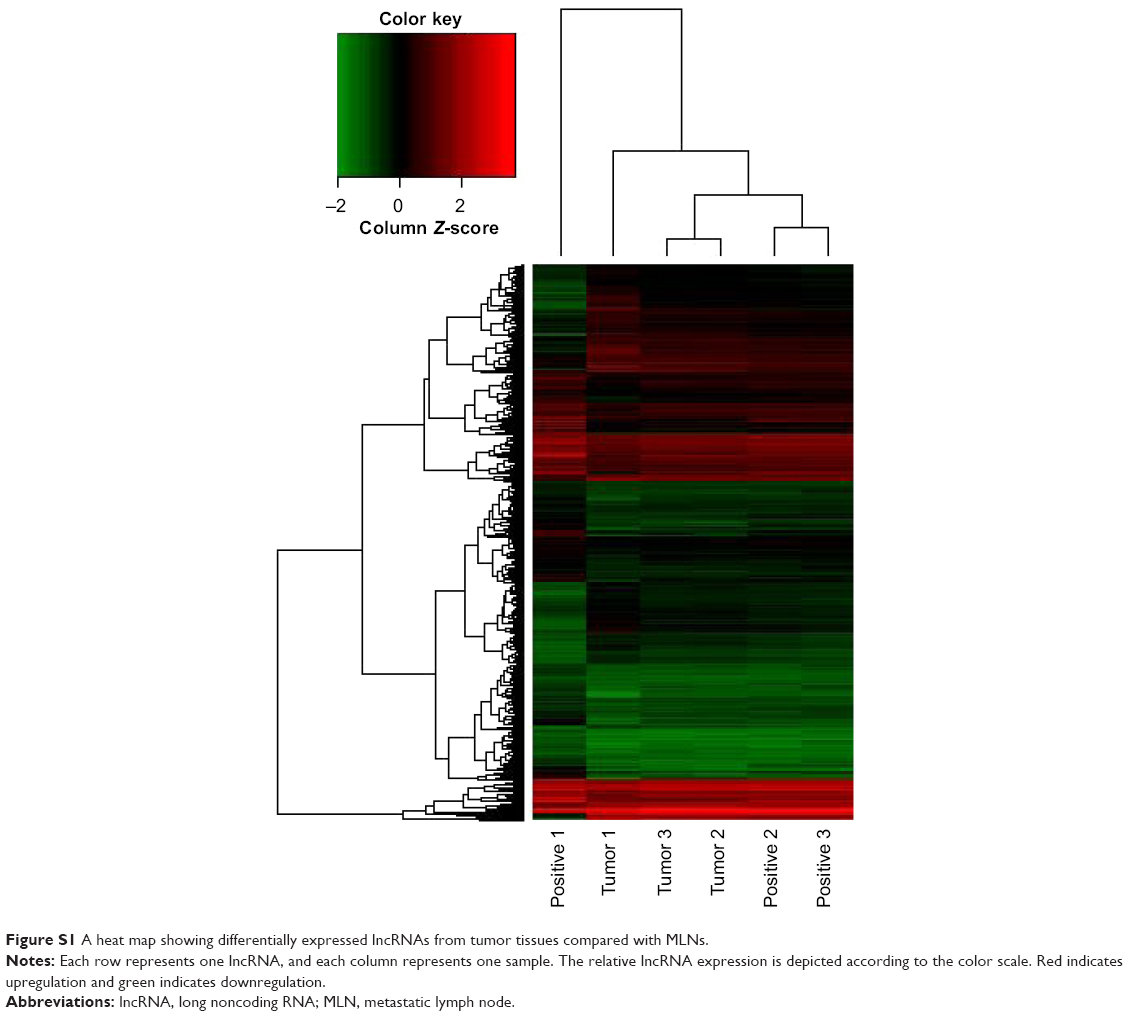 | Figure S1 A heat map showing differentially expressed lncRNAs from tumor tissues compared with MLNs. |
 | Figure S2 The lncRNA–TF–genes network map consisting of the top 1,500 relevant genes (green dots) based on the lncRNA–TF network. |
 © 2016 The Author(s). This work is published and licensed by Dove Medical Press Limited. The full terms of this license are available at https://www.dovepress.com/terms.php and incorporate the Creative Commons Attribution - Non Commercial (unported, v3.0) License.
By accessing the work you hereby accept the Terms. Non-commercial uses of the work are permitted without any further permission from Dove Medical Press Limited, provided the work is properly attributed. For permission for commercial use of this work, please see paragraphs 4.2 and 5 of our Terms.
© 2016 The Author(s). This work is published and licensed by Dove Medical Press Limited. The full terms of this license are available at https://www.dovepress.com/terms.php and incorporate the Creative Commons Attribution - Non Commercial (unported, v3.0) License.
By accessing the work you hereby accept the Terms. Non-commercial uses of the work are permitted without any further permission from Dove Medical Press Limited, provided the work is properly attributed. For permission for commercial use of this work, please see paragraphs 4.2 and 5 of our Terms.