")
Back to Journals » OncoTargets and Therapy » Volume 13
Long Non-Coding RNA TUG1 Promotes Cell Proliferation and Inhibits Cell Apoptosis, Autophagy in Clear Cell Renal Cell Carcinoma via MiR-31-5p/FLOT1 Axis
Authors Lv D, Xiang Y, Yang Q, Yao J, Dong Q
Received 19 March 2020
Accepted for publication 27 May 2020
Published 19 June 2020 Volume 2020:13 Pages 5857—5868
DOI https://doi.org/10.2147/OTT.S254634
Checked for plagiarism Yes
Review by Single anonymous peer review
Peer reviewer comments 2
Editor who approved publication: Prof. Dr. Takuya Aoki
Dong Lv,1,2 Ying Xiang,2 Qi Yang,2 Juncheng Yao,2 Qiang Dong1
1Department of Urology, West China Hospital, Sichuan University, Chengdu, Sichuan, People’s Republic of China; 2Department of Urology, Eastern Hospital, Sichuan Academy of Medical Sciences & Sichuan Provincial People’s Hospital, Chengdu, Sichuan, People’s Republic of China
Correspondence: Qiang Dong
Department of Urology, West China Hospital, Sichuan University, Chengdu, Sichuan 610041, People’s Republic of China
Tel +86-028-88423423
Email [email protected]
Purpose: Clear cell renal cell carcinoma (ccRCC) is a common urological carcinoma in adults. Long non-coding RNA (lncRNA) taurine-upregulated gene 1 (TUG1) has been reported to be involved in the progression of diverse human cancers, including renal cell carcinoma (RCC). However, the biological mechanism of TUG1 was rarely reported in ccRCC.
Methods: The levels of TUG1, microRNA miR-31-5p and flotillin 1 (FLOT1) in ccRCC tissues and cells were detected by qRT-PCR. The interactions between miR-31-5p and TUG1 or FLOT1 were predicted by starBase v2.0 and TargetScan, respectively, which were further validated by RIP assay and RNA pull-down assay. Cell counting kit-8 (CCK-8), flow cytometry and Western blot were used to assess the effects of TUG1 on cell viability, apoptosis rate and the relative protein expression levels in ccRCC cells. In addition, the xenograft tumor assay was conducted to further verify the functions of TUG1 in ccRCC in vivo.
Results: TUG1 was dramatically up-regulated in ccRCC tissues and cells. TUG1 silencing inhibited cell proliferation and promoted cell apoptosis, autophagy in 786-0 and A498 cells. In addition, TUG1 depletion repressed tumor growth in vivo. Moreover, miR-31-5p was validated as a direct target of TUG1, and microRNA miR-31-5p inhibitor mitigated the effects of TUG1 knockdown on ccRCC progression. Furthermore, FLOT1 was verified to be negatively interacted with miR-31-5p. FLOT1 overexpression attenuated miR-31-5p-mediated inhibitory effect on cell proliferation and promotion effects on cell apoptosis, autophagy. The restoration experiment implicated that TUG1 positively modulated FLOT1 expression by sponging miR-31-5p.
Conclusion: All data demonstrated that TUG1 promotes cell proliferation and inhibits cell apoptosis and autophagy in ccRCC by miR-31-5p/FLOT1 axis, which may provide a therapeutic target for ccRCC patients.
Keywords: lncRNA TUG1, miR-31-5p, FLOT1, tumor progression, clear cell renal cell carcinoma
Introduction
Clear cell renal cell carcinoma (ccRCC), accounting for about 80% in renal cell carcinoma (RCC), originated from the renal proximal tubule and approximately 25% of ccRCC patients have the risk of cancer cell metastasis at early stage.1,2 Although resection and radical nephr ectomy were the best therapy for ccRCC patients, 30% of patients after surgery remains metastases.3 In addition, it is difficult to diagnose ccRCC at early stage as the lack of typical symptoms. Hence, it is urgent to find some therapeutic targets to diagnose ccRCC at the early stage.
Long non-coding RNAs (lncRNAs) are a class of non-coding RNAs with more than 200 nucleotide (nt) in length, and have been validated as oncogenes to participate in tumor progression in various cancers, including ccRCC.4 Aberrant expression of lncRNAs were reported in ccRCC, such as lnc-ZNF180-2,5 MALAT1,6,7 SPRY4-IT1,8 Linc00152.9 Taurine-upregulated gene 1 (TUG1) is a 7.1-kb lncRNA located on chromosome 22q12 and was initially identified in response to taurine treatment of developing mouse retinal cells.10 Accumulating evidence indicated that up-regulation of TUG1 affected physiological processes of tumor progression in various cancers, such as cell proliferation, migration, invasion and epithelial-mesenchymal transition (EMT) in papillary thyroid cancer,11 colorectal cancer,12 cervical cancer13 and also in ccRCC.14–17 However, the mechanism of TUG1 was rarely reported in ccRCC.
MicroRNAs (miRNAs), a class of small non-coding RNAs with about 22 nt in length, have been reported to act as tumor suppressors to mediate RNA silencing and post-transcriptional regulation of gene expression.18 Many miRNAs, such as miR-3133,19 miR-216b,20 miR-1294,21 were confirmed to repress tumor development and progression in ccRCC. MiR-31-5p was strikingly down-regulated in renal cell carcinoma tissues and cells (786-0 and ACHN), which could inhibit cell proliferation, migration, invasion and cell cycle.22 The flotillin 1 (FLOT1), a gene on chromosome 6p21.3, was identified as the essential marker of lipid rafts.23 FLOT1 was documented to be increased in diverse tumors including small cell lung carcinoma,24 hepatocellular carcinoma,25 tongue squamous cell cancer,26 and also in ccRCC.27,28 Moreover, high expression levels of FLOT1 were associated with reduced patients’ survival in kidney renal clear cell carcinoma patients. However, the mechanism of miR-31-5p and FLOT1 remains unclear in ccRCC.
In this study, we focused on the effects and the underlying mechanism of TUG1 on cell proliferation, apoptosis and autophagy in ccRCC. The novel TUG1/miR-31-5p/FLOT1 regulatory pathway may provide the therapeutic target for ccRCC patients.
Materials and Methods
Tissue Samples
The study was approved by the Ethics Committee of West China Hospital, Sichuan University and conducted according to the Declaration of Helsinki Principles. Forty-one pairs of ccRCC tissues and corresponding adjacent normal tissues were obtained from West China Hospital, Sichuan University. All tissues were stored at −80°C until further used. All ccRCC patients or their guardians provided the written informed consents.
Cell Culture
Two renal cell carcinoma cell lines 786-0 (CRL-1932) and A498 (HTB-44) and human renal proximal tubular cells HK2 (CRL-2190) were purchased from American Type Culture Collection (ATCC, Manassas, VA, USA). All cells were cultivated in Dulbecco’s modified Eagle’s medium (DMEM, Invitrogen, Carlsbad, USA) containing 10% fetal bovine serum (FBS; Thermo Fisher Scientific, Rockville, MD, USA) and 1% penicillin/streptomycin (Invitrogen) in an incubator with 37 °C and 5% CO2 conditions.
Cell Transfection
Small interfering RNA (siRNA) against TUG1 (si-TUG1) and its negative control (si-NC), TUG1 overexpression vector (pcDNA-TUG1) and pcDNA empty plasmid (pcDNA-NC), miR-31-5p mimic and negative control (NC), miR-31-5p inhibitor (anti-miR-31-5p) and its matched control (anti-NC), and FLOT1 overexpression vector (FLOT1) and the negative control (vector) were obtained from GenePharma (Shanghai, China). Lipofectamine 2000 Reagent (Invitrogen) was used to conduct the transfection according to the manufacturer’s instructions.
Quantitative Real-Time Polymerase Chain Reaction (qRT-PCR)
RNA was extracted using Trizol reagent (Thermo Fisher Scientific) and the RNA concentration was detected using NanoDrop 2000c (Thermo Fisher Scientific). Subsequently, the quantitative PCR was performed using SYBR Premix Ex Taq II (TaKaRa, Dalian, China) by Real-Time PCR Detection System (Bio-Rad, Shanghai, China). The relative expression of TUG1, miR-31-5p and FLOT1 was calculated by the 2−ΔΔCt method. The primers were bought from Beijing Genomics Institute (BGI, Shenzhen, China) and listed as follows: TUG1: (F, 5ʹ-TAGCAGTTCCCCAATCCTTG-3ʹ, R, 5ʹ-CACAAATTCCCATCATTCCC-3ʹ); miR-31-5p: (RT, 5ʹ-CTCAACTGGTGTCGTGGAGTCGGCAATTCAGTTGAGAGCTATG, F, 5ʹ-ACACTCCAGCTGGGAGGCAAGATGCTGGCATA-3ʹ); FLOT1: (F, 5ʹ-GCAGAGAAGTCCCAACTAATTATGC-3ʹ, R, 5ʹ-CAGTGTGATCTTATTGGCTGAAGTC-3ʹ); GAPDH: (Forward, 5ʹ-TGTTCGTCATGGGTGTGAAC-3ʹ, Reverse, 5ʹ-ATGGCATGGACTGTGGTCAT-3ʹ) and U6: (Forward, 5ʹ-CTCGCTTCGGCAGCACA-3ʹ, Reverse, 5ʹ-AACGCTTCACGAATTTGCGT-3ʹ).
Cell Viability Assay
Cell Counting Kit-8 (CCK-8; Dojindo, Kumamoto, Japan) was used to detect cell viability of 786-0 and A498 cells according with its manual. In brief, 786-0 and A498 cells (4 × 10³ per well) were added into 96-well plate and cultivated for 24 h, 48 h, 72 h in standard conditions. Then, 10 μL CCK-8 solution was injected into each well and incubated for another 10 min. The absorbance at 450 nm was measured by a spectrophotometer (Thermo Fisher Scientific).
Cell Apoptosis Assay
Annexin V-fluorescein isothiocyanate (FITC)/propidium iodide (PI) apoptosis detection kit (Solarbio, Beijing, China) was used to detect the apoptosis rate. Briefly, the treated cells were incubated with FITC-labelled annexin V and PI. Then, the fluorescence intensity was measured by a flow cytometry (BD Biosciences; San Jose, CA, USA).
Western Blot Assay
The protein in cells was extracted using a protein extraction kit (Beyotime, Shanghai, China). Following the measurement of protein concentration, the protein sample was separated by Sodium Dodecyl Sulfonate-polyacrylamide gel electrophoresis (SDS-PAGE) and then transferred onto a polyvinylidene fluoride (PVDF) membrane (Millipore, Billerica, MA, USA). Subsequently, the membrane was blocked in skim milk for 2 h and then incubated with primary antibody at 4°C overnight. Subsequently, the membrane was incubated with secondary antibody at 37°C for another 2 h. Chemiluminescence intensity analysis was performed using Clarity™ Western ECL Substrate Kit (Bio-Rad). The p62 (ab109012), LC3B (ab51520), PCNA (ab92522), Cleaved caspase 3 (ab214430), FLOT1 (ab41927) and glyceraldehyde-3-phosphate dehydrogenase (GAPDH) (ab181602) antibodies were all purchased from Abcam (Cambridge, MA, USA).
Mice Xenograft Model
The experiment in the nude mice was performed according to the protocol approved by the Animal Care Committee of West China Hospital, Sichuan University. A498 cells transfected with sh-TUG1 or sh-NC (GeneChem, Shanghai, China) were subcutaneously injected into six-week-old male athymic BALB/c athymic nude mice (n=6 per group). The xenograft tumor size was measured every 7 days after injection for 5 times with the formula: volume = length×width2/2. 5 weeks later, all xenograft tumors were resected for weight measurement and for the further qRT-PCR and Western blot assay.
Dual-Luciferase Reporter Assay
The interactions between miR-31-5p and TUG1, FLOT1 were predicted by starBase v2.0 (http://starbase.sysu.edu.cn/starbase2/) and TargetScan Human (http://www.targetscan.org/vert_71/), respectively. TUG1 and FLOT1 3ʹUTR were inserted into psiCHECK2 vector (Promega, Madison, WI, USA), namely TUG1-wt, FLOT1-wt. The luciferase reporter (TUG-wt, TUG1-mut, FLOT1-wt or FLOT1-mut) and miR-31-5p, miR-NC, anti-miR-31-5p or anti-NC were co-transfected into 786-0 and A498 cells using Lipofectamine 2000 Reagent (Invitrogen). The luciferase activity of TUG-wt (TUG1-mut), FLOT1-wt (FLOT1-mut) reporter was assessed using Dual-Luciferase® Reporter Assay system (Promega).
RNA Immunoprecipitation (RIP) Assay
EZ-Magna RIP™ RNA-Binding Protein Immunoprecipitation Kit (Millipore) was used to perform RIP assay. The treated 786-0 and A498 cells were lysed in RIP buffer and the samples were incubated with magnetic beads conjugated with anti-Ago2 or IgG antibody. The complex sample was digested by proteinase K and then RNA was isolated. The enrichment of TUG1, miR-31-5p and FLOT1 was measured by qRT-PCR.
RNA Pull-Down Assay
For RNA pull-down assay, Biotin-labeled miR-miR-31-5p (Sangon, Shanghai, China) oligo was first transfected into 786-0 and A498 cells. Following 2-day cultivation, 786-0 and A498 cells were lysed and then incubated with streptavidin-coupled agarose beads (Thermo Fisher Scientific) to pull down the complex. The amount of TUG1 was detected by qRT-PCR.
Statistical Analysis
All data analysis was performed using GraphPad Prism 7 (GraphPad Inc., San Diego, CA, USA) and the quantitative data was shown as mean ± standard deviation (SD) for at least three independent experiments. The comparison between two groups was estimated by Student’s t-test and among more than three groups was analyzed via one-way analysis of variance (ANOVA) followed by Dunnett’s test. P value less than 0.05 was considered to be statistically significant.
Results
TUG1 Is Significantly Up-Regulated in ccRCC Tissues and Cells
To investigate the role of TUG1 in renal cell carcinoma, we detected the relative expression of TUG1 in ccRCC tissues and cells. The qRT-PCR results showed that the level of TUG1 was dramatically increased in ccRCC tissues and cells (786-0 and A498) compared with that in adjacent normal tissues or human renal proximal tubular cells (HK2) (Figure 1A and B). These data indicated that lncRNA TUG1 was apparently elevated in ccRCC tissues and cells.
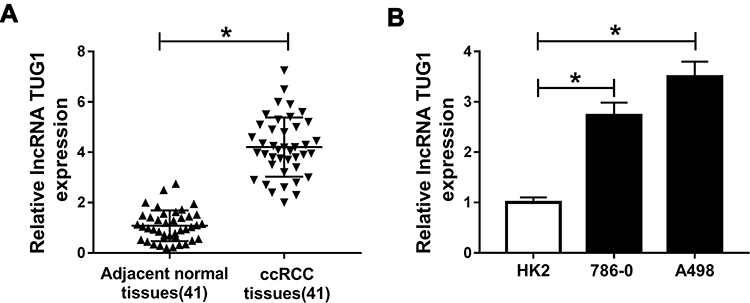 |
Figure 1 LncRNA TUG1 is significantly up-regulated in ccRCC tissues and cells. (A and B) The level of TUG1 in ccRCC tissues (A) and cells (B) was measured by qRT-PCR. *P<0.05. Abbreviations: TUG1, taurine-upregulated gene 1; ccRCC, clear cell renal cell carcinoma; qRT-PCR, quantitative real-time polymerase chain reaction. |
TUG1 Silencing Inhibits Cell Proliferation and Promotes Cell Apoptosis and Autophagy in 786-0 and A498 Cells
To explore the functions of TUG1 in ccRCC, si-TUG1 was transfected into 786-0 and A498 cells. The qRT-PCR results confirmed the knockdown efficiency, demonstrated by the notable down-regulation of TUG1 in 786-0 and A498 cells transfected with si-TUG1 (Figure 2A). Furthermore, CCK-8 assay exhibited that TUG1 knockdown apparently repressed cell viability in 786-0 and A498 cells transfected with si-TUG1 in contrast to that in the matched control (Figure 2B). Moreover, flow cytometry results presented that depletion of TUG1 induced the apoptosis rate in si-TUG1-transfected 786-0 and A498 cells (Figure 2C). As p62 was autophagy inhibitor and the ratio of LC3-II/I was the indicator of autophagosome numbers,29 we assessed the functional effect of TUG1 on cell autophagy. Western blot results showed that the protein level of p62 was remarkably decreased, and the ratio of LC3-II/I was strikingly up-regulated in 786-0 and A498 cells with the transfection of si-TUG1 (Figure 2D). To sum, these results demonstrated that TUG1 knockdown suppressed cell proliferation and induced cell apoptosis, autophagy in 786-0 and A498 cells.
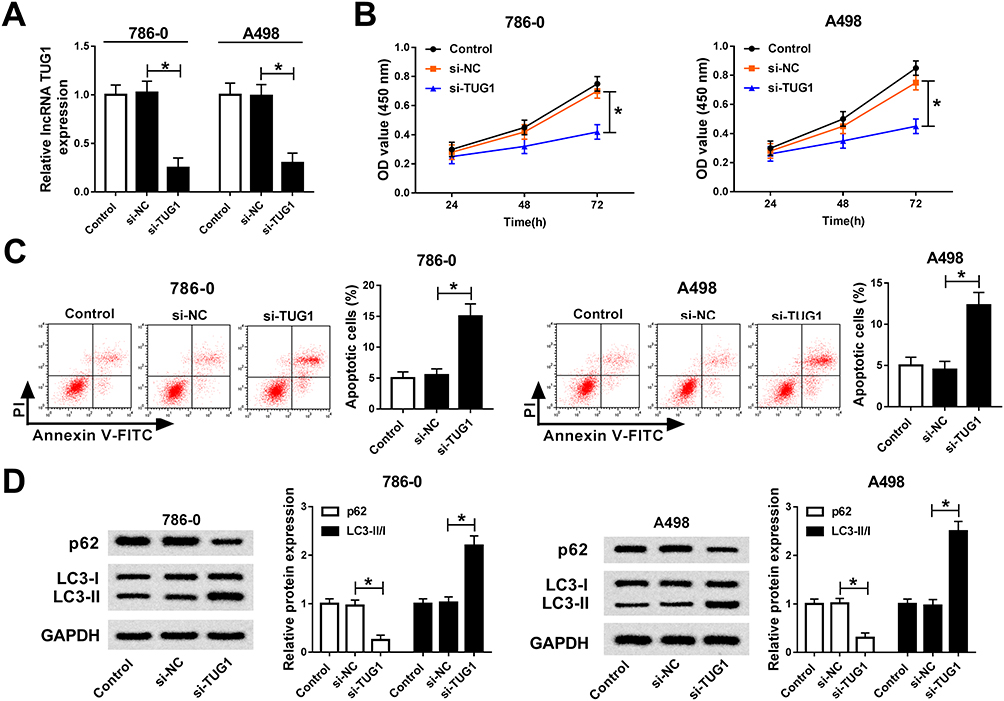 |
Figure 2 TUG1 silencing inhibits cell proliferation and promoted cell apoptosis, autophagy in 786-0 and A498 cells. (A–D) 786-0 and A498 cells were transfected with si-TUG1, si-NC or its negative control. (A) The level of TUG1 in transfected 786-0 and A498 cells was measured by qRT-PCR. (B) The cell viability in transfected 786-0 and A498 cells was assessed via CCK-8 assay. (C) The apoptotic rate in transfected 786-0 and A498 cells was analyzed by flow cytometry. (D) The protein levels of p62, LC3-I and LC3-II in transfected 786-0 and A498 cells were detected via Western blot assay. *P<0.05. Abbreviations: TUG1, taurine-upregulated gene 1; si, small interfering RNA; NC, negative control; qRT-PCR, quantitative real-time polymerase chain reaction; CCK-8, Cell Counting Kit-8; OD, optical density; PI, optical density; FITC, fluorescein isothiocyanate; GAPDH, glyceraldehyde-3-phosphate dehydrogenase. |
TUG1 Depletion Restrains the Xenograft Tumor Growth in vivo
To further validate the functions of TUG1, sh-TUG1 was transfected into A498 cells and then injected into nude mice. After 5-weeks measurement, the results showed that sh-TUG1 impeded tumor volume and weight compared to that in sh-NC group (Figure 3A and B). Also, the level of TUG1 was conspicuously decreased in sh-TUG1 group (Figure 3C). Since proliferating cell nuclear antigen (PCNA) was proliferation-related protein30 and Cleaved caspase 3 was apoptosis-associated protein,31 the protein levels of PCNA and Cleaved caspase 3/total caspase-3 were detected in tumors from nude mice. In addition, the Western blot results presented that the protein level of PCNA was distinctly down-regulated in sh-TUG1 compared to that in sh-NC group, while the protein level of Cleaved caspase 3 showed the opposite trend (Figure 3D). Taken together, these data suggested that TUG1 knockdown blocked the xenograft tumor growth in vivo.
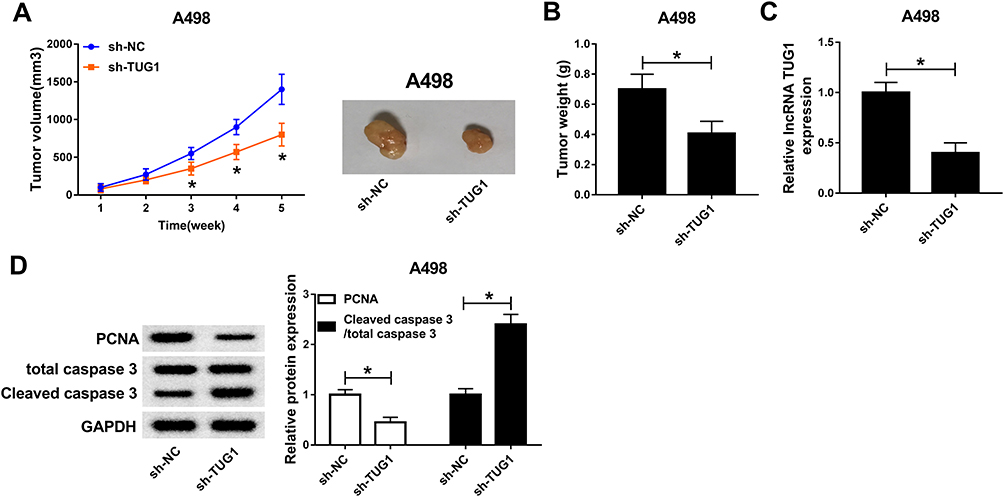 |
Figure 3 TUG1 depletion restrained the xenograft tumor growth in vivo. (A and B) The tendency of xenograft tumor volume (A) and weight (B) in nude mice injected with A498 cell transfected with sh-TUG1 or sh-NC were measured. (C) The level of TUG1 was detected by qRT-PCR. (D) The protein levels of PCNA and Cleaved caspase 3 in nude mice injected with A498 cell transfected with sh-TUG1 or sh-NC were measured via Western blot. *P<0.05. Abbreviations: TUG1, taurine-upregulated gene 1; sh, short hairpin RNA; NC, negative control; PCNA, proliferating cell nuclear antigen; GAPDH, glyceraldehyde-3-phosphate dehydrogenase. |
MiR-31-5p Is a Direct Target of TUG1
To illustrate the mechanism of TUG1 in ccRCC, starBase v2.0 online database was utilized to predict the putative target of TUG1. The results exhibited that miR-31-5p had complementary binding sites with TUG1 (Figure 4A). Following dual-luciferase reporter assay showed that the transfection of miR-31-5p mimics contributed to the striking decrease of luciferase activity of TUG1-wt, while the luciferase activity of TUG1-wt was prominently up-regulated by anti-miR-21-5p; however, the luciferase activity of TUG1-mut had no apparent change in any group (Figure 4B). RIP assay and RNA pull-down assay both indicated that miR-31-5p enrich much more TUG1 (Figure 4C and D). In addition, the qRT-PCR results exhibited that the level of miR-31-5p was apparently down-regulated in pcDNA-TUG1-transfected 786-0 and A498 cells, while showed the opposite trend in 786-0 and A498 cells transfected with si-TUG1 (Figure 4E). These results implicated that miR-31-5p was negatively interacted with TUG1.
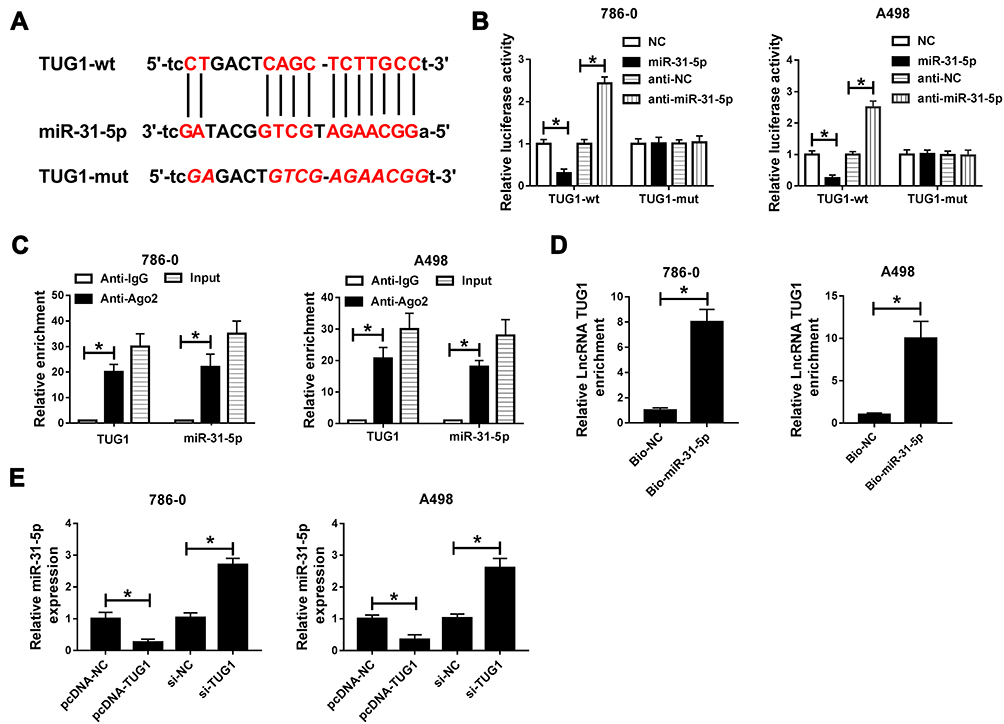 |
Figure 4 MiR-31-5p is a direct target of TUG1. (A) The complementary sequences between miR-31-5p and TUG1 and mutant sequences were shown. (B) The luciferase activity of luciferase reporter TUG1-wt or TUG1-mut in 786-0 and A498 cells transfected with miR-31-5p mimics, anti-miR-31-5p or their negative controls was measured by dual-luciferase reporter assay. (C and D) The enrichment of TUG1 or miR-31-5p was measured by RIP assay and RNA pull-down assay. (E) The level of miR-31-5p in 786-0 and A498 cells with the transfection of pcDNA-TUG1, si-TUG1 or their negative controls was detected by qRT-PCR. *P<0.05. Abbreviations: miR-31-5p, microRNA-31-5p; TUG1, taurine-upregulated gene 1; wt, wild type; mut, mutant type; NC, negative control; IgG, immunoglobulin G; Ago2, Argonaute-2; si, small interfering RNA. |
MiR-31-5p Inhibitor Mitigates the Suppressive Effect on Cell Proliferation and Promoted Effects on Cell Apoptosis, Autophagy Induced by TUG1 in 786-0 and A498 Cells
Based on the above results, we further explored the functions of TUG1 and miR-31-5p in ccRCC. Firstly, we measured the level of miR-31-5p in ccRCC. The qRT-PCR results showed that miR-31-5p was markedly down-regulated in ccRCC tissues and cells (Figure 5A and B). Subsequently, the qRT-PCR results indicated that miR-31-5p inhibitor alleviated the promotion effect on the expression of miR-31-5p in 786-0 and A498 cells caused by TUG1 silencing (Figure 5C). Furthermore, CCK-8 assay showed that anti-miR-31-5p attenuated the inhibitory effect on cell viability in 786-0 and A498 cells caused by si-TUG1 (Figure 5D). The flow cytometry results indicated that miR-31-5p inhibitor alleviated the promoted effect on cell apoptotic rate induced by si-TUG1 in 786-0 and A498 cells (Figure 5E). In addition, Western blot assay exhibited that anti-miR-31-5p receded the promotion effect on the ratio of LC3-II/I and the inhibitory effect on the protein level of p62 in 786-0 and A498 cells caused by TUG1 depletion (Figure 5F). These data manifested that miR-31-5p was significantly decreased in ccRCC tissues, cells and miR-31-5p inhibitor counteracted the inhibitory effect on cell proliferation and the promotion effects on cell apoptosis and autophagy by targeting TUG1 in 786-0 and A498 cells.
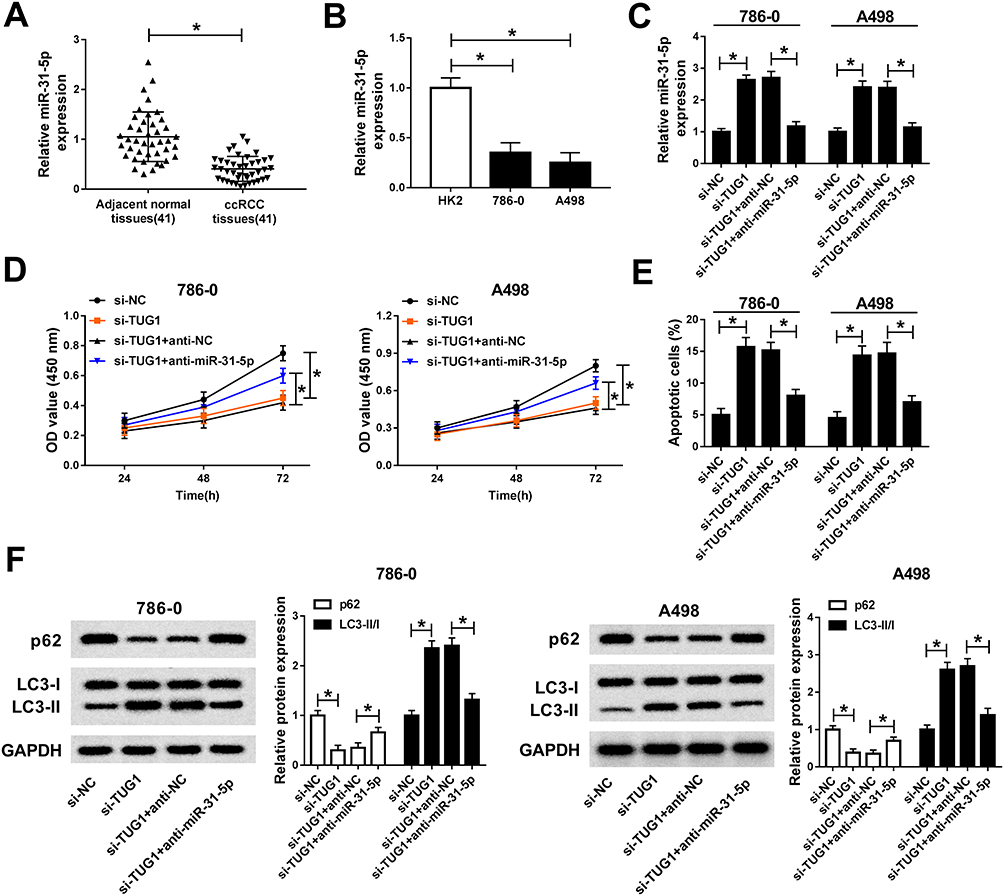 |
Figure 5 MiR-31-5p inhibitor mitigates the suppressive effect on cell proliferation and promotion effects on cell apoptosis, autophagy by targeting TUG1 in 786-0 and A498 cells. (A–B) The level of miR-31-5p in ccRCC tissues (A) and cells (B) was examined by qRT-PCR. (C–F) 786-0 and A498 cells were transfected with si-TUG1, si-TUG1+anti-miR-31-5p or their matched controls. (C) The miR-31-5p expression in transfected cells was measured by qRT-PCR. (D) The cell viability in treated cells was evaluated via CCK-8 assay. (E) The apoptosis rate in transfected cells was assessed by flow cytometry. (F) The protein levels of p62, LC3-I and LC3-II in transfected cells were measured by Western blot. *P<0.05. Abbreviations: miR-31-5p, microRNA-31-5p; ccRCC, clear cell renal cell carcinoma; qRT-PCR, quantitative real-time polymerase chain reaction; si, small interfering RNA; TUG1, taurine-upregulated gene 1; NC, negative control; OD, optical density; CCK-8, Cell Counting Kit-8; GAPDH, glyceraldehyde-3-phosphate dehydrogenase. |
FLOT1 Is Negatively Interacted with MiR-31-5p
To further research the biological mechanism of miR-31-5p in ccRCC, TargetScan Human online database was used to search the putative target of miR-31-5p. The results displayed that FLOT1 3ʹUTR had complementary sequences with miR-31-5p (Figure 6A). Subsequently, the luciferase activity of FLOT1-wt reporter was dramatically decreased in 786-0 and A498 cells transfected with miR-321-5p mimics related to that in NC group, while the luciferase activity of FLOT1-mut reporter had no apparently fluctuation in any treatment group (Figure 6B). Also, RIP assay indicated that miR-31-5p enriched much more FLOT1 by Ago2 antibody rather than IgG antibody in 786-0 and A498 cells (Figure 6C). In addition, the protein level of FLOT1 was remarkably down-regulated in miR-31-5p-transfected 786-0 and A498 cells, and vice versa in anti-miR-31-5p group (Figure 6D). These data revealed that FLOT1 was a direct target of miR-31-5p.
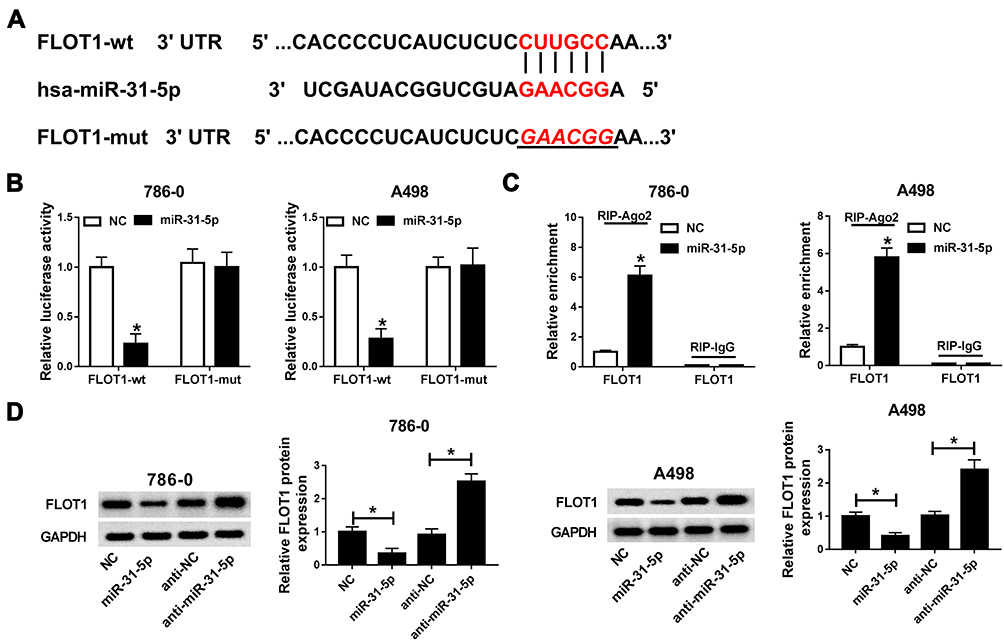 |
Figure 6 FLOT1 is negatively interacted with miR-31-5p. (A) The complementary binding sites between miR-31-5p and FLOT1 3ʹUTR and mutant sequences were exhibited. (B) The luciferase activity of FLOT1-wt or FLOT1-mut reporter in 786-0 and A498 cells transfected with miR-31-5p or NC was assessed by dual-luciferase reporter assay. (C) The enrichment of FLOT1 in 786-0 and A498 cells transfected with miR-31-5p or NC was evaluated by RIP assay. (D) The protein level of FLOT1 in 786-0 and A498 cells transfected with miR-31-5p, anti-miR-31-5p or their matched negative controls was measured by qRT-PCR. *P<0.05. Abbreviations: miR-31-5p, microRNA-31-5p; FLOT1, flotillin 1; wt, wild type; mut, mutant type; NC, negative control; IgG, immunoglobulin G; Ago2, Argonaute-2; RIP, RNA immunoprecipitation (RIP) assay; GAPDH, glyceraldehyde-3-phosphate dehydrogenase. |
FlOT1 Overexpression Attenuates the Inhibitory Effect on Cell Proliferation and the Promotion Effects on Cell Apoptosis and Autophagy in 786-0 and A498 Cells Caused by MiR-31-5p
To investigate the functions of miR-31-5p and FLOT1 in ccRCC, miR-31-5p and FLOT1 were co-transfected into 786-0 and A498 cells. The qRT-PCR results presented that FLOT1 was highly expressed in ccRCC tissues and cells (Figure 7A and B). The protein level of FLOT1 was strikingly decreased in 786-0 and A498 cells transfected with miR-31-5p, and FLOT1 level was ameliorated in 786-0 and A498 cells co-transfected with miR-31-5p and FLOT1 overexpression vector (Figure 7C). Furthermore, CCK-8 assay displayed that the transfection of FLOT1 reverted the cell viability in 786-0 and A498 cell transfected with miR-31-5p mimics (Figure 7D). Also, the flow cytometry results indicated that overexpression of FLOT1 weakened the promotion effect on cell apoptotic rate in 786-0 and A498 cell transfected with miR-31-5p mimics (Figure 7E). In addition, the Western blot assay presented that the protein level of p62 was regain and the ratio of LC3-II/I was counteracted in 786-0 and A498 cells co-transfected with miR-31-5p and FLOT1 compared with that in miR-31-5p group (Figure 7F). These results uncovered that FlOT1 overexpression abated the inhibitory effect on cell proliferation and the promotion effects on cell apoptosis and autophagy in 786-0 and A498 cells caused by miR-31-5p.
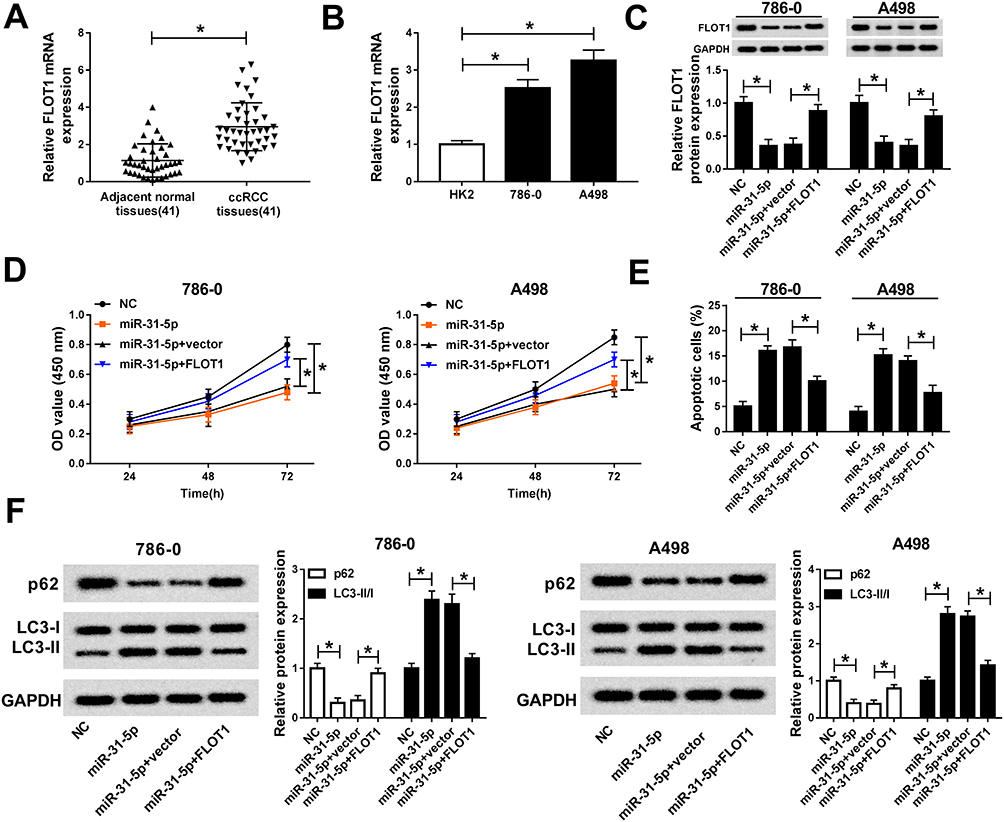 |
Figure 7 FlOT1 overexpression attenuated the inhibitory effect on cell proliferation and the promoted effects on cell apoptosis, autophagy in 786-0 and A498 cells caused by miR-31-5p. (A–B) The level of FLOT1 in ccRCC tissues (A) and cells (B) was determined by qRT-PCR. (C–F) 786-0 and A498 cells were transfected with miR-31-5p, miR-31-5p+FLOT1 or their matched controls. (C) The protein level of FLOT1 in transfected 786-0 and A498 cells was measured by Western blot. (D) The cell viability in transfected cells was assessed via CCK-8 assay. (E) The apoptotic rate in transfected cells was detected by flow cytometry. (F) The protein levels of p62, LC3-I and LC3-II in transfected 786-0 and A498 cells were measured by Western blot assay. *P<0.05. Abbreviations: FLOT1, flotillin 1; miR-31-5p, microRNA-31-5p; qRT-PCR, quantitative real-time polymerase chain reaction; ccRCC, clear cell renal cell carcinoma; NC, negative control; OD, optical density; CCK-8, Cell Counting Kit-8; GAPDH, glyceraldehyde-3-phosphate dehydrogenase. |
MiR-31-5p Inhibitor Reverts the Expression of FLOT1 in 786-0 and A498 Cells Induced by TUGI Depletion
To further validate the biological mechanism among TUG1, miR-31-5p and FLOT1 in ccRCC, si-TUG1 and anti-miR-31-5p were co-transfected into 786-0 and A498 cells. The recuperated experiment indicated that miR-31-5p inhibitor reversed the protein level of TUG1 in 786-0 and A498 cells repressed by si-TUG1 (Figure 8A and B). These data unraveled that TUG1 positively regulate the expression FLOT1 by sponging miR-31-5p.
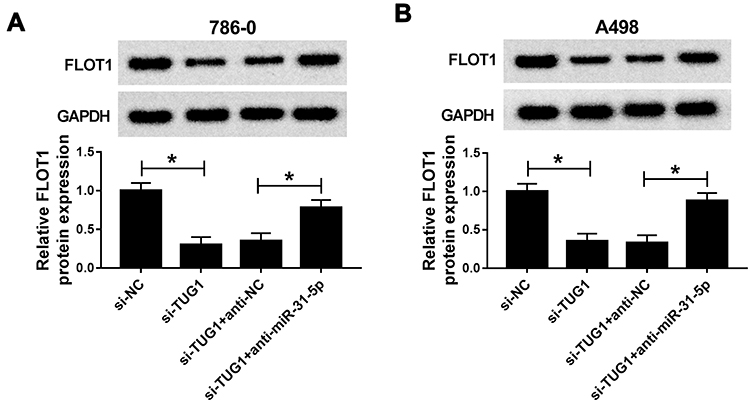 |
Figure 8 MiR-31-5p inhibitor reverts the expression of FLOT1 in 786-0 and A498 cells induced by TUGI depletion. (A–B) The protein level of FLOT1 in 786-0 (A) and A498 (B) cells transfected with si-TUG1, si-TUG1+anti-miR-31-5p or their matched controls was measured by Western blot. *P<0.05. Abbreviations: miR-31-5p, microRNA-31-5p; FLOT1, flotillin 1; TUG1, taurine-upregulated gene 1; si, small interfering RNA; NC, negative control; GAPDH, glyceraldehyde-3-phosphate dehydrogenase. |
Discussion
Clear cell renal cell carcinoma (ccRCC) is a common lethal urologic tumor in kidney. LncRNA TUG1 was reported to act as an oncogene to regulate the expression of miRNA and the target gene in diverse tumors, including ccRCC. This study focused on the functions and biological mechanism of TUG1 in ccRCC. The results demonstrated that TUG1 modulated FLOT1 to regulated tumor progression in ccRCC by sponging miR-31-5p.
ccRCC is characterized by a reprogramming of energetic metabolism. In particular the metabolic flux through glycolysis is partitioned,32,33 and mitochondrial bioenergetics and OxPhox are impaired, as well as lipid metabolism.34 It is well documented that dysregulation of TUG1 was associated with many processes in tumor progression. Moreover, we found that TUG1 was significantly up-regulated in ccRCC tissues and cells, suggesting that TUG1 might regulate the essential metabolic pathways in ccRCC. Moreover, TUG1 knockdown inhibited cell proliferation and promoted cell apoptosis and autophagy in ccRCC cells (876-0 and A498). In addition, TUG1 silencing restrained xenograft tumor growth in vivo. Previous study also indicated that TUG1 was significantly up-regulated in papillary thyroid cancer,11 colorectal cancer12 and cervical cancer,13 and TUG1 silencing blocked tumor progression in many processes, such as cell proliferation, migration, invasion and epithelial-mesenchymal transition (EMT). The above results was consisted with previous reports.14–17
Emerging evidence implicated that lncRNA could function as competing endogenous RNA (ceRNA) to sponge target miRNAs. In this study, miR-31-5p was first reported to directly and negatively interact with TUG1. MiR-31-5p was apparently down-regulated in ccRCC tissues and cells. Furthermore, the restoration experiment disclosed that TUG1 regulated cell proliferation, apoptosis and autophagy by sponging miR-31-5p. Li and colleagues reported the similar results about miR-31-5p in renal cell carcinoma, miR-31-5p was conspicuously down-regulated in renal cell carcinoma tissues and cells (786-0 and ACHN), and miR-31-5p overexpression inhibited cell proliferation, migration, invasion and cell cycle.22
Accumulating reports indicated that FLOT1 was involved in tumor progression. For example, a study indicated that FLOT1 was apparently increased in ccRCC tissues and cells, and FLOT1 overexpression enhanced cell proliferation.27 Another study implicated that FLOT1 knockdown constrained cell proliferation, migration in ccRCC and was targeted by miR-506.28 In this study, FLOT1 was remarkably up-regulated in ccRCC tissues and cells. Meanwhile, FLOT1 was first documented to negatively interact with miR-31-5p. Moreover, FLOT1 overexpression attenuated the inhibitory effect on cell proliferation and the promoted effects on cell apoptosis and autophagy by targeting miR-31-5p. The recuperated experiment indicated that TUG1 promoted cell proliferation and inhibited cell apoptosis, autophagy in ccRCC by working as a ceRNA to sponge miR-31-5p, thus up-regulating the protein level of FLOT1.
In summary, TUG1 knockdown or miR-31-5p overexpression suppressed cell proliferation and accelerated cell apoptosis and autophagy in ccRCC. Further functional and mechanistical experiment unraveled that lncRNA TUG1 modulated FLOT1 expression by sponging miR-31-5p, thus to regulate cell proliferation, apoptosis and autophagy in ccRCC. Thus, this new regulatory pathway may provide therapeutic target for renal cell carcinoma patients.
Funding
Not applicable.
Disclosure
The authors report no conflicts of interest in this work.
References
1. Cindolo L, Patard JJ, Chiodini P, et al. Comparison of predictive accuracy of four prognostic models for nonmetastatic renal cell carcinoma after nephrectomy: a multicenter European study. Cancer. 2005;104:1362–1371. doi:10.1002/cncr.21331
2. Karakiewicz PI, Briganti A, Chun FK, et al. Multi-institutional validation of a new renal cancer-specific survival nomogram. J Clin Oncol. 2007;25:1316–1322. doi:10.1200/JCO.2006.06.1218
3. Jiang Z, Chu PG, Woda BA, et al. Combination of quantitative IMP3 and tumor stage: a new system to predict metastasis for patients with localized renal cell carcinomas. Clin Cancer Res. 2008;14:5579–5584. doi:10.1158/1078-0432.CCR-08-0504
4. Yang G, Lu X, Yuan L. LncRNA: a link between RNA and cancer. Biochim Biophys Acta. 2014;1839:1097–1109. doi:10.1016/j.bbagrm.2014.08.012
5. Ellinger J, Alam J, Rothenburg J, et al. The long non-coding RNA lnc-ZNF180-2 is a prognostic biomarker in patients with clear cell renal cell carcinoma. Am J Cancer Res. 2015;5:2799–2807.
6. Zhang HM, Yang FQ, Chen SJ, et al. Upregulation of long non-coding RNA MALAT1 correlates with tumor progression and poor prognosis in clear cell renal cell carcinoma. Tumour Biol. 2015;36:2947–2955. doi:10.1007/s13277-014-2925-6
7. Hirata H, Hinoda Y, Shahryari V, et al. Long noncoding RNA MALAT1 promotes aggressive renal cell carcinoma through Ezh2 and interacts with miR-205. Cancer Res. 2015;75:1322–1331. doi:10.1158/0008-5472.CAN-14-2931
8. Zhang HM, Yang FQ, Yan Y, et al. High expression of long non-coding RNA SPRY4-IT1 predicts poor prognosis of clear cell renal cell carcinoma. Int J Clin Exp Pathol. 2014;7:5801–5809.
9. Wu Y, Tan C, Weng WW, et al. Long non-coding RNA Linc00152 is a positive prognostic factor for and demonstrates malignant biological behavior in clear cell renal cell carcinoma. Am J Cancer Res. 2016;6:285–299.
10. Young TL, Matsuda T, Cepko CL. The noncoding RNA taurine upregulated gene 1 is required for differentiation of the murine retina. Curr Biol. 2005;15:501–512. doi:10.1016/j.cub.2005.02.027
11. Lei H, Gao Y, Xu X. LncRNA TUG1 influences papillary thyroid cancer cell proliferation, migration and EMT formation through targeting miR-145. Acta Biochim Biophys Sin. 2017;49:588–597. doi:10.1093/abbs/gmx047
12. Sun J, Hu J, Wang G, et al. LncRNA TUG1 promoted KIAA1199 expression via miR-600 to accelerate cell metastasis and epithelial-mesenchymal transition in colorectal cancer. J Exp Clin Cancer Res. 2018;37:106. doi:10.1186/s13046-018-0771-x
13. Hu Y, Sun X, Mao C, et al. Upregulation of long noncoding RNA TUG1 promotes cervical cancer cell proliferation and migration. Cancer Med. 2017;6:471–482. doi:10.1002/cam4.994
14. Wang PQ, Wu YX, Zhong XD, et al. Prognostic significance of overexpressed long non-coding RNA TUG1 in patients with clear cell renal cell carcinoma. Eur Rev Med Pharmacol Sci. 2017;21:82–86.
15. Zhang M, Lu W, Huang Y, et al. Downregulation of the long noncoding RNA TUG1 inhibits the proliferation, migration, invasion and promotes apoptosis of renal cell carcinoma. J Mol Histol. 2016;47:421–428. doi:10.1007/s10735-016-9683-2
16. Liu S, Yang Y, Wang W, et al. Long noncoding RNA TUG1 promotes cell proliferation and migration of renal cell carcinoma via regulation of YAP. J Cell Biochem. 2018;119:9694–9706. doi:10.1002/jcb.27284
17. Yang Y, Sun DM, Yu JF, et al. Long noncoding RNA TUG1 promotes renal cell carcinoma cell proliferation, migration and invasion by downregulating microRNA196a. Mol Med Rep. 2018;18:5791–5798. doi:10.3892/mmr.2018.9608
18. Lewis BP, Burge CB, Bartel DP. Conserved seed pairing, often flanked by adenosines, indicates that thousands of human genes are microRNA targets. Cell. 2005;120:15–20. doi:10.1016/j.cell.2004.12.035
19. Sekino Y, Sakamoto N, Sentani K, et al. miR-130b promotes sunitinib resistance through regulation of PTEN in renal cell carcinoma. Oncology. 2019;97:164–172. doi:10.1159/000500605
20. Wang Y, Dong D, Jiang S, et al. miR-216b post-transcriptionally downregulates oncogene KRAS and inhibits cell proliferation and invasion in clear cell renal cell carcinoma. Cell Physiol Biochem. 2018;49:1755–1765. doi:10.1159/000493621
21. Pan W, Pang LJ, Cai HL, et al. MiR-1294 acts as a tumor suppressor in clear cell renal cell carcinoma through targeting HOXA6. Eur Rev Med Pharmacol Sci. 2019;23:3719–3725. doi:10.26355/eurrev_201905_17797
22. Li Y, Quan J, Chen F, et al. MiR-31-5p acts as a tumor suppressor in renal cell carcinoma by targeting cyclin-dependent kinase 1 (CDK1). Biomed Pharmacother. 2019;111:517–526. doi:10.1016/j.biopha.2018.12.102
23. Babuke T, Tikkanen R. Dissecting the molecular function of reggie/flotillin proteins. Eur J Cell Biol. 2007;86:525–532. doi:10.1016/j.ejcb.2007.03.003
24. Zhao L, Li J, Liu Y, et al. Flotillin1 promotes EMT of human small cell lung cancer via TGF-beta signaling pathway. Cancer Biol Med. 2018;15:400–414. doi:10.20892/j.issn.2095-3941.2018.0053
25. Zhang SH, Wang CJ, Shi L, et al. High expression of FLOT1 is associated with progression and poor prognosis in hepatocellular carcinoma. PLoS One. 2013;8:e64709. doi:10.1371/journal.pone.0064709
26. Li H, Zhang Y, Chen SW, et al. Prognostic significance of Flotillin1 expression in clinically N0 tongue squamous cell cancer. Int J Clin Exp Pathol. 2014;7:996–1003.
27. Zhang Y, Li J, Song Y, et al. Flotillin-1 expression in human clear-cell renal cell carcinoma is associated with cancer progression and poor patient survival. Mol Med Rep. 2014;10:860–866. doi:10.3892/mmr.2014.2310
28. Yang FQ, Zhang HM, Chen SJ, et al. MiR-506 is down-regulated in clear cell renal cell carcinoma and inhibits cell growth and metastasis via targeting FLOT1. PLoS One. 2015;10:e0120258. doi:10.1371/journal.pone.0120258
29. Tanida I, Waguri S. Measurement of autophagy in cells and tissues. Methods Mol Biol. 2010;648:193–214. doi:10.1007/978-1-60761-756-3_13
30. Arriazu R, Pozuelo JM, Martin R, et al. Quantitative and immunohistochemical evaluation of PCNA, androgen receptors, apoptosis, and Glutathione-S-Transferase P1 on preneoplastic changes induced by cadmium and zinc chloride in the rat ventral prostate. Prostate. 2005;63:347–357. doi:10.1002/pros.20192
31. Woo M, Hakem R, Soengas MS, et al. Essential contribution of caspase 3/CPP32 to apoptosis and its associated nuclear changes. Genes Dev. 1998;12:806–819. doi:10.1101/gad.12.6.806
32. Lucarelli G, Loizzo D, Franzin R, et al. Metabolomic insights into pathophysiological mechanisms and biomarker discovery in clear cell renal cell carcinoma. Expert Rev Mol Diagn. 2019;19:397–407. doi:10.1080/14737159.2019.1607729
33. Bianchi C, Meregalli C, Bombelli S, et al. The glucose and lipid metabolism reprogramming is grade-dependent in clear cell renal cell carcinoma primary cultures and is targetable to modulate cell viability and proliferation. Oncotarget. 2017;8:113502–113515. doi:10.18632/oncotarget.23056
34. Lucarelli G, Rutigliano M, Sallustio F, et al. Integrated multi-omics characterization reveals a distinctive metabolic signature and the role of NDUFA4L2 in promoting angiogenesis, chemoresistance, and mitochondrial dysfunction in clear cell renal cell carcinoma. Aging. 2018;10:3957–3985. doi:10.18632/aging.101685
 © 2020 The Author(s). This work is published and licensed by Dove Medical Press Limited. The full terms of this license are available at https://www.dovepress.com/terms.php and incorporate the Creative Commons Attribution - Non Commercial (unported, v3.0) License.
By accessing the work you hereby accept the Terms. Non-commercial uses of the work are permitted without any further permission from Dove Medical Press Limited, provided the work is properly attributed. For permission for commercial use of this work, please see paragraphs 4.2 and 5 of our Terms.
© 2020 The Author(s). This work is published and licensed by Dove Medical Press Limited. The full terms of this license are available at https://www.dovepress.com/terms.php and incorporate the Creative Commons Attribution - Non Commercial (unported, v3.0) License.
By accessing the work you hereby accept the Terms. Non-commercial uses of the work are permitted without any further permission from Dove Medical Press Limited, provided the work is properly attributed. For permission for commercial use of this work, please see paragraphs 4.2 and 5 of our Terms.