")
Back to Journals » Cancer Management and Research » Volume 13
Long Non-Coding RNA HOXA11-AS Modulates Proliferation, Apoptosis, Metastasis and EMT in Cutaneous Melanoma Cells Partly via miR-152-3p/ITGA9 Axis
Authors Xu Y, Zhang J, Zhang Q, Xu H, Liu L
Received 14 September 2020
Accepted for publication 28 December 2020
Published 2 February 2021 Volume 2021:13 Pages 925—939
DOI https://doi.org/10.2147/CMAR.S281920
Checked for plagiarism Yes
Review by Single anonymous peer review
Peer reviewer comments 2
Editor who approved publication: Dr Antonella D'Anneo
Yongfei Xu,1,2 Jianwen Zhang,1 Qiangqiang Zhang,3 Hangxing Xu,4 Linbo Liu1
1Department of Plastic Surgery, The First Affiliated Hospital of Zhengzhou University, Zhengzhou City, Henan, People’s Republic of China; 2Department of Plastic Surgery, The First Affiliated Hospital of Henan University of Science and Technology, Luoyang City, Henan, People’s Republic of China; 3Burn Plastic Surgery, Luoyang Central Hospital Affiliated to Zhengzhou University, Luoyang City, Henan, People’s Republic of China; 4Department of Surgery, Luoyang Central Tunnel Hospital, Luoyang City, Henan, People’s Republic of China
Correspondence: Linbo Liu
Department of Plastic Surgery, The First Affiliated Hospital of Zhengzhou University, No. 1 Jianshe East Road, Jinshui District, Zhengzhou, 450000, Henan, People’s Republic of China
Tel +86-13937196215
Email [email protected]
Background: Long non-coding RNA homeobox A11 antisense RNA (HOXA11-AS) was showed to participate in the progression of different kinds of tumors, but the specific role of HOXA11-AS in cutaneous melanoma is not entirely unambiguous.
Methods: The levels of HOXA11-AS, microRNA-152-3p (miR-152-3p) and integrin alpha9 (ITGA9) were measured by quantitative real-time polymerase chain reaction (qRT-PCR). Cell proliferation was detected via 3-(4, 5-dimethylthiazol-2-y1)-2, 5-diphenyl tetrazolium bromide (MTT), and apoptosis was measured by flow cytometry. The assessment of cell metastasis was performed by transwell migration and invasion assays. The protein levels were detected through Western blot. Dual-luciferase reporter assay was utilized to explore the target relationship among HOXA11-AS, miR-152-3p and ITGA9. The effect of HOXA11-AS on melanoma in vivo was investigated via xenograft experiment.
Results: HOXA11-AS and ITGA9 were up-regulated while miR-152-3p was down-regulated in melanoma. Knockdown of HOXA11-AS refrained cell proliferation, metastasis and epithelial–mesenchymal transition (EMT) but induced apoptosis in melanoma cells. HOXA11-AS targeted miR-152-3p and overexpression of HOXA11-AS mitigated the miR-152-3p-induced effects on melanoma cellular behaviors. ITGA9 was a target of miR-152-3p and miR-152-3p inhibitor relieved the repression on proliferation, metastasis and EMT while elevation on apoptosis caused by si-ITGA9 via elevating ITGA9. HOXA11-AS knockdown restrained ITGA9 expression via up-regulating miR-152-3p. Suppression of HOXA11-AS inhibited melanoma progression in part through increasing miR-152-3p and decreasing ITGA9 expression in vivo.
Conclusion: HOXA11-AS modulated proliferation, apoptosis, metastasis and EMT in melanoma cells by regulating miR-152-3p/ITGA9 axis in part. HOXA11-AS could promote melanoma development and be used as a promising biomarker in the diagnosis and treatment for cutaneous melanoma.
Keywords: melanoma, HOXA11-AS, miR-152-3p, ITGA9
Introduction
Melanocytes can produce melanin to attenuate the damaging effects of ultraviolet radiation (UVR) on human skin.1 Melanoma is the most common skin cancer originating from the transformed epidermal melanocytes2 and UVR is considered as the main etiological factor for cutaneous melanoma.3 In morphology, melanoma cells contain very rare melanin pigment granules with the polymorphism and obvious atypia.4 As a complicated genetic disease with high metastatic possibility,5,6 the incidence and mortality of melanoma are rising at a staggering rate over the past few decades.7 Melanogenesis can affect the cellular behaviors (cycle, survival, differentiation and invasion, etc.) of melanoma cells8 and the therapeutic effect on melanomas.9,10 Long non-coding RNAs (lncRNAs) and microRNAs (miRNAs) were reported to take part in the melanoma biology and act as possible targets for melanoma treatment.11 Therefore, it is essential to search more diagnostic and therapeutic biomarkers of melanoma.
Numerous studies have shown that lncRNAs were involved in the evolution of various tumors, although they do not have the abilities to encode proteins.12,13 For example, urothelial carcinoma-associated 1 (UCA1) and metastasis-associated lung adenocarcinoma transcript 1 (MALAT-1) were increased in melanoma and related to the metastasis of melanoma.14 Cancer Susceptibility Candidate 2 (CASC2) was down-regulated in melanoma and inhibited cell proliferation, invasion and migration.15 Homeobox A11 antisense RNA (HOXA11-AS) is the antisense strand of HOXA11 gene and usually functions as a regulatory RNA in many human cancers.16 However, little research has been done on the role of HOXA11-AS in melanoma.
MiRNAs (about 22 nucleotides) are another genre of ncRNAs that can function as the post-transcriptional gene regulators.17 MiRNAs were shown to play vital roles in tumorigenesis and prognosis of multiple tumors,18 including melanoma.19 For instance, miR-10b was a valid marker for the prognosis of melanoma20 and miR-29a was reduced cell growth and metastasis of melanoma via regulating B-cell-specific Moloney murine leukemia virus insertion site 1 (BMI1).21 But the function of miR-152-3p in melanoma is unclear.
Integrin alpha9 (ITGA9), an integrin subunit, is initially isolated from human lung and small intestine complementary DNA (cDNA) libraries.22 ITGA9 is widely distributed in epithelia and muscles with the regulatory function in diverse cancers, including breast cancer,23 cervical cancer24 and non-small cell lung cancer.25 Nevertheless, the reports of ITGA9 in melanoma are few.
The objective of our present study was to explore the role of HOXA11-AS in melanoma and the regulatory mechanism among HOXA11-AS, miR-152-3p and ITGA9 in cellular processes, intending to promote the understanding of the molecular pathogenesis in melanoma.
Materials and Methods
Ethic Statement
For clinical human samples, our study was performed after obtaining ratification from the Ethics Committee of The First Affiliated Hospital of Zhengzhou University. The research has been carried out in accordance with the World Medical Association Declaration of Helsinki, and that all subjects provided written informed consent. The animal experiment in this research was authorized by the Experimental Animal Ethics Committee of The First Affiliated Hospital of Zhengzhou University. Animal studies were performed in compliance with the ARRIVE guidelines and the Basel Declaration. All animals received humane care according to the National Institutes of Health (USA) guidelines.
Tissues Source and Cell Culture
Melanoma tissues and matched neighboring normal tissues (n=30) were acquired from patients who underwent melanoma excision at The First Affiliated Hospital of Zhengzhou University. These melanoma tissues were divided into I+II stages (n=14) and III+IV stages (n=16) according to the tumor-node-metastasis (TNM) stage by AJCC Version 8. The detailed clinicopathologic features of melanoma patients are shown in Table 1. Collected samples were promptly saved in a liquid nitrogen canister. All patients who participated in this donation of tissues signed the written informed consent forms.
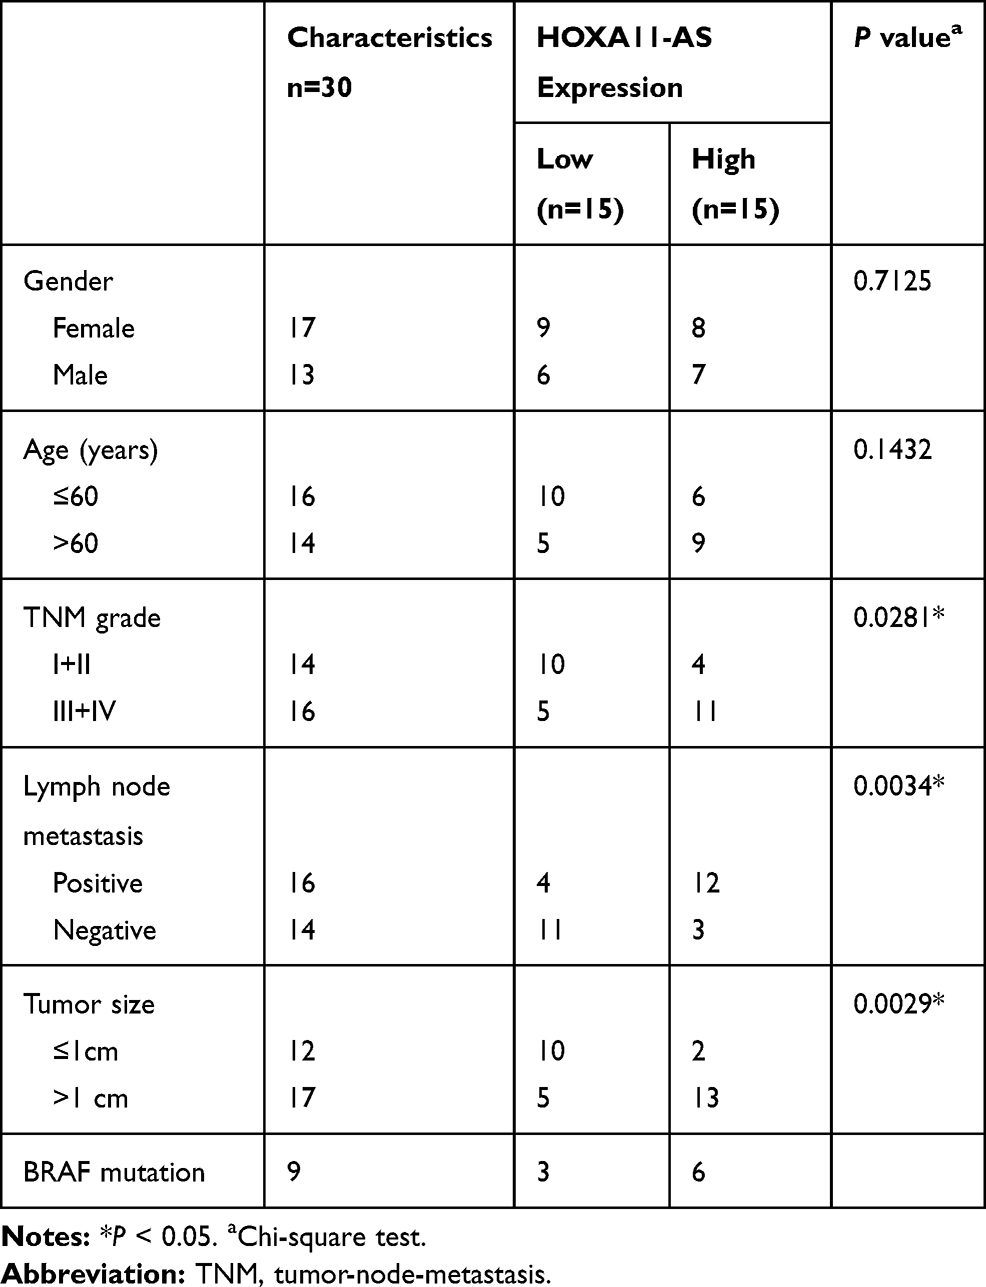 |
Table 1 Relationship Between HOXA11-AS Expression and Clinicopathologic Features of Melanoma Patients |
Human epidermal melanocyte HEMa-LP was bought from Thermo Fisher Scientific (Waltham, MA, USA), and melanoma cell lines (A875 and M14) were purchased from TONGWEI Biotechnology Co., Ltd. (Shanghai, China). A875 and M14 cell lines have a BRAF mutation with the substitution of valine by a glutamic acid at position 600 (V600E). HEMa-LP cells were maintained in medium 254 complemented with human melanocyte growth supplement-2 (HMGS-2). Dulbecco’s modified Eagle medium (DMEM) and Roswell Park Memorial Institute-1640 (RPMI-1640) were, respectively, used to culture A875 and M14 cells, supplemented with 10% fetal bovine serum (FBS) and antibiotics (100 U/mL penicillin, 100 μg/mL streptomycin). All these reagents were purchased from Thermo Fisher Scientific. Cells were cultivated in a 37°C incubator with humid air and 5% CO2.
Cell Transfection
Small interfering RNA (siRNA) targeting HOXA11-AS (si-HOXA11-AS), short hairpin RNA (shRNA) against HOXA11-AS (sh-HOXA11-AS), miR-152-3p inhibitor (anti-miR-152-3p), miR-152-3p mimic (miR-152-3p), siRNA against ITGA9 (si-ITGA9) and relative negative controls (si-NC, sh-NC, anti-miR-NC, miR-NC) were synthesized from RIBOBIO (Guangzhou, China). The cDNA sequence of HOXA11-AS was cloned into the pcDNA3.1 vector (Invitrogen, Carlsbad, CA, USA) to construct the overexpression vector pcDNA3.1-HOXA11-AS (HOXA11-AS). Lipofectamine 2000 (Invitrogen) was used for cell transfection. When cells grew to 70–90% coverage, the prepared oligonucleotides/constructs-lipid complexes were incubated for 5 min and added to cells. Transfected cells were continued to culture for later experiments.
RNA Extraction and Quantitative Real-Time Polymerase Chain Reaction (qRT-PCR)
Trizol reagent (Invitrogen) was used for extracting total RNA from melanoma tissues and cells. PrimeScript™ RT Master Mix (Takara, Dalian, China) was utilized to synthesize the cDNAs, and TB Green® Premix Ex Taq™ II Kit (Takara) was implemented for the PCR reaction, following the manufacturers’ directions. HOXA11-AS and ITGA9 were normalized by glyceraldehyde-3-phosphate dehydrogenase (GAPDH), and small nuclear RNA U6 served as the internal control for miR-152-3p. The sequences of primers were HOXA11-AS, forward: 5ʹ-TGCCAAGTTGTACTTACTACGTC-3ʹ and reverse: 5ʹ-GTTGGAGGAGTAGGAGTATGTA-3ʹ; miR-152-3p, forward: 5ʹ-ACACTCCAGCTGGGTCAGTGCATGACAG-3ʹ and reverse: 5ʹ-CTCAACTGGTGTCGTGGAGTCGGCAATTCAGTTGAGCCAAGTT-3ʹ; ITGA9, forward: 5ʹ-GACGCTGATCCCTTGCTATGA-3ʹ and reverse: 5ʹ-CGGTGAAGAAGCCCGCTATC-3ʹ; GAPDH, forward: 5ʹ-AAGAGCTACGAGCTGCCTGAC-3ʹ and reverse: 5ʹ-ATGGCCCAGCGGATGAG-3ʹ; U6, forward: 5ʹ-CAAATTCGTGAAGCGTTCCATA-3ʹ and reverse: 5ʹ-AGTGCAGGGTCCGAGGTATTC-3ʹ. The 2−∆∆Ct approach was used to calculate the relative expression levels.
3-(4, 5-Dimethylthiazol-2-yl)-2, 5-Diphenyl Tetrazolium Bromide (MTT) Assay
At 0 h, 24 h, 48 h, 72 h post-transfection, A875 and M14 cells were, respectively, incubated with 10 μL MTT (Invitrogen) for 4 h. After the supernatants were discarded, 100 μL dimethylsulfoxide (DMSO; Invitrogen) was added to each well and thoroughly mixed to incubate cells for about 10 min. Then, absorbance at 490 nm was read through the microplate reader (Thermo Fisher Scientific).
Flow Cytometry
Annexin V-fluorescein isothiocyanate (Annexin V-FITC)/propidium iodide (PI) kit (Sigma-Aldrich, Saint Louis, MO, USA) was used to detect apoptotic cells. Firstly, A875 and M14 cells were collected by digesting of trypsin and centrifuging for 10 min at 3000 rpm. Next, pre-cooled 1 × Phosphate buffered saline (PBS; Invitrogen) was applied for washing cells and cell resuspension was prepared using 1 × binding buffer. Then, phosphatidylserine sites of cytomembrane could be labeled by Annexin V-FITC and necrotic cells were stained by PI. Finally, apoptotic cells were quantified through the flow cytometer (Becton Dickinson, San Jose, CA, USA).
Transwell Migration and Invasion Assays
Cell migration and invasion were examined by transwell 24-well chamber (Corning Life Sciences, Corning, NY, USA). Harvested A875 and M14 cells were resuspended in serum-free medium and resuspended cells were inoculated into the upper chamber, then the relative specific medium with 10% FBS was added to the lower chamber. After 24 h, cells were fixed and colored by 4% paraformaldehyde and crystal violet (Sangon Biotech, Shanghai, China), respectively. Migrated or invaded cells were observed and cell number was counted under a microscope. Specially, the upper chamber was first enveloped with matrigel (Corning Life Sciences) before cell inoculation in invasion assay, while migration assay was not needed.
Western Blot Assay
Radio-Immunoprecipitation Assay (RIPA) lysis buffer (Sigma-Aldrich) was utilized for extracting total proteins from melanoma tissues and cells. At first, proteins were segregated on 10% sodium dodecyl sulfate-polyacrylamide gel (Sigma-Aldrich) and transferred onto polyvinylidene fluoride (PVDF) membranes (Sigma-Aldrich). After the membranes were blocked by 5% skim milk (Thermo Fisher Scientific), primary antibodies were incubated to the membranes overnight at 4°C. The primary antibodies used were as below: anti-E-cadherin (1:1000; ab40772, Abcam, Cambridge, United Kingdom), anti-N-cadherin (1:1000; ab76011, Abcam), anti-Vimentin (1:1000; ab92547, Abcam), anti-ITGA9 (1:1000; ab140599, Abcam), anti-proliferating cell nuclear antigen (anti-PCNA; 1:1000, ab92552, Abcam), anti-cyclinD1 (1;1000, ab134175, Abcam), anti-B-cell lymphoma-2 (anti-Bcl-2; 1:1000, ab185002, Abcam), anti-Bcl-2-associated X (anti-Bax; 1;1000, ab32503, Abcam) and anti-GAPDH (1:3000; ab181602, Abcam). At the room temperature, the incubation with goat anti-rabbit secondary antibody (1:5000; ab205718, Abcam) was up to 1 h. Eventually, the chromogenic reaction was carried out by the enhanced chemiluminescence (ECL) reagent (Sigma-Aldrich), and the protein bands could be observed using the Image J software (NIH, Bethesda, MD, USA).
Dual-Luciferase Reporter Assay
The sequences of wild-type (WT) and mutant-type (MUT) HOXA11-AS were cloned into the pGL3 vector (Promega, Madison, WI, USA) and the positive plasmids were named as HOXA11-AS WT and HOXA11-AS MUT. Similarly, ITGA9 3ʹ-untranslated region (3ʹUTR) WT and ITGA9 3ʹUTR MUT were constructed. These recombinant luciferase reporter plasmids were, respectively, co-transfected into A875 and M14 cells with miR-152-3p or miR-NC, followed by cells lysing in 1 × passive lysis buffer (PLB; Promega) after transfection for 48 h. Then, luciferase activity of firefly and renilla in A875 and M14 cell lysate was measured through the dual-luciferase reporter system (Promega) in terms of the user’s manual.
Xenograft Tumor Assay
BALB/c nude mice (7 weeks old) were purchased from Beijing Laboratory Animal Center (Beijing, China). The sh-NC and sh-HOXA11-AS were severally transfected into A875 cells via lentiviral vector for stable expression. All nude mice were divided into two groups (5 mice per group) and subcutaneously injected with the transfected A875 cells. Tumor volume was measured weekly and calculated by the formula: (length × width2)/2. After 4 weeks, all mice were euthanized. The tumor tissues were weighed and used for the extraction of total RNA and proteins, then the levels of HOXA11-AS, miR-152-3p and ITGA9 were examined through qRT-PCR and Western blot. And the associated markers of cellular processes were assayed.
Statistical Analysis
Overall experiments in this study were conducted three times, and data appeared as the mean ± standard deviation (SD). The results were analyzed and processed using SPSS 19.0 and GraphPad Prism 7. Survival curve of patients was generated by Kaplan-Meier plot and analyzed by Log rank test. The linear relationship among HOXA11-AS, miR-152-3p and ITGA9 in melanoma tissues was analyzed by Spearman correlation coefficient. Student’s t-test and one-way analysis of variance followed by Tukey’s test were employed for analyzing the differences. P <0.05 was regarded as significant.
Results
HOXA11-AS Was Up-Regulated and miR-152-3p Was Down-Regulated in Melanoma Tissues and Cells
The expression levels of HOXA11-AS and miR-152-3p were examined by qRT-PCR. In comparison to normal tissues, the expression of HOXA11-AS was overtly increased in melanoma tissues (Figure 1A). There was a lower 5-year overall survival of melanoma patients with high expression of HOXA11-AS by contrast to those patients with low expression of HOXA11-AS (Figure 1B). Also, HOXA11-AS was markedly up-regulated in melanoma cell lines A875 and M14 compared to normal melanocytes HEMa-LP (Figure 1C). On the contrary, miR-152-3p expression was notably decreased in melanoma tissues (Figure 1D) than that in normal tissues. It was also inverse that overall survival was noticeably declined in patients with low miR-152-3p level (Figure 1E). Besides, the down-regulation of miR-152-3p was detected in A875 and M14 cells using normal HEMa-LP cells as control (Figure 1F). Interestingly, a conspicuous negative relation between HOXA11-AS and miR-152-3p expression was observed (R2 = 0.649, P< 0.0001) in melanoma tissues (Figure 1G). The dysregulation of HOXA11-AS and miR-152-3p demonstrated that they might play crucial roles in melanoma.
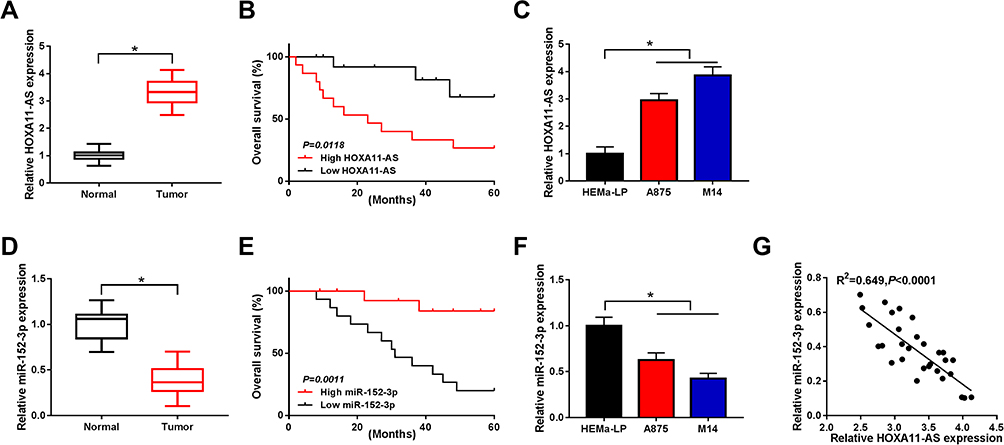 |
Figure 1 HOXA11-AS was up-regulated and miR-152-3p was down-regulated in melanoma tissues and cells. (A) The qRT-PCR was used to determine the expression of HOXA11-AS in melanoma tissues. (B) Survival curve was analyzed by Log rank test and generated by Kaplan-Meier plot in patients with high or low HOXA11-AS. (C) HOXA11-AS was examined using qRT-PCR in A875, M14 cells and normal HEMa-LP cells. (D) The miR-152-3p expression was detected by qRT-PCR in in melanoma tissues. (E) The Log rank test was applied to analyze the relation between miR-152-3p expression and patient survival. (F) The qRT-PCR was used for the measurement of miR-152-3p level in melanoma cells. (G) Linear relationship between HOXA11-AS and miR-152-3p in melanoma tissues was analyzed by Spearman correlation coefficient. *P< 0.05. |
Knockdown of HOXA11-AS Repressed Proliferation, Metastasis and Epithelial-Mesenchymal Transition (EMT) but Expedited Apoptosis in Melanoma Cells
To investigate the role of HOXA11-AS in melanoma, A875 and M14 cells were transfected with si-HOXA11-AS or si-NC. The qRT-PCR indicated that HOXA11-AS expression was distinctly decreased in si-HOXA11-AS group compared with si-NC group in A875 and M14 cells (Figure 2A and B). Then, MTT assay revealed that cell proliferation was strikingly declined in A875 and M14 cells transfected with si-HOXA11-AS (Figure 2C and D). Flow cytometry manifested that the apoptotic rate was increased after transfection with si-HOXA11-AS in A875 cells (Figure 2E) and M14 cells (Figure 2F). Besides, cell metastasis was evaluated by transwell migration and invasion assays. As shown in Figure 2G and H, the numbers of migrated and invaded cells were significantly fewer in si-HOXA11-AS group than these in si-NC group. Western blot was used to measure the levels of EMT-associated proteins. The level of E-cadherin (anti-EMT marker) was signally enhanced but N-cadherin and Vimentin (pro-EMT markers) were reduced (Figure 2I and J) in A875 and M14 cells transfected with si-HOXA11-AS, implying the EMT process was blocked after downregulation of HOXA11-AS. Thus, knockdown of HOXA11-AS generated the inhibitory effects on cellular proliferation, metastasis, EMT and the stimulative effect on apoptosis.
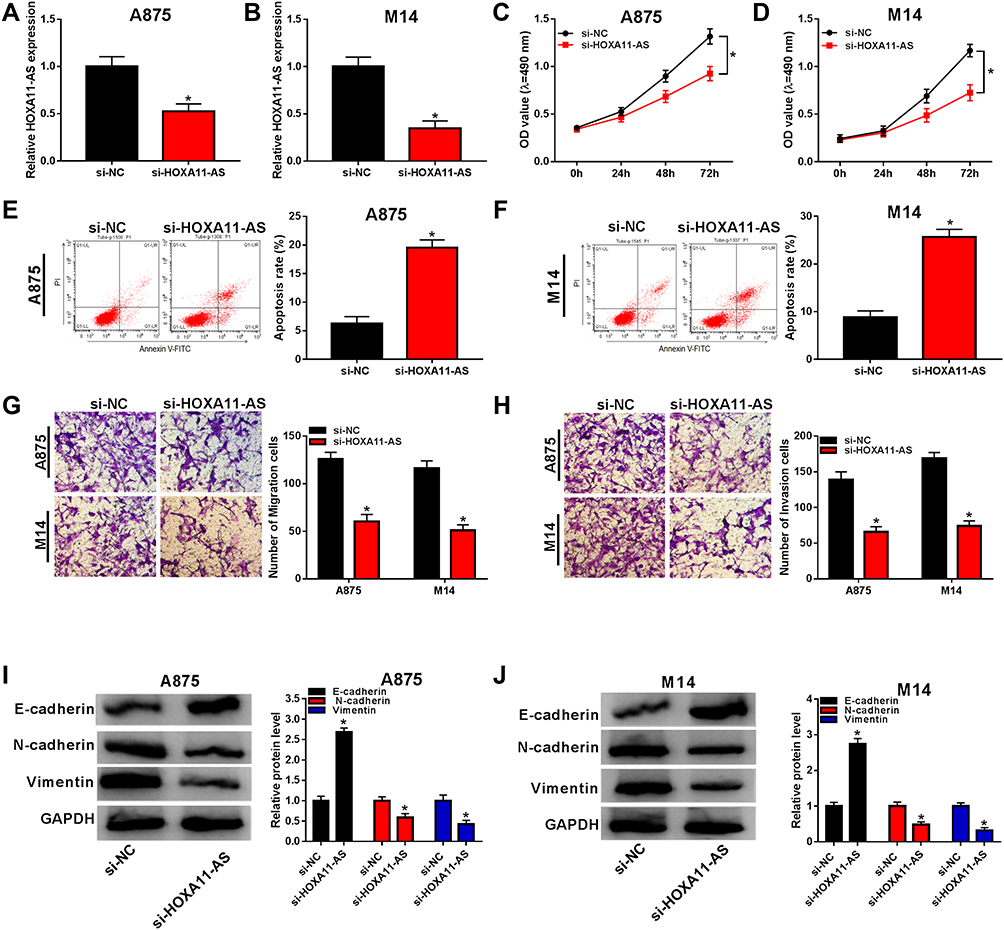 |
Figure 2 Knockdown of HOXA11-AS repressed proliferation, metastasis and EMT but expedited apoptosis in melanoma cells. (A and B) The knockdown effect of si-HOXA11-AS on the expression of HOXA11-AS was evaluated by qRT-PCR. (C and D) Cell proliferation was detected by MTT assay in A875 and M14 cells transfected with si-HOXA11-AS or si-NC. (E and F) Cell apoptosis was examined by flow cytometry. (G and H) Cell migration and invasion were determined by transwell assay. (I and J) The levels of EMT-associated proteins were measured by Western blot in transfected A875 and M14 cells. *P< 0.05. |
HOXA11-AS Directly Targeted miR-152-3p and Modulated miR-152-3p Expression
Starbase 2.0 was used for target prediction. As shown in Figure 3A, HOXA11-AS WT contained the binding sites with miR-152-3p. Dual-luciferase reporter assay presented that miR-152-3p prominently decreased the luciferase activity of HOXA11-AS WT group, contrasted to the HOXA11-AS MUT group in both A875 and M14 cells (Figure 3B and C). Additionally, miR-152-3p expression was obviously elevated by knockdown of HOXA11-AS and lessened by overexpression of HOXA11-AS in A875 and M14 cells (Figure 3D and E). These results manifested that HOXA11-AS directly modulated the expression of miR-152-3p in melanoma cells.
 |
Figure 3 HOXA11-AS directly targeted miR-152-3p and modulated miR-152-3p expression. (A) The binding sites of HOXA11-AS with miR-152-3p were predicted by Starbase 2.0. (B and C) Dual-luciferase reporter assay was used for the detection of luciferase activity of transfected A875 and M14 cells. (D and E) The expression of miR-152-3p was determined by qRT-PCR after transfection with si-HOXA11-AS, HOXA11-AS or relative controls. *P< 0.05. |
Overexpression of HOXA11-AS Relieved the miR-152-3p-Induced Effects on Proliferation, Apoptosis, Metastasis and EMT in Melanoma Cells
To explore the regulatory mechanism of HOXA11-AS in melanoma, A875 and M14 cells were transfected with miR-152-3p, miR-152-3p+HOXA11-AS or the relative controls. The qRT-PCR showed that the level of miR-152-3p was reduced after HOXA11-AS overexpression in A875 and M14 cells (Figure 4A and B). Cell proliferation was inhibited by transfection of miR-152-3p, whereas overexpression of HOXA11-AS alleviated this inhibitory effect (Figure 4C and D). Flow cytometry exhibited that miR-152-3p clearly increased the apoptotic rate in A875 and M14 cells, but the promoted effect was partly prevented by HOXA11-AS up-regulation (Figure 4E and F). In addition, transfection of HOXA11-AS significantly mitigated the miR-152-3p-induced suppressive effects on cell migration (Figure 4G) and invasion (Figure 4H). Moreover, the E-cadherin upregulation and N-cadherin/Vimentin downregulation caused by miR-152-3p were partially relieved by HOXA11-AS in A875 cells (Figure 4I) and M14 cells (Figure 4J). All these results insinuated that HOXA11-AS was related to miR-152-3p in regulating the progression of melanoma.
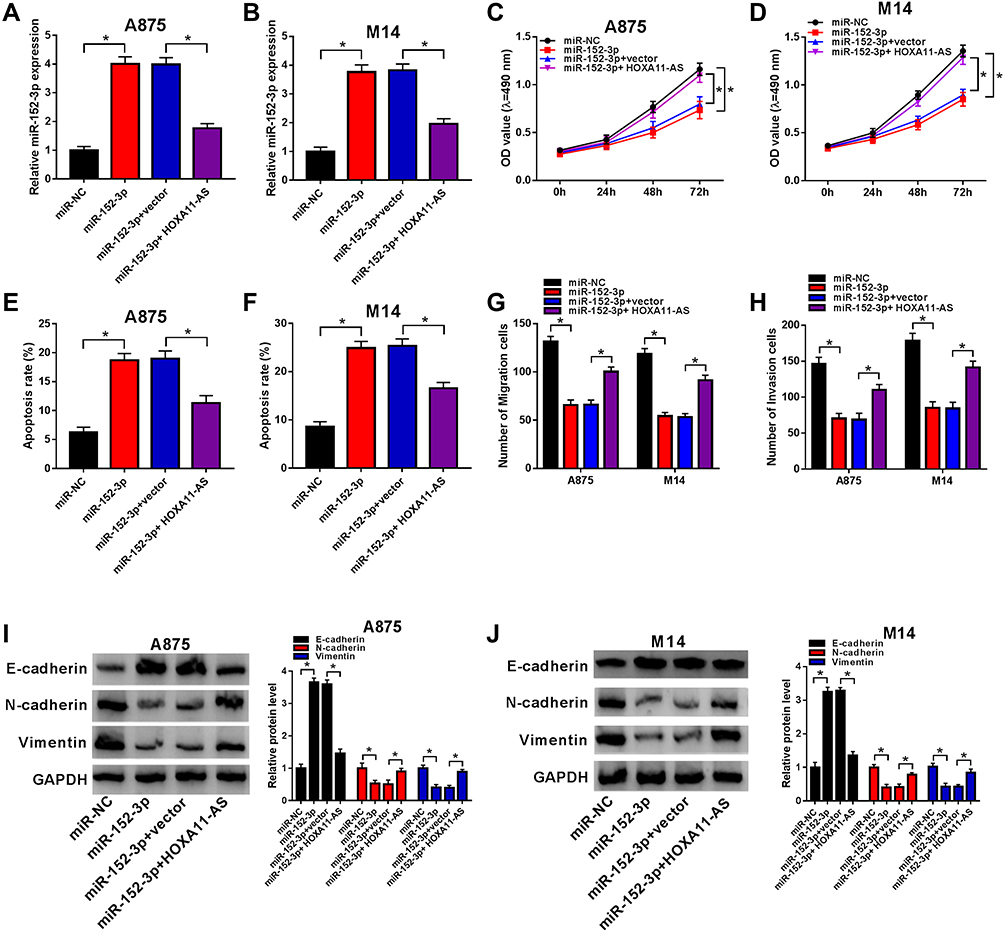 |
Figure 4 Overexpression of HOXA11-AS relieved the miR-152-3p-induced effects on proliferation, apoptosis, metastasis and EMT in melanoma cells. (A and B) The qRT-PCR was exploited to determine the expression of miR-152-3p in A875 and M14 cells transfected with miR-152-3p, miR-152-3p+HOXA11-AS or the corresponding controls. (C and D) MTT was utilized to examine cell proliferation. (E and F) Flow cytometry was applied to determine the apoptotic cells. (G and H) Transwell assay was used to measure cell migration and invasion. (I and J) Western blot was implemented for the measurement of f E-cadherin, N-cadherin and Vimentin in A875 and M14 cells. *P< 0.05. |
The Inhibitory Effect of HOXA11-AS Knockdown on the Progression of Melanoma Was Achieved by the Up-Regulation of miR-152-3p
Meanwhile, the rescued experiment was performed to notarize whether the function of HOXA11-AS knockdown was attributed to miR-152-3p up-regulation. After the qRT-PCR analysis, miR-152-3p inhibition was showed to weaken the increase of miR-152-3p level caused by si-HOXA11-AS in A875 and M14 cells (Supplemental Figure 1A and B). The si-HOXA11-AS-induced repression of cell proliferation (Supplemental Figure 1C and D) and the promotion of cell apoptosis (Supplemental Figure 1E and F) were countervailed following the down-regulation of miR-152-3p. Similarly, miR-152-3p inhibitor returned the inhibitory regulation of si-HOXA11-AS on cell migration (Supplemental Figure 1G), invasion (Supplemental Figure 1H) and EMT process (Supplemental Figure 1I and J). This revert of anti-miR-152-3p to si-HOXA11-AS suggested that the knockdown of HOXA11-AS retarded the development of melanoma via promoting miR-152-3p.
The miR-152-3p Targetedly Regulated the Expression of ITGA9
Through the prediction of TargetScan, we found that the 3ʹ-UTR of wild-type ITGA9 contained the binding sites of miR-152-3p (Figure 5A). The results of dual-luciferase reporter assay showed that the luciferase activity of ITGA9 3ʹUTR WT group was significantly declined by miR-152-3p, while this phenomenon was not found in ITGA9 3ʹUTR MUT group (Figure 5B and C). Then, qRT-PCR and Western blot indicated that the mRNA and protein levels of ITGA9 were higher in melanoma tissues than these in normal tissues (Figure 5D and E). After the analysis by Log rank test, Kaplan-Meier plot exhibited that ITGA9 at high level reduced the 5-year survival of melanoma patients contrasted to the low ITGA9 level (Figure 5F). The relation between the levels of miR-152-3p and ITGA9 was notably negative (R2=0.711, P< 0.0001) (Figure 5G). Also, ITGA9 mRNA and protein levels in A875 and M14 cells were up-regulated compared with normal HEMa-LP cells (Figure 5H and I). Furthermore, the mRNA expression of ITGA9 was observably inhibited by miR-152-3p and increased by anti-miR-152-3p transfection (Figure 5J). The same result was viewed in the protein level of ITGA9 by Western blot in A875 and M14 cells (Figure 5K and L). All above data unraveled that miR-152-3p targeted ITGA9.
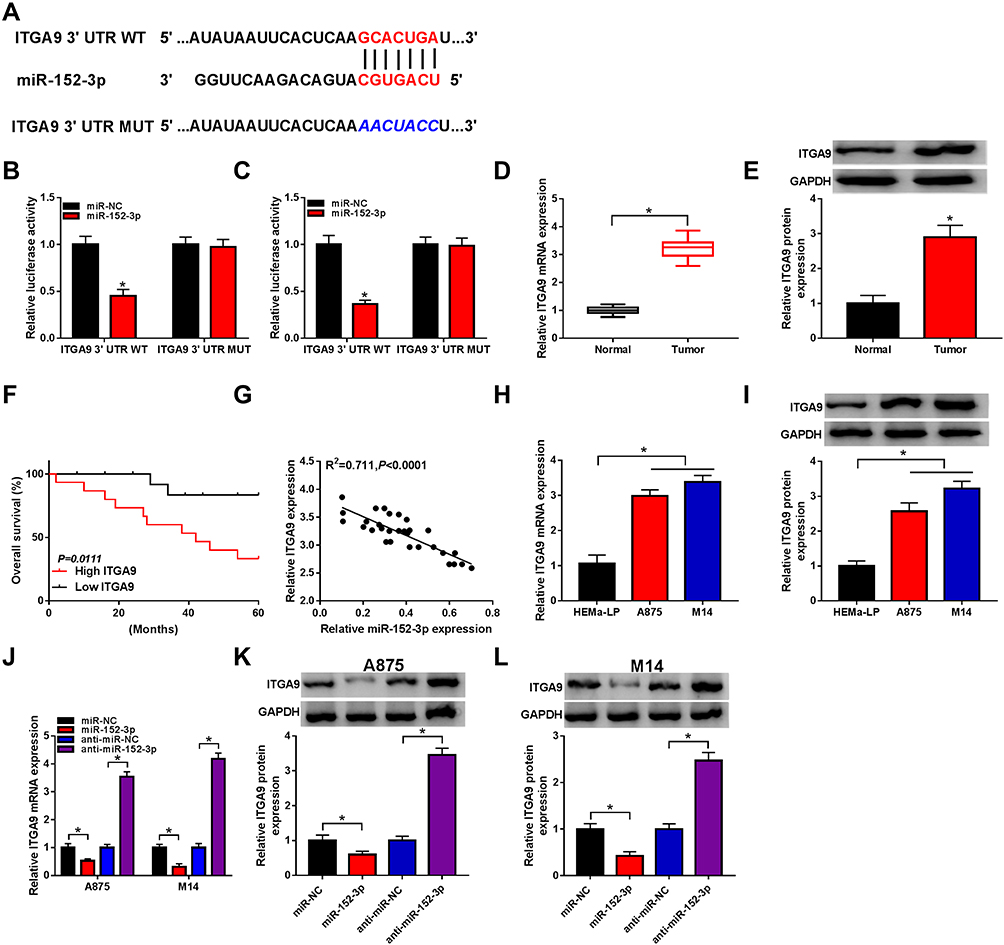 |
Figure 5 The miR-152-3p targetedly regulated the expression of ITGA9. (A) TargetScan was used for predicting the target of miR-152-3p. (B and C) The relation of miR-152-3p and ITGA9 was validated by dual-luciferase reporter assay. (D and E) The expression of ITGA9 in melanoma tissues was examined by qRT-PCR and Western blot. (F) The relationship between ITGA9 level and patient survival was analyzed by Log rank test. (G) Spearman correlation coefficient was utilized for analyzing the linear relation between miR-152-3p and ITGA9 in melanoma tissues. (H and I) The qRT-PCR and Western blot were administrated for detecting the ITGA9 expression in melanoma cells. (J) The mRNA level of ITGA9 was measured by qRT-PCR in A875 and M14 cells transfected with miR-152-3p, anti-miR-152-3p or matched controls. (K and L) The protein expression of ITGA9 was determined by Western blot. *P< 0.05. |
Down-Regulation of miR-152-3p Mitigated si-ITGA9-Induced Effects on Proliferation, Apoptosis, Metastasis and EMT in Melanoma Cells
A875 and M14 cells were transfected with si-ITGA9, si-ITGA9+anti-miR-152-3p or the respective controls for researching the function mechanism of miR-152-3p and ITGA9. Compared to the si-ITGA9 group, the mRNA and protein levels of ITGA9 were remarkably up-regulated by anti-miR-152-3p in A875 cells (Figure 6A and B) and M14 cells (Figure 6C and D). In MTT assay, the absorbance of si-ITGA9+anti-miR-152-3p group was higher than that in si-ITGA9+anti-miR-NC group in both A875 and M14 cells (Figure 6E and F). Transfection of anti-miR-152-3p decreased the apoptosis rate induced by si-ITGA9 in A875 and M14 cells (Figure 6G and H). Transwell assay indicated that si-ITGA9 visibly decreased cell migration and invasion, but anti-miR-152-3p averted the suppression in part (Figure 6I and J). In addition, the si-ITGA9-induced accelerative effect on E-cadherin and prohibitive effects on N-cadherin/Vimentin were abated by anti-miR-152-3p in A875 and M14 cells (Figure 6K and L). Taken together, miR-152-3p inhibition promoted the progression of melanoma via motivating the expression of ITGA9.
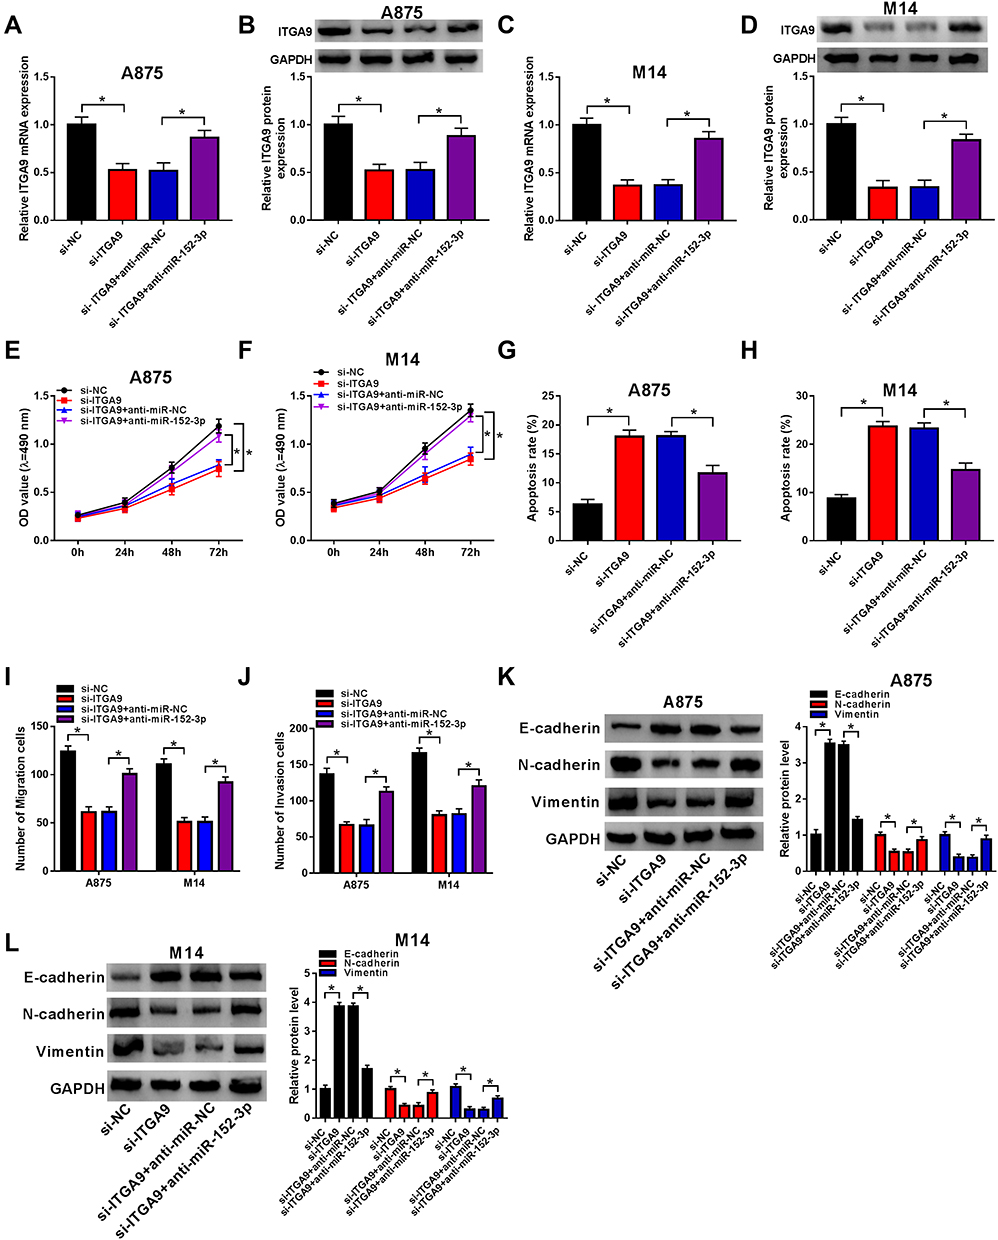 |
Figure 6 Down-regulation of miR-152-3p mitigated si-ITGA9-induced effects on proliferation, apoptosis, metastasis and EMT in melanoma cells. (A–D) The level of ITGA9 was detected by qRT-PCR and Western blot in A875 cells (A and B) and M14 cells (C and D). (E and F) MTT was adopted for the determination of cell proliferation. (G and H) Flow cytometry was utilized for measurement of cell apoptosis. (I and J) Transwell assay was used for evaluation of cell migration and invasion. (K and L) Western blot was exploited to examine the levels of E-cadherin, N-cadherin and Vimentin in A875 and M14 cells. *P< 0.05. |
Knockdown of HOXA11-AS Suppressed ITGA9 Expression Through Elevating miR-152-3p
Statistical analysis of the levels of HOXA11-AS and ITGA9 in melanoma tissues indicated that there was a significant positive relation (R2=0.658, P< 0.0001) (Figure 7A). Moreover, qRT-PCR revealed that the mRNA level of ITGA9 was inhibited by HOXA11-AS knockdown but anti-miR-152-3p reverted the inhibitory effect on ITGA9 (Figure 7B). Also, Western blot demonstrated that the repression of miR-152-3p conspicuously ameliorated the si-HOXA11-AS-induced ITGA9 protein downregulation in both A875 and M14 cells (Figure 7C and D). These results suggested that HOXA11-AS knockdown inhibited the level of ITGA9 by promoting miR-152-3p.
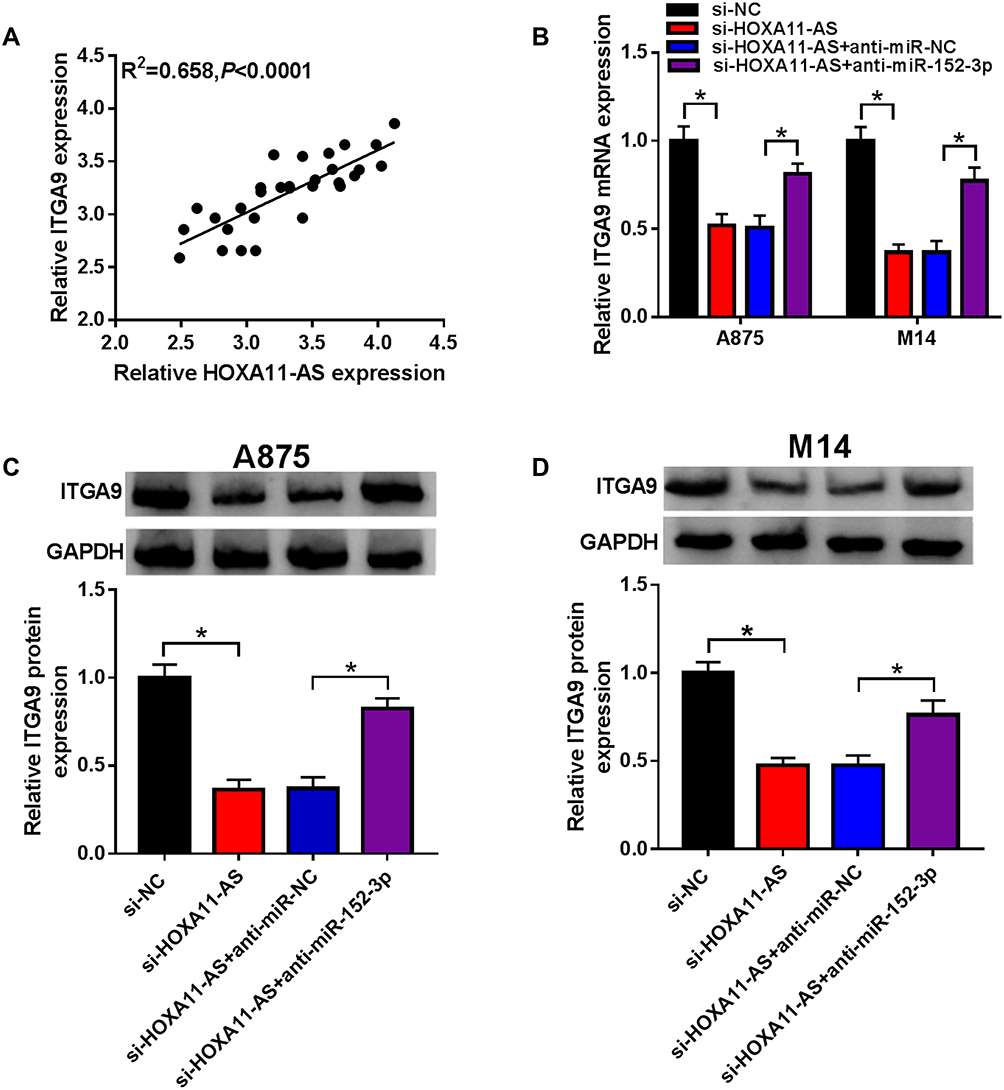 |
Figure 7 Knockdown of HOXA11-AS suppressed ITGA9 expression through elevating miR-152-3p. (A) The linear relation between HOXA11-AS and ITGA9 in melanoma tissues was analyzed using Spearman correlation coefficient. (B) ITGA9 mRNA level was detected by qRT-PCR in A875 and M14 cells transfected with si-HOXA11-AS, si-HOXA11-AS+anti-miR-152-3p or the relative controls. (C and D) ITGA9 protein level was examined by Western blot. *P< 0.05. |
Depression of HOXA11-AS Inhibited Melanoma Progression Partly by Up-Regulating miR-152-3p and Decreasing ITGA9 in vivo
To further explore the impact of HOXA11-AS in vivo, A875 cells stably expressed sh-NC or sh-HOXA11-AS were subcutaneously injected into the back flank of nude mice to establish the xenograft model of melanoma. As Figure 8A revealed, the tumor volume of sh-HOXA11-AS group was smaller than that of sh-NC group between 1 and 4 weeks. After 4 weeks, tumor weight was lower in sh-HOXA11-AS group by contrast to sh-NC group (Figure 8B). The qRT-PCR presented that HOXA11-AS expression was down-regulated in sh-HOXA11-AS group (Figure 8C). The level of miR-152-3p was up-regulated (Figure 8D), while ITGA9 mRNA and protein levels were decreased (Figure 8E and F) in the sh-HOXA11-AS group. Additionally, E-cadherin protein expression was enhanced while N-cadherin and Vimentin protein levels were reduced after knockdown of HOXA11-AS in vivo (Figure 8G). The down-regulation of PCNA and cyclinD1 (pro-proliferation proteins) in sh-HOXA11-AS group suggested that silencing HOXA11-AS inhibited the proliferation of melanoma in vivo (Figure 8H). The repression of Bcl-2 (anti-apoptosis marker) and the upregulation of Bax (pro-apoptosis marker) implied that apoptosis was triggered by knockdown of HOXA11-AS in vivo (Figure 8I). At least in part, HOXA11-AS affected the melanoma progression in vivo by modulating miR-152-3p and ITGA9 expression.
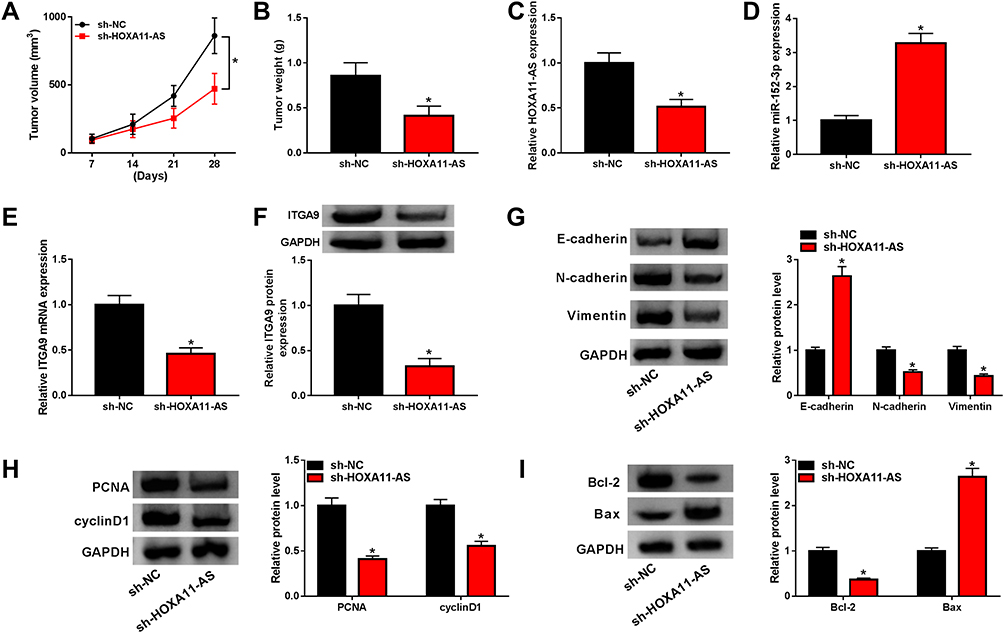 |
Figure 8 Depression of HOXA11-AS inhibited melanoma growth partly by up-regulating miR-152-3p and decreasing ITGA9 in vivo. (A) Tumor volume of sh-NC and sh-HOXA11-AS groups was calculated. (B) The excised tumors were weighed. (C and D) The qRT-PCR was utilized for detecting the levels of HOXA11-AS (C) and miR-152-3p (D). (E and F) The mRNA and protein levels of ITGA9 were detected by qRT-PCR and Western blot, respectively. (G–I) Western blot was exploited to measure the protein levels of EMT (G), proliferation (H) and apoptosis (I) associated markers in excised tumors. *P< 0.05. |
Discussion
Melanoma is the most invasive type of skin cancer and seriously affects human health due to its high metastatic capacity and mortality. More biomarkers for melanoma treatment need to be sought. The current study elucidated that HOXA11-AS was up-regulated in melanoma and facilitated the malignant development of cutaneous melanoma partly by the miR-152-3p/ITGA9 axis. HOXA11-AS might be a satisfactory candidate biomarker of melanoma.
LncRNA HOXA11-AS was testified to be up-regulated and promote the progression of multiple malignant tumors, such as non-small cell lung cancer, gastric cancer, osteosarcoma and glioblastoma.16 In recent years, Li et al clarified that interfering with the expression of HOXA11-AS inhibited cell proliferation, metastasis and EMT but stimulated apoptosis in breast cancer cells.26 Qu et al found that HOXA11-AS knockdown prominently repressed cell growth and metastasis of laryngeal squamous cell carcinoma.27 The silence of HOXA11-AS was also showed to reduce proliferation and metastasis but expedite apoptosis of glioma cells.28 Lu et al unraveled that HOXA11-AS knockdown reduced proliferation and invasion abilities, but induced apoptosis of uveal melanoma (UM) cells.29 But the role of HOXA11-AS in cutaneous melanoma is almost unclear. In this report, the up-regulation of HOXA11-AS was found in cutaneous melanoma tissues and cells. Further experiments indicated that proliferation, metastasis (migration and invasion) and EMT of melanoma cells were all repressed but apoptosis was facilitated after HOXA11-AS was knocked down, suggesting that HOXA11-AS played as an oncogenic role in cutaneous melanoma.
MiRNAs are generally considered as tumor suppressors to regulate tumor progression, including miR-152-3p. For instance, Sun et al illuminated that miR-152-3p overexpression inhibited invasion while motivated cell apoptosis in glioma.30 Also, miR-152-3p was down-regulated in prostate cancer and attenuated the abilities of cell proliferation and invasion.31 Consistent with these studies, we found that miR-152-3p expression was overtly declined in melanoma. The upregulation of miR-152-3p inhibited cell proliferation, metastasis and EMT but aggravated apoptosis in melanoma cells. Accumulating studies verified that lncRNAs functioned as miRNAs sponge to regulate cancer development. Cui et al discovered that HOXA11-AS promoted the glioma oncogenesis by targeting miR-140-5p as a miRNA sponge,32 and Zhan et al declared that HOXA11-AS modulated cellular processes of hepatocellular carcinoma via sponging miR-214-3p.33 HOXA11-AS was also reported to expedite the retinoblastoma progression through down-regulating miR-506-3p.34 Herein, we found a sponge effect of HOXA11-AS on miR-152-3p. In addition, HOXA11-AS regulated the cellular processes of melanoma partly by acting as a sponge of miR-152-3p. MiRNAs are proved to regulate cancer evolution by combining with the 3ʹ-UTR of target genes to degrade mRNA and reduce translation.18 TargetScan software was used for seeking the target gene of miR-152-3p and the analysis revealed that 3ʹ-UTR of ITGA9 contained the binding sites of miR-152-3p. Subsequent assays proved that ITGA9 was a downstream target of miR-152-3p. Furthermore, the tumor inhibitor role of miR-152-3p in melanoma was partially achieved by targeting ITGA9.
HOXA11-AS was reported to elevate glioma cell growth, metastasis by targeting miR-214-3p/enhancer of zeste homolog 2 (EZH2) axis.35 Yang et al asserted that HOXA11-AS increased cell viability and invasion ability in renal cancer through regulating miR-146b-5p/matrix metallopeptidase 16 (MMP16) axis.36 Wang et al claimed that HOXA11-AS promoted liver cancer progression via modulating miR-15a-3p/signal transducer and activator of transcription 3 (STAT3) axis.37 In our report, the relation between HOXA11-AS and ITGA9 was positive in melanoma tissues. Knockdown of HOXA11-AS suppressed the level of ITGA9 via elevating miR-152-3p, implying that HOXA11-AS modulated cellular processes of cutaneous melanoma by the miR-152-3p/ITGA9 axis.
To explore the impact of HOXA11-AS in vivo, we established a xenograft model of melanoma. The results indicated that down-regulation of HOXA11-AS suppressed tumor progression partially by increasing miR-152-3p and reducing ITGA9 expression in vivo. Zhang et al reported that repression of HOXA11-AS refrained the tumorigenesis of non-small cell lung cancer in vivo,38 and Li et al purported that overexpression of HOXA11-AS stimulated tumor growth of oral squamous cell carcinoma by decreasing miR-518a-3p expression and promoting PDK1 expression in vivo.39 HOXA11-AS/miR-152-3p/ITGA9 axis was also affirmed in the progression of melanoma in vivo.
In conclusion, our report elucidated that HOXA11-AS regulated proliferation, apoptosis, metastasis and EMT of cutaneous melanoma cells by targeting the miR-195-5p/ITGA9 axis in part. This is the first study to disclose the HOXA11-AS/miR-152-3p/ITGA9 signal axis in cutaneous melanoma, which might play a vital role in tumorigenesis and development of melanoma. HOXA11-AS might be a useful biomarker for the therapy of cutaneous melanoma, which needs further confirmation through clinical exploration.
Disclosure
The authors declare that they have no competing interests in this work.
References
1. Slominski A, Tobin DJ, Shibahara S, Wortsman J. Melanin pigmentation in mammalian skin and its hormonal regulation. Physiol Rev. 2004;84(4):1155–1228. doi:10.1152/physrev.00044.2003
2. Gray-Schopfer V, Wellbrock C, Marais R. Melanoma biology and new targeted therapy. Nature. 2007;445(7130):851–857. doi:10.1038/nature05661
3. Slominski AT, Zmijewski MA, Plonka PM, Szaflarski JP, Paus R. How UV light touches the brain and endocrine system through skin, and why. Endocrinology. 2018;159(5):1992–2007. doi:10.1210/en.2017-03230
4. Smith SH, Goldschmidt MH, McManus PM. A comparative review of melanocytic neoplasms. Vet Pathol. 2002;39(6):651–678. doi:10.1354/vp.39-6-651
5. O’Day S, Boasberg P. Management of metastatic melanoma 2005. Surg Oncol Clin N Am. 2006;15(2):419–437. doi:10.1016/j.soc.2005.12.002
6. Abate-Daga D, Ramello MC, Smalley I, Forsyth PA, Smalley KSM. The biology and therapeutic management of melanoma brain metastases. Biochem Pharmacol. 2018;153:35–45. doi:10.1016/j.bcp.2017.12.019
7. Little EG, Eide MJ. Update on the current state of melanoma incidence. Dermatol Clin. 2012;30(3):355–361. doi:10.1016/j.det.2012.04.001
8. Hsiao JJ, Fisher DE. The roles of microphthalmia-associated transcription factor and pigmentation in melanoma. Arch Biochem Biophys. 2014;563:28–34. doi:10.1016/j.abb.2014.07.019
9. Slominski A, Zbytek B, Slominski R. Inhibitors of melanogenesis increase toxicity of cyclophosphamide and lymphocytes against melanoma cells. Int J Cancer. 2009;124(6):1470–1477. doi:10.1002/ijc.24005
10. Slominski RM, Zmijewski MA, Slominski AT. The role of melanin pigment in melanoma. Exp Dermatol. 2015;24(4):258–259. doi:10.1111/exd.12618
11. Aftab MN, Dinger ME, Perera RJ. The role of microRNAs and long non-coding RNAs in the pathology, diagnosis, and management of melanoma. Arch Biochem Biophys. 2014;563:60–70. doi:10.1016/j.abb.2014.07.022
12. Martens-Uzunova ES, Bottcher R, Croce CM, Jenster G, Visakorpi T, Calin GA. Long noncoding RNA in prostate, bladder, and kidney cancer. Eur Urol. 2014;65(6):1140–1151. doi:10.1016/j.eururo.2013.12.003
13. Li CH, Chen Y. Insight into the role of long noncoding RNA in cancer development and progression. Int Rev Cell Mol Biol. 2016;326:33–65. doi:10.1016/bs.ircmb.2016.04.001
14. Tian Y, Zhang X, Hao Y, Fang Z, He Y. Potential roles of abnormally expressed long noncoding RNA UCA1 and Malat-1 in metastasis of melanoma. Melanoma Res. 2014;24(4):335–341. doi:10.1097/CMR.0000000000000080
15. Zhang Y, Qian W, Feng F, et al. Upregulated lncRNA CASC2 may inhibit malignant melanoma development through regulating miR-18a-5p/RUNX1. Oncol Res. 2019;27(3):371–377. doi:10.3727/096504018X15178740729367
16. Lu CW, Zhou DD, Xie T, et al. HOXA11 antisense long noncoding RNA (HOXA11-AS): a promising lncRNA in human cancers. Cancer Med. 2018;7(8):3792–3799. doi:10.1002/cam4.1571
17. Lagos-Quintana M, Rauhut R, Lendeckel W, Tuschl T. Identification of novel genes coding for small expressed RNAs. Science. 2001;294(5543):853–858. doi:10.1126/science.1064921
18. Cho WC. OncomiRs: the discovery and progress of microRNAs in cancers. Mol Cancer. 2007;6:60. doi:10.1186/1476-4598-6-60
19. Ross CL, Kaushik S, Valdes-Rodriguez R, Anvekar R. MicroRNAs in cutaneous melanoma: role as diagnostic and prognostic biomarkers. J Cell Physiol. 2018;233(7):5133–5141. doi:10.1002/jcp.26395
20. Saldanha G, Elshaw S, Sachs P, et al. microRNA-10b is a prognostic biomarker for melanoma. Mod Pathol. 2016;29(2):112–121. doi:10.1038/modpathol.2015.149
21. Xiong Y, Liu L, Qiu Y, Liu L. MicroRNA-29a inhibits growth, migration and invasion of melanoma A375 cells in vitro by directly targeting BMI1. Cell Physiol Biochem. 2018;50(1):385–397. doi:10.1159/000494015
22. Palmer EL, Ruegg C, Ferrando R, Pytela R, Sheppard D. Sequence and tissue distribution of the integrin alpha 9 subunit, a novel partner of beta 1 that is widely distributed in epithelia and muscle. J Cell Biol. 1993;123(5):1289–1297. doi:10.1083/jcb.123.5.1289
23. Mostovich LA, Prudnikova TY, Kondratov AG, et al. Integrin alpha9 (ITGA9) expression and epigenetic silencing in human breast tumors. Cell Adh Migr. 2011;5(5):395–401. doi:10.4161/cam.5.5.17949
24. Senchenko VN, Kisseljova NP, Ivanova TA, et al. Novel tumor suppressor candidates on chromosome 3 revealed by NotI-microarrays in cervical cancer. Epigenetics. 2013;8(4):409–420. doi:10.4161/epi.24233
25. Dmitriev AA, Kashuba VI, Haraldson K, et al. Genetic and epigenetic analysis of non-small cell lung cancer with NotI-microarrays. Epigenetics. 2012;7(5):502–513. doi:10.4161/epi.19801
26. Li W, Jia G, Qu Y, Du Q, Liu B, Liu B. Long non-coding RNA (LncRNA) HOXA11-AS promotes breast cancer invasion and metastasis by regulating epithelial-mesenchymal transition. Med Sci Monit. 2017;23:3393–3403. doi:10.12659/msm.904892
27. Qu L, Jin M, Yang L, et al. Expression of long non-coding RNA HOXA11-AS is correlated with progression of laryngeal squamous cell carcinoma. Am J Transl Res. 2018;10(2):573–580.
28. Yang JX, Liu B, Yang BY, Meng Q, Meng Q. Long non-coding RNA homeobox (HOX) A11-AS promotes malignant progression of glioma by targeting miR-124-3p. Neoplasma. 2018;65(4):505–514. doi:10.4149/neo_2018_170705N462
29. Lu Q, Zhao N, Zha G, Wang H, Tong Q, Xin S. LncRNA HOXA11-AS exerts oncogenic functions by repressing p21 and miR-124 in uveal melanoma. DNA Cell Biol. 2017;36(10):837–844. doi:10.1089/dna.2017.3808
30. Sun J, Tian X, Zhang J, et al. Regulation of human glioma cell apoptosis and invasion by miR-152-3p through targeting DNMT1 and regulating NF2: miR-152-3p regulate glioma cell apoptosis and invasion. J Exp Clin Cancer Res. 2017;36(1):100. doi:10.1186/s13046-017-0567-4
31. Ramalho-Carvalho J, Goncalves CS, Graca I, et al. A multiplatform approach identifies miR-152-3p as a common epigenetically regulated onco-suppressor in prostate cancer targeting TMEM97. Clin Epigenetics. 2018;10:40. doi:10.1186/s13148-018-0475-2
32. Cui Y, Yi L, Zhao JZ, Jiang YG. Long noncoding RNA HOXA11-AS functions as miRNA sponge to promote the glioma tumorigenesis through targeting miR-140-5p. DNA Cell Biol. 2017;36(10):822–828. doi:10.1089/dna.2017.3805
33. Zhan M, He K, Xiao J, et al. LncRNA HOXA11-AS promotes hepatocellular carcinoma progression by repressing miR-214-3p. J Cell Mol Med. 2018;22:3758–3767. doi:10.1111/jcmm.13633
34. Han N, Zuo L, Chen H, Zhang C, He P, Yan H. Long non-coding RNA homeobox A11 antisense RNA (HOXA11-AS) promotes retinoblastoma progression via sponging miR-506-3p. Onco Targets Ther. 2019;12:3509–3517. doi:10.2147/OTT.S195404
35. Xu C, He T, Li Z, Liu H, Ding B. Regulation of HOXA11-AS/miR-214-3p/EZH2 axis on the growth, migration and invasion of glioma cells. Biomed Pharmacother. 2017;95:1504–1513. doi:10.1016/j.biopha.2017.08.097
36. Yang FQ, Zhang JQ, Jin JJ, et al. HOXA11-AS promotes the growth and invasion of renal cancer by sponging miR-146b-5p to upregulate MMP16 expression. J Cell Physiol. 2018;233(12):9611–9619. doi:10.1002/jcp.26864
37. Wang S, Zhang S, He Y, Huang X, Hui Y, Tang Y. HOXA11-AS regulates JAK-STAT pathway by miR-15a-3p/STAT3 axis to promote the growth and metastasis in liver cancer. J Cell Biochem. 2019;120(9):15941–15951. doi:10.1002/jcb.28871
38. Zhang Y, Chen WJ, Gan TQ, et al. Clinical significance and effect of lncRNA HOXA11-AS in NSCLC: a study based on bioinformatics, in vitro and in vivo verification. Sci Rep. 2017;7(1):5567. doi:10.1038/s41598-017-05856-2
39. Li B, Wang W, Miao S, et al. HOXA11-AS promotes the progression of oral squamous cell carcinoma by targeting the miR-518a-3p/PDK1 axis. Cancer Cell Int. 2019;19:140. doi:10.1186/s12935-019-0838-6
 © 2021 The Author(s). This work is published and licensed by Dove Medical Press Limited. The full terms of this license are available at https://www.dovepress.com/terms.php and incorporate the Creative Commons Attribution - Non Commercial (unported, v3.0) License.
By accessing the work you hereby accept the Terms. Non-commercial uses of the work are permitted without any further permission from Dove Medical Press Limited, provided the work is properly attributed. For permission for commercial use of this work, please see paragraphs 4.2 and 5 of our Terms.
© 2021 The Author(s). This work is published and licensed by Dove Medical Press Limited. The full terms of this license are available at https://www.dovepress.com/terms.php and incorporate the Creative Commons Attribution - Non Commercial (unported, v3.0) License.
By accessing the work you hereby accept the Terms. Non-commercial uses of the work are permitted without any further permission from Dove Medical Press Limited, provided the work is properly attributed. For permission for commercial use of this work, please see paragraphs 4.2 and 5 of our Terms.