")
Back to Journals » International Journal of General Medicine » Volume 13
Long Non-Coding RNA HCG11 Aggravates Osteosarcoma Carcinogenesis via Regulating the microRNA-579/MMP13 Axis
Authors Wang L, Zhou J, Zhang Y, Hu T, Sun Y
Received 29 July 2020
Accepted for publication 25 November 2020
Published 31 December 2020 Volume 2020:13 Pages 1685—1695
DOI https://doi.org/10.2147/IJGM.S274641
Checked for plagiarism Yes
Review by Single anonymous peer review
Peer reviewer comments 3
Editor who approved publication: Dr Scott Fraser
Lili Wang,1 Jingzhen Zhou,2 Yong Zhang,3 Tao Hu,4 Yongning Sun1
1Clinical Laboratory Department, Ningbo Sixth Hospital, Ningbo 315000, Zhejiang, People’s Republic of China; 2Clinical Laboratory Department, Ningbo Second Hospital, Ningbo 315000, Zhejiang, People’s Republic of China; 3Department of Bone Oncology, Ningbo Sixth Hospital, Ningbo 315000, Zhejiang, People’s Republic of China; 4Department of Orthopaedics, The First People’s Hospital of Yongkang, Yongkang 321300, Zhejiang, People’s Republic of China
Correspondence: Yongning Sun
Department of Clinical Lab, Ningbo Sixth Hospital, No. 1059, Zhongshan East Road, Ningbo 315000, Zhejiang, People’s Republic of China
Tel/Fax +86-574-87801999
Email [email protected]
Background: Previous studies have suggested that long non-coding RNAs (lncRNAs) were involved in tumorigenesis of various human carcinomas, including osteosarcoma (OS). However, the expression and specific role of lncRNA HLA complex group 11 (HCG11) in OS remain unknown. The current study aimed at revealing the role of lncRNA HCG11 and its related mechanism in OS.
Methods: lncRNA HCG11 expression was verified with RT-qPCR followed by sub-localization determination. LncRNA-microRNA (miRNA) and miRNA–mRNA interactions were predicted by online bioinformatics websites. Validation was performed using dual-luciferase reporter gene assays, and gain- and loss-of-function experiments. The effects of lncRNA HCG11, miR-579 and matrix metalloproteinase 13 (MMP13) on the proliferation, migration and invasion, epithelial-mesenchymal transition (EMT) of OS cells were detected using cell counting kit-8 (CCK-8), Transwell assays and Western blot analysis.
Results: LncRNA HCG11 overexpression was observed in OS tissues and cell lines. Downregulation of lncRNA HCG11/MMP13 or overexpression of miR-579 blocked the progression of OS cells. LncRNA HCG11, which is located in the cytoplasm, promoted MMP13 expression through sponging miR-579.
Conclusion: LncRNA HCG11 might be beneficial for OS aggravation via sponging miR-579 and facilitating MMP13 expression, which represents a candidate biomarker and target for OS therapy.
Keywords: osteosarcoma, long non-coding RNA HCG11, microRNA-579, MMP13, epithelial-mesenchymal transition
Introduction
Osteosarcoma (OS) is a kind of bone malignant neoplasm that commonly exists in adolescents and children with an obviously high mortality regarding death rates.1 The incidence rate of OS is estimated as 5 million each year.2 Due to the improvement in multidisciplinary clinical remedy in the past decades for OS, the outcomes have been ameliorated.3 However, 25–30% of OS patients showed metastasis which affects the efficacy of treatment negatively, and the five-year survival of OS is still poor.4 A relevant report found that the 5-year survival of patients without symptoms of systematic spread clinically is 60–80%, which is only 20–30% in patients with metastasis at diagnosis.2 The complicacy of the initiation and progression mechanisms of OS is deemed as a principal obstacle in improving survival rate and prognosis of OS patient.5 Therefore, it is meaningful to clarify the invisible mechanism underlying tumorigenesis and to develop novel molecular targets of OS.
Long non-coding RNAs (lncRNAs), surpassing over 200 nucleotides in length, are a prominent class of RNAs exerting a crucial regulatory potential in tumor cell behaviors.6 Increasing evidence has illustrated that aberrantly expressed lncRNAs were highly associated with the occurrence and development of many human malignancies, including OS.7–9 HLA complex group 11 (HCG11) has been previously reported as a suppressor lncRNA in prostate cancer10 and glioma.11 In addition, HCG11, located about 270 kb upstream of the HIST1H3F gene, was significantly overexpressed in the gastric cancer tissues relative to the paired noncancerous tissues.12 HCG11 was enhanced in hepatocellular carcinoma tissues and cells and accelerated the proliferation and metastasis of hepatocellular carcinoma cells via the HCG11/miR-26a-5p/ATG12 axis.13 Moreover, HCG11 sponged microRNA (miR)-1276 to upregulate CTNNB1, thereby promoting proliferation and migration in gastric cancer.14 Thus, we postulated that HCG11 regulated the progression of OS via the connection between miRNA and mRNA.
miRNAs are endogenous non-coding RNA molecules with a length of ~22 nucleotides, which act at the post-transcriptional level and regulate mRNA expression.15 They are involved in multiple complicated cellular behaviors.16 Importantly, emerging evidence has pointed out that miRNAs such as miR-18a-5p, miR-671-5p, miR-1301 and miR-212, participate in development of OS.17–20 MiR-579 was reported to be associated with malignancies, such as breast cancer, ovarian cancer and human glioblastoma.21–23 However, its function in OS deserves further studies.
LncRNAs are proved to serve as competing endogenous RNAs (ceRNAs), which sponges certain miRNAs to mediate its target gene, thus changing the post-transcriptional regulation.1 However, the concrete influence that lncRNA HCG11 and miR-579 exerts on OS, especially their interaction is still to be elucidated. More details about the relationship between HCG11, miR-579 and matrix metalloprotease 13 (MMP13) needed more explanations. This study centered on the function of HCG11 in OS cells, hoping to provide a new molecular target for oncotherapy.
Materials and Methods
Ethics Statement
This study gained permission and was approved by the Medical Ethics Committee of Ningbo Sixth Hospital. Written informed consent was signed by every participant. Experiments involving human tissues were performed in strictly line with the Declaration of Helsinki.
Clinical Tissue Specimens
A total of 20 cases of primary OS tissues and the adjacent normal bone tissues (3 to 5 cm from margin of the OS tissues) were collected from OS patients who underwent surgical resection at Ningbo Sixth Hospital between February 2017 and January 2019. All tissue specimens were immediately frozen in liquid nitrogen after resection and stored at −80°C. The patients aged from 15 to 62 years (12 males and 8 females). All patients were diagnosed by laboratory tests and imaging examinations with complete imaging data and determinable stage of OS. No patients had received chemotherapy or radiotherapy prior to surgery. Besides, patients with other tumors were excluded. According to the common stages of OS, there were 4 cases in stage IIA (G2T1M0), 7 cases in stage IIB (G2T2M0), 7 cases in stage IIIA (G2T1M1) and 2 case in stage IIIB (G2T2M1).
Cell Lines and Transfection
The osteoblastic cell line hFOB and two human OS cell lines MG63 and U2OS were obtained from the American Type Culture Collection (ATCC, Manassas, VA, USA). Cells were cultivated in RPMI-1640 medium containing 10% fetal bovine serum (FBS, Gibco, Carlsbad, CA, USA) at 37°C under an atmosphere of 5% CO2/95% air.
Subsequently, short hairpin RNAs (shRNAs) targeting lncRNA HCG11 (sh-HCG11 1, 2, 3#), miR-579 mimic/inhibitor and LV-MMP13 as well as their respective negative control (NC), sh-NC, NC mimic/inhibitor and LV-NC (GenePharma Ltd., Shanghai, China) were delivered into the MG-63 and U2OS cells. All operations of the transfection were carried out in strict accordance with the manufacturer’s protocol of Lipofectamine 2000 Kit (Thermo Fisher Scientific Inc., Waltham, MA, USA). Forty-eight hour after transfection, the cells were collected for following experiments, and the expression of corresponding genes was detected by reverse transcription quantitative polymerase chain reaction (RT-qPCR) to evaluate the transfection efficiency.
RT-qPCR
Trizol regent (Takara Bio Inc., Otsu, Shiga, Japan) was used for total RNA extraction from cultured cells and tissues. RNA was reversely transcribed to cDNA using PrimeScript RT Master Mix (Takara). Subsequently, real-time PCR was performed using SYBR Green qPCR Mix (Thermo Fisher Scientific Inc., Waltham, MA, USA) on an ABI real-time fluorescence quantitative PCR platform (Thermo Fisher). All primers were purchased from Invitrogen (Shanghai, China). The data were processed using the 2−ΔΔCt relative expression method. To reduce errors, the experiment was repeated three times and Ct was averaged. miR-579 was normalized to U6, and lncRNA HCG11 and MMP13 were normalized to glyceraldehyde-3-phosphate dehydrogenase (GAPDH). Primer sequences are listed below: miR-579 forward: 5ʹ-CGTGCCGTTCATTTGGTATAAAC-3ʹ and reverse: 5ʹ-GAGCAGGGTCCGAGGT-3ʹ; LncRNA HCG11 forward: 5ʹ-GCTCTATGCCATCCTGCTT-3ʹ and reverse: 5ʹ-TCCCATCTCCATCAACCC-3ʹ; MMP13 forward: 5ʹ-GACTTCCCAGGAATTGGTGA-3ʹ and reverse: 5ʹ-TGACGCGAACAATACGGTTA-3ʹ; GAPDH forward: 5ʹ-GAGTCCACTGGCGTCTTCAC-3ʹ and reverse: 5ʹ-ATCTTGAGGCTGTTGTCATACTTCT-3ʹ; U6 forward: 5ʹ-CTCGCTTCGGCAGCACA-3ʹ and reverse: 5ʹ-AACGCTTCACGAATTTGCGT-3ʹ.
Transwell Assay
Cell invasion was detected in a Nunc™ polycarbonate inserted cell culture device (Thermo Fisher Scientific Inc., Waltham, MA, USA) pre-positioned with 8-µm perforated plate. In brief, cell suspension was seeded in the apical chamber, and the chemokine was added into the basolateral chamber. After 24 h of routine culturing, cells were stained with crystal violet and photographed under an optical microscope. For migration detection, the procedure is the same as the invasion experiment except for no addition of Matrigel.
Subcellular Localization
Fluorescence in situ hybridization (FISH) experiment was used to further determine the sublocation of lncRNA HCG11 in MG-63 and U2OS cells, and the cells were treated with trypsin. After denaturing, the cells were hybridized with probes, and the nuclei were stained and photographed under a fluorescence microscope. Finally, the nucleus was isolated from the cytoplasm by the PARIS kit (AM1921; Thermo Fisher Scientific Inc., Waltham, MA, USA), and the expression of lncRNA HCG11 was detected in the nucleus and cytoplasm with GAPDH and U6 as controls, respectively.
Western Blot Analysis
The expression of epithelial-mesenchymal transition (EMT)-related markers in OS cells was detected by Western blot analysis. Cells were lysed in western and immunoprecipitation cell lysis buffer (p0013, Beyotime Biotechnology Co., Ltd., Shanghai, China) supplemented with 1 mM phenylmethyl sulfonylfluoride (ST506, Beyotime Biotechnology Co., Ltd., Shanghai, China). Afterward, the cells were centrifuged at 10,000–14,000 g for 3–5 min with the supernatant collected. Bicinchoninic acid kit (P0009, Beyotime Biotechnology Co., Ltd., Shanghai, China) was used to determine the protein concentration. Electrophoresis was then performed in polyacrylamide gel (5% concentrate and 12% separation gel). Tris-buffered saline Tween-20 (TBST) containing 5% bovine serum albumin (BSA) was used to seal the membrane in a decolorizing shaker at room temperature for 1 h. The membrane was incubated with 5% BSA-diluted primary antibody overnight at 4°C. The membrane was washed with TBST three times, 10 min each time. Then, the membrane was incubated with the secondary antibody solution at 4°C for 4 h. The membrane was immersed in electrochemiluminescence developer (wbkls0100, Merck Millipore, Billerica, MA, USA) for visualization. The relative optical density (OD) of all immunoblotting bands was analyzed. The antibodies (Abcam Inc., Cambridge, MA, USA) included primary antibodies against c-caspase 3 (1:500, ab32042), E-cadherin (1:30,000, ab40772), N-cadherin (1:100, ab18203), Vimentin (1:3000, ab92547), GAPDH (1:2500, ab9485) and corresponding horseradish peroxidase labeled secondary antibody (1:50,000, ab205718).
Dual-Luciferase Reporter Gene Assay
Potential binding sites for lncRNA HCG11 or MMP13 to miR-579 were downloaded from StarBase, and the binding sites were designed and mutated for the mutant sequences. HCG11 sequence containing HCG11-wild type (WT)/mutant (MT) and MMP13 3ʹuntranslated region (3ʹUTR) sequence containing MMP13-WT/MT were synthetized by GenePharma (Shanghai, China). These sequences were subcloned to pMIR-REPORTTM vectors (Thermo Fisher Scientific) to construct the luciferase reporter vectors HCG11-WT/MT and MMP13-WT/MT.24 The above luciferase reporter vectors were transfected into MG-63 and U2OS cells with miR-579 mimic/inhibitor and their respective controls using lipofectamine 2000. The activity intensity of luciferase was detected by a Dual-Luciferase Reporter Assay System (Promega Corporation, Madison, WI, USA).
Cell Counting Kit-8 (CCK-8) Assay
The cells in each well were treated with 10 μL CCK-8 solution (Beyotime Biotechnology Co., Ltd., Shanghai, China) at 37°C for 2 h, and then the OD at 490 nm was measured with BioTek instruments.
Flow Cytometry
Apoptosis detection was performed using an Annexin V-fluorescein isothiocyanate (FITC)/propidium iodide (PI) kit (Thermo Fisher Scientific Inc). The transfected cells were resuspended in binding buffer and added with the Annexin V-FITC and PI working solution. The binding buffer mixture was added after an incubation at room temperature for 10 min. Apoptosis was analyzed by flow cytometry (FACSCalibur, Becton, Dickinson and Company, Franklin Lakes, NJ, USA) using the Cell-Quest software (Becton, Dickinson and Company, Franklin Lakes, NJ, USA).
RNA Immunoprecipitation (RIP)
The Magna Nuclear RIP™ (Native) Nuclear RIP Kit (Millipore, Bedford, MA, USA) was applied for RIP based on the manufacturer’s protocol. The cells were lysed in a RIP lysis buffer for 30 min. Then, cell lysate was incubated with RIP buffer supplemented with magnetic beads conjugated with Ago2 antibody (Abcam, Cambridge, UK) or control mouse IgG antibody (Abcam). The co‐precipitated RNAs were determined by RT-qPCR.
Statistical Analysis
All data were generated from triplicate independent experiments and analyzed using SPSS 22.0 (IBM Corp. Armonk, NY, USA). Data were in normal distribution according to Kolmogorov–Smirnov method and described as mean ± standard deviation. Differences among multiple groups were analyzed using one-way analysis of variance (ANOVA) or two-way ANOVA. Tukey’s multiple comparisons test was used for the pairwise comparison after ANOVA analysis. Fisher’s exact test was used for clinical data analysis. p was obtained by two-tailed test and p < 0.05 was considered statistically significant.
Results
LncRNA HCG11 is Highly Expressed in OS Cells and Acts as an Oncogenic Factor
According to previous reports,14,25 lncRNA HCG11 promoted the progression of gastric cancer and liver cancer, but its role in OS remains largely unknown. We found that the expression of lncRNA HCG11 in OS was much higher than that in normal tissues (Figure 1A). Patients were divided into a low HCG11 expression group (n = 9) and a high HCG11 expression group (n = 11) according to the mean HCG11 expression in tumor tissues (2.95). We found that HCG11 expression correlated with the GTM stage and tumor size of patients (Table 1).
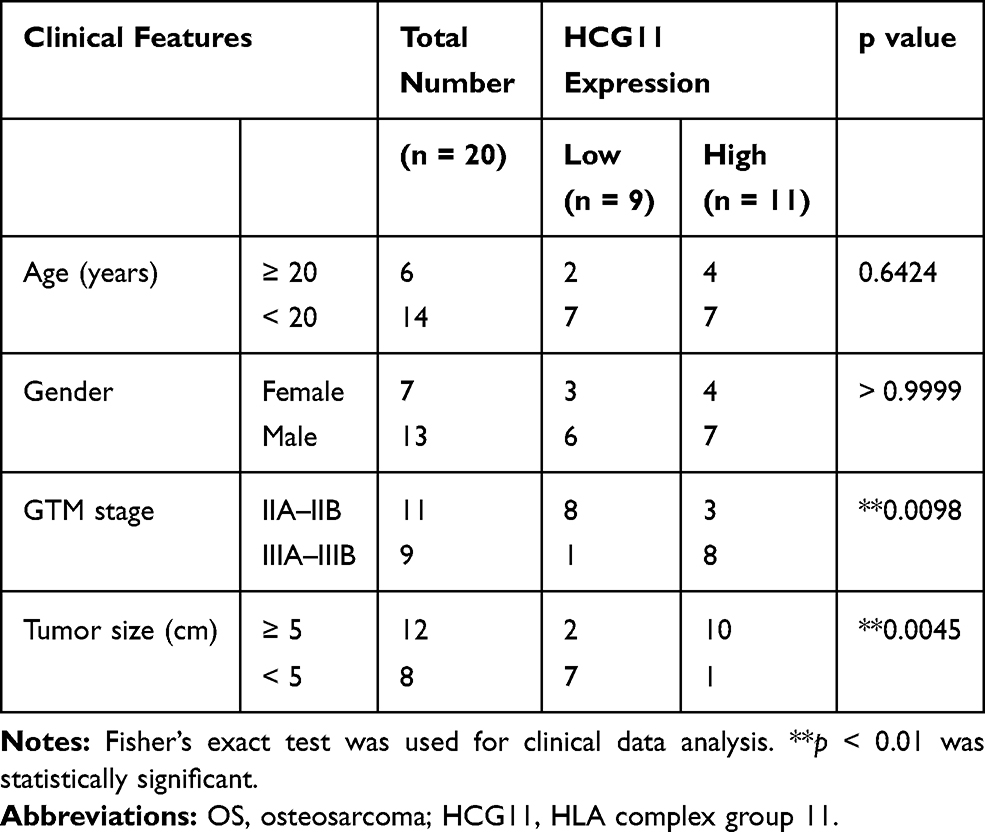 |
Table 1 Association Between Clinical Features and HCG11 Expression of OS Patients (n = 20) |
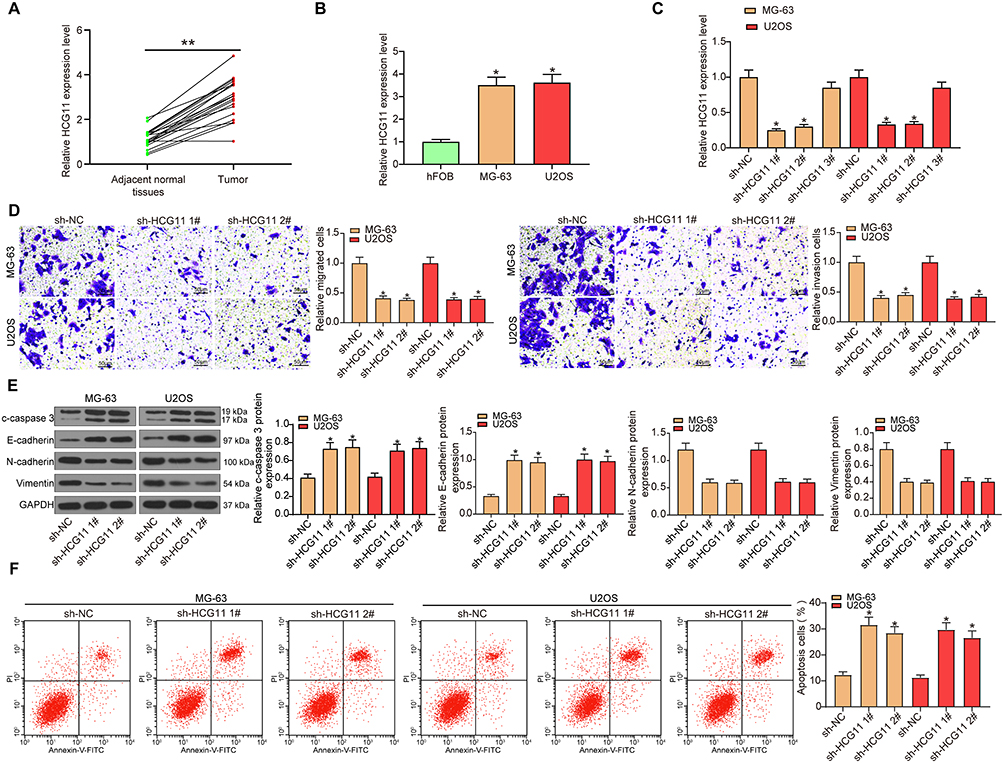 |
Figure 1 LncRNA HCG11 is highly expressed in OS with tumor-promoting effects. (A) the expression of lncRNA HCG11 in 20 OS and adjacent normal tissues (paired t-test, **p < 0.01 vs adjacent normal tissues). (B) lncRNA HCG11 expression in human osteoblastic cell line (hFOB) and OS cell lines (MG-63, U2OS) detected by RT-qPCR (the data were analyzed by one-way ANOVA, *p < 0.05 vs hFOB cells). (C) MG-63 and U2OS were transfected with sh-lncRNA HCG11 1#, sh-lncRNA HCG11 2#, and sh-lncRNA HCG11 3#, respectively. The expression of lncRNA HCG11 was measured by RT-qPCR (the data were analyzed by one-way ANOVA, *p < 0.05 vs sh-NC treatment). MG-63 and U2OS were transfected with sh-lncRNA HCG11 1#, and sh-lncRNA HCG11 2#, respectively. (D) Migrated and invaded cells were counted by Transwell assay (the data were analyzed by one-way ANOVA, *p < 0.05 vs sh-NC treatment). (E) The expression of E-cadherin, N-cadherin, Vimentin and c-caspase 3 was detected by Western blot analysis (the data were analyzed by one-way ANOVA, *p < 0.05 vs sh-NC treatment). (F) the cell apoptosis determined by flow cytometry (the data were analyzed by one-way ANOVA, *p < 0.05 vs sh-NC treatment). All data were generated from triplicate independent experiments and presented as the mean ± SD. |
Compared with osteoblastic cell line (hFOB), the expression of lncRNA HCG11 in OS cell lines (MG-63, U2OS) was significantly increased detected by RT-qPCR (Figure 1B). In order to verify the role of lncRNA HCG11 in OS, we determined its role through a loss-of-function experiment. First, sh-HCG11 1, 2, 3# were transfected into MG-63 and U2OS cells, respectively. The expression of lncRNA HCG11 was measured by RT-qPCR, and the results showed that sh-HCG11 1# and 2# were successfully knocked-down the expression of HCG11 (Figure 1C). The migration and invasion rates of MG-63 and U2OS cells transfected with sh-HCG11 1,2# were measured by Transwell assay, and the expression of EMT- and apoptosis-related proteins (E-cadherin, N-cadherin, vimentin and c-caspase 3) was detected by Western blot analysis. We found that cells transfected with sh-lncRNA HCG11 showed decreased migration and invasion, accompanied with reduced expression of N-cadherin and vimentin, and increased E-cadherin and c-caspase 3 expression (Figure 1D and E). We visually observed by flow cytometry that inhibition of HCG11 resulted in a significant increase in the level of apoptosis (Figure 1F). These results suggested that knockdown of lncRNA HCG11 significantly inhibited the malignant progression of OS cells.
LncRNA HCG11 is Sub-Localized in the Cytoplasm
To investigate the mechanism of action of HCG11 in OS, we first determined its localization in OS cells. FISH experiments and subcellular fractionation in MG-63 and U2OS cells revealed that LncRNA HCG11 was mainly located in the cytoplasm of MG-63 and U2OS cells (Figure 2A and B).
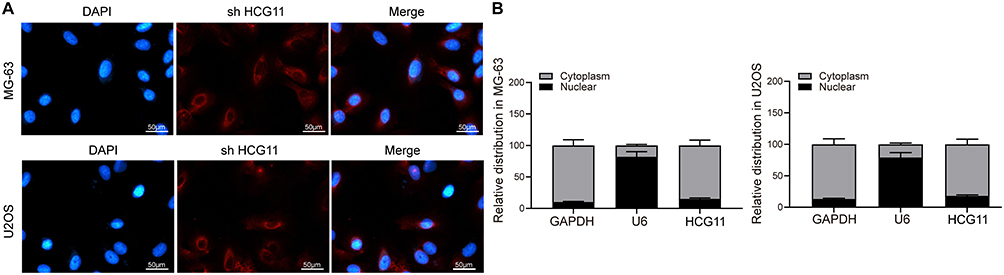 |
Figure 2 LncRNA HCG11 is located in the cytoplasm of OS cells. (A) FISH assay in MG-63 and U2OS cells. (B) cytoplasmic and nuclear isolation in MG-63 and U2OS cells (the data were analyzed by two-way ANOVA). All data were generated from triplicate independent experiments and presented as the mean ± SD. |
LncRNA HCG11 Works as a Molecular Sponge for miR-579 in OS
miR-579 has been reported to inhibit melanoma growth, but it has been poorly studied in OS.26 Through the analysis of bioinformatics website (http://starbase.sysu.edu.cn/), we found potential binding sites for the lncRNA HCG11 and miR-579, downloaded the binding sites, and designed the mutation sequences (Figure 3A).
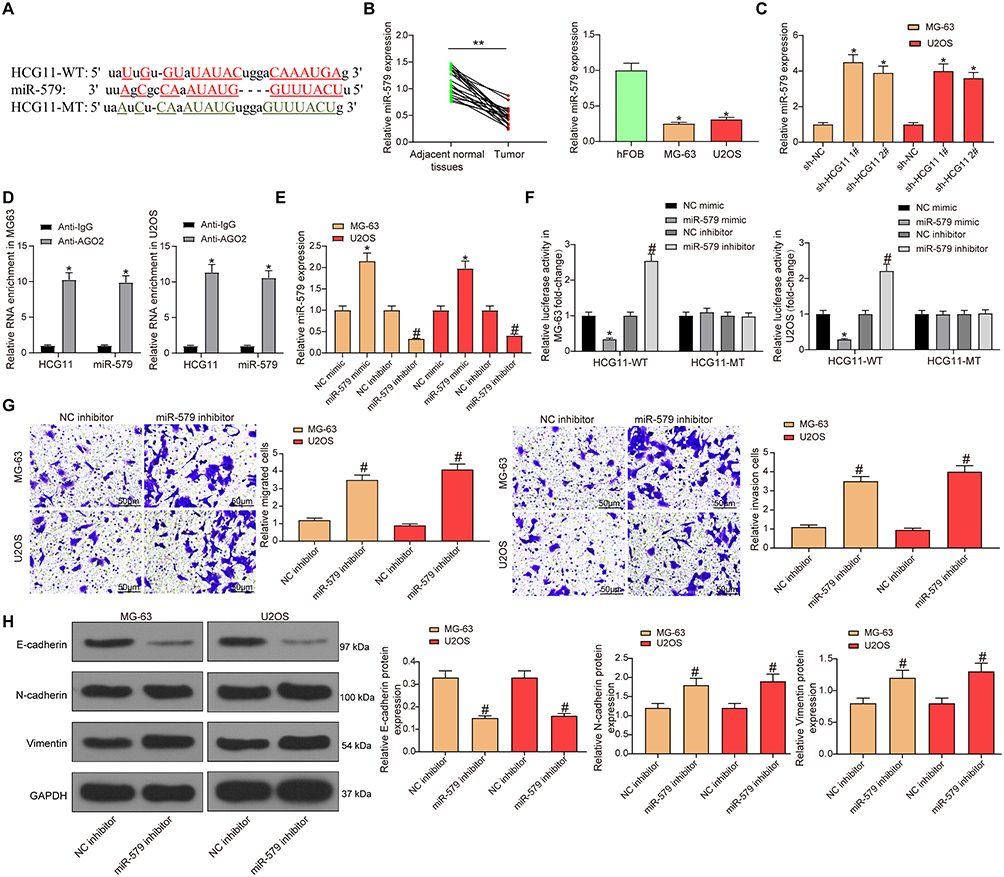 |
Figure 3 LncRNA HCG11 negatively regulates miR-579. (A) potential binding sequence of miR-579 and lncRNA HCG11. (B) miR-579 expression in OS and adjacent normal tissues (paired t-test, **p < 0.01 vs adjacent normal tissues), human osteoblastic cell line (hFOB) and OS cells (MG-63 and U2OS) (the data were analyzed by one-way ANOVA, *p < 0.05 vs hFOB cells) detected by RT-qPCR. (C) miR-579 expression in MG-63 and U2OS cells transfected with sh-HCG11 1,2# detected by RT-qPCR (the data were analyzed by one-way ANOVA, *p < 0.05 vs sh-NC treatment). (D) the binding relationship between HCG11 and miR-579 verified by RIP assays (the data were analyzed by two-way ANOVA, *p < 0.05 vs sh-NC treatment). (E) miR-579 expression in MG-63 and U2OS cells transfected with miR-579 inhibitor/mimic detected by RT-qPCR (the data were analyzed by one-way ANOVA, *p < 0.05 vs NC mimic, #p < 0.05 vs NC inhibitor). (F) luciferase activity in MG-63 and U2OS cells co-transfected with the constructed luciferase reporter plasmids (HCG11-WT or HCG11-MT) and NC or miR-579 mimic/inhibitor determined by dual-luciferase reporter assay (the data were analyzed by two-way ANOVA, *p < 0.05 vs NC mimic, #p < 0.05 vs NC inhibitor). (G) cell migration and invasion in MG-63 and U2OS cells transfected with miR-579 inhibitor detected by Transwell assay (the data were analyzed by one-way ANOVA, #p < 0.05). (H) expression of E-cadherin, N-cadherin and Vimentin in MG-63 and U2OS cells transfected with miR-579 inhibitor detected by Western blot analysis (the data were analyzed by one-way ANOVA, #p < 0.05). All data were generated from triplicate independent experiments and presented as the mean ± SD. |
RT-qPCR was used to measure the expression of miR-579 in OS tissues and cell lines. We found that miR-579 was significantly decreased in OS tissues and OS cells (MG-63 and U2OS) (Figure 3B).
We experimented to see if there was a binding relationship between miR-579 and HCG11. We found that in MG-63 and U2OS cells, the expression of miR-579 increased significantly when the expression of lncRNA HCG11 decreased (Figure 3C). We also observed significant enrichment of miR-579 and lncRNA HCG11 by anti-AGO2 compared to anti-IgG in RIP assays (Figure 3D). miR-579 inhibitor/mimic and their respective controls were delivered into MG-63 and U2OS cells, RT-qPCR confirmed that the transfection was effective (Figure 3E). At the same time, miR-579 mimic significantly repressed the luciferase activity of HCG11-WT, while miR-579 inhibitor significantly increased luciferase activity of HCG11-WT. Nevertheless, miR-579 mimic/inhibitor barely influenced the luciferase activity of HCG11-MT (Figure 3F). The experimental results showed that miR-579 combined with lncRNA HCG11. We anticipated miR-579 as a tumor suppressor, believing that its overexpression could prevent cancer progression. As a consequence, we suppressed miR-579 expression by transfection of miR-579 inhibitor into OS cells. Through Transwell assays and Western blot, we found that miR-579 inhibitor promoted cellular migration, invasion events and N-cadherin and Vimentin expression, whereas reduced E-cadherin expression (Figure 3G and H) in OS cells, confirming its role as a tumor suppressor in OS.
miR-579 Negatively Targets MMP13
Through the analysis of bioinformatics website (http://starbase.sysu.edu.cn/), it was found that there was a potential target relationship between MMP13 and miR-579. Afterwards, we downloaded the potential binding sites and designed the corresponding mutation sequences (Figure 4A).
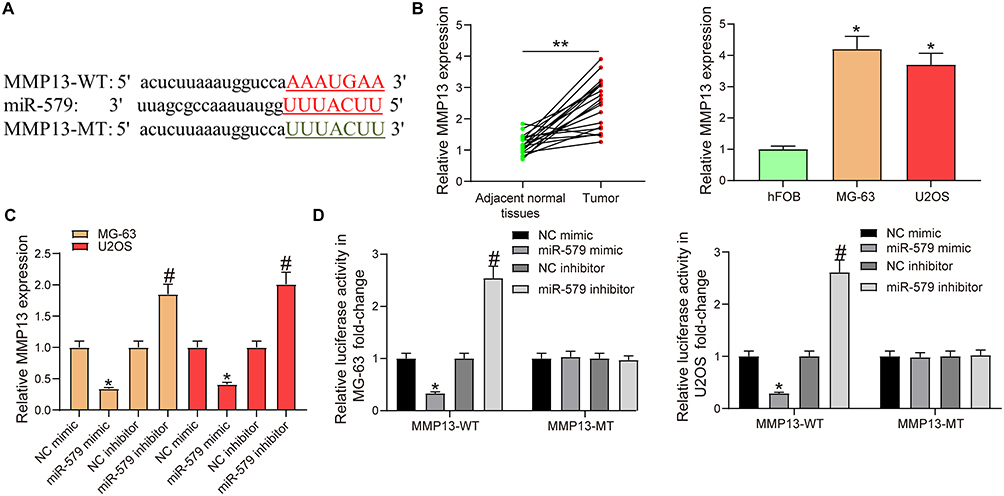 |
Figure 4 MMP13 is a target gene of miR-579. (A) potential binding sequences of miR-579 and MMP13. (B) MMP13 expression in OS and adjacent normal tissues (the data were analyzed by paired t-test, **p < 0.01 vs adjacent normal tissues), human osteoblastic cell line (hFOB) and OS cells (MG-63 and U2OS) (the data were analyzed by one-way ANOVA, *p < 0.05 vs hFOB cells) detected by RT-qPCR. (C) MMP13 mRNA expression in MG-63 and U2OS cells transfected with miR-579 mimic/inhibitor detected by RT-qPCR (the data were analyzed by one-way ANOVA, *p < 0.05 vs NC mimic, #p < 0.05 vs NC inhibitor). (D) luciferase activity in MG-63 and U2OS cells co-transfected with the constructed luciferase reporter plasmids (MMP13-WT or MMP13-MT) and NC or miR-579 mimic/inhibitor determined by dual-luciferase reporter assay (the data were analyzed by two-way ANOVA, *p < 0.05 vs NC mimic, #p < 0.05 vs NC inhibitor). The fluorescent enzyme activity was detected by dual luciferase reporter gene assay (the data were analyzed by two-way ANOVA, *p < 0.05). All data were generated from triplicate independent experiments and presented as the mean ± SD. |
RT-qPCR was used to measure the expression of MMP13 in OS tissues and cell lines. We found that MMP13 was significantly increased in OS tissues and OS cells (MG-63 and U2OS) (Figure 4B).
The expression of miR-579 and MMP13 was detected in MG-63 and U2OS cells transfected with miR-579 mimic/inhibitor by RT-qPCR. The results showed that MMP13 was downregulated in cells administrated with miR-579 mimic, while upregulated in cells treated with miR-579 inhibitor (Figure 4C). miR-579 mimic significantly inhibited the luciferase activity of MMP13-WT, whereas miR-579 inhibitor significantly increased the luciferase activity of MMP13-WT, but did not significantly affect the MMP13-MT luciferase activity (Figure 4D). The results demonstrated that miR-579 targeted MMP13.
LncRNA HCG11 Functions as a ceRNA to Upregulate MMP13 Expression via miR-579 in OS
In order to verify the mechanism of lncRNA HCG11-miR-579-MMP13 axis in OS, we transfected sh-HCG11 1# and 2# to MG63 and U2OS cells. We found that sh-HCG11 significantly decreased MMP13 expression, and sh-HCG11 1# showed a more pronounced reduction in MMP13 expression (Figure 5A). sh-HCG11 1# was chosen for the following rescue experiments. MG-63 and U2OS cells were transfected with sh-NC, sh-lncRNA HCG11 1#, sh-lncRNA HCG11 1# + LV-NC, sh-lncRNA HCG11 1# + LV-MMP13, respectively. Results of CCK-8 assays illustrated that the inhibitory effect of sh-HCG11 on OS cell proliferation was significantly reversed by LV-MMP13 (Figure 5B). Transwell assays revealed that LV-MMP13 flattened the repressive effect of sh-HCG11 on OS cell migration and invasion (Figure 5C). While Western blot results showed that the expression of E-cadherin was decreased after LV-MMP13, while the expression of N-cadherin and vimentin was increased (Figure 5D). It was observed by flow cytometry that the increased apoptosis rate of OS cells caused by sh-HCG11 was partially abrogated by LV-MMP13 (Figure 5E). To sum up, lncRNA HCG11 upregulated MMP13 expression through competitively interacting with miR-579, thus promoting malignant progression of OS.
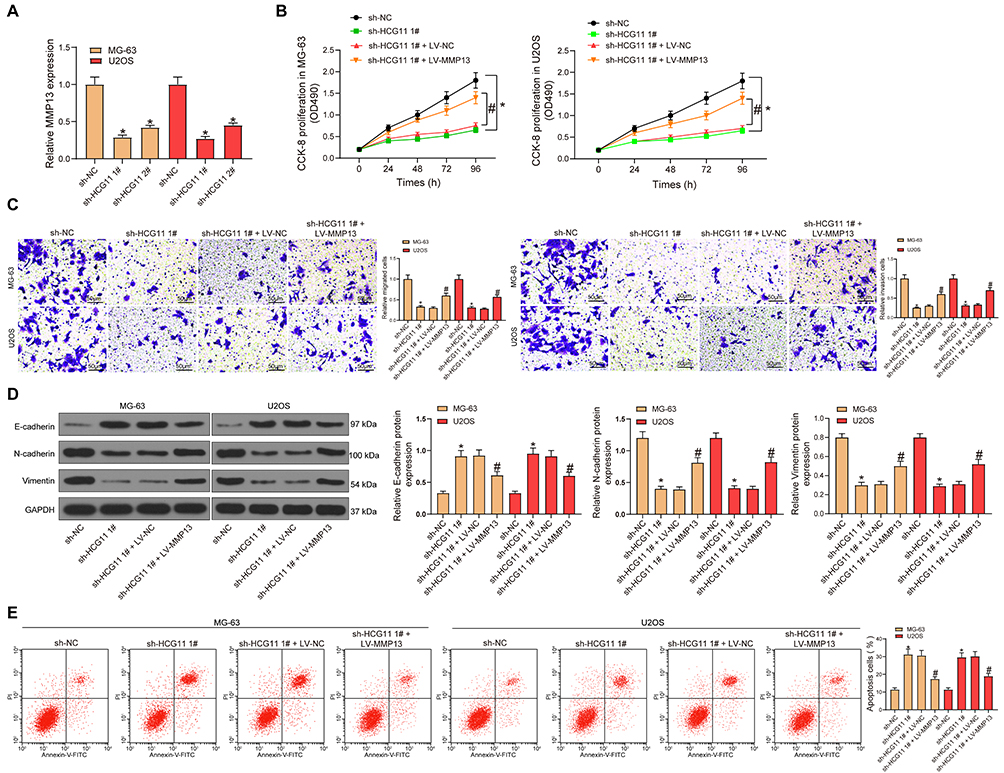 |
Figure 5 LncRNA HCG11-miR-579-MMP13 axis regulates OS progression. MG-63 and U2OS cells were transfected with sh-NC, sh-lncRNA NEAT1 1#, sh-lncRNA NEAT1 1# + LV-NC or sh-lncRNA NEAT1 1# + LV-MMP13, respectively. (A) MMP13 mRNA expression in MG-63 and U2OS cells transfected with sh-HCG11 detected by RT-qPCR (the data were analyzed by one-way ANOVA, *p < 0.05 vs sh-NC). (B) proliferating cell number (the data were analyzed by two-way ANOVA, *p < 0.05 vs sh-NC, #p < 0.05 vs sh-HCG11 + LV-NC) were determined by CCK-8 assays. (C) migrated and invaded cell number determined by Transwell assay (the data were analyzed by one-way ANOVA, *p < 0.05 vs sh-NC, #p < 0.05 vs sh-HCG11 + LV-NC). (D) the expression of E-cadherin, N-cadherin and Vimentin detected by Western blot analysis (the data were analyzed by one-way ANOVA, *p < 0.05 vs sh-NC, #p < 0.05 vs sh-HCG11 + LV-NC). (E) cell apoptosis detected by flow cytometry (the data were analyzed by one-way ANOVA, *p < 0.05 vs sh-NC, #p < 0.05 vs sh-HCG11 + LV-NC). All data were generated from triplicate independent experiments and presented as the mean ± SD. |
Discussion
OS is a common aggressive mesenchyme‑derived bone tumor, ranking among the top causes of cancer‐related death in the pediatric populations.27 Its high heterogeneity and low prevalence make it tough to gain meaningful progress in enhancing the survival of sufferers.28 Dysregulated lncRNAs have been confirmed to be relevant to the disease development.29 Recent studies suggested that lncRNAs might serve as effective therapeutic targets for OS treatment.16,30,31 In this study, we found that lncRNA HCG11 was highly expressed in OS related to the counterparts. Knockdown of lncRNA HCG11 inhibited OS cell migration, invasion and EMT. We also revealed that lncRNA HCG11 accelerated OS development through the up-regulation of MMP13 via sponging miR-579. Briefly, the findings of this study indicated that lncRNA HCG11 was a vital regulator in the OS progression by targeting the miR-579/MMP13 axis.
Our study presented overexpression of lncRNA HCG11 in OS cells when compared to the normal osteoblasts. In addition, we found that HCG11 expression was positively correlated with the GTM stage and tumor size of patients. At RNA expression level, upregulation of lncRNA HCG11 was associated with poor overall survival of breast cancer patients,32 indicating its prognostic role. Loss-of-function assays revealed that downregulation of lncRNA HCG11 expression evidently reduced proliferative, invasion and EMT capacities, suggesting that lncRNA HCG11 was a considerable regulator in the OS cell growth as an oncogene. Knockdown of HCG11 has been indicated to suppress cell viability, proliferation and colony formation ability of hepatocellular carcinoma cells,25 which was in line with one of our main findings. Meanwhile, the protein expression of N-cadherin was found to be decreased and the protein expression of E-cadherin was increased after HCG11 upregulation in prostate cancer cells.33 By contrast, we observed diminished N-cadherin and vimentin, yet restored E-cadherin expression in OS cells with HCG11 knockdown. The inconsistency may be caused by different microenvironments of the cancers. Therefore, explorations on the influence of lncRNA HCG11 on accelerating OS cell growth are of great significance for in‐depth studies of OS.
Subsequently, we confirmed that lncRNA HCG11 was dominantly distributed in the cell cytoplasm, indicating that lncRNA HCG11 might serve as a ceRNA. Recent studies have shown that lncRNAs could serve as an endogenous miRNA “sponge” by interacting with miRNAs to mediate the expression of mRNA at the post-transcriptional level, called “ceRNA”.29,34,35 Subsequently, bioinformatics predication and dual-luciferase reporter gene assay clarified the binding relation between lncRNA HCG11 and miR-579. A study indicated that interrupting miR-579 binding affinity may increase the risk of breast cancer.21 miR-579 was obviously associated with overall survival and tumor-specific survival of patients with locally advanced rectal cancer.36 Upregulation of miR‐579 could block proliferation, cell cycle, migration and also trigger the apoptosis of glioblastoma multiform cells.22 In addition, poor expression of miR-579-3p acts as a negative prognostic factor for dismal survival, and the ectopic expression of miR-579-3p disrupted the drug resistance of human melanoma cells.26 Our study demonstrated that miR-579 was downregulated in OS cells, and bound to lncRNA HCG11. We believed that both lncRNA HCG11 and miR-579 may participate in the occurrence and progression of OS.
Then, bioinformatics tools were utilized to predict the candidate targets of miR‐579, and found that MMP13 was a downstream target of miR‐579. MMP13 is a crucial MMP family member, and plays a vital role in invasion and metastasis of tumor cells through degrading the extracellular matrix.37 Previous studies showed that MMP13 could act as a tumor oncogene in OS progression.38–40 Thus, in the present study, we detected whether MMP13 could act as a target of miR‐579 in OS. Consequently, the results revealed that miR‐579 could directly target MMP13 and negatively modulate the expression of MMP13 in OS cells. In breast cancer, downregulation of MMP13 inhibited colony formation, migration and invasion of MDA-MB-231 cells.41 Similarly, we monitored that the hampered proliferation, migration and invasion of OS cells by sh-HCG11 was remarkably restored by LV-MMP13. Accordingly, our study testified that lncRNA HCG11 upregulated MMP13, the target gene of miR-579, further leading to abnormal proliferation, invasion and EMT of OS cells.
Conclusion
To sum up, lncRNA HCG11 functioned as a ceRNA to regulate MMP13 expression by sponging miR-579, thus regulating the malignant phenotype of OS in vitro (Figure 6). Further in vivo studies are of great urgency to clear the exact effect of lncRNA HCG11-miR-579-MMP13 axis on OS in animal models. Moreover, hFOB is a cell line immortalized with a temperature-sensitive SV40 large T antigen which may impact the expression of many genes. Therefore, a more appropriate control cell line should be implied in the following studies.
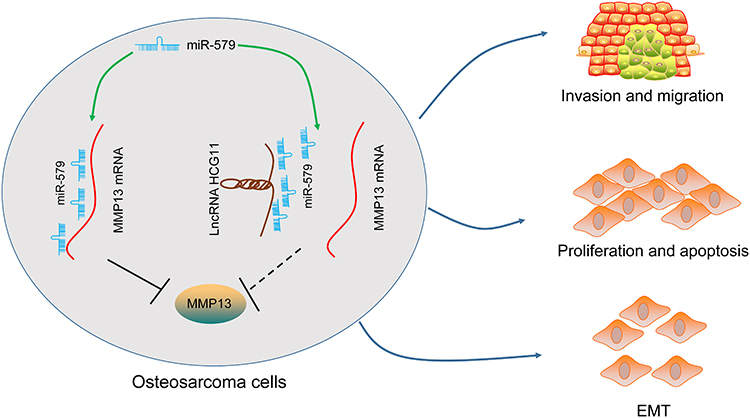 |
Figure 6 The possible mechanism of lncRNA HCG11 regulates OS progression. |
Funding
There is no funding to report.
Disclosure
The authors reported no conflicts of interest in this work.
References
1. Jin XM, Xu B, Zhang Y, et al. LncRNA SND1-IT1 accelerates the proliferation and migration of osteosarcoma via sponging miRNA-665 to upregulate POU2F1. Eur Rev Med Pharmacol Sci. 2019;23(22):9772–9780. doi:10.26355/eurrev_201911_19540
2. Guo W, Yu Q, Zhang M, et al. Long intergenic non-protein coding RNA 511 promotes the progression of osteosarcoma cells through sponging microRNA 618 to upregulate the expression of maelstrom. Aging (Albany NY). 2019;11(15):5351–5367. doi:10.18632/aging.102109
3. Lian H, Xie P, Yin N, et al. Linc00460 promotes osteosarcoma progression via miR-1224-5p/FADS1 axis. Life Sci. 2019;233:116757. doi:10.1016/j.lfs.2019.116757
4. Xu N, Xu J, Zuo Z, Liu Y, Yan F, Han C. Downregulation of lncRNA SNHG12 reversed IGF1R-induced osteosarcoma metastasis and proliferation by targeting miR-195-5p. Gene. 2020;726:144145. doi:10.1016/j.gene.2019.144145
5. Yu X, Hu L, Li S, et al. Long non-coding RNA Taurine upregulated gene 1 promotes osteosarcoma cell metastasis by mediating HIF-1alpha via miR-143-5p. Cell Death Dis. 2019;10(4):280. doi:10.1038/s41419-019-1509-1
6. Wang H, Yu Y, Fan S, Luo L. Knockdown of long non-coding RNA NEAT1 inhibits proliferation and invasion and induces apoptosis of osteosarcoma by inhibiting miR-194 expression. Yonsei Med J. 2017;58(6):1092–1100. doi:10.3349/ymj.2017.58.6.1092
7. Fei D, Zhang X, Liu J, et al. Long noncoding RNA FER1L4 suppresses tumorigenesis by regulating the expression of PTEN targeting miR-18a-5p in osteosarcoma. Cell Physiol Biochem. 2018;51(3):1364–1375. doi:10.1159/000495554
8. Zhang RM, Tang T, Yu HM, Yao XD. LncRNA DLX6-AS1/miR-129-5p/DLK1 axis aggravates stemness of osteosarcoma through Wnt signaling. Biochem Biophys Res Commun. 2018;507(1–4):260–266. doi:10.1016/j.bbrc.2018.11.019
9. Zhu C, Cheng D, Qiu X, Zhuang M, Liu Z. Long noncoding RNA SNHG16 promotes cell proliferation by sponging MicroRNA-205 and upregulating ZEB1 expression in osteosarcoma. Cell Physiol Biochem. 2018;51(1):429–440. doi:10.1159/000495239
10. Zhang Y, Zhang P, Wan X, et al. Downregulation of long non-coding RNA HCG11 predicts a poor prognosis in prostate cancer. Biomed Pharmacother. 2016;83:936–941. doi:10.1016/j.biopha.2016.08.013
11. Chen Y, Bao C, Zhang X, Lin X, Huang H, Wang Z. Long non-coding RNA HCG11 modulates glioma progression through cooperating with miR-496/CPEB3 axis. Cell Prolif. 2019;52(5):e12615. doi:10.1111/cpr.12615
12. Gu Y, Chen T, Li G, et al. LncRNAs: emerging biomarkers in gastric cancer. Future Oncol. 2015;11(17):2427–2441. doi:10.2217/fon.15.175
13. Li ML, Zhang Y, Ma LT. LncRNA HCG11 accelerates the progression of hepatocellular carcinoma via miR-26a-5p/ATG12 axis. Eur Rev Med Pharmacol Sci. 2019;23(24):10708–10720. doi:10.26355/eurrev_201912_19771
14. Zhang H, Huang H, Xu X, et al. LncRNA HCG11 promotes proliferation and migration in gastric cancer via targeting miR-1276/CTNNB1 and activating Wnt signaling pathway. Cancer Cell Int. 2019;19(1):350. doi:10.1186/s12935-019-1046-0
15. Liu J, Kong D, Sun D, Li J. Long non-coding RNA CCAT2 acts as an oncogene in osteosarcoma through regulation of miR-200b/VEGF. Artif Cells Nanomed Biotechnol. 2019;47(1):2994–3003. doi:10.1080/21691401.2019.1640229
16. Sun ZY, Jian YK, Zhu HY, Li B. lncRNAPVT1 targets miR-152 to enhance chemoresistance of osteosarcoma to gemcitabine through activating c-MET/PI3K/AKT pathway. Pathol Res Pract. 2019;215(3):555–563. doi:10.1016/j.prp.2018.12.013
17. Chen X, Zhang C, Wang X. Long noncoding RNA DLEU1 aggravates osteosarcoma carcinogenesis via regulating the miR-671-5p/DDX5 axis. Artif Cells Nanomed Biotechnol. 2019;47(1):3322–3328. doi:10.1080/21691401.2019.1648285
18. Hu XH, Dai J, Shang HL, Zhao ZX, Hao YD. SP1-mediated upregulation of lncRNA ILF3-AS1 functions a ceRNA for miR-212 to contribute to osteosarcoma progression via modulation of SOX5. Biochem Biophys Res Commun. 2019;511(3):510–517. doi:10.1016/j.bbrc.2019.02.110
19. Wang X, Hu K, Chao Y, LncRNA WL. SNHG16 promotes proliferation, migration and invasion of osteosarcoma cells by targeting miR-1301/BCL9 axis. Biomed Pharmacother. 2019;114:108798. doi:10.1016/j.biopha.2019.108798
20. Ye F, Tian L, Zhou Q, Feng D. LncRNA FER1L4 induces apoptosis and suppresses EMT and the activation of PI3K/AKT pathway in osteosarcoma cells via inhibiting miR-18a-5p to promote SOCS5. Gene. 2019;721:144093. doi:10.1016/j.gene.2019.144093
21. Jiang Y, Chen J, Wu J, et al. Evaluation of genetic variants in microRNA biosynthesis genes and risk of breast cancer in Chinese women. Int J Cancer. 2013;133(9):2216–2224. doi:10.1002/ijc.28237
22. Kalhori MR, Irani S, Soleimani M, Arefian E, Kouhkan F. The effect of miR-579 on the PI3K/AKT pathway in human glioblastoma PTEN mutant cell lines. J Cell Biochem. 2019;120(10):16760–16774. doi:10.1002/jcb.28935
23. Ying H, Lyu J, Ying T, et al. Risk miRNA screening of ovarian cancer based on miRNA functional synergistic network. J Ovarian Res. 2014;7(1):9. doi:10.1186/1757-2215-7-9
24. Jiang C, Zhu W, Xu J, et al. MicroRNA-26a negatively regulates toll-like receptor 3 expression of rat macrophages and ameliorates pristane induced arthritis in rats. Arthritis Res Ther. 2014;16(1):R9. doi:10.1186/ar4435
25. Xu Y, Zheng Y, Liu H, Li T. Modulation of IGF2BP1 by long non-coding RNA HCG11 suppresses apoptosis of hepatocellular carcinoma cells via MAPK signaling transduction. Int J Oncol. 2017;51(3):791–800. doi:10.3892/ijo.2017.4066
26. Fattore L, Mancini R, Acunzo M, et al. miR-579-3p controls melanoma progression and resistance to target therapy. Proc Natl Acad Sci U S A. 2016;113(34):E5005–5013. doi:10.1073/pnas.1607753113
27. Deng R, Zhang J, Chen J. lncRNA SNHG1 negatively regulates miRNA1013p to enhance the expression of ROCK1 and promote cell proliferation, migration and invasion in osteosarcoma. Int J Mol Med. 2019;43(3):1157–1166. doi:10.3892/ijmm.2018.4039
28. Botter SM, Neri D, Fuchs B. Recent advances in osteosarcoma. Curr Opin Pharmacol. 2014;16:15–23. doi:10.1016/j.coph.2014.02.002
29. Ji S, Wang S, Zhao X, Lv L. Long noncoding RNA NEAT1 regulates the development of osteosarcoma through sponging miR-34a-5p to mediate HOXA13 expression as a competitive endogenous RNA. Mol Genet Genomic Med. 2019;7(6):e673. doi:10.1002/mgg3.673
30. Tan H, Zhao L. lncRNA nuclear-enriched abundant transcript 1 promotes cell proliferation and invasion by targeting miR-186-5p/HIF-1alpha in osteosarcoma. J Cell Biochem. 2019;120(4):6502–6514. doi:10.1002/jcb.27941
31. Zheng S, Jiang F, Ge D, et al. LncRNA SNHG3/miRNA-151a-3p/RAB22A axis regulates invasion and migration of osteosarcoma. Biomed Pharmacother. 2019;112:108695. doi:10.1016/j.biopha.2019.108695
32. Liu H, Li J, Koirala P, et al. Long non-coding RNAs as prognostic markers in human breast cancer. Oncotarget. 2016;7(15):20584–20596. doi:10.18632/oncotarget.7828
33. Wang YC, He WY, Dong CH, Pei L, Ma YL. lncRNA HCG11 regulates cell progression by targeting miR-543 and regulating AKT/mTOR pathway in prostate cancer. Cell Biol Int. 2019;43(12):1453–1462. doi:10.1002/cbin.11194
34. Ebert MS, Sharp PA. Emerging roles for natural microRNA sponges. Curr Biol. 2010;20(19):R858–861. doi:10.1016/j.cub.2010.08.052
35. Sun M, Kraus WL. From discovery to function: the expanding roles of long noncoding RNAs in physiology and disease. Endocr Rev. 2015;36(1):25–64. doi:10.1210/er.2014-1034
36. Azizian A, Epping I, Kramer F, et al. Prognostic value of MicroRNAs in preoperative treated rectal cancer. Int J Mol Sci. 2016;17(4):568. doi:10.3390/ijms17040568
37. Zhou Y, Hu Z, Li N, Jiang R. Interleukin-32 stimulates osteosarcoma cell invasion and motility via AKT pathway-mediated MMP-13 expression. Int J Mol Med. 2015;35(6):1729–1733. doi:10.3892/ijmm.2015.2159
38. Deng B, Feng Y, Deng B. TIPE2 mediates the suppressive effects of shikonin on MMP13 in osteosarcoma cells. Cell Physiol Biochem. 2015;37(6):2434–2443. doi:10.1159/000438596
39. Hirahata M, Osaki M, Kanda Y, et al. PAI-1, a target gene of miR-143, regulates invasion and metastasis by upregulating MMP-13 expression of human osteosarcoma. Cancer Med. 2016;5(5):892–902. doi:10.1002/cam4.651
40. Li C, Zhang S, Qiu T, Wang Y, Ricketts DM, Qi C. Upregulation of long non-coding RNA NNT-AS1 promotes osteosarcoma progression by inhibiting the tumor suppressive miR-320a. Cancer Biol Ther. 2019;20(4):413–422. doi:10.1080/15384047.2018.1538612
41. Zhang R, Zhu Z, Shen W, Li X, Dhoomun DK, Tian Y. Golgi membrane protein 1 (GOLM1) promotes growth and metastasis of breast cancer cells via regulating matrix metalloproteinase-13 (MMP13). Med Sci Monit. 2019;25:847–855. doi:10.12659/MSM.911667
 © 2020 The Author(s). This work is published and licensed by Dove Medical Press Limited. The full terms of this license are available at https://www.dovepress.com/terms.php and incorporate the Creative Commons Attribution - Non Commercial (unported, v3.0) License.
By accessing the work you hereby accept the Terms. Non-commercial uses of the work are permitted without any further permission from Dove Medical Press Limited, provided the work is properly attributed. For permission for commercial use of this work, please see paragraphs 4.2 and 5 of our Terms.
© 2020 The Author(s). This work is published and licensed by Dove Medical Press Limited. The full terms of this license are available at https://www.dovepress.com/terms.php and incorporate the Creative Commons Attribution - Non Commercial (unported, v3.0) License.
By accessing the work you hereby accept the Terms. Non-commercial uses of the work are permitted without any further permission from Dove Medical Press Limited, provided the work is properly attributed. For permission for commercial use of this work, please see paragraphs 4.2 and 5 of our Terms.