")
Back to Journals » OncoTargets and Therapy » Volume 12
Long non-coding RNA FLJ33360 participates in ovarian cancer progression by sponging miR-30b-3p
Authors Yang M, Zhai Z, Guo S, Li X, Zhu Y, Wang Y
Received 16 February 2019
Accepted for publication 17 May 2019
Published 7 June 2019 Volume 2019:12 Pages 4469—4480
DOI https://doi.org/10.2147/OTT.S205622
Checked for plagiarism Yes
Review by Single anonymous peer review
Peer reviewer comments 2
Editor who approved publication: Prof. Dr. Takuya Aoki
Meiqin Yang,1 Zhensheng Zhai,2 Shuang Guo,1 Xiaoxi Li,1 Yongxia Zhu,1 Yue Wang1
1Department of Gynecology and Obstetrics, People’s Hospital of Zhengzhou University, Henan Provincial People’s Hospital, Zhengzhou 450000, Henan, People’s Republic of China; 2Department of Hepato-Biliary-Pancreatic Surgery, People’s Hospital of Zhengzhou University, Henan Provincial People’s Hospital, Zhengzho 450000, Henan, People’s Republic of China
Background: Long noncoding RNAs (lncRNAs) have been reported to play a key role in the development and progression of human malignancies. FLJ33360 is an lncRNA with unknown functions. This study was designed to determine the clinical significance and mechanism of FLJ33360 in ovarian cancer.
Materials and methods: The clinical significance of FLJ33360 in ovarian cancer was determined using the Gene Expression Profiling Interactive Analysis (GEPIA) database, Kaplan-Meier Plotter database, quantitative reverse transcription polymerase chain reaction (qRT-PCR) and statistical analysis. The regulatory relationships between FLJ33360 and miR-30b-3p were explored through bioinformatics, the Gene Expression Omnibus (GEO) database, the ArrayExpress database and meta-analysis. The possible pathways were predicted using Gene Ontology (GO) and Kyoto Encyclopedia of Genes and Genomes (KEGG) analysis. In addition, the key target genes were identified using a protein-protein interaction (PPI) network, the Cancer Genome Atlas (TCGA) database, and correlation analysis.
Results: FLJ33360 expression was significantly downregulated in ovarian cancer tissue (P=0.0011) and was closely associated with International Federation of Gynecology and Obstetrics (FIGO) stage (P=0.027) and recurrence (P=0.002). FLJ33360 may have potential value in detecting ovarian cancer (area under the curve =0.793). Function analysis demonstrated that FLJ33360 can act as a molecular sponge of miR-30b-3p to regulate the expression of target genes that are mainly involved in positive regulation of smooth muscle cell migration, the unsaturated fatty acid metabolic process, and positive regulation of the epithelial to mesenchymal transition. Among these target genes, BCL2 is the hub gene.
Conclusion: FLJ33360 is a potential biomarker for early diagnosis and prognostic assessment in ovarian cancer and may regulate the expression of genes by sponging miR-30b-3p and thus participate in the development of ovarian cancer.
Keywords: ovarian cancer, long noncoding RNAs, FLJ33360, miR-30b-3p, bioinformatics analysis, meta-analysis
Introduction
Ovarian cancer is the deadliest cancer among gynaecological malignancies.1 This disease is usually asymptomatic and difficult to detect in the early stages.2 At present, surgery and chemotherapy are the main treatments for ovarian cancer. However, relapse rates and drug resistance are high, and the prognosis is poor, especially for advanced patients. The 5-year survival rate of ovarian cancer is less than 40%.3 Sensitive early detection indicators and new therapeutic targets are urgently needed to improve the status quo.2,4
Long noncoding RNAs (lncRNAs) are stable noncoding RNAs that are greater than 200 nucleotides in length.5 Many lncRNAs are expressed at low levels and have fairly high tissue or cell-type specificity.6 MicroRNAs (miRNAs) are a type of endogenous noncoding RNA with approximately 20 nucleotides and various regulatory functions and can inhibit translation and promote degradation of target mRNAs.7 Recent research has shown that lncRNAs can regulate gene expression by titrating miRNAs in a phenomenon known as the competing endogenous RNA (ceRNA) hypothesis8 (also known as the “sponge” function)9 to participate in various biological processes. For example, Grelet et al10 found that the lncRNA PNUTS can act as a sponge for miR-205 during the epithelial-mesenchymal transition of tumour cells. Chen et al11 found that the lncRNA UICLM acts as a ceRNA for miR-215 to regulate the expression of ZEB2 and thereby control colorectal cancer liver metastasis. However, the specific mechanisms of many lncRNAs remain obscure. FLJ33360 (LINC02145/CTD-2324F15.2) is located on 7p15.2, with the NCBI Gene ID 401172. At present, no reports on related functions have been published.
In this study, we first found that FLJ33360 was significantly downregulated in ovarian cancer tissues. To further explore the clinical significance and potential molecular mechanism of FLJ33360 in ovarian cancer, we conducted in-depth studies in combination with qRT-PCR, meta-analysis and bioinformatics. The flow chart is shown in Figure 1.
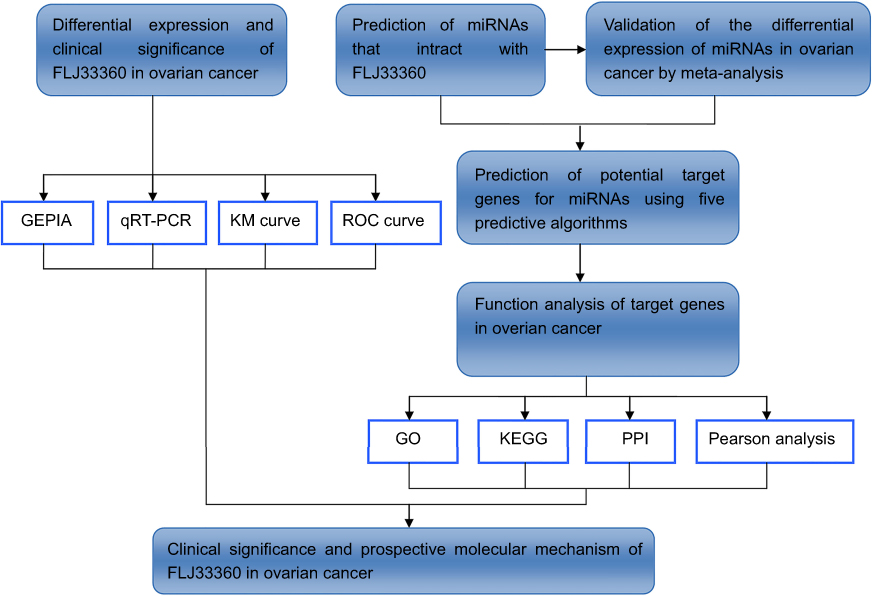 | Figure 1 A flow chart of this study. |
Materials and methods
Human samples
A total of 32 ovarian cancer specimens and 31 normal ovarian specimens were collected from the Department of Obstetrics and Gynecology in People’s Hospital of Zhengzhou University between January 2018 and October 2018. Cancer specimens were collected from ovarian cancer patients undergoing cytoreductive surgery, and healthy ovarian tissue was collected from patients undergoing adnexectomy due to myoma or uterine prolapse. The patients ranged in age from 28 to 74 years with a mean age of 55 years. Cancer tissues were collected from primary sites, and the healthy ovarian tissues were collected from the surface epithelium. Fresh tissues were frozen in liquid nitrogen within 5 mins after excision and transferred to a −80 °C freezer. No patients received any pre-operative therapy. All experimental protocols were approved by the Ethical Committee of the People’s Hospital of Zhengzhou University, and the clinicians and patients signed the consent forms for the use of their tissues in the study. Histopathology and clinical data were extracted from pathology reports and medical records.
Quantitative reverse-transcription PCR
Total RNA was extracted from the tissues using TRIzol reagent (Invitrogen, Carlsbad, CA, USA). Reverse transcription of 1 µg of total RNA into cDNA was performed using a Thermo Scientific Revert Aid First Strand cDNA Synthesis Kit (Thermo Fisher Scientific, Waltham, MA, USA). Quantitative real-time PCR amplification of cDNA was performed with PowerUpTM SYBRTM Green Master Mix (Applied Biosystems, Foster city, CA, USA). For the Applied Biosystems 7500 System, the thermal cycling conditions were 94 °C for 30 sec, followed by 40 cycles for 94 °C for 5 sec and 60 °C for 30 sec. The expression of FLJ33360 relative to β-actin expression was determined using the 2-ΔΔCT method. The primers used were FLJ33360 (forward) 5ʹ-GCTTCCGATGTGCTGTGGTA-3ʹ and FLJ33360 (reverse) 5ʹ-CTGTCTGGGAGGATGGATGTC-3ʹ, β-actin (forward)
5ʹ-CCTGTACGCCAACACAGTGC-3ʹ and β-actin (reverse)
5ʹ-ATACTCCTGCTTGCTGATCC-3ʹ.
The Cancer Genome Atlas (TCGA), Gene Expression Profiling Interactive Analysis (GEPIA), Kaplan-Meier Plotter databases and data collection
We analysed RNA-Seq data from individuals with ovarian cancer from the Illumina HiSeq RNASeq platform using the TCGA data portal (
GEPIA (
The online database Kaplan-Meier Plotter (KM plotter,
Target gene prediction
Four prediction algorithms, including DIANA IncBase v212 (
Selection of microarrays in Gene Expression Omnibus (GEO) and ArrayExpress datasets
Ovarian cancer-related microarrays were downloaded from the National Center of Biotechnology Information (NCBI) GEO (
Meta-analysis
Stata 14.0 (Stata Corp., College Station, TX, USA) was used for the meta-analysis of miRNA microarrays in this study. Heterogeneity among the included studies was assessed by the chi-squared and I-squared tests. A fixed effects model was selected when the heterogeneity was low (I2≤50% and P>0.05), and when heterogeneity was significant, a random effects model was selected (I2>50% or P≤0.05). A funnel plot was used to detect a publication bias.
Functional analysis of target genes
We performed Gene Ontology (GO) and Kyoto Encyclopedia of Genes and Genomes (KEGG) analyses using the GluGO plug-in Cytoscape 3.6.1.20,21 The STRING database22 (
Statistical analysis
Statistical analysis was performed using SPSS 22.0 (IBM, Chicago, IL, USA) and GraphPad Prism 7.0 (GraphPad Software, La Jolla, CA, USA). Student’s t-test was used to analyse differences between the two groups. The receiver operating characteristic (ROC) curve was used to predict the diagnostic potential of FLJ33360 in ovarian cancer. Pearson correlation analysis was used to study the correlation between FLJ33360 and BCL2 or DLG2. A P-value <0.05 was considered significant.
Results
Expression and clinical value of FLJ33360 in ovarian cancer
The GEPIA results showed that FLJ33360 was differentially expressed in a variety of tumours and healthy tissues, with differences in ovarian cancer being particularly pronounced (Figure 2A). A total of 88 healthy ovarian tissues and 426 ovarian cancer tissues were included in the study, and the results showed that FLJ33360 expression in ovarian cancer was significantly downregulated (P<0.05, Figure 2B). In addition, with the progression of the disease FIGO stage, FLJ33360 expression was significantly decreased (P<0.05, Figure 2C). The Kaplan-Meier curve showed that FLJ33360 was closely related to PFS in ovarian cancer patients. Patients with low FLJ33360 expression had a higher recurrence rate than those with high expression (P<0.05, Figure 2D). To further validate this differential expression, we collected 32 ovarian cancer tissues and 31 healthy ovarian tissues. The PCR results showed that FLJ33360 expression was significantly different (P=0.0011, Figure 2E). The correlations between the FLJ33360 expression level and clinical pathological features of ovarian cancer patients are shown in Table 1. The expression level of FLJ33360 has no association with age and tumour size (all P>0.05). Compared with low-grade serous carcinoma and others, FLJ33360 expression was markedly reduced in high-grade serous carcinoma (P=0.027). Compared with the I/II stage, FLJ33360 expression was significantly decreased in the III/IV stage (P=0.027). The ROC curve analysis results showed that the area under the curve (AUC) was 0.793 (95% CI: 0.663–0.923) (P<0.001, Figure 2F).
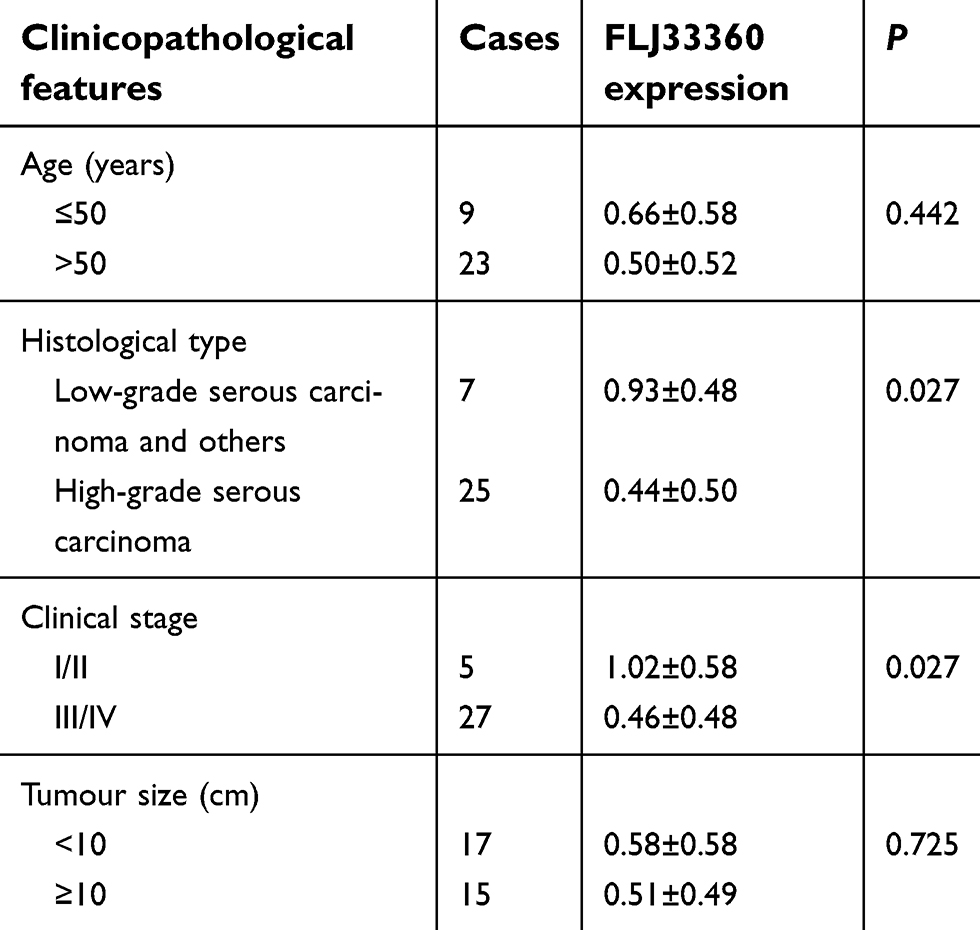 | Table 1 The correlations between FLJ33360 expression and clinicopathological parameters of ovarian cancer patients |
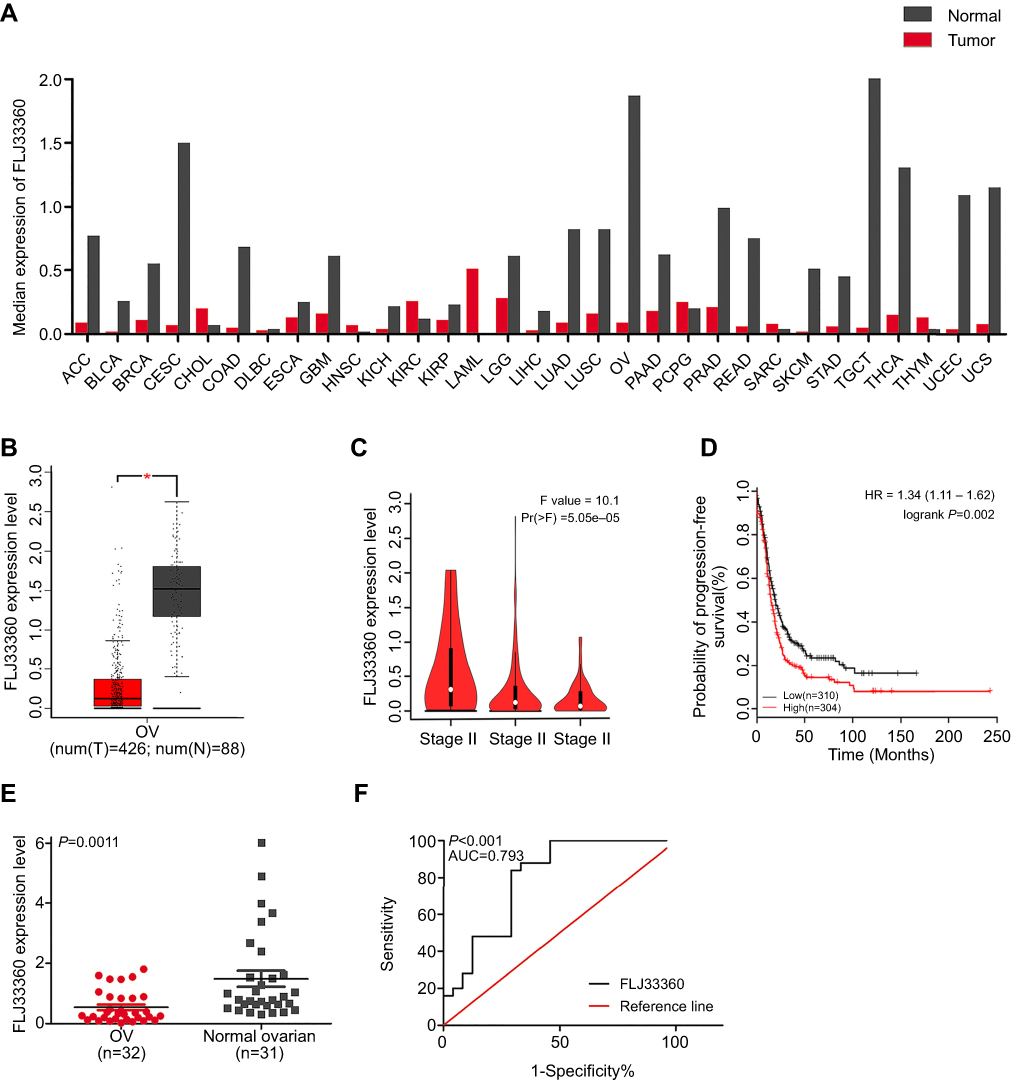 | Figure 2 The clinical significance of FLJ33360 in ovarian cancer. Notes: (A) The expression profile of FLJ33360 based on the GEPIA database. (B) Differential expression of FLJ33360 between ovarian cancer and healthy ovarian tissues based on the GEPIA database. *P<0.05. (C) Differential expression of FLJ33360 in stage II, stage III and stage IV ovarian cancer. (D) The relationship between FLJ33360 expression and PFS of ovarian cancer patients based on the KM Plotter. (E) Differential expression of FLJ33360 based on qRT-PCR. (F) ROC curve of FLJ33360 based on qRT-PCR.Abbreviations: OV, ovarian cancer; GEPIA, gene expression profiling interactive analysis; PFS, progression-free survival; KM, Kaplan-Meier; qRT-PCR, quantitative reverse transcription polymerase chain reactions; ROC, receiver operating characteristic. |
Prediction of miRNAs that interact with FLJ33360
DIANA IncBase v2, miRDB, RegRNA2.0 and IncRNAMap predicted 37, 152, 83 and 127 miRNAs that may interact with FLJ33360, respectively. A Venn diagram (Figure 3) showed that two intersections of miRNAs are jointly predicted by the four algorithms: miR-30b-3p and miR-4755-3p.
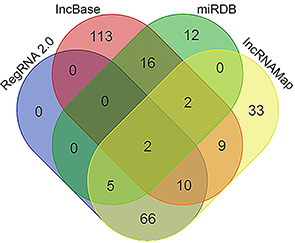 | Figure 3 A flow chart to screen the miRNAs based on Venn diagrams. |
Verification of the differential expression of the two miRNAs in ovarian cancer
To verify the differential expression of miR-30b-3p and miR-4755-3p in ovarian cancer, we performed a meta-analysis of eight eligible microarray datasets in GEO (GSE31568, GSE53829, GSE61741, GSE48485, GSE58517, GSE67329, GSE83693, and GSE76449) and 1 dataset in ArrayExpress (E-MTAB-4667). The characteristics of the selected datasets are shown in Table 2. In total, 222 ovarian cancer samples and 103 control samples were included. In the meta-analysis, the heterogeneity between the miR-30b-3p-related datasets was small (P=0.325, I2=12.8%); therefore, the fixed effects model was selected to calculate the combined standard mean difference (SMD). The pooled SMD of miR-30b-3p was 0.44 (95% CI: 0.19–0.69, P=0.001) (Figure 4A). Heterogeneity was observed between the miR-4755-3p-related datasets (P=0.081, I2=55.4%), and the random effect model was used to calculate the pooled SMD of miR-4755-3p, which was 0.69 (95% CI:-0.25–1.62, P=0.149) (Figure 4B). In addition, the funnel plot showed no significant publication biases in these datasets (Figure 4C and D). The results indicated that miR-30b-3p was significantly upregulated in ovarian cancer, while the difference in miR-4755-3p expression was not significant. We selected miR-30b-3p as an important miRNA that competitively binds to FLJ33360 in ovarian cancer.
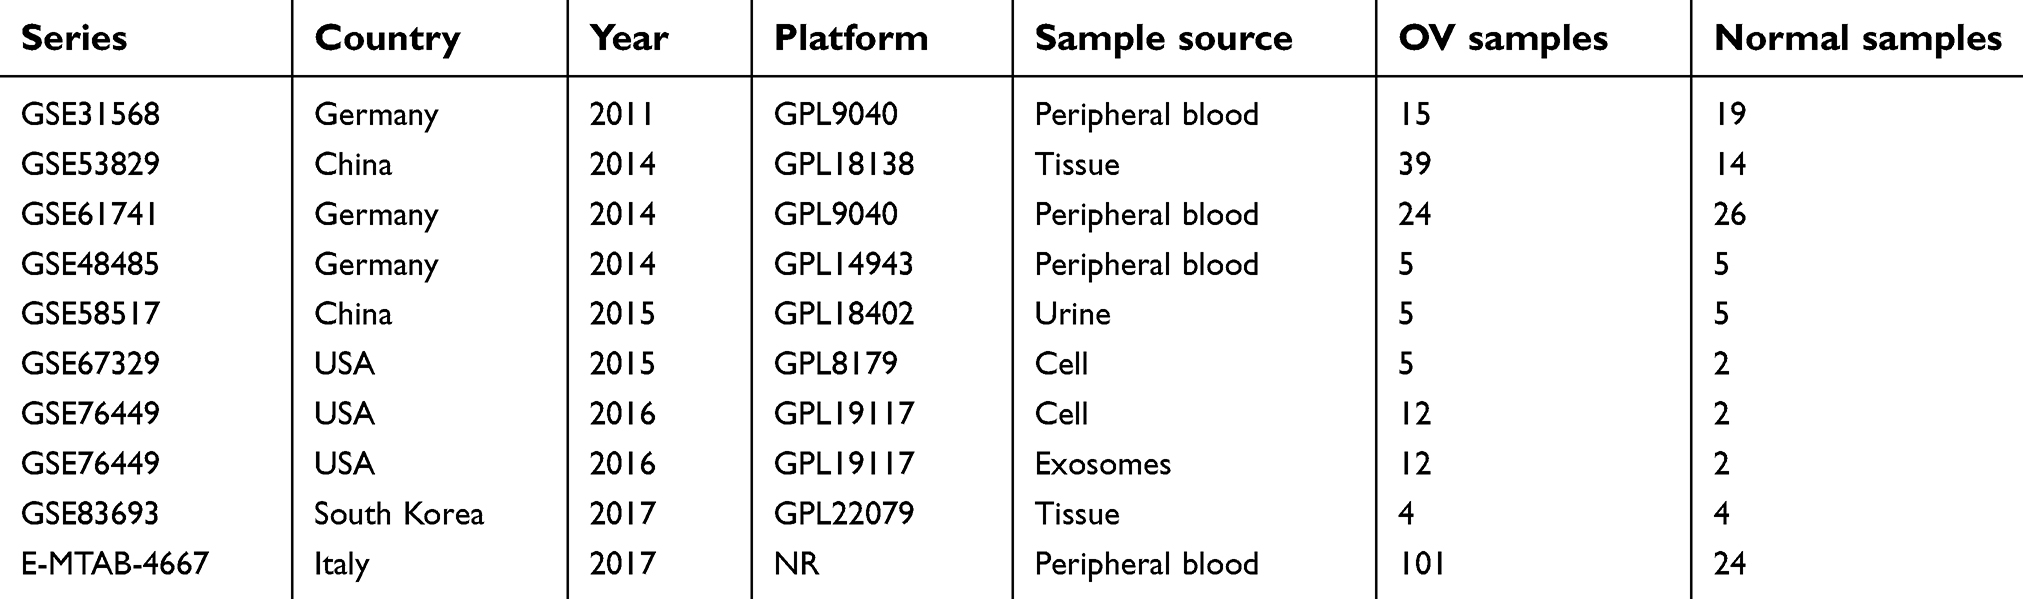 | Table 2 Characteristics of the datasets included in the meta-analysis |
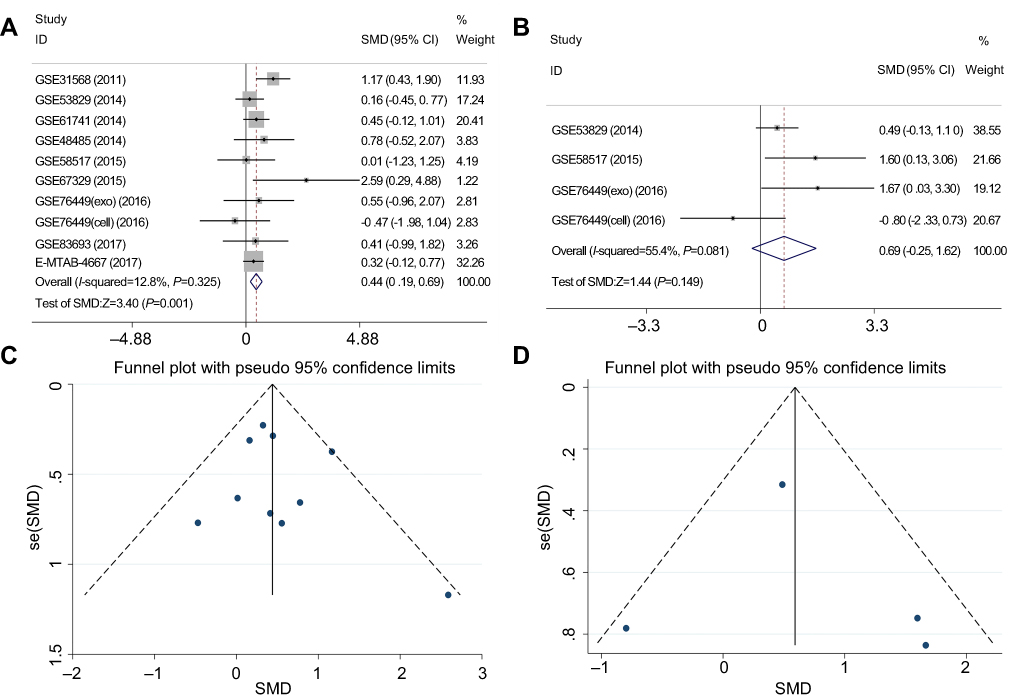 | Figure 4 Meta-analysis of the differential expression of miR-30b-3p and miR-4755-3p between the ovarian cancer group and the control group based on GEO and ArrayExpress datasets. Notes: (A) Forest plot of studies evaluating the SMD of miR-30b-3p (a fixed effects model). (B) Forest plot of studies evaluating the SMD of miR-4755-3p (a random effects model). (C) Funnel plot of miR-30b-3p-related datasets. (D) Funnel plot of miR-4755-3p-related datasets. Abbreviations: GEO, gene expression omnibus; SMD, standard mean difference. |
Acquisition of target genes in ovarian cancer
MiRDB, miRMap, miRWalk, DIANA Tarbase v8 and miRTarBase predicted 1096, 6755, 4570, 394 and 667 mRNAs targeted by miR-30b-3p, respectively. The Venn diagram (Figure 5) showed that at least two algorithms repeatedly predicted 3355 target genes. To further identify target genes that are differentially expressed in ovarian cancer, we extracted a total of 6434 mRNAs that are differentially expressed in ovarian cancer and healthy ovarian tissues from the dataset GSE14407. The expression levels of 696 mRNAs showed greater than 2-fold decreases (adj. P-value<0.05, log2FC<-2.0). The above 3355 mRNAs and 696 mRNAs were combined to obtain 104 potential genes that were targeted by miR-30b-3p in ovarian cancer.
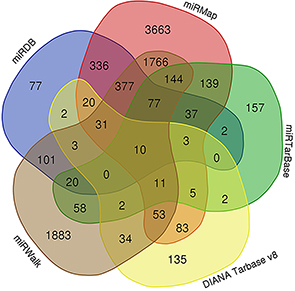 | Figure 5 A flow chart to screen the mRNAs based on Venn diagrams. |
Functional analysis of target genes in ovarian cancer
GO analysis provides a biological functional interpretation of a large number of genes derived from genomic studies. GO analysis of the 104 target genes revealed some of the biological processes involved, such as positive regulation of smooth muscle cell migration, the unsaturated fatty acid metabolic process, and positive regulation of the epithelial to mesenchymal transition (Table 3, Figure 6A). The enriched KEGG pathways included the AGE-RAGE signalling pathway in diabetic complications and colorectal cancer (Table 4, Figure 6B). The PPI network revealed interactions between target genes (Figure 7A). Among them, BCL2 and DLG2 are hub genes. Based on the GEPIA database, we examined the expression levels of these two genes. BCL2 and DLG2 expression levels were both significantly downregulated in ovarian cancer (P<0.05, Figure 7B and C). In addition, we extracted the expression levels of FLJ33360, BCL2 and DLG2 in ovarian cancer patients in the TCGA database. Pearson correlation analysis results showed a positive correlation between FLJ33360 and BCL2 (r=0.134, P=0.014, Figure 7D) but no significant correlation between FLJ33360 and DLG2 (r=−0.032, P=0.555, Figure 7E).
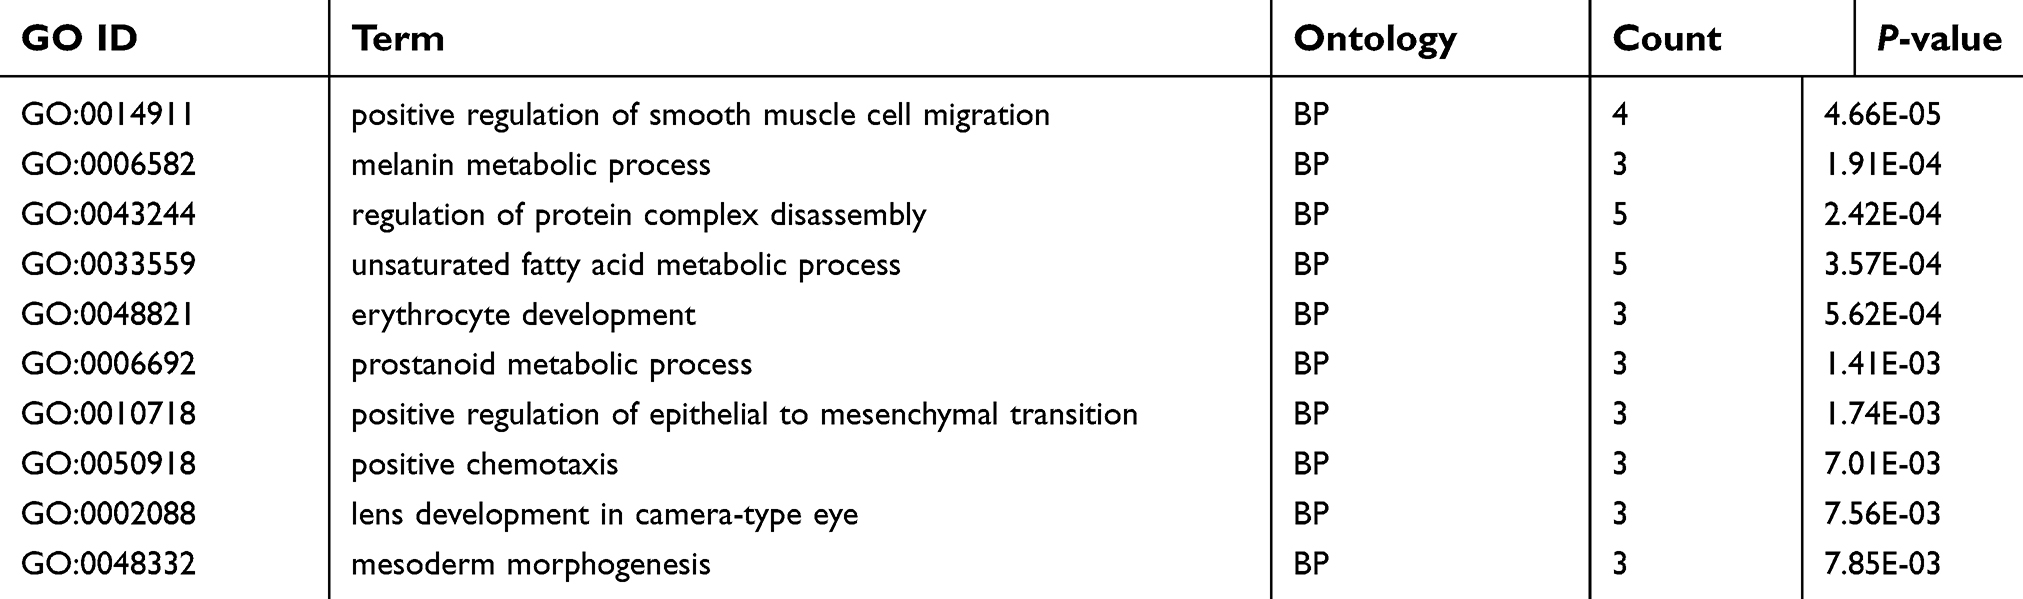 | Table 3 Enrichment GO terms of the target genes |
 | Table 4 KEGG pathway enrichment analysis of the target genes |
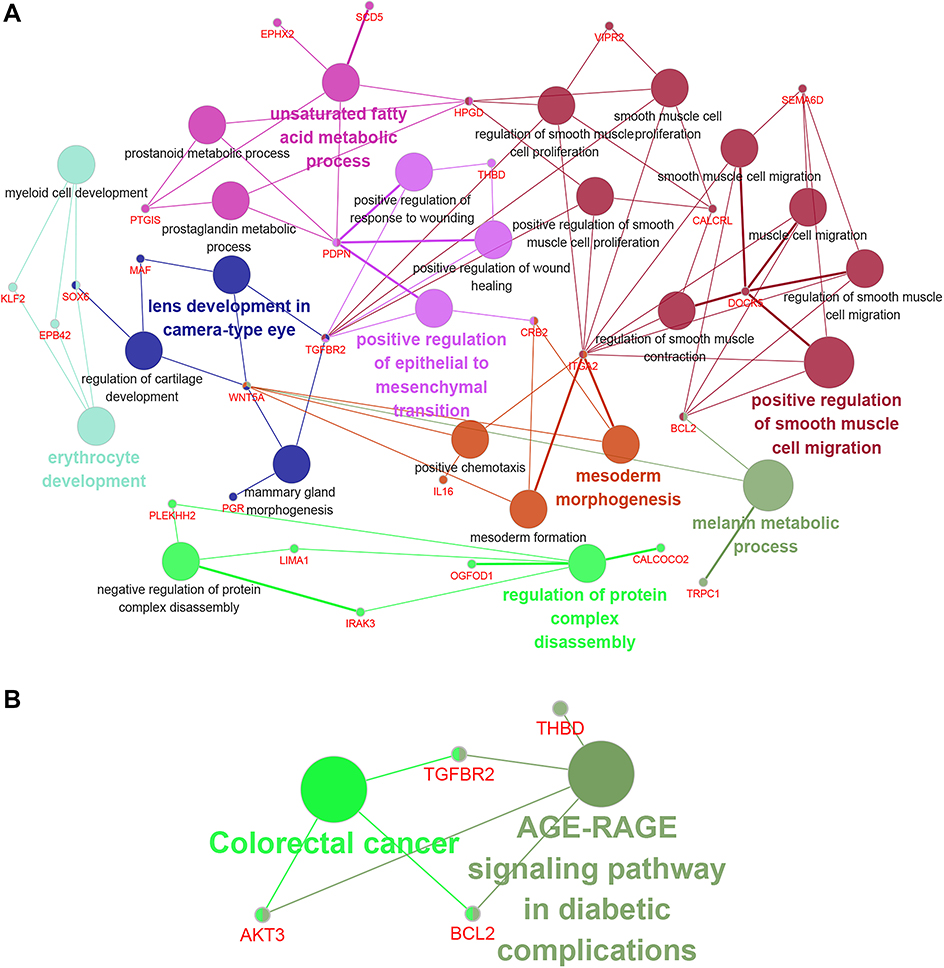 | Figure 6 GO and KEGG analysis of potential target genes using the Cytoscape plug-in GluGO. Notes: (A) A functional network of GO terms. (B) KEGG pathways displayed as an interaction network. Abbreviations: GO, gene ontology; KEGG, Kyoto encyclopedia of genes and genomes. |
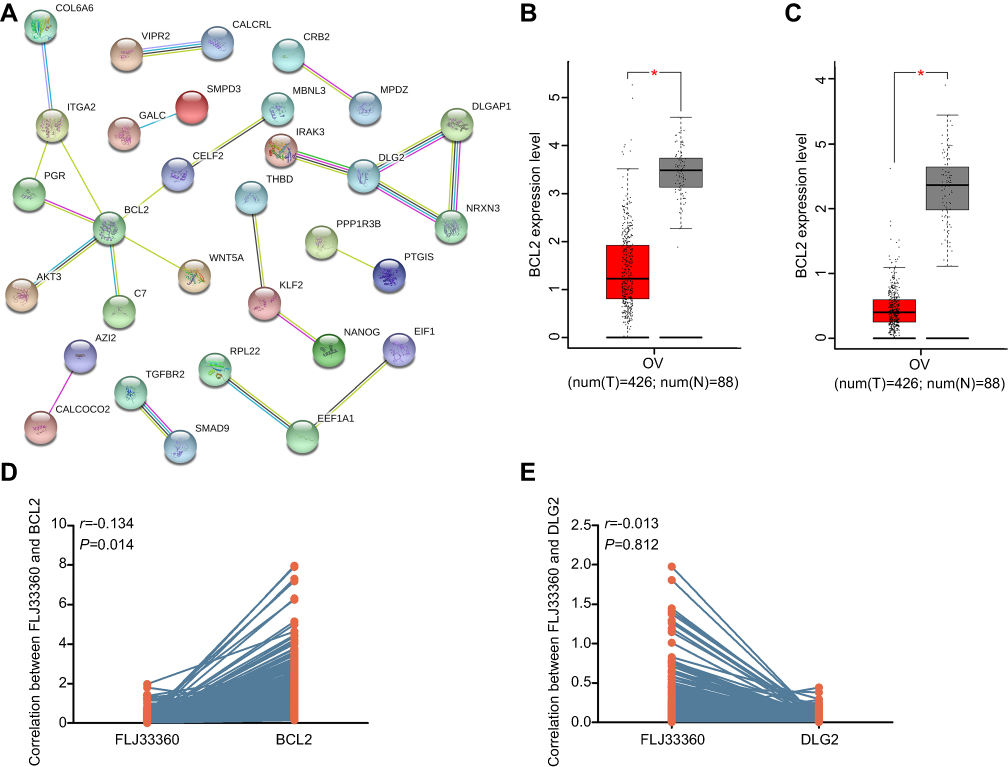 | Figure 7 BCL2 is the hub gene of potential target genes. Notes: (A) The PPI network of the target genes. Nodes represent gene-encoded proteins. Connections between nodes represent the relationship between proteins. A bold line indicates a higher confidence level. (B) Differential expression of BCL2 between ovarian cancer and healthy ovarian tissues based on the GEPIA database. *P<0.05. (C) Differential expression of DLG2. *P<0.05. (D) The correlation between FLJ33360 and BCL2 based on the TCGA database. (E) The correlation between FLJ33360 and DLG2.Abbreviations: PPI, protein-protein interaction; GEPIA, gene expression profiling interactive analysis; TCGA, the cancer genome atlas. |
Discussion
The high recurrence rate and mortality of ovarian cancer are major problems worldwide. New biomarkers and therapeutic targets are urgently needed to improve the status quo.23 The mechanism and function of lncRNA are increasingly being explored and elucidated. Many studies have shown that lncRNAs containing sequences similar to their target miRNAs can be used to isolate miRNAs from mRNAs to further regulate gene expression and participate in the development and progression of various types of tumours.24 The discovery of aberrantly expressed lncRNAs and related signalling pathways is important for improving the status of ovarian cancer.25 In this study, we first determined the change in expression of lncRNA FLJ33360. A large amount of data indicates that FLJ33360 expression is significantly downregulated in ovarian cancer, especially in high-grade serous carcinoma. As the disease stage progresses, the downregulation of FLJ33360 is significant. In addition, low FLJ33360 expression is associated with high recurrence in ovarian cancer patients and may serve as a potential biomarker for prognostic evaluation of ovarian cancer. FLJ33360 may also have potential for detecting ovarian cancer. In our follow-up study, we will investigate whether FLJ33360 is differentially expressed in blood between ovarian cancer patients and normal controls.
To explore the underlying pathways of FLJ33360 in ovarian cancer to further understand its mechanism, based on the interaction between miRNAs and lncRNAs, this study screened two miRNAs that interact with the lncRNA FLJ33360: miR-30b-3p and miR-4755-3p. Our study has shown that FLJ33360 is significantly downregulated in ovarian cancer. Based on the meta-analysis results, we excluded miR-4755-3p from the angle of ceRNA role of lncRNA. miR-30b-3p has been reported to play an important role in human cancer.26 This study found for the first time that miR-30b-3p is significantly upregulated in ovarian cancer, and that FLJ33360 downregulates the expression of target genes by competitive binding of miR-30b-3p. These target genes are enriched in many different biological processes and signalling pathways, including positive regulation of smooth muscle cell migration, the unsaturated fatty acid metabolic process, and positive regulation of the epithelial to mesenchymal transition. Notably, FLJ33360 was not identified among the validated targets of miR-30b-3p, possibly because FLJ33360 belongs to the lncRNA category and is not present in the mRNA library of the miRNA-predicted mRNA module in the prediction algorithms used in this study. BCL2 is the hub gene of these target genes. The expression of BCL2 is upregulated in most tumour tissues and promotes tumour development by inhibiting apoptosis.27 However, many studies have shown a decrease in BCL2 expression in ovarian cancer,28,29,30,31 which is consistent with the results of this study. The mechanism of action of BCL2 in ovarian cancer is complex.32 On the one hand, regulation of the BCL2 family, especially individual proteins, in ovarian cancer cell apoptosis appears to be tissue-specific.31,33 On the other hand, in addition to acting as a regulator of apoptosis in ovarian cancer, BCL2 may have other effects,29 such as inhibiting angiogenesis28,30 and preventing cells from entering the S phase, leading to specific growth inhibition.30 Other researchers have also pointed out that frequent apoptosis in ovarian cancer is a sign of high conversion of invasive malignant cells and may play a role in eliminating cells that carry DNA damage and in transforming these cells into cancer cells.32 Taken together, FLJ33360 may regulate the expression of target genes such as BCL2 to participate in different biological processes via sponging miR-30b-3p in ovarian cancer.
Conclusion
We found that FLJ33360 expression was significantly downregulated in ovarian cancer and was closely related to the clinical stage and recurrence of the disease. FLJ33360 appears to be a potential biomarker for early diagnosis and prognostic assessment in ovarian cancer. FLJ33360 may be involved in multiple biological pathways in ovarian cancer by competitively binding to miR-30b-3p, thus warranting in-depth studies with in vitro and in vivo experiments. This study provides new insights into the clinical significance and mechanism of action of FLJ33360 in ovarian cancer and may reveal new targets for future research and treatment.
Abbreviations list
OV, ovarian cancer; lncRNAs, long noncoding RNAs; qRT-PCR, quantitative reverse transcription polymerase chain reactions; GEPIA, Gene Expression Profiling Interactive Analysis; ROC, receiver operating characteristic; GEO, Gene Expression Omnibus; ceRNA, competing endogenous RNA; GO, gene ontology; KEGG, kyoto encyclopedia of genes and genomes; PPI, protein-protein interaction; TCGA, the cancer genome atlas; GTEx, genotype-tissue expression; KM, Kaplan-Meier; PFS, progression-free survival; HR, hazard ratio; CI, confidence interval; SMD, standard mean difference; BP, biological process.
Acknowledgment
This study was supported by research funding from the Science and Technology Commission of Henan Province (Grant number: 162102310174).
Disclosure
The authors report no conflicts of interest in this work.
References
1. Yokoi A, Matsuzaki J, Yamamoto Y, et al. Integrated extracellular microRNA profiling for ovarian cancer screening. Nat Commun. 2018;9(1):4319. doi:10.1038/s41467-018-06434-4
2. Pisanic TR
3. Heindl A, Khan AM, Rodrigues DN, et al. Microenvironmental niche divergence shapes BRCA1-dysregulated ovarian cancer morphological plasticity. Nat Commun. 2018;9(1):3917. doi:10.1038/s41467-018-06130-3
4. Blyuss O, Burnell M, Ryan A, et al. Comparison of longitudinal CA125 algorithms as a first-line screen for ovarian cancer in the general population. Clin Cancer Res. 2018;24(19):4726–4733. doi:10.1158/1078-0432.CCR-18-0208
5. Leisegang MS. LET’s sponge: how the lncRNA PFL promotes cardiac fibrosis. Theranostics. 2018;8(4):874–877. doi:10.7150/thno.23364
6. Krause HM. New and prospective roles for lncRNAs in organelle formation and function. Trends Genet. 2018;34(10):736–745. doi:10.1016/j.tig.2018.06.005
7. Rzepiela AJ, Ghosh S, Breda J, et al. Single-cell mRNA profiling reveals the hierarchical response of miRNA targets to miRNA induction. Mol Syst Biol. 2018;14(8):e8266. doi:10.15252/msb.20188266
8. Wen Q, Zhao L, Wang T, et al. LncRNA SNHG16 drives proliferation and invasion of papillary thyroid cancer through modulation of miR-497. Onco Targets Ther. 2019;12:699–708. doi:10.2147/OTT.S186923
9. Kim J, Abdelmohsen K, Yang X, et al. LncRNA OIP5-AS1/cyrano sponges RNA-binding protein HuR. Nucleic Acids Res. 2016;44(5):2378–2392. doi:10.1093/nar/gkw017
10. Grelet S, Link LA, Howley B, et al. A regulated PNUTS mRNA to lncRNA splice switch mediates EMT and tumour progression. Nat Cell Biol. 2017;19(9):1105–1115. doi:10.1038/ncb3450
11. Chen DL, Lu YX, Zhang JX, et al. Long non-coding RNA UICLM promotes colorectal cancer liver metastasis by acting as a ceRNA for microRNA-215 to regulate ZEB2 expression. Theranostics. 2017;7(19):4836–4849. doi:10.7150/thno.20942
12. Paraskevopoulou MD, Vlachos IS, Karagkouni D, et al. DIANA-LncBase v2: indexing microRNA targets on non-coding transcripts. Nucleic Acids Res. 2016;44(D1):D231–238. doi:10.1093/nar/gkv1270
13. Huang HY, Chien CH, Jen KH, Huang HD. RegRNA: an integrated web server for identifying regulatory RNA motifs and elements. Nucleic Acids Res. 2006;34:W429–W434. doi:10.1093/nar/gkl333
14. Wong N, Wang X. miRDB: an online resource for microRNA target prediction and functional annotations. Nucleic Acids Res. 2015;43(D1):D146–D152. doi:10.1093/nar/gku1104
15. Chan WL, Huang HD, Chang JG. lncRNAMap: a map of putative regulatory functions in the long non-coding transcriptome. Comput Biol Chem. 2014;50:41–49. doi:10.1016/j.compbiolchem.2014.01.003
16. Sticht C, De La Torre C, Parveen A, Gretz N. miRWalk: an online resource for prediction of microRNA binding sites. PLoS One. 2018;13(10):e0206239. doi:10.1371/journal.pone.0206239
17. Karagkouni D, Paraskevopoulou MD, Chatzopoulos S, et al. DIANA-TarBase v8: a decade-long collection of experimentally supported miRNA-gene interactions. Nucleic Acids Res. 2018;46(D1):D239–D245. doi:10.1093/nar/gkx1141
18. Vejnar CE, Blum M, Zdobnov EM. miRmap web: comprehensive microRNA target prediction online. Nucleic Acids Res. 2013;41:W165–168. doi:10.1093/nar/gkt430
19. Chou CH, Shrestha S, Yang CD, et al. miRTarBase update 2018: a resource for experimentally validated microRNA-target interactions. Nucleic Acids Res. 2018;46(D1):D296–D302. doi:10.1093/nar/gkx1067
20. Bindea G, Mlecnik B, Hackl H, et al. ClueGO: a Cytoscape plug-in to decipher functionally grouped gene ontology and pathway annotation networks. Bioinformatics. 2009;25(8):1091–1093. doi:10.1093/bioinformatics/btp101
21. Saito R, Smoot ME, Ono K, et al. A travel guide to Cytoscape plugins. Nat Methods. 2012;9(11):1069–1076. doi:10.1038/nmeth.2212
22. Szklarczyk D, Morris JH, Cook H, et al. The STRING database in 2017: quality-controlled protein–protein association networks, made broadly accessible. Nucleic Acids Res. 2017;45(D1):D362–D368. doi:10.1093/nar/gkw937
23. van Den Brand D, Mertens V, Massuger LFAG, Brock R,
24.
25. Teschendorff AE, Lee SH, Jones A, et al. HOTAIR and its surrogate DNA methylation signature indicate carboplatin resistance in ovarian cancer. Genome Med. 2015;7:108. doi:10.1186/s13073-015-0233-4
26. Wang Q, Hui H, Guo Z, et al. ADAR1 regulates ARHGAP26 gene expression through RNA editing by disrupting miR-30b-3p and miR-573 binding. RNA. 2013;19(11):1525–1536. doi:10.1261/rna.041533.113
27. Klein S, Abraham M, Bulvik B, et al. CXCR4 promotes neuroblastoma growth and therapeutic resistance through miR-15a/16-1-Mediated ERK and BCL2/Cyclin D1 pathways. Cancer Res. 2018;78(6):1471–1483. doi:10.1158/0008-5472.CAN-17-0454
28. Schuyer M, Van-Der-Burg M, Henzen-Logmans S, et al. Reduced expression of BAX is associated with poor prognosis in patients with epithelial ovarian cancer: a multifactorial analysis of TP53, p21, BAX and BCL-2. Br J Cancer. 2001;85(9):1359–1367. doi:10.1054/bjoc.2001.2101
29. Chan WY, Cheung KK, Schorge JO, et al. Bcl-2 and p53 protein expression, apoptosis, and p53 mutation in human epithelial ovarian cancers. Am J Pathol. 2000;156(2):409–417. doi:10.1016/S0002-9440(10)64698-6
30. Baekelandt M, Kristensen GB, Nesland JM, Tropé CG, Holm R. Clinical significance of apoptosis-related factors p53, Mdm2, and Bcl-2 in advanced ovarian cancer. J Clin Oncol. 1999;17(7):2061. doi:10.1200/JCO.1999.17.7.2061
31. Marone M, Scambia G, Mozzetti S, et al. bcl-2, bax, bcl-XL, and bcl-XS expression in normal and neoplastic ovarian tissues. Clin Cancer Res. 1998;4(2):517–524.
32. de la Torre FJ, Garcia A, Gil-Moreno A, et al. Apoptosis in epithelial ovarian tumours Prognostic significance of clinical and histopathologic factors and its association with the immunohistochemical expression of apoptotic regulatory proteins (p53, bcl-2 and bax). Eur J Obstet Gynecol Reprod Biol. 2007;130(1):121–128. doi:10.1016/j.ejogrb.2005.11.048
33. Diebold J, Baretton G, Felchner M, et al. bcl-2 expression, p53 accumulation, and apoptosis in ovarian carcinomas. Am J Clin Pathol. 1996;105(3):341–349. doi:10.1093/ajcp/105.3.341
 © 2019 The Author(s). This work is published and licensed by Dove Medical Press Limited. The full terms of this license are available at https://www.dovepress.com/terms.php and incorporate the Creative Commons Attribution - Non Commercial (unported, v3.0) License.
By accessing the work you hereby accept the Terms. Non-commercial uses of the work are permitted without any further permission from Dove Medical Press Limited, provided the work is properly attributed. For permission for commercial use of this work, please see paragraphs 4.2 and 5 of our Terms.
© 2019 The Author(s). This work is published and licensed by Dove Medical Press Limited. The full terms of this license are available at https://www.dovepress.com/terms.php and incorporate the Creative Commons Attribution - Non Commercial (unported, v3.0) License.
By accessing the work you hereby accept the Terms. Non-commercial uses of the work are permitted without any further permission from Dove Medical Press Limited, provided the work is properly attributed. For permission for commercial use of this work, please see paragraphs 4.2 and 5 of our Terms.