")
Back to Journals » International Journal of Chronic Obstructive Pulmonary Disease » Volume 14
LncRNAs NR-026690 and ENST00000447867 are upregulated in CD4+ T cells in patients with acute exacerbation of COPD
Authors Qi X, Chen H, Fu B, Huang Z, Mou Y, Liu J, Xu Y, Xiong W, Cao Y
Received 23 October 2018
Accepted for publication 29 January 2019
Published 26 March 2019 Volume 2019:14 Pages 699—711
DOI https://doi.org/10.2147/COPD.S191815
Checked for plagiarism Yes
Review by Single anonymous peer review
Peer reviewer comments 2
Editor who approved publication: Dr Chunxue Bai
Xuefei Qi, Huilong Chen, Bohua Fu, Zhenli Huang, Yong Mou, Juan Liu, Yongjian Xu, Weining Xiong, Yong Cao
Department of Respiratory and Critical Care Medicine, Key Laboratory of Pulmonary Diseases of Health Ministry, Key Cite of National Clinical Research Center for Respiratory Disease, Tongji Hospital, Tongji Medical College, Huazhong University of Sciences & Technology, Wuhan, China
Objective: The aim of the study was to determine the expression profile of long noncoding RNAs (lncRNAs) in CD4+ T cells from COPD patients and explore the clinical value of the lncRNAs.
Methods: First, microarray analysis was performed. Differentially expressed lncRNAs were validated by quantitative real-time reverse transcription-PCR (qRT-PCR) in samples from 56 patients with acute exacerbations of COPD (AECOPD), 56 patients with stable COPD, and 35 healthy controls. Meanwhile, the clinical value was tested by receiver operating characteristic curve analysis. The functions of lncRNAs were analyzed by the Gene Ontology and Kyoto Encyclopedia of Genes and Genomes database. The potential target genes that might be regulated by NR-026690 and ENST00000447867 were identified by the lncRNA-mRNA network and competing endogenous RNA network. The transcriptional expression level of rap guanine nucleotide exchange factor 3 (RAPGEF3) was tested by qRT-PCR. The correlation of the expression between NR-026690, ENST00000447867, and RAPGEF3 was analyzed by Spearman’s correlation test.
Results: We found that the relative expression levels of ENST00000447867 and NR-026690 in the CD4+ T cells of AECOPD patients were significantly higher than in the stable COPD patients and control subjects by microarray and qRT-PCR validation. The transcriptional expression level of RAPGEF3 in the CD4+ T cells was significantly higher in the AECOPD group compared to the control group (P<0.01) and the stable COPD group (P<0.05). RAPGEF3 expression was positively associated with NR-026690 (r=0.4925, P<0.01) and ENST00000447867 (r=0.4065, P<0.01).
Conclusion: NR-026690 and ENST00000447867 might be potential biomarkers for COPD. They might affect RAPGEF3 as miRNA sponges to regulate COPD development.
Keywords: long noncoding RNA, CD4+ T cell, chronic obstructive pulmonary disease, RAPGEF3
Introduction
COPD is a global health problem that is characterized by poor reversible airflow limitation. COPD can induce systemic inflammation and lead to loss of lung function.1,2 Systemic inflammation biomarkers, such as IL-6,3 tumor necrosis factor receptor 2,4 and IL-17a,5 have been shown to be elevated in patients with COPD. Identification of additional blood biomarkers would be helpful for us to manage and treat the patients with COPD.
Approximately 2% of the mammalian genome comprises protein-coding genes, and 75%–90% of the genome is transcribed as noncoding RNAs. Long noncoding RNA (lncRNA) is one type of noncoding RNA, which is always capped, polyadenylated, and spliced.6 Recent studies have reported that some lncRNAs can regulate gene transcription7 and methylation.8 Previous studies have shown that some lncRNAs may be potential biomarkers for the diagnosis and prognostication of COPD. A study from Qu et al9 found that lncRNA ENST00000502883.1 was downregulated in peripheral blood mononuclear cells of patients with COPD, and it might affect CXCL16 expression and consequently peripheral blood mononuclear cell (PBMC) recruitment. However, most lncRNAs express in specific cell types and have less conservation compared with protein-coding RNAs (http://www.noncode.org, http://www.lncrnadb.org). It is still necessary to clarify the effects of lncRNA on special cells (such as CD4+ or CD8+ T cells) from COPD patients.
CD4+ T cells, such as CD4+ central memory T cells,10 CD4+ Th17 cells,11 and CD4(+)CD25(high)CD127(−) regulatory T cells,12 play pivotal roles in COPD. Moreover, Roberts et al13 suggested that COPD phenotypes might be further differentiated based on blood CD4+ T-cell profiles and resultant immune responses. Thus, in this study, we focused on lncRNAs in CD4+ T cells from the PBMC of COPD patients and analyzed their potential roles by biological software analysis.
Methods
Study population
A total of 56 patients with acute exacerbations of COPD (AECOPD), 56 patients with stable COPD, and 35 controls were included in our study. The clinical characteristics of them are described in Table 1. AECOPD and stable COPD patients were diagnosed according to the criteria established by the NHLBI/WHO Global Initiative for COPD.14 Patients were defined as AECOPD on the condition that they required hospital admission to Tongji Hospital (Wuhan, Hubei). Stable COPD patients were recruited from outpatient clinics. Stable COPD was defined as the absence of exacerbations of COPD necessitating hospital admission, oral corticosteroids, or antibiotics during the previous 3 months. Control subjects who matched to the total COPD patients were recruited from the general health check-up center in Tongji Hospital. All of the subjects were recruited between January 2016 and March 2017. Subjects were excluded if they suffered from asthma, other obstructive lung diseases, or tumors. Approximately 10 mL of blood samples was collected from all participants.
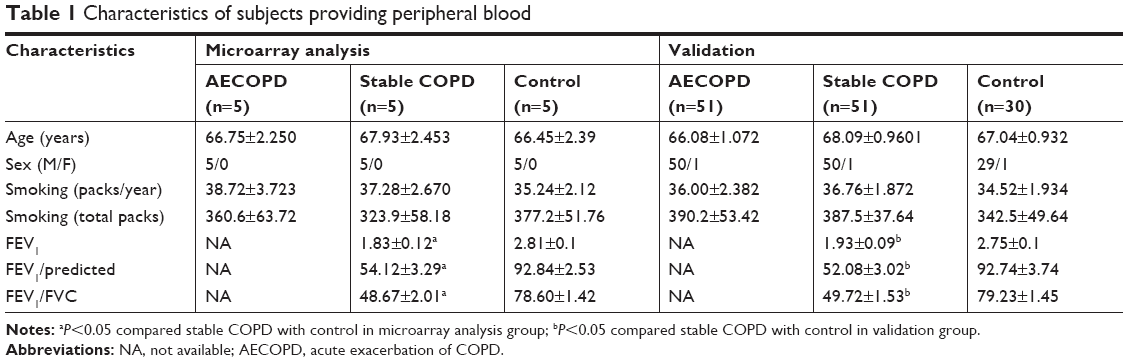 | Table 1 Characteristics of subjects providing peripheral blood |
This study was conducted in compliance with the institutional policy regarding the protection of patients’ private information and approved by the Ethical Committee of Tongji Hospital, Huazhong University of Science and Technology (IRB ID:20140415). The study was conducted in accordance with the Declaration of Helsinki. Written informed consent was obtained from all participants. Sample collection and all of the experimental methods in our study were carried out in accordance with the approved guidelines.
CD4+ T-cell isolation and total RNA extraction
CD4+ T cells from each participant were isolated using density centrifugation and magnetic beads isolation. Briefly, the diluted blood was carefully layered onto Ficoll-Hypaque gradient (TBD, Tianjin, China). The PBMC layer was obtained after centrifugation at 800× g for 25 minutes. CD4+ T cells were isolated from PBMCs by negative selection using MagSelect Human CD4+ T Cell Isolation Kit (R&D systems, Minneapolis, MN, USA) according to the manufacturer’s instruction. PBMCs were incubated with MagSelect Streptavidin Ferrofluid after labeling with negative selection biotinylated antibodies. CD4+ T cells were enriched by depletion of unwanted cells using MagSelect magnet (R&D systems). Flow cytometric analysis showed that the purity of the isolated CD4+ T cells was more than 90%. Then the cells were frozen in TRIzol agent (Takara, Dalian, China) at a concentration of 2–5×10⁶ cells/mL and stored at −80°C. Total RNA was extracted from CD4+ T cells using TRIzol reagent according to the manufacturer’s instruction. The RNA quantity was measured with a NanoDrop ND-2000. (Thermo Fisher Scientific, Waltham, MA, USA).
Microarray analysis and quantitative real-time reverse transcription-PCR (qRT-PCR)
Arraystar human lncRNA microarray V3.0 (Array-Star, Rockville, MD, USA) contains the transcripts from authoritative public transcription database, and was designed for the global profiling of human lncRNAs and mRNAs. The microarray work was completed by KangChen Bio-tech (Shanghai, China).
QRT-PCR was performed to determine the relative expression levels of lncRNAs and genes. Primescript RT regent kit (TaKaRa, Dalian, Japan) was used for the reverse transcriptase (RT) reaction. In brief, the RT reaction was performed for 15 minutes at 37°C, followed by 5 seconds at 85°C and 1 minute at 4°C with Prime Script RT Master Mix. The qRT-PCR was performed to quantify the expression of lncRNAs using an ABI Prism 7900 Real-Time System (Applied Biosystems, Foster City, CA, USA) with SYBR Premix Ex Taq (Takara). The primers used in the qRT-PCR were designed by Ribo Bio-tech (Guangzhou, China) and are shown in Table 2. β-actin was used as an internal control. The data were analyzed using the 2−ΔΔCt (ΔΔCt = [mean Ct value of lncRNA – mean Ct value of β-actin] in the AECOPD or stable COPD subjects – mean value [mean Ct value of lncRNA – mean Ct value of β-actin] in the control subjects) method and presented as relative expression level.
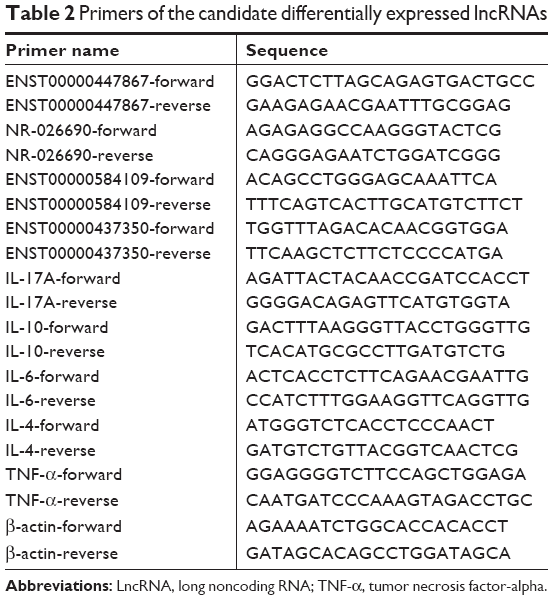 | Table 2 Primers of the candidate differentially expressed lncRNAs |
GO and KEGG pathway analyses
Gene Ontology (GO) analysis is a functional analysis associating differentially expressed mRNAs with GO categories. The GO categories are derived from GO database (www.geneontology.org), which is comprised of three domains that describe gene product attributes. Besides, based on the latest Kyoto Encyclopedia of Genes and Genomes (KEGG) database, we performed pathway analysis for differentially expressed mRNAs. KEGG analysis provided the biological pathways that showed significant enrichment of differentially expressed mRNAs. The P-value denoted the significance of the pathway. The lower the P-value, the more significant the GO term and the pathway (the P-value cut-off was 0.05).
LncRNA-mRNA co-expression network analysis
LncRNA-mRNA network was built to identify the co-expression relationship between mRNA and lncRNA according to the normalized signal intensity. We calculated the Pearson correlation coefficient and P-value for each pair of mRNA-lncRNA. Significant correlation pairs (P<0.05, Pearson correlation coefficient >0.9) were chosen to construct the network.
Competing endogenous RNA (ceRNA) network analysis
We identified mRNAs that were targeted by lncRNA-targeting microRNAs based on microRNA response elements (MREs). All potential MREs were searched based on the sequences of lncRNAs and mRNAs by miRBase V19. Then, we calculated mutually targeted MRE enrichment (MuTaME) scores for the predicted mRNAs. The higher score of an mRNA means there is a higher probability for this mRNA to be a putative ceRNA.
Statistical analysis
Data were presented as the mean ± SEM. Statistical analyses were performed using Prism 5 software (GraphPad Software Inc., San Diego, CA, USA). Normally distributed data were analyzed using one-way ANOVA with Tukey correction to compare across groups. Data that did not meet the requirements of a normal distribution were evaluated by nonparametric tests, namely the Kruskal–Wallis test with Dunn intergroup comparison. Receiver operating characteristic (ROC) curves were performed to evaluate the diagnostic value of lncRNAs that were dysregulated in the CD4+ T cells. Correlation analysis was performed using Spearman’s rank order correlation. All data were analyzed using two-tailed tests, and P<0.05 was considered to indicate a statistically significant difference.
Results
Information of the subjects
A total of 56 AECOPD patients, 56 stable COPD patients, and 35 control subjects were included in this study. There were no significant differences in age, gender, or smoking history among the three groups. In this study, COPD patients were obviously worse in terms of pulmonary function, including FEV1, FEV1/FVC, and FEV1% than the control subjects. However, the pulmonary function data of AECOPD patients were not available because of the failure to cooperate with the examination. The baseline characteristics of all study participants are presented in Table 1.
LncRNA and mRNA expression profiling
To identify the differentially expressed lncRNAs (DElncRNA) in COPD, we performed microarray analysis in the CD4+ T cells from five AECOPD patients, five stable COPD patients, and five age- and sex-matched control subjects. Heat maps and scatter plots were built to show the DElncRNAs between different groups. The scatter plots showed there were 1,517 DElncRNAs between AECOPD and control, 2,284 DElncRNAs between AECOPD and stable COPD, and 1,517 DElncRNAs between stable COPD and control groups (Figure 1). The data of the mRNA are shown in Figure S1F–H.
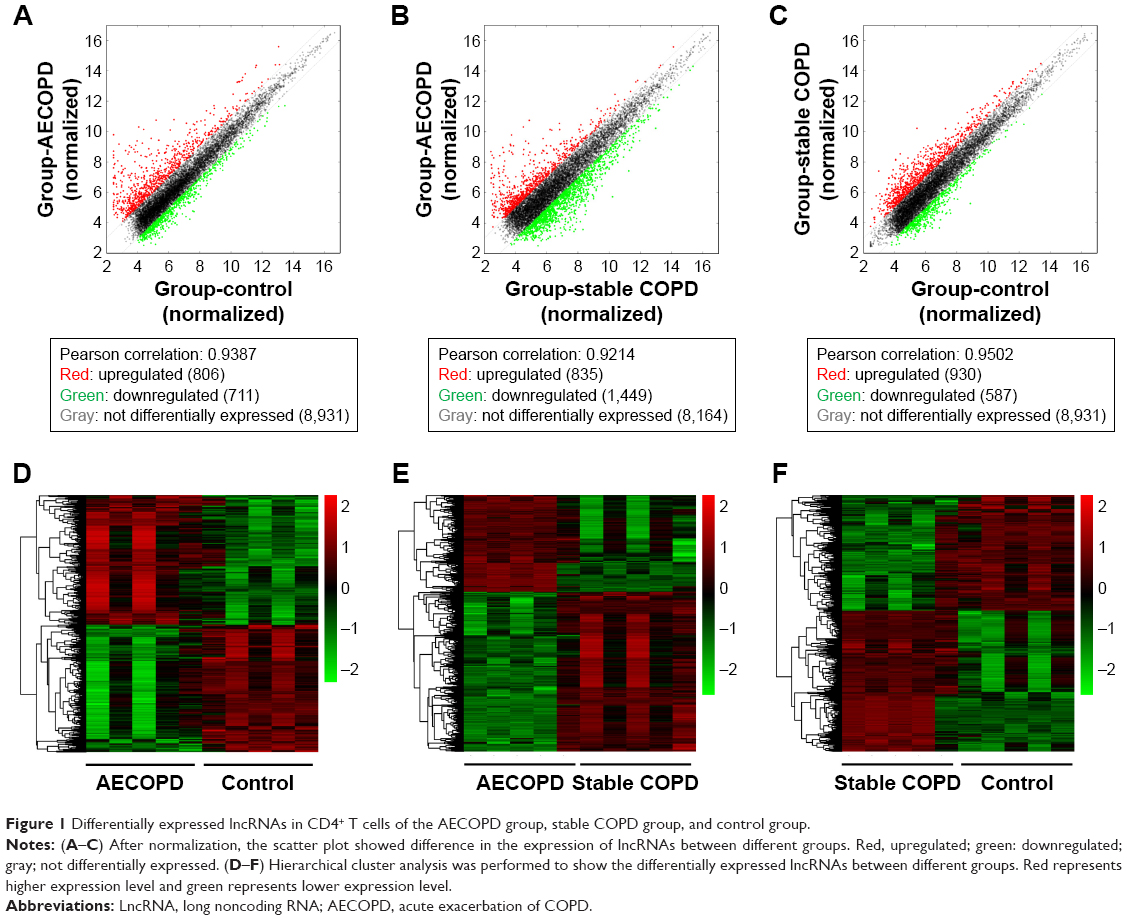 | Figure 1 Differentially expressed lncRNAs in CD4+ T cells of the AECOPD group, stable COPD group, and control group. |
Venn diagram and validation of DElncRNAs by qRT-PCR
Venn diagram indicates the number of overlapping and nonoverlapping DElncRNAs between the different groups (Figure 2A). We focused on the lncRNAs which were upregulated and differentially expressed in the AECOPD group compared with the stable COPD group and normal controls. Based on their P-value (<0.05) and fold changes (>2), four lncRNAs were selected for validation. An independent set of samples from 51 AECOPD patients, 51 stable COPD patients, and 30 control subjects was used to verify the four candidate lncRNAs by qRT-PCR. The relative expression levels of ENST00000447867 and NR-026690 in the CD4+ T cells of AECOPD patients were significantly higher than in the stable COPD patients and control subjects, which is consistent with the data from the microarray analysis (Figure 2B). However, the other candidate lncRNAs did not show remarkable differences between the different groups (data not shown).
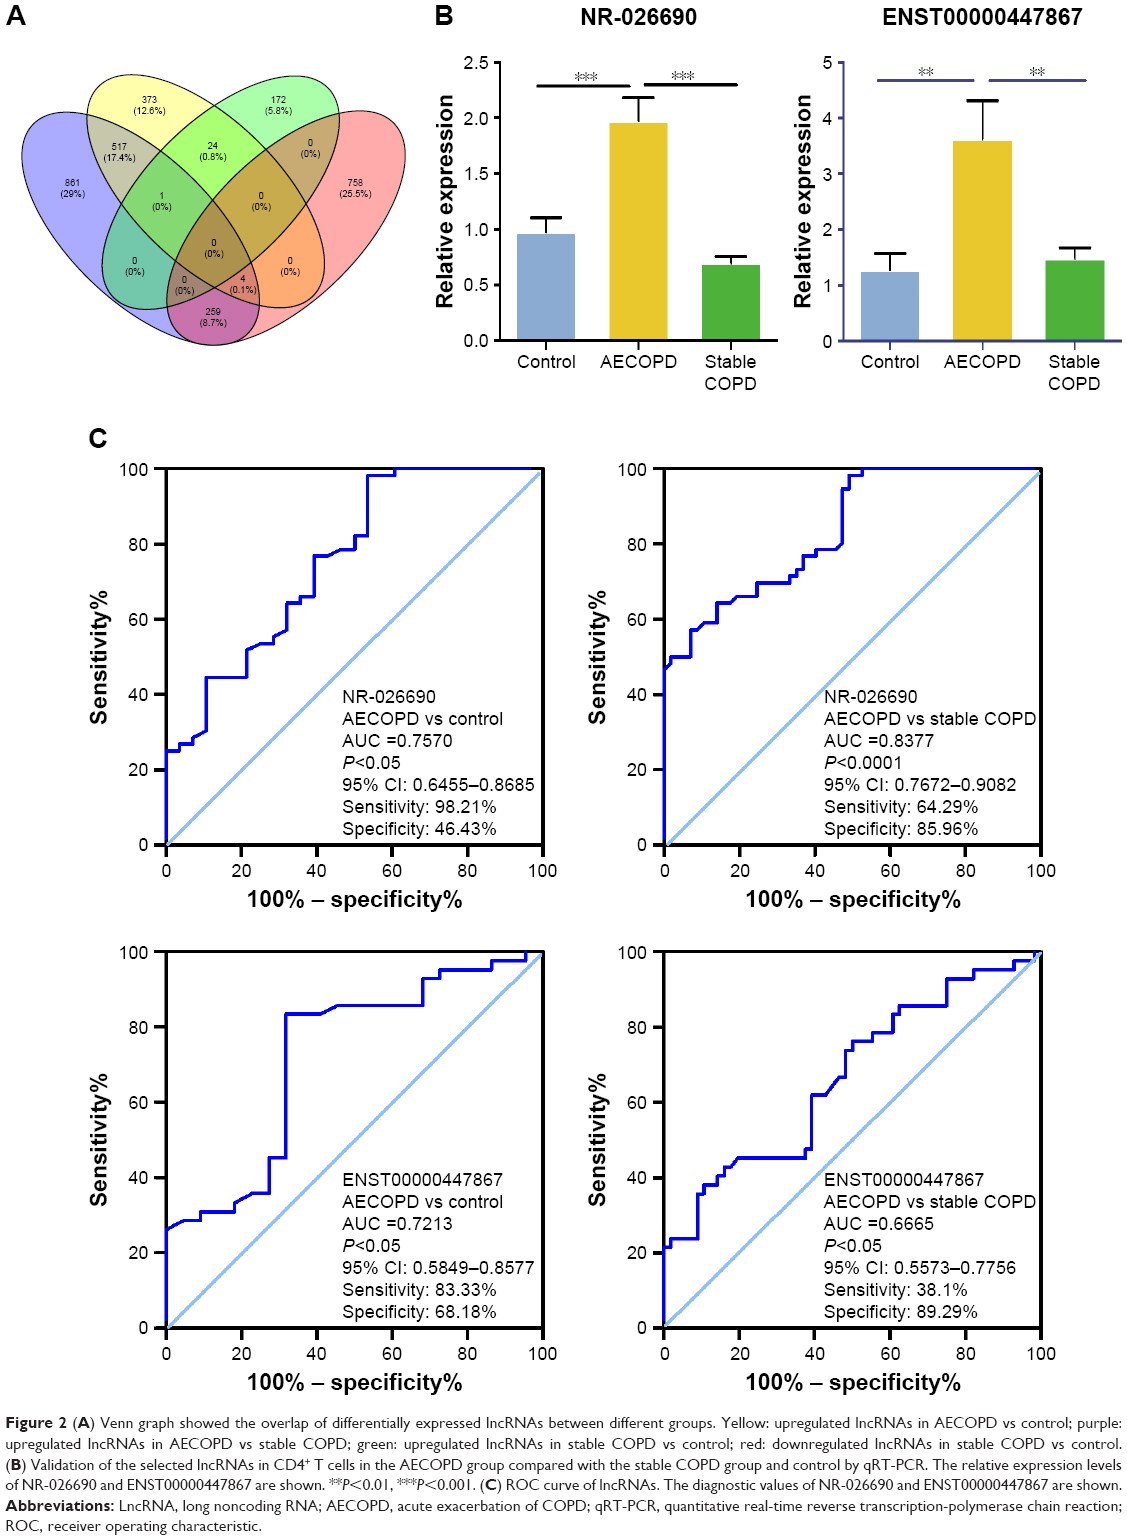 | Figure 2 (A) Venn graph showed the overlap of differentially expressed lncRNAs between different groups. Yellow: upregulated lncRNAs in AECOPD vs control; purple: upregulated lncRNAs in AECOPD vs stable COPD; green: upregulated lncRNAs in stable COPD vs control; red: downregulated lncRNAs in stable COPD vs control. (B) Validation of the selected lncRNAs in CD4+ T cells in the AECOPD group compared with the stable COPD group and control by qRT-PCR. The relative expression levels of NR-026690 and ENST00000447867 are shown. **P<0.01, ***P<0.001. (C) ROC curve of lncRNAs. The diagnostic values of NR-026690 and ENST00000447867 are shown. |
ROC curve analysis of confirmed lncRNAs
ROC curve analysis was performed to investigate the diagnostic value of differentially expressed lncRNAs. We found that the area under the curve (AUC) for NR-026690 (AUC =0.7570, 95% CI: 0.6455–0.8685, P<0.05) was higher than for ENST00000447867 (AUC =0.7213, 95% CI: 0.5849–0.8577, P<0.05), when comparing AECOPD with control. So was the comparison between AECOPD and stable COPD, with the AUC for NR-026690 (AUC =0.8377, 95% CI: 0.7672–0.9082, P<0.0001) and ENST00000447867 (AUC =0.6665, 95% CI: 0.5573–0.7756, P<0.05) shown in Figure 2C. Therefore, NR-026690 might be more useful as a biomarker to distinguish AECOPD from stable COPD and controls.
LncRNA-mRNA co-expression network
It has been proposed that genes with the same function or in the same pathway would be co-expressed, and co-expressed network has been used to predict the potential function of lncRNAs based on this hypothesis. Co-expression network analysis was performed between the two lncRNAs and 919 differentially expressed mRNAs, with a threshold P<0.05 and Pearson correlation coefficient >0.9 (Figure 3A). We found 158 mRNAs co-expressing with ENST00000447867 and 135 mRNAs co-expressing with NR-026690. Furthermore, Venn diagram showed there were 125 mRNAs involved in the overlap of the two parts (Figure 3B).
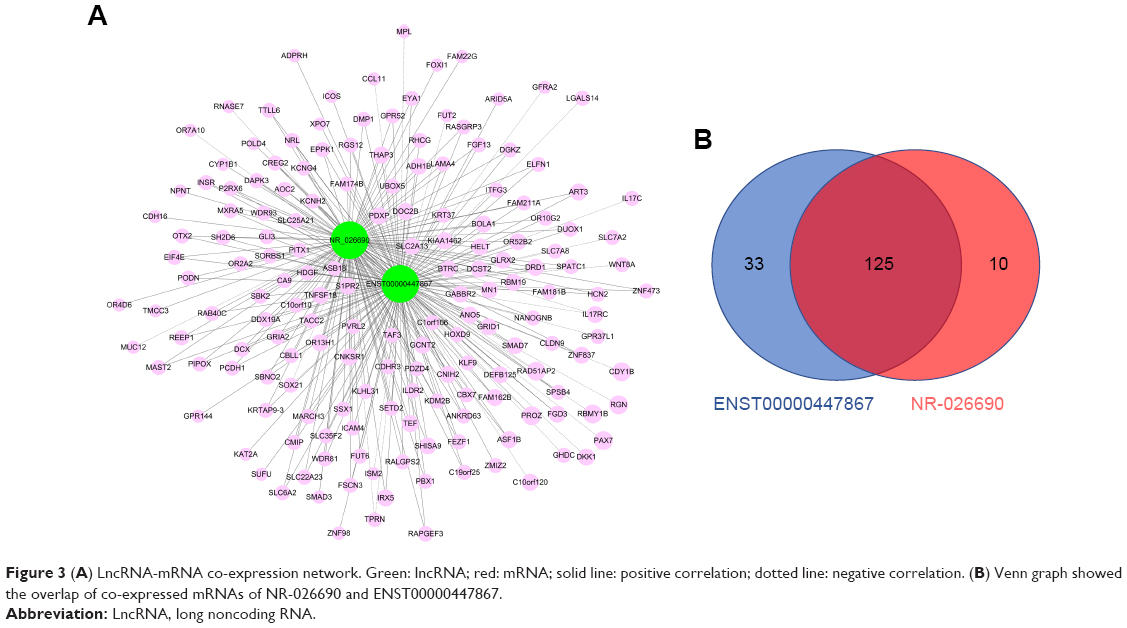 | Figure 3 (A) LncRNA-mRNA co-expression network. Green: lncRNA; red: mRNA; solid line: positive correlation; dotted line: negative correlation. (B) Venn graph showed the overlap of co-expressed mRNAs of NR-026690 and ENST00000447867. |
GO and KEGG pathway analyses
LncRNAs can regulate the function of coding genes. Thus, GO enrichment analysis of differentially expressed mRNAs may partially reveal the role of aberrantly expressed lncRNAs. GO analysis covers the biological processes (BP), cellular components (CC), and molecular function (MF) of protein-coding mRNAs, since no comprehensive annotation database is available for categorizing lncRNAs. A total of 125 mRNAs which formed the overlapping part of the co-expression network were included in GO analyses and the top ten enriched GO terms are listed in Figure 4A. Regulation of T-helper 17 type immune response, negative regulation of T-helper cell differentiation, and regulation of T-helper 17 cell differentiation belonged to the top ten most enriched items in the BP part. Moreover, dopamine neurotransmitter receptor activity and cAMP binding were involved in the MF part. It is notable that dopamine neurotransmitter receptors regulate CD4+T cell activation and differentiation by cAMP production.
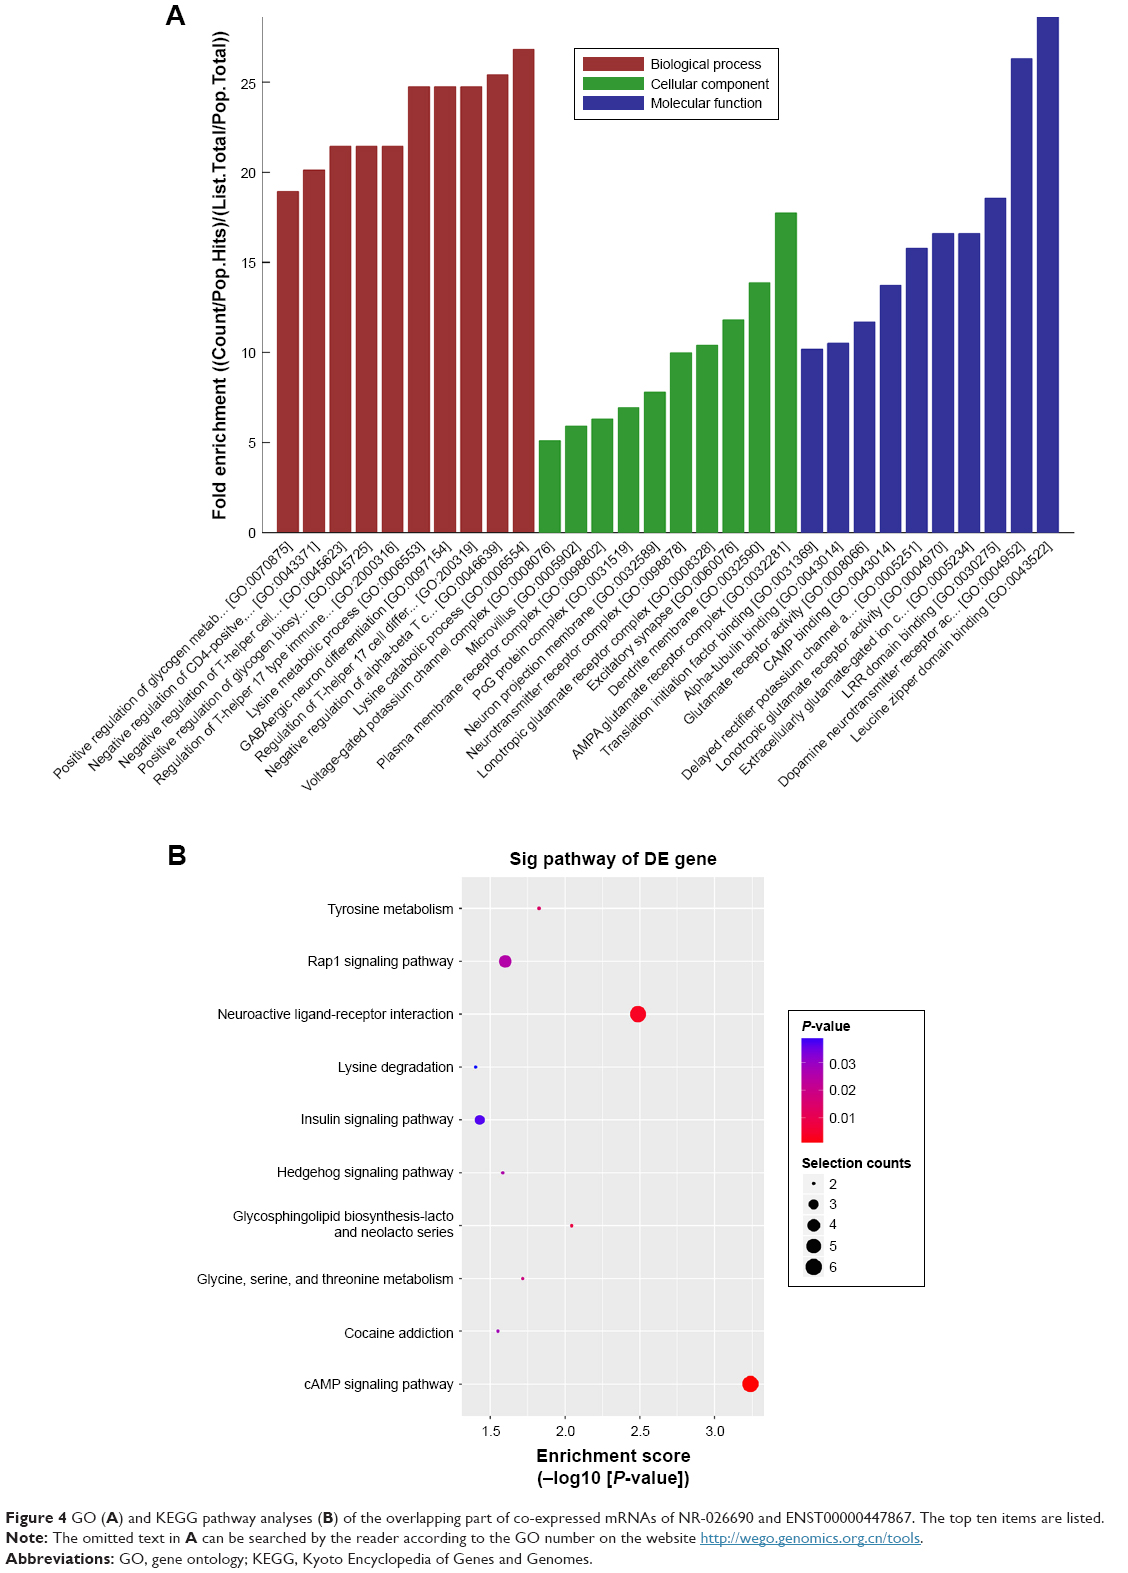 | Figure 4 GO (A) and KEGG pathway analyses (B) of the overlapping part of co-expressed mRNAs of NR-026690 and ENST00000447867. The top ten items are listed. |
KEGG pathway analysis identified the enriched pathways corresponding to the overlapping mRNAs, and the top ten pathways are shown in Figure 4B. In the pathway analysis, horizontal axis represented the enrichment of pathway. The higher value meant the better enrichment. The color of node represented the P-value, and the more the genes were enriched in this pathway, the bigger was the node size. The most significantly enriched one was the cAMP signaling pathway which was consistent with the GO analysis.
CeRNA analysis
CeRNAs are involved in the regulatory mechanism between noncoding RNAs and coding RNAs based on shared MREs. We constructed the ceRNA network based on the microarray data and database. The potential target genes which might be regulated by NR-026690 and ENST00000447867 were identified by Venn diagram. Venn diagram showed the overlap of the mRNAs predicted by ceRNA analysis and co-expressed mRNAs of specific lncRNA. As shown in Figure 5A, the most potential targets of NR-026690 and ENST00000447867 were DCX, RAPGEF3, and UBOX5. We found that RAPGEF3 was involved in the cAMP signaling pathway and the development of COPD. Thus, the NR-026690 and ENST00000447867-miRNAs-RAPGEF3 network was separated from the original ceRNA network to make it easier to identify (Figure 5B).
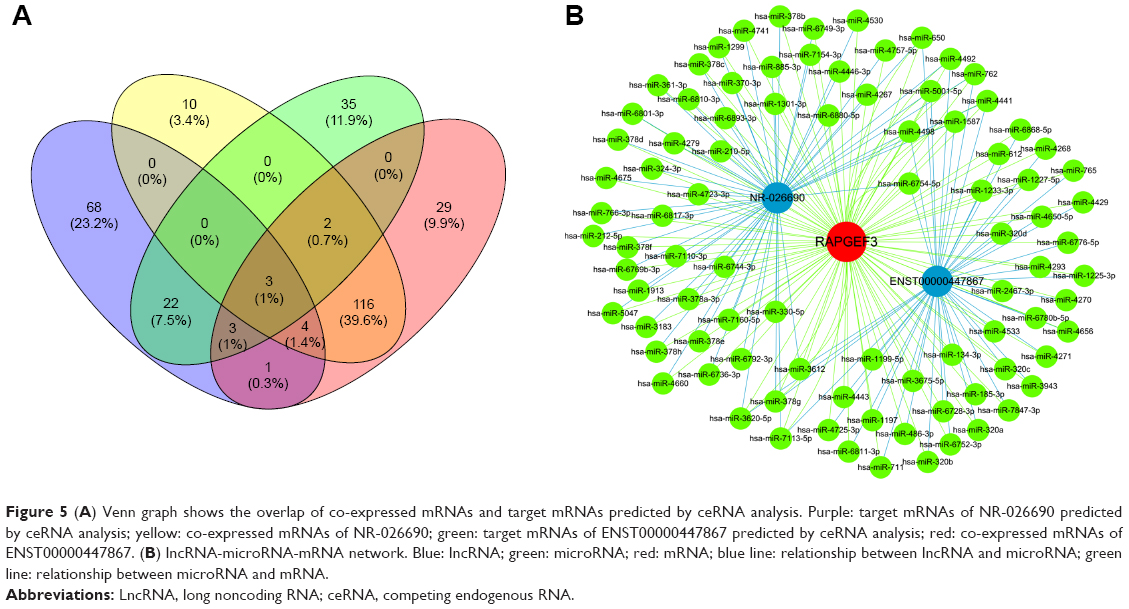 | Figure 5 (A) Venn graph shows the overlap of co-expressed mRNAs and target mRNAs predicted by ceRNA analysis. Purple: target mRNAs of NR-026690 predicted by ceRNA analysis; yellow: co-expressed mRNAs of NR-026690; green: target mRNAs of ENST00000447867 predicted by ceRNA analysis; red: co-expressed mRNAs of ENST00000447867. (B) lncRNA-microRNA-mRNA network. Blue: lncRNA; green: microRNA; red: mRNA; blue line: relationship between lncRNA and microRNA; green line: relationship between microRNA and mRNA. |
The expression of RAPGEF3 and cytokines in CD4+ T cells of COPD patients and correlation of RAPGEF3 and cytokines with lncRNAs
The transcriptional expression level of RAPGEF3 in CD4+ T cells was significantly higher in the AECOPD group compared to the control group (P<0.01) and stable COPD group (P<0.05) (Figure 6A), but it was similar between the control group and the stable COPD group. Spearman’s correlation test was conducted between RAPGEF3 and verified DElncRNAs in the AECOPD group. We found that RAPGEF3 was positively associated with NR-026690 (r=0.4925, P<0.01, Figure 6B) and ENST00000447867 (r=0.4065, P<0.01, Figure 6C). We also detected the expression of classical cytokines in different groups. The result showed that the expression of IL-17A, IL-6, and TNF-α was higher in the AECOPD group compared with controls and stable COPD group. IL-10 was significant lower in AECOPD group, and no statistical difference was found in the expression of IL-4 between different groups. The data are shown in Figure S1. Spearman’s correlation test was performed between cytokines and verified DElncRNAs in the AECOPD group, but we did not find significant correlation between them. The results are presented in Table 3.
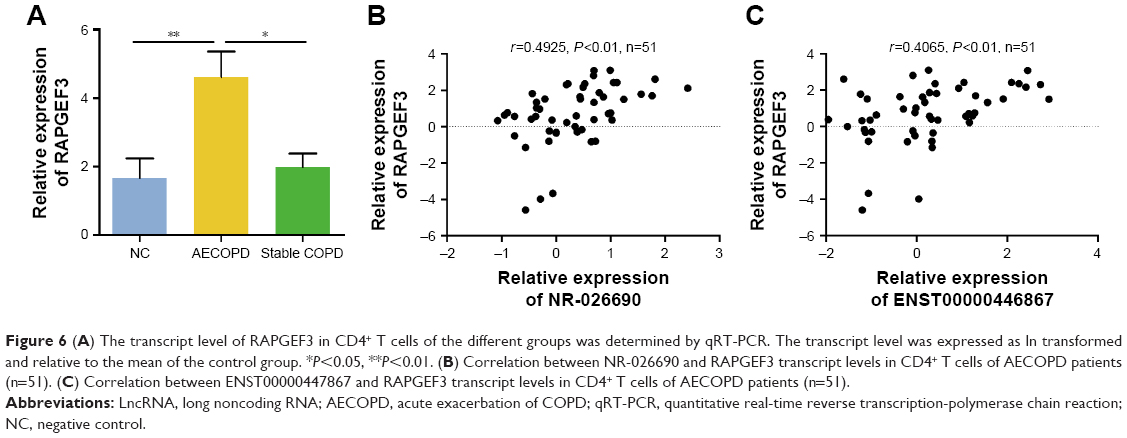 | Figure 6 (A) The transcript level of RAPGEF3 in CD4+ T cells of the different groups was determined by qRT-PCR. The transcript level was expressed as ln transformed and relative to the mean of the control group. *P<0.05, **P<0.01. (B) Correlation between NR-026690 and RAPGEF3 transcript levels in CD4+ T cells of AECOPD patients (n=51). (C) Correlation between ENST00000447867 and RAPGEF3 transcript levels in CD4+ T cells of AECOPD patients (n=51). |
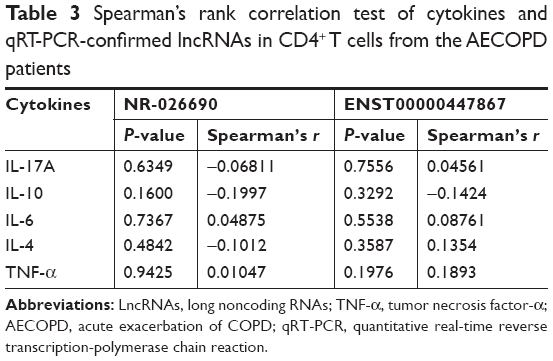 | Table 3 Spearman’s rank correlation test of cytokines and qRT-PCR-confirmed lncRNAs in CD4+ T cells from the AECOPD patients |
Discussion
In a previous study, the aberrant expressions of lncRNAs and mRNAs in the lung tissue of COPD patients were revealed by Bi et al.15 Based on the microarray and bioinformatics analyses, they concluded that the altered expression of lncRNAs might take part in pathways implicated in COPD onset and progression. Tang et al found that lncRNAs might act as potential diagnostic biomarker for patients with COPD.16 In addition, lncRNA TUG1 was found to inhibit proliferation with TGF-beta induction in BEAS-2B and HLF1 cell lines.16 In addition, lncRNAs might mediate the SIRT1/FoxO3a and SIRT1/p53 signaling pathways and regulate type II alveolar epithelial cell senescence in COPD patients.17 Previous studies have mainly focused on the lung tissue of COPD patients. However, inflammation mediated by T cells has been identified as a key component of COPD.18 Therefore, CD4+ T cells were selected as research objective in our study, which has not been discussed before.
In the present study, we first conducted a microarray analysis to explore the lncRNA and mRNA expression profiles in CD4+ T cells of peripheral blood from AECOPD patients and stable COPD patients. Compared with control subjects, the expression patterns of lncRNAs and mRNAs were profoundly altered in the COPD groups. We noticed that the expression profile of one of AECOPD patients was rather different from other AECOPD patients. However, we did not find any difference in the clinical features between this patient and other patients. So, the results might be caused by the heterogeneity of the disease which we did not distinguish. Then, we performed qRT-PCR to verify the expression of selected lncRNAs. The results showed that the expression of NR-026690 and ENST00000447867 was significantly higher in the AECOPD patients compared with stable COPD patients and control subjects. ROC curve analysis showed that NR-026690 and ENST00000447867 could be potential diagnostic biomarkers to distinguish AECOPD from stable COPD and control subjects.
Based on the lncRNA-mRNA co-expression network, GO and KEGG pathway analyses were utilized to study the differentially co-expressed mRNAs which partially showed the function of specific lncRNAs. The result of GO analysis showed that the differentially co-expressed mRNAs were closely related with BP, such as regulation of the T-helper 17 cell immune response19,20 and negative regulation of CD4+ T cell.21,22 These items were in accordance with the function of CD4+ T cell in COPD. However, Spearman’s rank correlation test did not show relationship between the expression of lncRNAs and cytokines. The expression of cytokines can be regulated by many factors and lncRNAs may be one of them. In addition, lncRNAs might take part in the CD4+T cell immune response in other ways. So, further studies are needed to explore this. For the KEGG pathway analysis, the cAMP signaling pathway was enriched which agreed with the GO analysis.
The role of lncRNAs as ceRNAs has been extensively studied in various cancers, including lung cancer,23 gastric cancer,24 and hepatocellular carcinoma,25 but the relevance of lncRNAs serving as ceRNAs in COPD has rarely been studied. In this study, we performed lncRNA-mRNA co-expression network and ceRNA analyses to investigate the possible target mRNAs of differentially expressed lncRNAs. Due to similarity of the expression pattern and co-expressed mRNAs between NR-026690 and ENST00000447867, we combined the data of the two lncRNAs and we found three possible targeted genes: DCX, RAPGEF3, and UBOX5.
RAPGEF3, also known as EPAC1, is a Rap1 guanine nucleotide-exchange factor activated by cyclic AMP which is a prototypic second messenger mediating signaling pathway related to many human diseases including cancer,26 immunological diseases,27 and cardiac dysfunction.28 In a previous study, RAPGEF3-Rac1 signaling was involved in increased endothelial permeability resulting from Krüppel-like factor 2 in acute respiratory distress syndrome.29 In another study, EPAC attenuated cigarette smoke extract-induced IL-8 release from human airway smooth muscle cells,30 which is crucial for the development of COPD. We found that the transcriptional level of RAPGEF3 in CD4+ T cells of the AECOPD group was significantly higher than the stable COPD group and control, which was consistent with the microarray data. However, the result was the opposite of the finding in human airway smooth muscle. This might be caused by the different cell types. The transcript expression of RAPGEF3 was positively related with NR-026690 and ENST00000447867. The data indicated that NR-026690 and ENST00000447867 might regulate the expression of RAPGEF3 via miRNA and take part in acute exacerbation of COPD.
Conclusion
The present study revealed the expression profiles of lncRNAs and mRNAs in AECOPD and stable COPD. The result demonstrated that lncRNAs were aberrantly expressed in different states of COPD. Our study validated the significant upregulation of NR-026690 and ENST00000447867, suggesting their potential use as novel biomarkers for diagnosis. In the future, it is necessary to investigate the detailed molecular mechanisms by which lncRNAs (NR-026690 and ENST00000447867) function as miRNA sponges to influence RAPGEF3 and to regulate COPD development.
Acknowledgments
The authors thank the patients who volunteered for this study. This study was supported by the National Key Technologies R&D Program (2016YFC 1304700, 1303900).
Disclosure
The authors report no conflicts of interest in this work.
References
Vestbo J, Hurd SS, Agustí AG, et al. Global strategy for the diagnosis, management, and prevention of chronic obstructive pulmonary disease. Am J Respir Crit Care Med. 2013;187(4):347–365. | ||
Vogelmeier CF, Criner GJ, Martinez FJ, et al. Global strategy for the diagnosis, management, and prevention of chronic obstructive lung disease 2017 report: gold executive summary. Eur Respir J. 2017;49(3):1700214. | ||
Singh S, Verma SK, Kumar S, et al. Correlation of severity of chronic obstructive pulmonary disease with potential biomarkers. Immunol Lett. 2018;196:1–10. | ||
Caram LMO, Ferrari R, Nogueira DL, et al. Tumor necrosis factor receptor 2 as a possible marker of COPD in smokers and ex-smokers. Int J Chron Obstruct Pulmon Dis. 2017;12:2015–2021. | ||
Zhang L, Cheng Z, Liu W, Wu K. Expression of interleukin (IL)-10, IL-17A and IL-22 in serum and sputum of stable chronic obstructive pulmonary disease patients. COPD. 2013;10(4):459–465. | ||
Cheetham SW, Gruhl F, Mattick JS, Dinger ME. Long noncoding RNAs and the genetics of cancer. Br J Cancer. 2013;108(12):2419–2425. | ||
Ponting CP, Oliver PL, Reik W. Evolution and functions of long noncoding RNAs. Cell. 2009;136(4):629–641. | ||
O’Leary VB, Ovsepian SV, Carrascosa LG, et al. Particle, a triplex-forming long ncRNA, regulates locus-specific methylation in response to low-dose irradiation. Cell Rep. 2015;11(3):474–485. | ||
Qu X, Dang X, Wang W, et al. Long noncoding RNAs and mRNA regulation in peripheral blood mononuclear cells of patients with chronic obstructive pulmonary disease. Mediators Inflamm. 2018;2018:1–14. | ||
Geerdink JX, Simons SO, Pike R, Stauss HJ, Heijdra YF, Hurst JR. Differences in systemic adaptive immunity contribute to the ‘frequent exacerbator’ COPD phenotype. Respir Res. 2016;17(1):140. | ||
Ponce-Gallegos MA, Ramírez-Venegas A, Falfán-Valencia R. Th17 profile in COPD exacerbations. Int J Chron Obstruct Pulmon Dis. 2017;12:1857–1865. | ||
Chiappori A, Folli C, Balbi F, et al. CD4(+)CD25(high)CD127(−) regulatory T-cells in COPD: smoke and drugs effect. World Allergy Organ J. 2016;9:5. | ||
Roberts MEP, Higgs BW, Brohawn P, et al. CD4+ T-cell profiles and peripheral blood ex-vivo responses to T-cell directed stimulation delineate COPD phenotypes. Chronic Obstr Pulm Dis. 2015;2(4):268–280. | ||
Vestbo J, Hurd SS, Agustí AG, et al. Global strategy for the diagnosis, management, and prevention of chronic obstructive pulmonary disease: gold executive summary. Am J Respir Crit Care Med. 2013;187(4):347–365. | ||
Bi H, Zhou J, Wu D, et al. Microarray analysis of long non-coding RNAs in COPD lung tissue. Inflamm Res. 2015;64(2):119–126. | ||
Tang W, Shen Z, Guo J, Sun S. Screening of long non-coding RNA and TUG1 inhibits proliferation with TGF-β induction in patients with COPD. Int J Chron Obstruct Pulmon Dis. 2016;11:2951–2964. | ||
Gu C, Li Y, Liu J, et al. LncRNA-mediated SIRT1/FoxO3a and SIRT1/p53 signaling pathways regulate type II alveolar epithelial cell senescence in patients with chronic obstructive pulmonary disease. Mol Med Rep. 2017;15(5):3129–3134. | ||
Hogg JC, Chu F, Utokaparch S, et al. The nature of small-airway obstruction in chronic obstructive pulmonary disease. N Engl J Med. 2004;350(26):2645–2653. | ||
Wang H, Ying H, Wang S, et al. Imbalance of peripheral blood Th17 and Treg responses in patients with chronic obstructive pulmonary disease. Clin Respir J. 2015;9(3):330–341. | ||
Vargas-Rojas MI, Ramírez-Venegas A, Limón-Camacho L, Ochoa L, Hernández-Zenteno R, Sansores RH. Increase of Th17 cells in peripheral blood of patients with chronic obstructive pulmonary disease. Respir Med. 2011;105(11):1648–1654. | ||
Sullivan AK, Simonian PL, Falta MT, et al. Oligoclonal CD4+ T cells in the lungs of patients with severe emphysema. Am J Respir Crit Care Med. 2005;172(5):590–596. | ||
Paats MS, Bergen IM, Hoogsteden HC, van der Eerden MM, Hendriks RW. Systemic CD4+ and CD8+ T-cell cytokine profiles correlate with gold stage in stable COPD. Eur Respir J. 2012;40(2):330–337. | ||
Lu W, Zhang H, Niu Y, et al. Long non-coding RNA linc00673 regulated non-small cell lung cancer proliferation, migration, invasion and epithelial mesenchymal transition by sponging miR-150-5p. Mol Cancer. 2017;16(1):118. | ||
Lin Z, Zhou Z, Guo H, et al. Long noncoding RNA gastric cancer-related lncRNA1 mediates gastric malignancy through miRNA-885-3p and cyclin-dependent kinase 4. Cell Death Dis. 2018;9(6):607. | ||
Xin X, Wu M, Meng Q, et al. Long noncoding RNA HULC accelerates liver cancer by inhibiting PTEN via autophagy cooperation to miR15a. Mol Cancer. 2018;17(1):94. | ||
Lim JA, Juhnn YS. Isoproterenol increases histone deacetylase 6 expression and cell migration by inhibiting ERK signaling via PKA and Epac pathways in human lung cancer cells. Exp Mol Med. 2016;48(1):e204. | ||
Tiwari S, Felekkis K, Moon EY, Flies A, Sherr DH, Lerner A. Among circulating hematopoietic cells, B-CLL uniquely expresses functional Epac1, but Epac1-mediated Rap1 activation does not account for PDE4 inhibitor-induced apoptosis. Blood. 2004;103(7):2661–2667. | ||
Jin H, Fujita T, Jin M, et al. Cardiac overexpression of Epac1 in transgenic mice rescues lipopolysaccharide-induced cardiac dysfunction and inhibits JAK-STAT pathway. J Mol Cell Cardiol. 2017;108:170–180. | ||
Huang RT, Wu D, Meliton A, et al. Experimental lung injury reduces Krüppel-like factor 2 to increase endothelial permeability via regulation of RAPGEF3-Rac1 signaling. Am J Respir Crit Care Med. 2017;195(5):639–651. | ||
Oldenburger A, Roscioni SS, Jansen E, et al. Anti-inflammatory role of the cAMP effectors Epac and PKA: implications in chronic obstructive pulmonary disease. PLoS One. 2012;7(2):e31574. |
Supplementary material
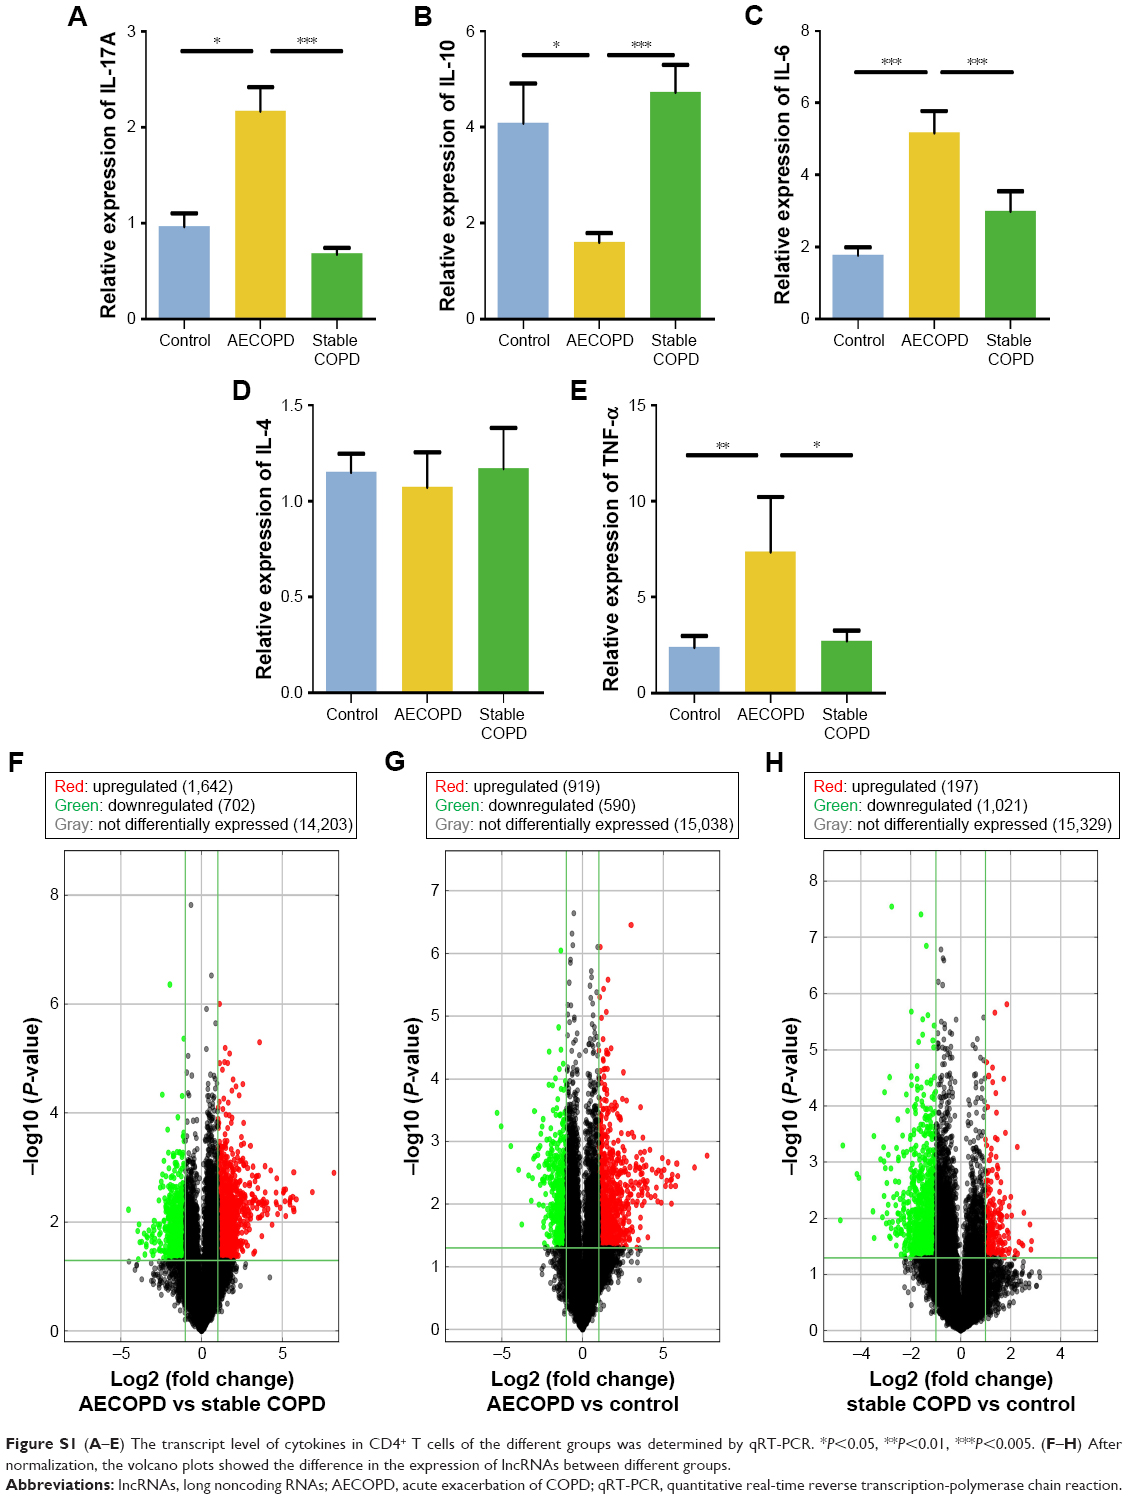 | Figure S1 (A–E) The transcript level of cytokines in CD4+ T cells of the different groups was determined by qRT-PCR. *P<0.05, **P<0.01, ***P<0.005. (F–H) After normalization, the volcano plots showed the difference in the expression of lncRNAs between different groups. |
 © 2019 The Author(s). This work is published and licensed by Dove Medical Press Limited. The full terms of this license are available at https://www.dovepress.com/terms.php and incorporate the Creative Commons Attribution - Non Commercial (unported, v3.0) License.
By accessing the work you hereby accept the Terms. Non-commercial uses of the work are permitted without any further permission from Dove Medical Press Limited, provided the work is properly attributed. For permission for commercial use of this work, please see paragraphs 4.2 and 5 of our Terms.
© 2019 The Author(s). This work is published and licensed by Dove Medical Press Limited. The full terms of this license are available at https://www.dovepress.com/terms.php and incorporate the Creative Commons Attribution - Non Commercial (unported, v3.0) License.
By accessing the work you hereby accept the Terms. Non-commercial uses of the work are permitted without any further permission from Dove Medical Press Limited, provided the work is properly attributed. For permission for commercial use of this work, please see paragraphs 4.2 and 5 of our Terms.