")
Back to Journals » Cancer Management and Research » Volume 13
LncRNA SLC16A1-AS1 is Upregulated in Glioblastoma and Promotes Cancer Cell Proliferation by Regulating miR-149 Methylation
Authors Long Y, Li H, Jin Z, Zhang X
Received 28 May 2020
Accepted for publication 18 September 2020
Published 10 February 2021 Volume 2021:13 Pages 1215—1223
DOI https://doi.org/10.2147/CMAR.S264613
Checked for plagiarism Yes
Review by Single anonymous peer review
Peer reviewer comments 2
Editor who approved publication: Professor Harikrishna Nakshatri
Yinbo Long, Heyang Li, Zhibin Jin, Xiang Zhang
Department of Neurosurgery, Cangzhou Central Hospital, Cangzhou City, Hebei Province, 061000, People’s Republic of China
Correspondence: Xiang Zhang
Department of Neurosurgery, Cangzhou Central Hospital, Cangzhou City, Hebei Province, 061000, People’s Republic of China
Email [email protected]
Introduction: LncRNA SLC16A1-AS1 has been characterized as a critical player in lung cancer, while its role in glioblastoma (GBM) is unknown. By analyzing the TCGA dataset, we observed the upregulation of SLC16A1-AS1 expression in GBM. Therefore, we aimed to investigate the role of SLC16A1-AS1 in this cancer.
Methods: GBM tissues and paired non-tumor tissues were collected from 62 GBM patients through biopsy. RT-qPCR was performed to determine the expression of SLC16A1-AS1 and miR-149. Linear regression was used to analyze their correlations. The relationship between SLC16A1-AS1 and miR-149 was assessed by gain and loss of function experiments. Methylation-specific PCR (MSP) and bisulfite sequencing PCR (BSP) were performed to analyze the methylation status of miR-149. Cell proliferation was evaluated by CCK-8 assay and colony formation experiments in GBM cells.
Results: We found that SLC16A1-AS1 expression was upregulated in GBM tissues, and the upregulated expression of SLC16A1-AS1 predicted poor survival of GBM patients. MiR-149 was downregulated in GBM tissues and inversely correlated with the expression of SLC16A1-AS1. In GBM cells, overexpression of SLC16A1-AS1 downregulated the expression of miR-149 and increased the methylation of miR-149 gene. In cell proliferation and colony formation assay, overexpression of SLC16A1-AS1 reduced the inhibitory effects of miR-149 on GBM cell proliferation.
Conclusion: SLC16A1-AS1 may promote GBM cell proliferation by regulating miR-149 methylation. SLC16A1-AS1 can be considered as a potential diagnostic marker in GBM.
Keywords: GBM, SLC16A1-AS1, miR-149, methylation, proliferation
Introduction
Glioblastoma (GBM) is the advanced stage of glioma and characterized by an unacceptably high mortality rate.1–4 After initial diagnosis, GBM patients usually survive for no longer than 18 months. In fact, only less than 5% of GBM patients can survival for more than 5 years after the initial diagnosis.5,6 The treatment of GBM is challenged by the lack of effective therapeutic approaches.7 Chemotherapy and radiotherapy are frequently applied in the treatment of GBM, while the resistance of chemotherapy and radiotherapy usually inevitably developed,8,9 leading to poor treatment outcomes.10 Therefore, novel treatment strategies are needed to improve the survival of GBM patients.
Targeted therapies are emerging as novel therapeutic approaches that aim to suppress disease progression by regulating disease-related genes.11,12 Some signaling pathways, such as the PI3K/Akt/mTOR signaling pathway and the NOTCH signaling pathway have been proven to be the potential targets for GBM targeted therapies.13,14 Non-coding RNAs (ncRNAs), such as miRNAs and long non-coding RNAs (lncRNAs), do not encode protein product, but regulate the expression of target genes and participate in cancer biology.15–17 Therefore, ncRNAs are considered as potential targets for cancer therapy.18 NcRNAs not only directly participate in the progression of GBM,19 but also serve as diagnostic and prognostic biomarkers for this disease.20–22 Therefore, functional characterization of ncRNAs in cancer development and progression is needed. LncRNA SLC16A1-AS1 has been characterized as a critical player in lung cancer,23 while its role in glioblastoma (GBM) is unknown. By analyzing the TCGA dataset for transcriptomic analysis (http://gepia.cancer-pku.cn),24 we observed the upregulation of SLC16A1-AS1 expression in GBM (see Supplement Figure 1).2,25 2 It has been well established that miR-149 is epigenetically silenced in GBM, and its overexpression not only suppresses tumor cell proliferation but also increases the sensitivity of cancer cells to chemotherapy.26–29 We, therefore, investigated the role of SLC16A1-AS1 in GBM and its potential interaction with miR-149 in this study.
Materials and Methods
Patients and Tissues
GBM and adjacent paired non-tumor tissues were obtained from 62 GBM patients (32 males and 30 females, age range of 52 to 72 years old, mean age of 67.8 ± 4.9 years old) admitted at Cangzhou Central Hospital between May 2015 and May 2017 through biopsy. The clinical characteristics of GBM patients are shown in Table 1. This study was approved by the Ethics Committee of Cangzhou Central Hospital (ChiCTR2000033771) and conducted in accordance with the Declaration of Helsinki. GBM patients with initiated therapy were excluded from this study. No recurrent GBM patients were included. No other severe clinical disorders, such as diabetes, heart diseases and severe infections, were observed in these patients. All GBM patients signed the written form of informed consent.
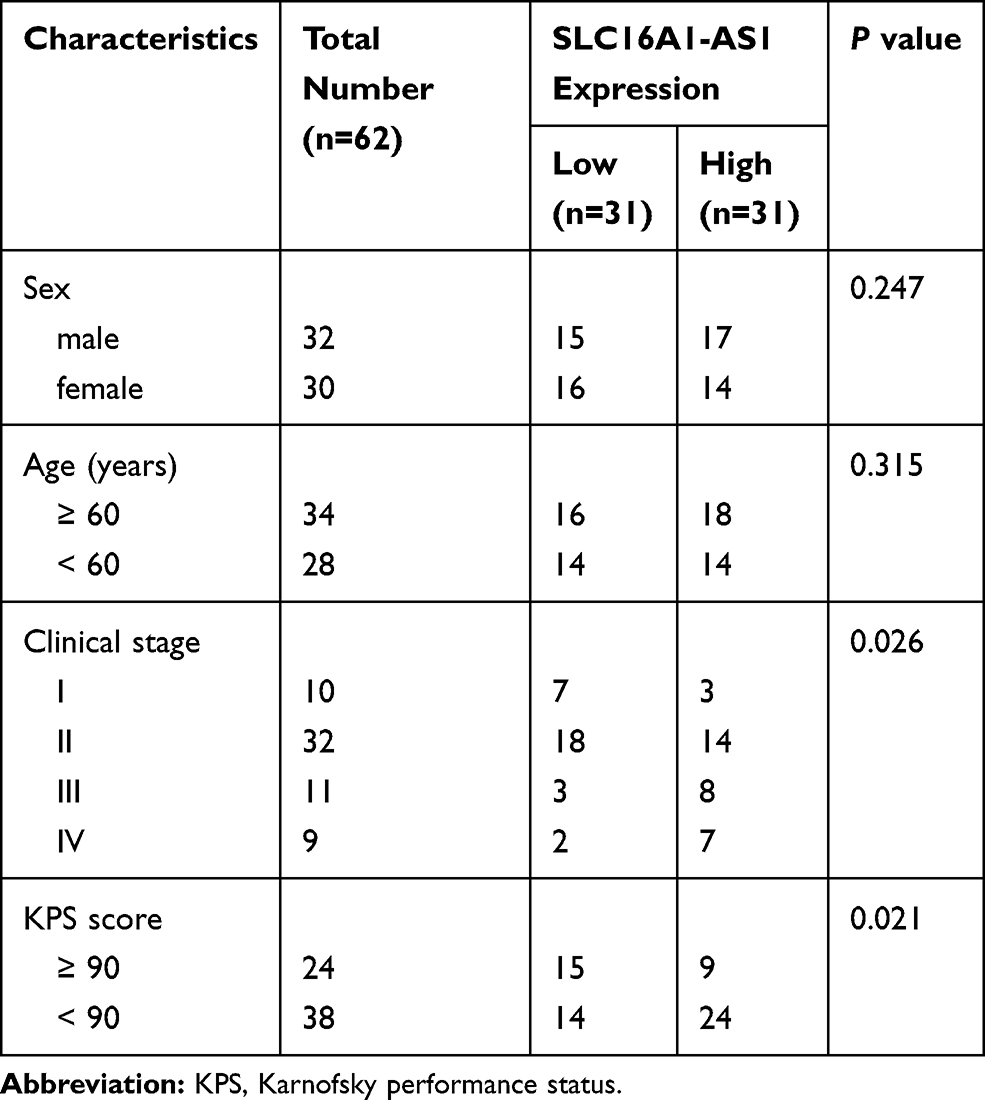 |
Table 1 Relationship Between SLC16A1-AS1 Expression and Clinical Pathological Characteristics of GBM Patients |
A 2-Year Follow-Up Study
From the day of admission, the 62 patients with GBM were followed up for 2 years. Patients were visited through a telephone call. Patients’ survival conditions were recorded. Patients who died of causes unrelated to GBM were excluded from this study. All the 62 patients completed the follow-up study.
U87 and U-118 MG Cells and Cell Transfections
To perform in vitro cell experiments, human GBM cell lines U87 (ATCC-HTB-14) and U-118 MG (ATCC-HTB-15, USA) were used. The cell culture medium was DMEM contained 10% FBS and 1% penicillin/streptomycin. Cells were cultured in a 5% CO2 incubator (95% humidity) at 37 °C. Following experiments were carried out when 80% confluence was reached. Mimic of miR-149 and negative control (NC) miRNA were purchased from Sigma-Aldrich. Backbone vector expressing SLC16A1-AS1 (NCBI Accession: NR_103743.1) was constructed with pcDNA3.1 vector (Invitrogen). The vector construction service was provided by Invitrogen. Transient transfections were performed using lipofectamine 2000 (Invitrogen) in U87 and U-118 MG cells (106) with an expression vector (1 µg per reaction) or miRNA (40 nM). All procedures were completed following the instructions from Invitrogen. NC miRNA- or empty vector-transfected cells were NC cells. Untransfected cells were used as control (C) cells. At 48 h post-transfection, cells were harvested and subjected to do the following experiments.
Methylation-Specific PCR (MSP) and Bisulfite Sequencing PCR (BSP)
To study the role of SLC16A1-AS1 in regulating the methylation of miR-149 gene, genomic DNAs were isolated from U87 cells using the Genomic DNA Extraction Kit (ab156900, Abcam). The Methylation-GoldTM kit (ZYMO RESEARCH) was used to convert genomic DNA samples, and MSP reactions were performed using Taq 2× master mix (NEB) to analyze the methylation of miR-149 gene. Each PCR was performed with 20 ng genomic DNA as a template. PCR conditions were: 95 °C for 5 min, then 30 cycles of 95 °C for 30 s, 55 °C for 30 s and 72 °C for 32 s, followed by 72 °C for 5 min. The amplicon was the full-length miR149 precursor.
After bisulfite conversion of genomic DNA, the proximal promoter of miR-149 was amplified by PCR, and then the PCR products were gel-purified and cloned into pcDNA3.1 vector. Individual bacterial colonies were sequenced using vector-specific primers and 10 colonies were sequenced for analyzing the overall miR-149 methylation status. The primer sequences for MSP and BSP are listed in Table 2.
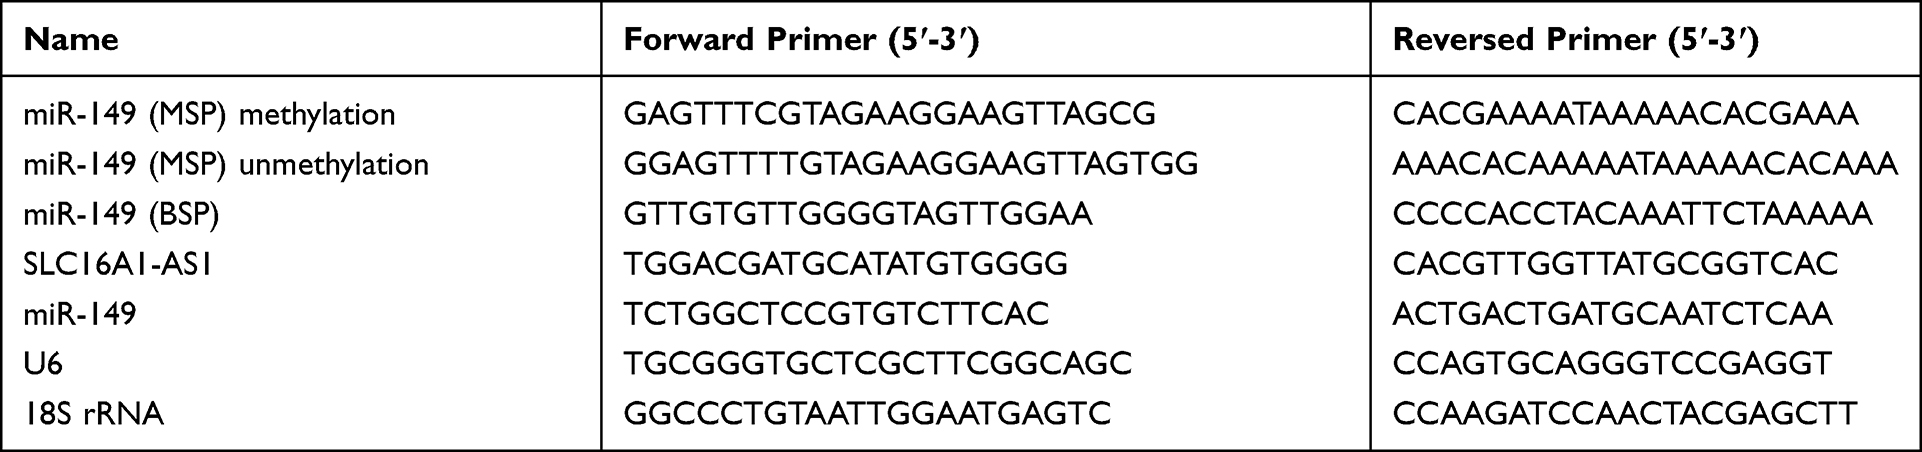 |
Table 2 Sequences of Primers Used in PCR |
RNA Isolation
Total RNAs were isolated from U87 cells collected at 48 h post-transfection and paired tissue samples using RNAzol reagent (Sigma-Aldrich). All RNA samples were digested with DNase I (Sigma-Aldrich) at 37 °C for 2 h to completely remove genomic DNAs. Analysis of RNA integrity was performed using a 6% Urine-PAGE gel. The RNA concentration was measured by NanoDrop Spectrophotometers (Thermo Scientific) and the ratio of A260/A280 were all among 1.8–2.0, which indicated the high quality of RNA.
RT-qPCR Assay
A Reverse Transcription System (A5003, Promega Corporation) was used to reverse transcribe RNA samples (from both in vitro cultivated cells and paired tissues) with satisfactory quality into cDNAs. With cDNAs as a template, qPCRs reactions were prepared using SYBR Green qPCR Kit (BioCat GmbH). The expression of SLC16A1-AS1 was determined with 18S rRNA as internal. The expression of mature miR-149 was determined through the following steps: 1) addition of poly (A) to mature miRNAs; 2) miRNA reverse transcriptions; 3) qPCR reactions. All these three steps were completed using the Genecopoeia All-in-One™ miRNA qRT-PCR Reagent Kit. U6 was used as the internal control of miR-149. Primer sequences are summarized in Table 1. PCR conditions were: 95 °C for 5 min, then 40 cycles of 95 °C for 30 s and 58 °C for 30 s. Each experiment was completed in 3 replicate PCR reactions. Ct value normalizations were performed using the 2−ΔΔCt method as previously reported.30–32
Cell Counting Kit 8 (CCK-8) Assay and Colony Formation
To analyze the proliferation of U87 cells, cells were harvested at 48 h post-transfection and counted. Each well of a 96-well plate was filled with 4500 cells in 0.1 mL medium, followed by cell culture at 37 °C. To analyze cell proliferation, OD values at 450 nm were measured every 24 h for a total of 4 days. At 4 h before the measurement of OD values, 10 µL CCK-8 solution was added into each well. The OD value of C group at 96 h was set to 100%, and all other groups and other time points were normalized to this value to calculate the relative cell proliferation. For colony formation, cells were then seeded into a 6-well plate at a density of 2000 cells/well, after 2 weeks of culture, cells were fixed and stained using 0.1% crystal violet. The colonies were calculated and recorded by phase inversion microscope (Olympus).
Statistical Analysis
Differences between paired tissues were compared by paired t-test. Comparisons among multiple groups were conducted using ANOVA Tukey’s test. Correlations were analyzed by linear regression. Data were expressed as either mean value or mean ± SEM values. To perform survival analysis, the 62 patients were divided into high and low SLC16A1-AS1 level groups (n = 31). The cutoff value was the median level of SLC16A1-AS1 expression in GBM tissues. Survive curves were plotted using follow-up data. Log-rank test was used to compare survival curves. P < 0.05 was considered as statistically significant.
Results
Overexpression of SLC16A1-AS1 is Correlated with the Poor Survival of GBM Patients
The expression of SLC16A1-AS1 in GBM patients was first explored by analyzing the TCGA dataset using an online program GEPIA (http://gepia.cancer-pku.cn/). It was observed that the expression levels of SLC16A1-AS1 were higher in GBM tissues than that in non-tumor tissues (Supplementary Figure 1). The averaged relative expression levels of SLC16A1-AS1 in GBM and non-tumor tissues were 1.29 and 0.87, respectively. To further confirm the upregulation of SLC16A1-AS1 in GBM, RT-qPCR was performed to detect the expression of SLC16A1-AS1 in GBM and paired non-tumor tissues. Compared with non-tumor tissues, the expression levels of SLC16A1-AS1 were significantly higher in GBM tissues (Figure 1A, p < 0.001). Survival analysis showed that, compared with the low-level SLC16A1-AS1 group, much lower overall survival rate was observed in the high-level SLC16A1-AS1 group (Figure 1B, p < 0.05).
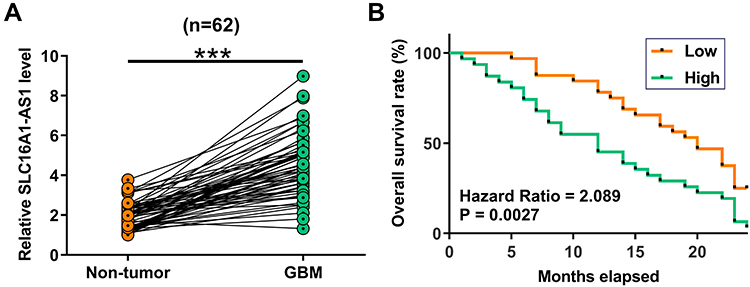 |
Figure 1 Overexpression of SLC16A1-AS1 is correlated with the poor survival of GBM patients. Expression of SLC16A1-AS1 in GBM and paired non-tumor tissues was determined by RT-qPCR. Mean values of three technical replicates were presented and compared between paired tissues using paired t-test (A), ***p < 0.001. The 62 patients were divided into high and low SLC16A1-AS1 level groups (n = 31). The cutoff value was the median level of SLC16A1-AS1 expression in GBM tissues. Survive curves were plotted based on the 2 years’ follow-up data. Log-rank test was used to compare survival curves (B). |
MiR-149 Was Downregulated in GBM and Inversely Correlated with SLC16A1-AS1
Expression of miR-149 in GBM and paired non-tumor tissues was determined by RT-qPCR. Compared with non-tumor tissues, the expression levels of miR-149 were significantly lower in GBM tissues (Figure 2A, p < 0.001). Correlation analysis showed that the expression of miR-149 and SLC16A1-AS1 were inversely and significantly correlated across GBM tissues (Figure 2B), but not across non-tumor tissues (Figure 2C).
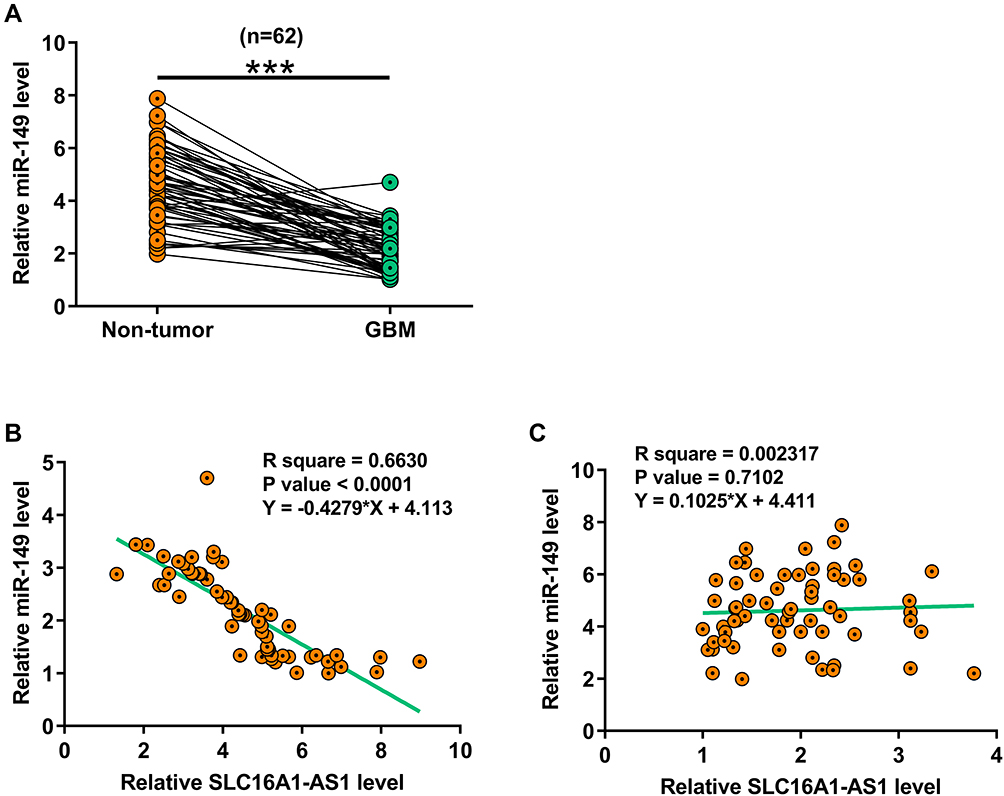 |
Figure 2 MiR-149 was downregulated in GBM and inversely correlated with SLC16A1-AS1. Expression of miR-149 in paired GBM and non-tumor tissues was also determined by RT-qPCR. Mean values of three technical replicates were presented and compared between paired tissues using paired t-test (A), ***p < 0.001. Correlations between levels of miR-149 and SLC16A1-AS1 expression across GBM tissues (B and C) were analyzed by linear regression. |
Overexpression of SLC16A1-AS1 Downregulated miR-149 Through Methylation in U87 and U-118 MG Cells
The close correlation between SLC16A1-AS1 and miR-149 across GBM tissues indicated the possible interaction between them. To explore the possible interaction between SLC16A1-AS1 and miR-149, U87 and U-118 MG cells were transfected with either SLC16A1-AS1 expression vector or miR-149 mimic. RT-qPCR was performed to confirm the overexpression of SLC16A1-AS1 and miR-149 in U87 and U-118 MG cells (Figure 3A, p < 0.05). Compared with the two controls, overexpression of SLC16A1-AS1 resulted in the downregulation of miR-149 (Figure 3B, p < 0.05), while overexpression of miR-149 did not affect the expression of SLC16A1-AS1 (Figure 3C). MSP was performed to analyze the effects of overexpression of SLC16A1-AS1 on the methylation of miR-149 gene. Compared with empty vector-transfected cells, overexpression of SLC16A1-AS1 increased methylation of miR-149 gene (Figure 3D). Based on the quantification analysis, BSP was performed to analyze the overall methylation status of miR-149 gene (12 CpG sites) in SLC16A1-AS1-overexpression cells and empty vector-transfected cells, the results showed the methylation levels were 58.3% and 23.3%, respectively (Figure 3E). Therefore, SLC16A1-AS1 was likely an upstream inhibitor of miR-149 in GBM.
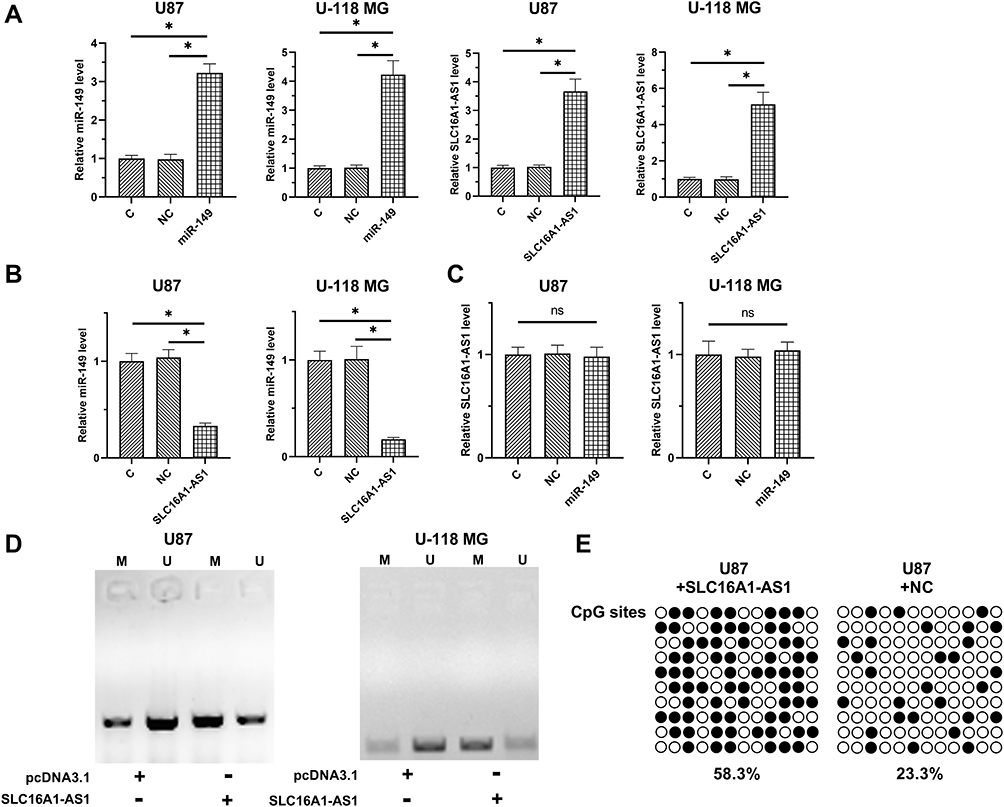 |
Figure 3 Overexpression of SLC16A1-AS1 downregulated miR-149 through methylation in U87 and U-118 MG cells. To explore the possible interaction between SLC16A1-AS1 and miR-149, U87 and U-118 MG cells were transfected with either SLC16A1-AS1 expression vector or miR-149 mimic. RT-qPCR was performed to confirm the overexpression of SLC16A1-AS1 and miR-149 in U87 and U-118 MG cells (A). The effects of SLC16A1-AS1 overexpression on miR-149 (B) and the effects of miR-149 overexpression on SLC16A1-AS1 (C) were also explored by RT-qPCR. MSP was performed to analyze the effects of SLC16A1-AS1 overexpression on the methylation of miR-149 gene (D). BSP was also performed in U87 cell lines to detect the overall methylation status of miR-149, the result showed SLC16A1-AS1 increase the methylation levels compared to control cell (58.3% versus 23.3%) (E). M, methylation; U, unmethylation; ○: CpG site unmethylation; ●: CpG site methylation; mean values were presented and compared, *p < 0.05. Abbreviation: ns, non-significance. |
SLC16A1-AS1 Reduced the Inhibitory Effects of miR-149 on Cell Proliferation
The proliferation of U87 and U-118 MG cells with SLC16A1-AS1 and/or the overexpression of miR-149 was assessed by CCK-8 assay. Increased proliferation of U87 cells was observed after the overexpression of SLC16A1-AS1, while overexpression of miR-149 resulted in decreased cell proliferation rate. Moreover, SLC16A1-AS1 reduced the inhibitory effects of miR-149 on GBM cell proliferation (Figure 4A and B, p < 0.05). However, to further confirm these effects of SLC16A1-AS1 and miR-149, we performed a colony formation assay, the results also showed overexpression of SLC16A1-AS1 could increase the tumor cell expansion, but this effect would be reversed by miR-149 (Figure 4C, p < 0.05), which implicated the similar results as well as CCK-8 assay.
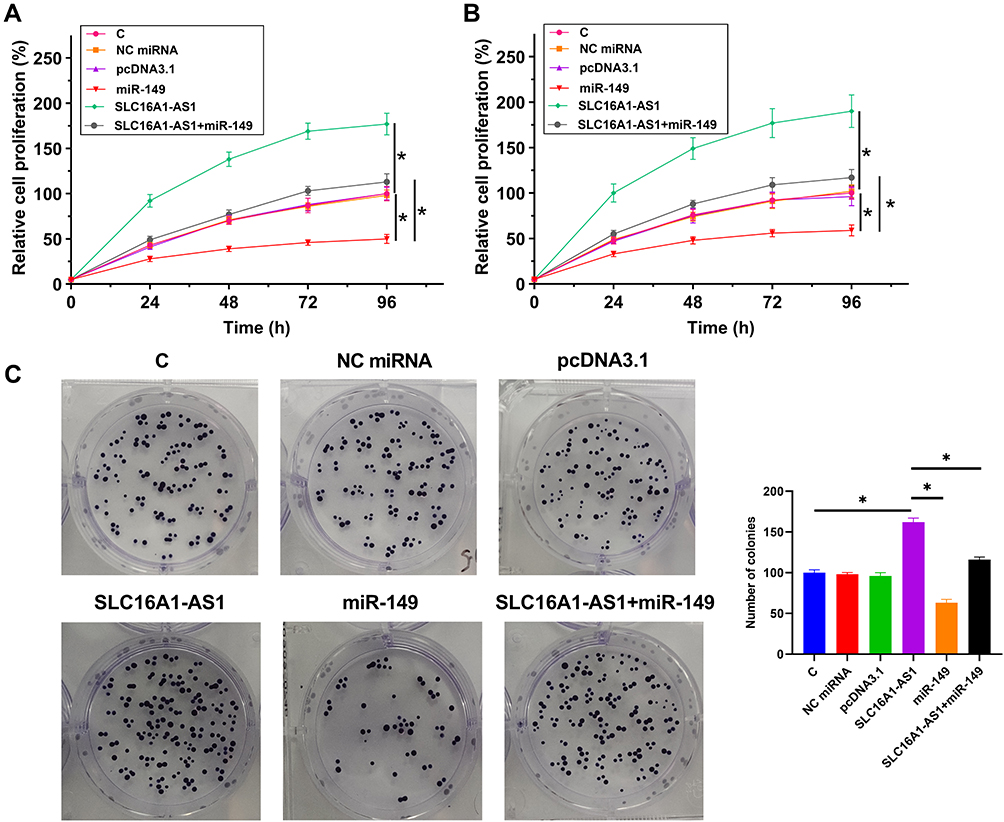 |
Figure 4 SLC16A1-AS1 reduced the inhibitory effects of miR-149 on U87 and U-118 MG cell proliferation. The proliferation of U87 (A) and U-118 MG (B) cells with overexpression of SLC16A1-AS1 and/or miR-149 was analyzed by CCK-8 assay. Cell proliferation was recorded every 24 h for a total of 96 h. Colony formation assay was also showed overexpression of SLC16A1-AS1 could increase the tumor cell expansion, but this effect would be reversed by miR-149 (C). Mean values of three replicates were presented and compared, *p < 0.05. |
Discussion
This study investigated the interaction between SLC16A1-AS1 and miR-149 in GBM. We found that SLC16A1-AS1 was overexpressed in GBM and its overexpression predicted the poor survival of GBM patients. Moreover, SLC16A1-AS1 might regulate miR-149 methylation to promote cell proliferation.
A recent study has characterized SLC16A1-AS1 as a tumor suppressor in NSCLC.23 It was observed that SLC16A1-AS1 was downregulated in NSCLC and might regulate the RAS/MEK/ERK pathway to suppress cell proliferation and induce cell cycle progression.23 In contrast, we observed the upregulation of SLC16A1-AS1 in GBM by exploring the TCGA dataset. The overexpression of SLC16A1-AS1 in GBM was confirmed by measuring its expression levels in GBM and paired non-tumor tissues. Moreover, we also observed an increased cell proliferation rate of GBM cells after the overexpression of SLC16A1-AS1. Therefore, SLC16A1-AS1 may play an oncogenic role in GBM by promoting cell proliferation. So, SLC16A1-AS1 may play different roles in different types of cancer.
The overall survival of GBM patients is extremely poor even after conventional treatment.5,6 Due to the lack of effective treatment approaches, the therapy outcome of GBM is unlikely to be significantly improved in the near future. Therefore, an accurate prognosis of GBM as an alternative approach may guide the determination of treatment strategies, thereby improving treatment outcomes. In this study, we showed that high expression levels of SLC16A1-AS1 were closely correlated with the poor survival of GBM patients. Therefore, measurement of the expression of SLC16A1-AS1 before therapy may provide useful information to predict the survival of GBM patients.
MiR-149 has been characterized as a tumor-suppressive miRNA in breast cancer.25 In this study, we showed that miR-149 plays a tumor-suppressive role in GBM cancer by suppressing cell proliferation. Consistently, one previous study also reported the inhibitory effects of miR-149 overexpression on GBM cell proliferation.26 However, based on our knowledge, the upstream regulator of miR-149 has not been well studied. In this study, we showed that SLC16A1-AS1 could downregulate miR-149 through methylation. Since there were many reasons for the silent expression of the target gene, DNA methylation was one of causes,33,34 so we hypothesize if methylation could be involved in this. In effect, miR-149 was also reported to be epigenetically silenced in GBM.29 Interestingly, we showed that SLC16A1-AS1 and miR-149 were only inversely correlated across GBM tissues, but not across non-tumor tissues, suggesting that the interaction between them may be mediated by certain pathological factors. It is worth noting that our preliminary dual-luciferase reporter assay revealed no significant differences in luciferase activity between cells transfected with SLC16A1-AS1 luciferase vector + miR-149 mimic and cells transfected with SLC16A1-AS1 luciferase vector + NC miRNA (Supplementary Figure 2), suggesting that SLC16A1-AS1 and miR-149 may not directly interaction with each other. Furthermore, a recent study reported that SLC16A1-AS1 might regulate the phosphorylation level of proteins involved in the RAS/RAF/MEK pathway to participate in lung cancer.23 Therefore, the interaction between SLC16A1-AS1 and RAS/RAF/MEK pathway may also exist in GBM. Our future studies will explore this possibility.
Conclusion
In conclusion, our study is the first to report that SLC16A1-AS1 is downregulated in GBM, and it may regulate miR-149 methylation to promote cell proliferation, the briefly schematic research model is shown in Figure 5. This study is the first to characterize an lncRNA as the upstream inhibitor of miR-149. In addition, the regulation of miR-149 methylation by SLC16A1-AS1 proposed in this study also enriched our understanding of the interactions between ncRNAs. Increased understanding of the functionality of SLC16A1-AS1 may provide novel targets for the treatment of GBM.
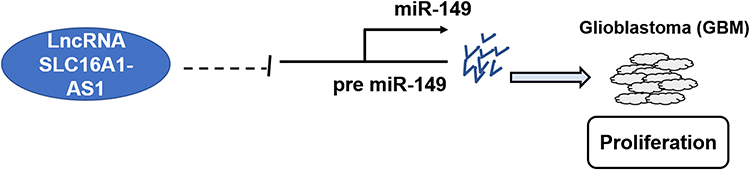 |
Figure 5 The schematic model of SLC16A1-AS1 by inhibiting miR-149 involved in the progression of GBM. |
Abbreviations
GBM, glioblastoma; lncRNAs, long non-coding RNAs; MSP, methylation-specific PCR; CCK-8, Cell Counting Kit 8.
Disclosure
The authors declare that they have no competing interests.
References
1. Alexander BM, Cloughesy TF. Adult Glioblastoma. J Clin Oncol. 2017;35(21):2402–2409. doi:10.1200/JCO.2017.73.0119
2. Chen X, Xu Z, Zeng S, et al. SIRT5 downregulation is associated with poor prognosis in glioblastoma. Cancer Biomark. 2019;24(4):449–459. doi:10.3233/CBM-182197
3. Chen X, Yan Y, Zhou J, et al. Clinical prognostic value of isocitrate dehydrogenase mutation, O-6-methylguanine-DNA methyltransferase promoter methylation, and 1p19q co-deletion in glioma patients. Ann Transl Med. 2019;7(20):541. doi:10.21037/atm.2019.09.126
4. Wu G, Yan Y, Zhou Y, et al. Expression and clinical significance of CPS1 in glioblastoma multiforme. Curr Res Transl Med. 2019;67(4):123–128. doi:10.1016/j.retram.2019.08.003
5. Soderberg-Naucler C, Rahbar A, Stragliotto G. Survival in patients with glioblastoma receiving valganciclovir. N Engl J Med. 2013;369(10):985–986. doi:10.1056/NEJMc1302145
6. Brown TJ, Brennan MC, Li M, et al. Association of the extent of resection with survival in glioblastoma: a systematic review and meta-analysis. JAMA Oncol. 2016;2(11):1460–1469. doi:10.1001/jamaoncol.2016.1373
7. Alifieris C, Trafalis DT. Glioblastoma multiforme: pathogenesis and treatment. Pharmacol Ther. 2015;152:63–82.
8. Dai S, Yan Y, Xu Z, et al. SCD1 confers temozolomide resistance to human glioma cells via the Akt/GSK3beta/beta-Catenin signaling axis. Front Pharmacol. 2017;8:960. doi:10.3389/fphar.2017.00960
9. Yan Y, Li Z, Zeng S, Wang X, Gong Z, Xu Z. FGFR2-mediated phosphorylation of PTEN at tyrosine 240 contributes to the radioresistance of glioma. J Cell Commun Signal. 2019;13(3):279–280. doi:10.1007/s12079-019-00518-6
10. Taylor MA, Das BC, Ray SK. Targeting autophagy for combating chemoresistance and radioresistance in glioblastoma. Apoptosis. 2018;23(11–12):563–575. doi:10.1007/s10495-018-1480-9
11. Sanna V, Pala N, Sechi M. Targeted therapy using nanotechnology: focus on cancer. Int J Nanomed. 2014;9:467–483. doi:10.2147/IJN.S36654
12. Touat M, Idbaih A, Sanson M, Ligon KL. Glioblastoma targeted therapy: updated approaches from recent biological insights. Ann Oncol. 2017;28(7):1457–1472.
13. Li X, Wu C, Chen N, et al. PI3K/Akt/mTOR signaling pathway and targeted therapy for glioblastoma. Oncotarget. 2016;7(22):33440–33450. doi:10.18632/oncotarget.7961
14. Ma Y, Cheng Z, Liu J, et al. Inhibition of farnesyltransferase potentiates NOTCH-targeted therapy against glioblastoma stem cells. Stem Cell Rep. 2017;9(6):1948–1960. doi:10.1016/j.stemcr.2017.10.028
15. Gutschner T, Diederichs S. The hallmarks of cancer: a long non-coding RNA point of view. RNA Biol. 2012;9(6):703–719. doi:10.4161/rna.20481
16. Reddy KB. MicroRNA (miRNA) in cancer. Cancer Cell Int. 2015;15:38. doi:10.1186/s12935-015-0185-1
17. Yan Y, Chen X, Wang X, et al. The effects and the mechanisms of autophagy on the cancer-associated fibroblasts in cancer. J Exp Clin Cancer Res. 2019;38(1):171. doi:10.1186/s13046-019-1172-5
18. Prensner JR, Chinnaiyan AM. The emergence of lncRNAs in cancer biology. Cancer Discov. 2011;1(5):391–407. doi:10.1158/2159-8290.CD-11-0209
19. Yan Y, Xu Z, Chen X, et al. Novel function of lncRNA ADAMTS9-AS2 in promoting temozolomide resistance in glioblastoma via upregulating the FUS/MDM2 ubiquitination axis. Front Cell Dev Biol. 2019;7:217. doi:10.3389/fcell.2019.00217
20. Peng Z, Liu C, Wu M. New insights into long noncoding RNAs and their roles in glioma. Mol Cancer. 2018;17.
21. Dang Y, Wei X, Xue L, Wen F, Gu J, Zheng H. Long non-coding RNA in glioma: target miRNA and signaling pathways. Clin Lab. 2018;64:887–894. doi:10.7754/Clin.Lab.2018.180107
22. Li J, Liang R, Song C, Xiang Y, Liu Y. Prognostic and clinicopathological significance of long non-coding RNA in glioma. Neurosurg Rev. 2018;43:43. doi:10.1007/s10143-018-0965-x
23. Liu HY, Lu SR, Guo ZH, et al. lncRNA SLC16A1-AS1 as a novel prognostic biomarker in non-small cell lung cancer. J Investig Med. 2020;68(1):52–59. doi:10.1136/jim-2019-001080
24. Tang Z, Li C, Kang B, Gao G, Li C, Zhang Z. GEPIA: a web server for cancer and normal gene expression profiling and interactive analyses. Nucleic Acids Res. 2017;45(W1):W98–W102. doi:10.1093/nar/gkx247
25. Sanchez-Gonzalez I, Bobien A, Molnar C, et al. miR-149 suppresses breast cancer metastasis by blocking paracrine interactions with macrophages. Cancer Res. 2020;80(6):1330–1341. doi:10.1158/0008-5472.CAN-19-1934
26. Pan SJ, Zhan SK, Pei BG, Sun QF, Bian LG, Sun BM. MicroRNA-149 inhibits proliferation and invasion of glioma cells via blockade of AKT1 signaling. Int J Immunopathol Pharmacol. 2012;25(4):871–881. doi:10.1177/039463201202500405
27. She X, Yu Z, Cui Y, et al. miR-128 and miR-149 enhance the chemosensitivity of temozolomide by Rap1B-mediated cytoskeletal remodeling in glioblastoma. Oncol Rep. 2014;32(3):957–964. doi:10.3892/or.2014.3318
28. Xue L, Wang Y, Yue S, Zhang J. Low MiR-149 expression is associated with unfavorable prognosis and enhanced Akt/mTOR signaling in glioma. Int J Clin Exp Pathol. 2015;8:11178–11184.
29. Ghasemi A, Fallah S, Ansari M. MicroRNA-149 is epigenetically silenced tumor-suppressive microRNA, involved in cell proliferation and downregulation of AKT1 and cyclin D1 in human glioblastoma multiforme. Biochem Cell Biol. 2016;94:1–8. doi:10.1139/bcb-2015-0064
30. Kiss T, Giles CB, Tarantini S, et al. Nicotinamide mononucleotide (NMN) supplementation promotes anti-aging miRNA expression profile in the aorta of aged mice, predicting epigenetic rejuvenation and anti-atherogenic effects. Geroscience. 2019;41(4):419–439. doi:10.1007/s11357-019-00095-x
31. Braun DJ, Bachstetter AD, Sudduth TL, Wilcock DM, Watterson DM, Van Eldik LJ. Genetic knockout of myosin light chain kinase (MLCK210) prevents cerebral microhemorrhages and attenuates neuroinflammation in a mouse model of vascular cognitive impairment and dementia. Geroscience. 2019;41(5):671–679. doi:10.1007/s11357-019-00072-4
32. Matyi S, Jackson J, Garrett K, Deepa SS, Unnikrishnan A. The effect of different levels of dietary restriction on glucose homeostasis and metabolic memory. Geroscience. 2018;40(2):139–149. doi:10.1007/s11357-018-0011-5
33. Masser DR, Hadad N, Porter H, et al. Analysis of DNA modifications in aging research. Geroscience. 2018;40(1):11–29. doi:10.1007/s11357-018-0005-3
34. Kim S, Wyckoff J, Morris AT, et al. DNA methylation associated with healthy aging of elderly twins. Geroscience. 2018;40(5–6):469–484. doi:10.1007/s11357-018-0040-0
 © 2021 The Author(s). This work is published and licensed by Dove Medical Press Limited. The full terms of this license are available at https://www.dovepress.com/terms.php and incorporate the Creative Commons Attribution - Non Commercial (unported, v3.0) License.
By accessing the work you hereby accept the Terms. Non-commercial uses of the work are permitted without any further permission from Dove Medical Press Limited, provided the work is properly attributed. For permission for commercial use of this work, please see paragraphs 4.2 and 5 of our Terms.
© 2021 The Author(s). This work is published and licensed by Dove Medical Press Limited. The full terms of this license are available at https://www.dovepress.com/terms.php and incorporate the Creative Commons Attribution - Non Commercial (unported, v3.0) License.
By accessing the work you hereby accept the Terms. Non-commercial uses of the work are permitted without any further permission from Dove Medical Press Limited, provided the work is properly attributed. For permission for commercial use of this work, please see paragraphs 4.2 and 5 of our Terms.