")
Back to Journals » Cancer Management and Research » Volume 12
LncRNA PVT1 Regulates TRPS1 Expression in Breast Cancer by Sponging miR-543
Authors Wang H, Huang Y, Yang Y
Received 28 May 2020
Accepted for publication 13 August 2020
Published 4 September 2020 Volume 2020:12 Pages 7993—8004
DOI https://doi.org/10.2147/CMAR.S263383
Checked for plagiarism Yes
Review by Single anonymous peer review
Peer reviewer comments 2
Editor who approved publication: Dr Sanjeev K. Srivastava
Hongtao Wang,1,* Yuanli Huang,2,* Yuanrong Yang1
1Department of Pharmacy, The Second Clinical Medical College, Yangtze University, Jingzhou 434020, People’s Republic of China; 2Department of Galactophore, The Second Clinical Medical College, Yangtze University, Jingzhou 434020, People’s Republic of China
*These authors contributed equally to this work.
Correspondence: Yuanrong Yang Email [email protected]
Background: Breast cancer is the most common female malignancy with high invasion and metastasis abilities. Studies have shown that long non-coding RNA (lncRNA) plasmacytoma variant translocation 1 gene (PVT1) is an oncogene and is positively correlated with progression and metastasis of breast tumors. However, the detailed mechanism of PVT1 in breast cancer tumorigenesis is not fully understood.
Methods: Real-time polymerase quantitative chain reaction (RT-qPCR) was performed to identify the expression levels of PVT1, miR-543 and trichorhinophalangeal syndrome-1 gene (TRPS1) in breast cancer tissues and cells. Cell proliferation was measured by plate clone formation and 3-(4,5-dimethylthiazol-2-yl)-2,5-diphenyl-2H-tetrazol-3-ium bromide (MTT) assay. Apoptosis and motility of MCF-7 and MDA-MB-436 cells were assessed with flow cytometry assay and transwell migration and invasion analyses, respectively. In addition, a model was established to probe the function of PVT1 silencing in vivo. The target relationship among PVT1, miR-543 or TRPS1 was confirmed by dual-luciferase reporter analysis, RNA immunoprecipitation (RIP) and RNA pull down assays. The protein expression level of TRPS1 was evaluated with Western blot assay.
Results: PVT1 expression was upregulated in breast cancer tissues and cell lines. In addition, PVT1 silencing inhibited breast cancer cell growth and motility, while increased apoptosis. Meanwhile, the effects of PVT1 or miR-543 could be reversed by introducing overexpressed plasmid of miR-543 or TRPS1 in breast cancer cell lines, respectively.
Conclusion: Knockdown of PVT1 repressed breast cancer cell growth and motility, and induced apoptosis in vitro and reduced tumor volume and weight in vivo. Mechanically, the overexpression of PVT1 enhanced TRPS1 level by negatively targeted miR-543 in breast cancer.
Keywords: LncRNA PVT1, miR-543, TRPS1, breast cancer
Introduction
The mortality rate of breast cancer remains high in women worldwide.1 Breast cancer had the proportion of 15% of all new cancers and that was the second major reason for cancer mortality in women with a notable increase tendency of incidence.2,3 The increasing studies focused on treating breast cancer to find novel therapeutic targets, non-coding RNA was dysregulated and involved in the pathogenesis and development of breast cancer via regulating multiple mechanisms.4
Long non-coding RNA (lncRNA) was RNA molecule more than 200 nucleotides in length, which could not translate into proteins due to lacking extended open reading frames.5,6 A series of studies displayed that lncRNA took part in tumorigenesis and anomalous expression in breast cancer.7,8 The exact role of lncRNA in human disease was to function as ‘sponge’ to imbibe target miRNA and reduce affluence of miRNAs. For example, lncRNA HOX transcript antisense RNA (HOTAIR) could interact with Polycomb Repressive Complex 2 to lead to histone H3 lysine 27 trimethylation and impede expression of metastasis suppressor genes, thereby resulted in enhanced migration capability of breast cancer.7 Besides, long noncoding RNA-activated by transforming growth factor β (lncRNA-ATB) increased the expression of E-cadherin transcriptional repressors zinc-finger E-box binding homeobox 1 (ZEB1) and Kruppel-like transcription factor zinc finger protein (ZNF217), which were epithelial–mesenchymal transition linked transcription factors, by competitively binding with miR-200c to enhance trastuzumab resistance and invasion ability of breast cancer.9 Moreover, the precise function and mechanism of lncRNA plasmacytoma variant translocation 1 gene (PVT1) in the process of breast cancer remained unknown, so further exploration study was needed to clarify possible roles and mechanisms of lncRNA PVT1 in breast cancer.
Moreover, Bing et al results showed that miR-543 functioned as a tumor inhibitor in endometrial cancer by targeting focal adhesion kinase and twist homolog 1 (TWIST1).10 Analogously, Fan et al reported that miR-543 had critical role in the development of colorectal cancer and repressed the proliferation and metastasis of colorectal cancer cells.11 Overexpression of miR-543 significantly suppressed levels of TWIST1 and epithelial to mesenchymal transition (EMT)-linked transcription factors, which indicated that miR-543 was considered as a tumor suppressor in breast cancer.12
However, none of the previous studies explored the mechanism of lncRNA PVT1 in modulating miR-543 expression. In the current study, we focused on elucidating roles of PVT1 and miR-543 and confirming whether there was direct interaction between PVT1 and miR-543, and how they were involved in the progression of breast cancer cell lines.
Materials and Methods
Clinical Samples
A total of 30 breast cancer tissues and the adjacent non-cancer tissues were collected from patients admitted to the Second clinical Medical College, Yangtze University and stored at −80°C for extraction of RNA and protein. In addition, all of participants wrote informed consents before surgery. The present study gained endorsement from the Ethics Committee of the Second clinical Medical College, Yangtze University. (IRB No. 2019JZ112)
Cells Culture and Transfection
MCF-10A, MCF-7 and MDA-MB-231 were obtained from American Type Culture Collection (Rockville, MD, USA) and cultured in RPMI1640 (GIBCO BRL, Grand Island, NY, USA) supplemented with 10% fetal bovine serum (FBS; GIBCO BRL). MDA-MB-436 (American Type Culture Collection) were maintained in Dulbecco’s modified Eagle’s medium (DMEM; GIBCO BRL) supplemented with 10% FBS (GIBCO BRL) and 1% penicillin (GIBCO BRL). Both cell lines cultured in at 37°C with 5% CO2.
Specific short hairpin RNA (shRNA) against PVT1 (sh-PVT1) and its negative control sh-NC, overexpressed plasmid of PVT1 (pcDNA3.1/PVT1) and its negative control pcDNA3.1, miR-543 mimic (miR-543) and its negative control miR-NC, overexpressed plasmid of trichorhinophalangeal syndrome-1 gene (TRPS1) and its negative control Vector were purchased from RiboBio (Guangzhou, China). MCF-7 and MDA-MB-436 cells were placed onto 6-well plates and were injected with above oligonucleotides and vectors with Lipofectamine 2000 reagent (Thermo Fisher Scientific, Waltham, MA, USA) referring to manufacturer’s instructions. Finally, the expression level of RNA was evaluated using RT-qPCR analysis.
Real-Time Polymerase Chain Reaction (RT-qPCR)
The RNA from tissues and cells was extracted with TRIzol reagent (RiboBio, Guangzhou, China). The complementary DNA was synthesized using random primers and an M-MLV Reverse Transcriptase kit (Toyobo, Osaka, Japan). RT-qPCR was performed to examine RNA level using SYBR Green PCR Kit (Thermo Fisher Scientific) on Applied Biosystems 7300 system (Applied Biosystems, Foster City, CA, USA). Glyceraldehyde-3-phosphate dehydrogenase (GAPDH) and endogenous small nuclear RNA U6 were used as references for lncRNA/mRNA and miRNA, respectively. The 2−ΔΔCt method was carried out to calculate gene expression levels of PVT1, miR-543 and TRPS1. The primers were listed: PVT1 (Forward, 5ʹ-CATCCGGCGCTCAGCT-3ʹ; Reverse, 5ʹ-TCATGATGGCTGTATGTGCCA-3ʹ); miR-543 (Forward, 5ʹ-CCAGCTACACTGGGCAGCAGCAATTCATGTTT-3ʹ; Reverse, 5ʹ-CTCAACTGGTGTCGTGGA-3ʹ); TRPS1 (Forward, 5ʹ-GTATCCTGCATCGGGAGAAA-3ʹ; Reverse, 5ʹ-AGCTTC TGGTAGAGGCCACA-3ʹ); GAPDH (Forward, 5ʹ-TCCCATCACCATCTTCCAGG-3ʹ; Reverse, 5ʹ- GATGACCCTTTTGGCTCCC-3ʹ); U6 (Forward, 5ʹ-CTCGCTTCGGCAGCACATATACT-3ʹ; Reverse, 5ʹ- ACGCTTCACGAATTTGCGTGTC-3ʹ).
3-(4,5-Dimethylthiazol-2-Yl)-2,5-Diphenyl-2H-Tetrazol-3-Ium Bromide (MTT) Assay
The cells (4×10³ cells/well) were seeded in 96‑well plates and MTT (5 mg/mL) was added to each well and incubated at 37°C for another 4 h. Subsequently, the MTT solution was removed and dimethyl sulfoxide solution was added into the each well for 10 min. The absorbance was examined using a multi‑well plate reader (Applied Biosystems) at 450 nm.
Colony Forming Assay
To probe the effects of sh-PVT1 on colon cell proliferation in vitro, MCF-7 cells and MDA-MB-436 cells were transfected with sh-NC or sh-PVT1 and cultured overnight in the plate with medium supplemented with 10% FBS at 37°C in a humidified atmosphere with 5% CO2. The number of cells was counted after 2 weeks.
Flow Cytometry Analysis
Cell apoptosis analysis was conducted with propidium iodide and Annexin V-fluorescein isothiocyanate (Beijing Biosea Biotechnology, Beijing, China). Briefly, 2×10⁵ cells were seeded into 6-well plates for 24 h. Cells were collected and washed with phosphate buffer saline, then stained cells with propidium iodide-staining solution and Annexin V-fluorescein isothiocyanate. After 30 min, cell fluorescence was examined with a FACS Calibur flow cytometer (Beckman Coulter, Fullerton, CA, USA).
Cell Migration and Invasion Assays
For invasion assay, the 6-well culture plates inserted with 8-μm pore membranes were coated with Matrigel (Invitrogen, Carlsbad, CA, USA). Briefly, 1.5× 10⁴/mL cells suspension without FBS medium was seeded to the upper chamber. After 24 h, non-invading cells on the upper surface of the membrane were removed with a cotton swab, while invading cells on lower side of the chamber were fixed and stained for further observation and count. In addition, in migration assay, the upper chamber was without Matrigel, other steps were consisted with invasion assay.
Xenograft Experiment
The animal experiment was licensed by the Institutional Animal Care and Use Committee of Second clinical Medical College, Yangtze University. Animal studies were performed in compliance with the ARRIVE guidelines and the Basel Declaration. All animals received humane care according to the National Institutes of Health (USA) guidelines. Six-week-old BALB/c nude mice supplied from Harlan Teklad (Houston, TX, USA) and divided into 2 groups corresponding to sh-PVT1-treated (5×10⁴/mL MCF-7 transfected with sh-PVT1) and sh-NC-treated (5×10⁴/mL MCF-7 transfected with sh-NC). MCF-7 cells were subcutaneously injected the right back of the nude mice. Tumor growth was monitored every 5 d, volume was calculated according to the formula: V = 1/2× ab2 method (maximum (a) and minimum (b) length of the tumor). At 30 d post-injection, the mice were sacrificed for tumor weight analysis.
Dual-Luciferase Reporter Assay
Reporter plasmids containing fragments of PVT1 or 3ʹUTR TRPS1 were co-transfected with miR-543 mimic or miR-NC into breast cancer cell lines using Lipofectamine 2000 (Thermo Fisher Scientific). Firefly and Renilla activities were measured with the Dual-Luciferase Reporter Assay System.
RNA Immunoprecipitation (RIP) and RNA Pull Down Assays
RIP was conducted with the EZ-Magna RIP kit (Millipore, Belfor, MA, USA). Firstly, MCF-7 cells and MDA-MB-436 cells were collected from tissue culture plate, then lysed in RIP lysis buffer. The cell extract was incubated with RIP buffer containing anti-Ago2 antibody (Abcam, Cambridge, MA, USA) or IgG (Abcam) at 4°C for 4 h. After protein was washed with washing buffer and digested with proteinase K for 15 min, immunoprecipitated RNA was analyzed by RT-qPCR.
For the RNA pull down assay, miR-543 was biotin-labeled with the Biotin RNA Labeling Mix (Millipore). NC-Bio, miR-543-Bio and miR-543-Mut-Bio were mixed and incubated with MCF-7 or MDA-MB-436 cell lysates to form biotin-miRNA-lncRNA complexes. Magnetic beads were added and incubated at room temperature. Analogously, RNA was purified for RT-qPCR assay.
Western Blot Assay
The breast cancer tissues and cell lines were lysed with RIPA buffer (Solarbio, Beijing, China) at 4°C for 15 min, the BCA Protein Assay Kit (Solarbio) was used to detect protein concentration in supernatant of lysates. The equal protein was separated in sodium dodecyl sulfate polyacrylamide gel electrophoresis (SDS-PAGE) and transferred to polyvinylidene difluoride membranes (Millipore). The primary antibodies against TRPS1 (1:1000 dilution; Millipore) and GAPDH (1:1000 dilution; Millipore) were employed to examine TRPS1 expression in Western blot. Then, the horseradish peroxidase-conjugated goat anti-mouse secondary antibody was added for incubation at 37°C for 2h. The immunoreactive band of target protein was visualized with an enhanced chemiluminescence method and analyzed with GAPDH as an internal reference.
Statistical Analysis
The statistical significance of the differences in two groups or among multiple groups was assessed using the Student’s t-test or one-way analysis with SPSS 18.0 software (IBM Corporation, Somers, NY, USA). All data analysis was shown as mean ± standard deviation. Results were considered to be statistically significant if P < 0.05.
Results
PVT1 Was Upregulated in Breast Cancer Tissues and Cells
The expression level of PVT1 in 30 breast cancer tissues and adjacent normal tissues was assessed by RT-qPCR. As present in Figure 1A, the expression of PVT1 was significantly higher in breast cancer tissues when compared with the normal tissues. Correspondingly, RT-qPCR results also implied that the expression level of PVT1 was higher in breast cancer cell lines, including MCF-7, MDA-MB-436, and MDA-MB-231, than that in Human normal mammary epithelial cells (MCF-10A), additionally, the lowest expression of PVT1 was observed in the MCF-10A, while the highest PVT1 level was observed in the MCF-7 cells (Figure 1B). These results suggested that PVT1 was highly expressed in breast cancer.
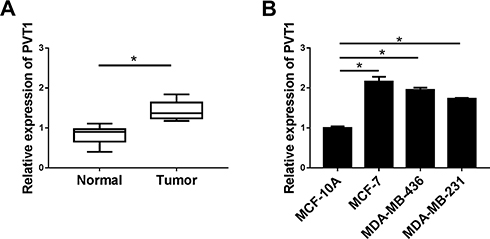 |
Figure 1 The expression level of PVT1 in breast cancer tissues and cells. (A and B) Relative expression level of PVT1 in breast cancer tissues (n=30) and normal tissues (n=30) as well as in MCF-10A, MCF-7, MDA-MB-436, and MDA-MB-231 cells was analyzed with RT-qPCR assay. *P < 0.05. |
PVT1 Silencing Suppressed Growth, Motility and Enhanced Apoptosis of Breast Cancer Cells
To further probe the effects of PVT1 knockdown on proliferation, migration, invasion and apoptosis of breast cancer cells. MCF-7 and MDA-MB-436 cells were transfected with sh-NC or sh-PVT1. As evidenced from Figure 2A, expression level of PVT1 in MCF-7 and MDA-MB-436 cells transfected with sh-PVT1 was obviously lower than that in the control group. We can conclude that sh-PVT1 successfully downregulated PVT1 expression in MCF-7 and MDA-MB-436 cells. Then, cell capability of proliferation was measured with MTT and colony formation assay. PVT1 silencing dramatically reduced viability of MCF-7 and MDA-MB-436 cells, at the same time, colony formation ability was significantly inhibited in MCF-7 and MDA-MB-436 cells by introducing with sh-PVT1 (Figure 2B and C). Next, apoptosis of MCF-7 and MDA-MB-436 cells was examined by Annexin V-FITC/PI flow cytometric analysis and implied that PVT1 silencing remarkably increased the apoptosis rate (Figure 2D). In addition, cell viabilities of migration and invasion in both MCF-7 and MDA-MB-436 cells were effectively impeded by suppression of PVT1 (Figure 2E and F). To detect whether PVT1 affected tumor development in vivo, the nude mice were subcutaneously injected with MCF-7 cells transfected with sh-PVT1 or sh-NC. We found that knockdown of PVT1 greatly inhibited tumor development in vivo compared to control sh-NC, moreover, tumor weight was also notably suppressed by sh-PVT1 (Figure 2G and H). Collectively, these data indicated that downregulation of PVT1 improved cell apoptosis and decreased growth and motility of breast cancer cells.
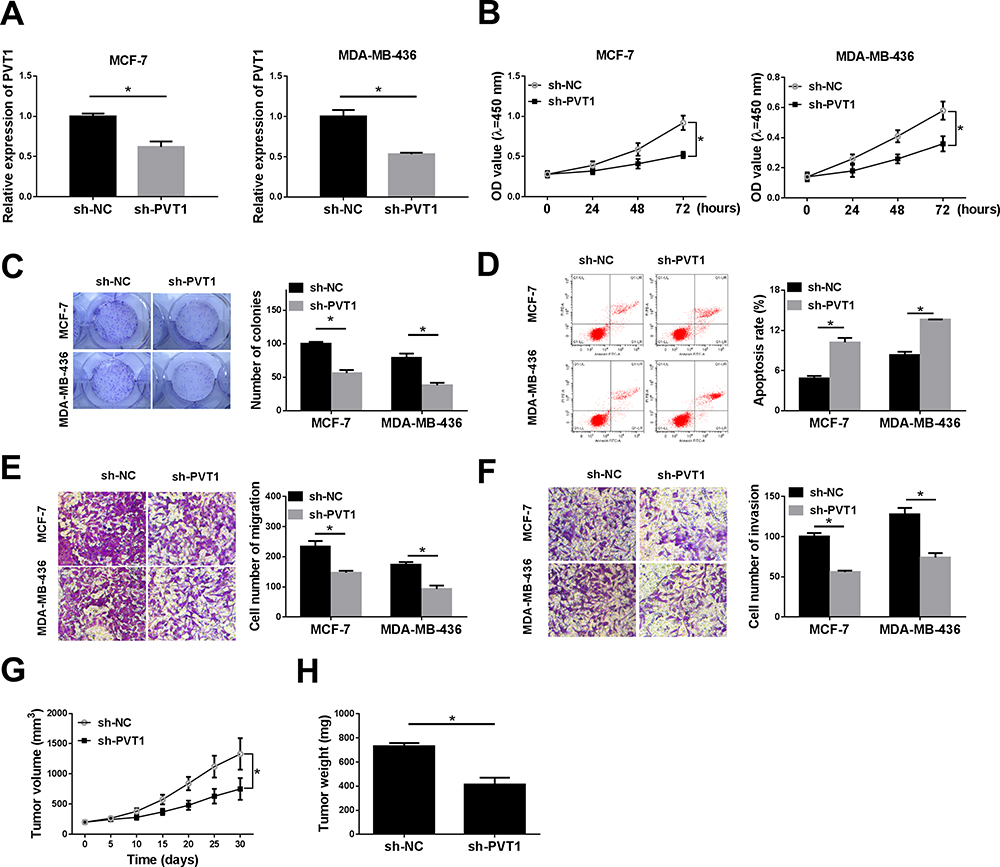 |
Figure 2 Knockdown of PVT1 inhibited growth, motility but promoted apoptosis of breast cancer cells. MCF-7 and MDA-MB-436 cells transfected with sh-NC or sh-PVT1. (A) The RT-qPCR assay was used to measure the expression level of PVT1 in MCF-7 cells and MDA-MB-436 cells. (B) Cell vitality was assessed by MTT assay at the specified time. (C) The capability of clone formation was analyzed in MCF-7 and MDA-MB-436 cells. (D) The apoptosis of breast cancer cell lines (MCF-7 and MDA-MB-436 cells) was examined by Annexin V-FITC/PI flow cytometric analysis. (E and F) Transwell migration and invasion analyses of MCF-7 and MDA-MB-436 cells were shown. (G and H) The tumor volume at different days after injection of tumor cells and weight at the endpoints were shown. *P < 0.05. |
MiR-543 Was a Target of PVT1 in Breast Cancer Cells
Online bioinformatics prediction software starBase v2.0 (http://starbase.sysu.edu.cn/starbase2/) was used to predict the downstream target gene of PVT1. The complementary binding sites between miR-543 and PVT1 were shown in Figure 3A, MCF-7 and MDA-MB-436 cells were used for experiments. The results of dual-luciferase reporter assay indicated that the miR-543 significantly repressed the luciferase activity of PVT1-wt, but no obvious change on the luciferase activity was found in PVT1-mut (Figure 3B). Moreover, knockdown of PVT1 reinforced expression level of miR-543 in MCF-7 and MDA-MB-436 cells (Figure 3C). Based on miR-543 was a target of PVT1 in breast cancer cell lines, we also evaluated the expression level of miR-543 in breast cancer tissues and cell lines, RT-qPCR results showed that miR-543 was upregulated in breast cancer tissues and cell lines (Figure 3D and E). Besides, as shown in Figure 3F and G, PVT1 can serve as a sponge RNA for miR-543, RIP assay suggested PVT1 or miR-543 was more plentiful in anti-Ago2 pellet than that in control anti-IgG pellet. Additionally, RNA pull down assay was used to evaluate level of PVT1 in biotinylated miR-543 group, biotinylated miR-543-mut group and biotinylated negative control group in MCF-7 and MDA-MB-436 cell lysates. We found that PVT1 level was higher in biotinylated miR-543 group than in control (NC-bio) or in biotinylated miR-543-mut group. Furthermore, our results manifested that negative correlation between PVT1 and miR-543 in breast cancer tissues (Figure 3H). All data demonstrated that miR-543 was a direct target gene of PVT1 in breast cancer cells.
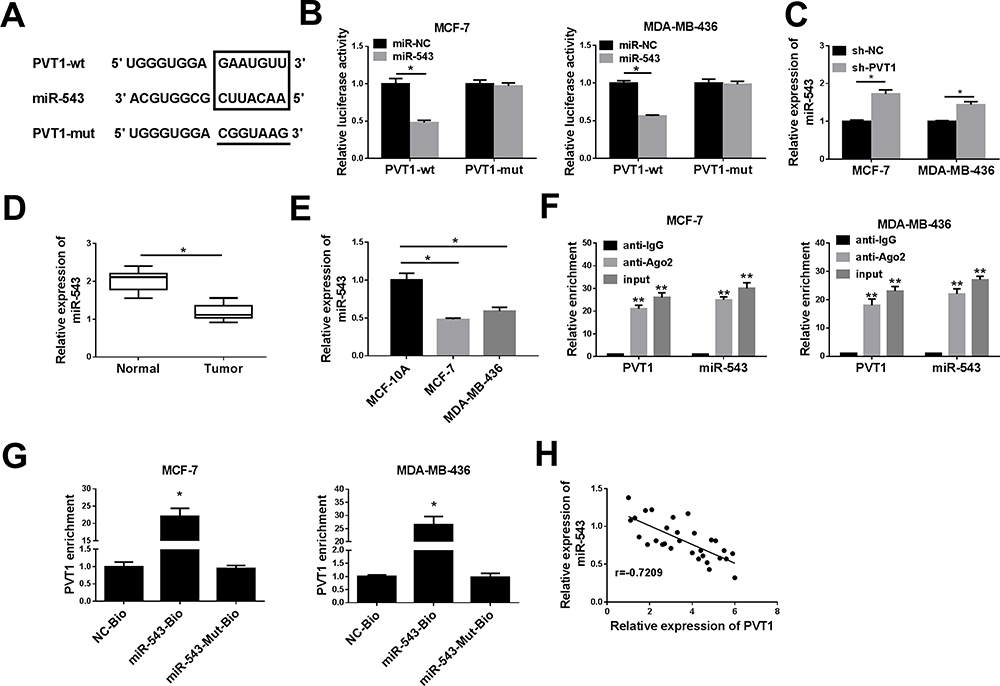 |
Figure 3 PVT1 negatively targeted miR-543 expression in breast cancer cells. (A) The predictive miR-543 binding sites on PVT1 and the corresponding mutant binding sites were shown. (B) Relative luciferase activity was analyzed in MCF-7 and MDA-MB-436 cells co-transfected PVT1-wt or PVT1-wut with miR-543 mimic or miR-NC. (C) RT-qPCR was carried out to evaluate expression level of miR-543 in MCF-7 and MDA-MB-436 cells transfected with sh-NC or sh-PVT1. (D and E) The expression level of miR-543 was assessed in breast cancer tissues and cell lines with RT-qPCR assay. (F) The RIP assay was conducted to test levels of miR-543 and PVT1 in the samples bound to the Ago2 antibody or IgG in MCF-7 and MDA-MB-436 cells. (G) Detection of PVT1 expression level using RT-qPCR in samples pulled down by biotinylated miR-543, biotinylated miR-543-Mut, or biotinylated negative control. (H) The correlation between PVT1 and miR-543 in breast cancer tissues was analyzed. *P < 0.05, **P < 0.01. |
The Effects of PVT1 Overexpression on Proliferation, Apoptosis and Motility in Breast Cancer Cells Could Be Abolished by Elevating miR-543
As present in Figure 4A, RT-qPCR results were employed to determine expression level of miR-543 in MCF-7 and MDA-MB-436 cells transfected with miR-NC or miR-543, and an obvious promotion of miR-543 expression was observed in MCF-7 and MDA-MB-436 cells transfected with miR-543. In order to explore the role of miR-543 in breast cancer, MCF-7 and MDA-MB-436 cells were transfected with pcDNA3.1, pcDNA3.1/PVT1, pcDNA3.1/PVT1+miR-NC or pcDNA3.1/PVT1+miR-543. The capabilities of proliferation and forming macroscopic colonies were effectively increased in MCF-7 and MDA-MB-436 cells transfected with pcDNA3.1/PVT1, but overexpression of miR-543 could effectively block the enhancement effect (Figure 4B and C). In addition, as shown in Figure 4D, compared with the pcDNA3.1 group, MCF-7 and MDA-MB-436 cells transfected with pcDNA3.1/PVT1 repressed cell apoptosis; however, MCF-7 and MDA-MB-436 cells transfected with pcDNA3.1/PVT1+miR-543 triggered the opposite results. The migration and invasion abilities of MCF-7 and MDA-MB-436 cells were measured by transwell assay. Results suggested that the high migration and invasion rates induced by PVT1 overexpression could be weakened in MCF-7 and MDA-MB-436 cells by enhancement of miR-543 (Figure 4E and F). Overall, upregulation of miR-543 reversed effects of PVT1 overexpression on proliferation, apoptosis and motility of breast cancer cells.
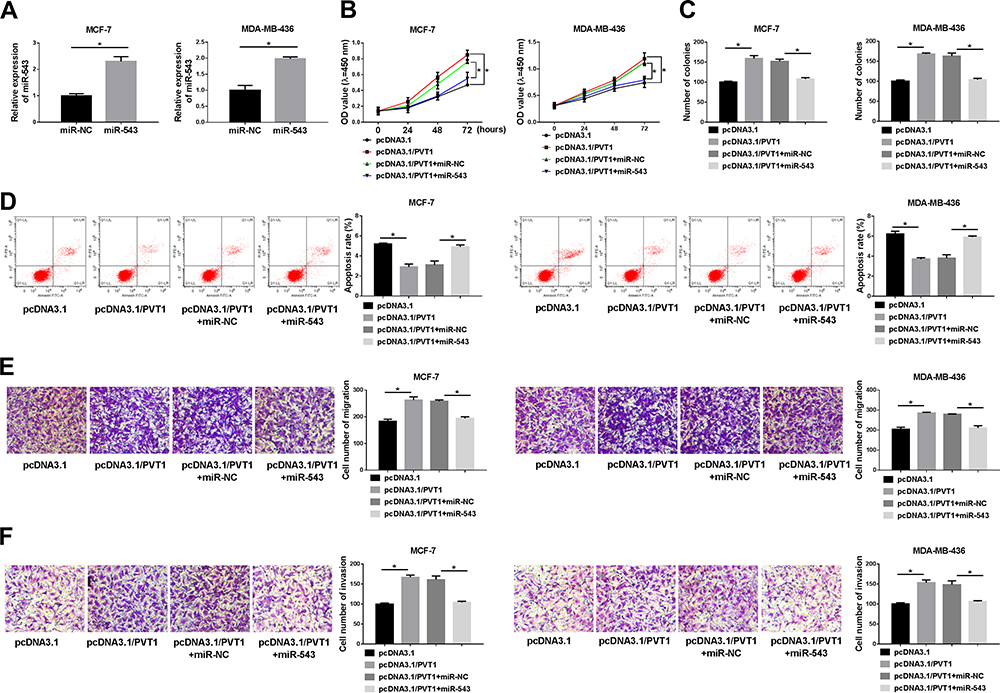 |
Figure 4 Overexpression of miR-543 reversed effects of upregulated PVT1 on proliferation, apoptosis and motility in breast cancer cells. (A) The expression level of miR-543 was evaluated in MCF-7 and MDA-MB-436 cells transfected with miR-NC or miR-543. MCF-7 and MDA-MB-436 cells transfected with pcDNA3.1, pcDNA3.1/PVT1, pcDNA3.1/PVT1+miR-NC or pcDNA3.1/PVT1+miR-543. (B and C) The capabilities of proliferation and forming macroscopic colonies in transfected MCF-7 and MDA-MB-436 cells were examined with MTT and plate clone formation assay, respectively. (D) Flow cytometry was used to measure apoptosis of MCF-7 and MDA-MB-436 cells. (E and F) Transwell migration and invasion analyses were conducted to assess motility of MCF-7 and MDA-MB-436 cells. *P < 0.05. |
MiR-543 Negatively Targeted TRPS1 in Breast Cancer Cells
The putative binding sites in TRPS1 for miR-543 were depicted with TargetScan (www.targetscan.org) in Figure 5A. The luciferase reporter assay was carried out to determine predicted results and presented that overexpression of miR-543 apparently decreased the luciferase activity of TRPS1 wild-type, while miR-NC impeded luciferase activity loss in MCF-7 and MDA-MB-436 cells (Figure 5B). To clarify the underlying role of TRPS1 in breast cancer, the expression of TRPS1 was detected with RT-qPCR and Western blot assays in breast cancer tissues and cell lines. Our results implied that mRNA and protein expression of TRPS1 were higher in breast cancer tissues than adjacent normal tissues (Figure 5C and D). Analogously, TRPS1 was also upregulated in MCF-7 and MDA-MB-436 cells than the normal epithelial cell lines MCF-10A (Figure 5E and F). To further probe whether miR-543 regulated TRPS1 expression in MCF-7 and MDA-MB-436 cells, we measured level of TRPS1 in breast cancer cells transfected with miR-543 and confirmed that enhancing expression of miR-543 decreased mRNA and protein levels of TRPS1 (Figure 5G and H). These data manifested that miR-543 regulated the expression of TRPS1 via binding to its 3ʹUTR.
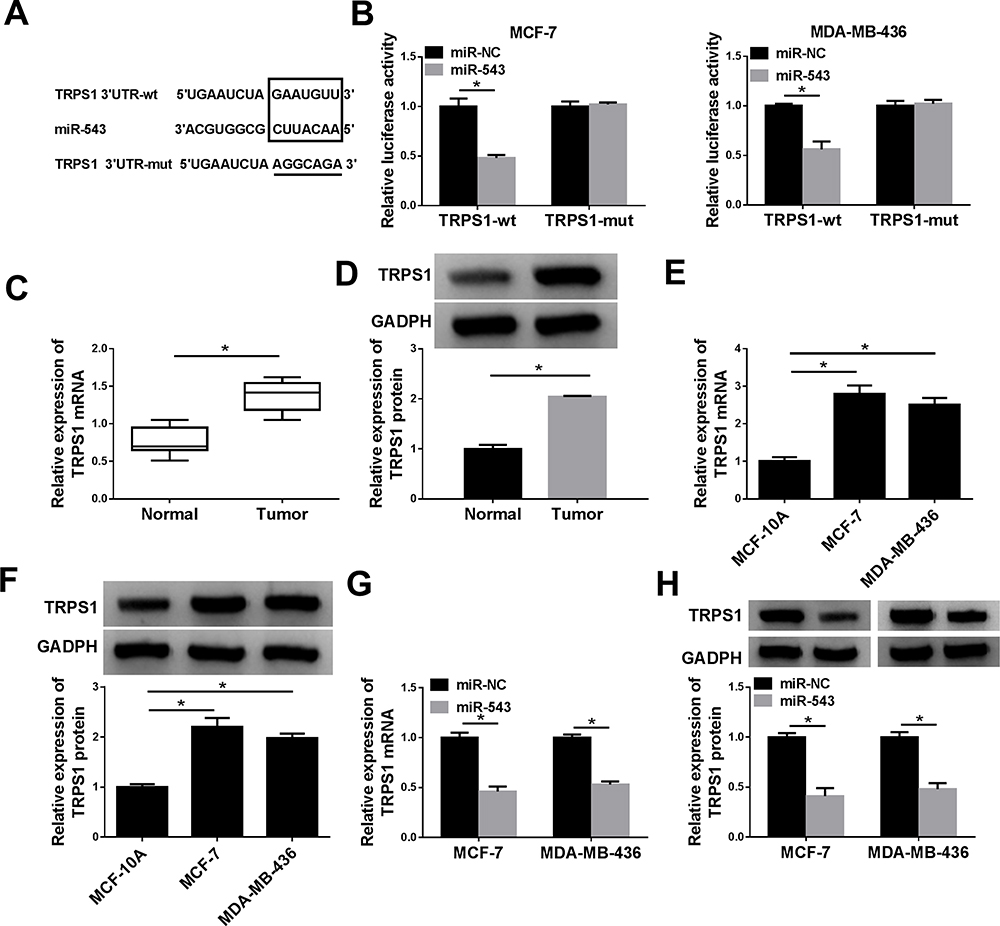 |
Figure 5 TRPS1 was a target of miR-543. (A) Bioinformatics software predicted putative binding sites of TRPS1 and miR-543. (B) The luciferase activity was measured in MCF-7 and MDA-MB-436 cells co-transfected with luciferase reporter plasmids (TRPS1-wt or TRPS1-mut) and miR-543 or miR-NC by dual-luciferase reporter assay. (C–F) The mRNA and protein expression levels of TRPS1 were detected with RT-qPCR and Western blot assay in breast cancer tissues and cell lines. (G and H) RT-qPCR and Western blot assay were carried out to examine expression level of TRPS1 in MCF-7 and MDA-MB-436 cells transfected with miR-NC or miR-543. *P < 0.05. |
Overexpression of TRPS1 Abrogated Effects of miR-543 on Proliferation, Motility and Apoptosis of Breast Cancer Cells
For further demonstrate TRPS1 was a direct target of miR-543, MCF-7 and MDA-MB-436 cells were transfected with miR-NC, miR-543, miR-543+Vector or miR-543+TRPS1. The mRNA and protein expression levels of TRPS1 were measured by RT-qPCR and Western blot assay. The results implied that upregulation of miR-543 significantly repressed TRPS1 level in MCF-7 and MDA-MB-436 cells in comparison with miR-NC group, but introducing overexpressed plasmid of TRPS1 could resume TRPS1 level (Figure 6A and B). In addition, MTT and plate clone formation assays were used to assess cell proliferation and showed that high expression of TRPS1-reverted cell proliferation ability loss caused by miR-543 (Figure 6CE). The effect of TRPS1 on breast cancer cells apoptosis was examined by flow cytometry assay and suggested that TRPS1 overexpression weakened the high apoptosis rate induced by miR-543 in both MCF-7 and MDA-MB-436 cells (Figure 6F and G). Moreover, transwell migration and invasion assays were employed to measure cell numbers of invasion and migration. Our results indicated that upregulation of miR-543 greatly repressed cell invasion and migration abilities of MCF-7 and MDA-MB-436 cells, whereas overexpression of TRPS1 could overturn this inhibition effect in breast cancer cells (Figure 6HK). We can conclude that miR-543 suppressed breast cancer cell proliferation and promoted apoptosis via negatively targeting TRPS1 expression.
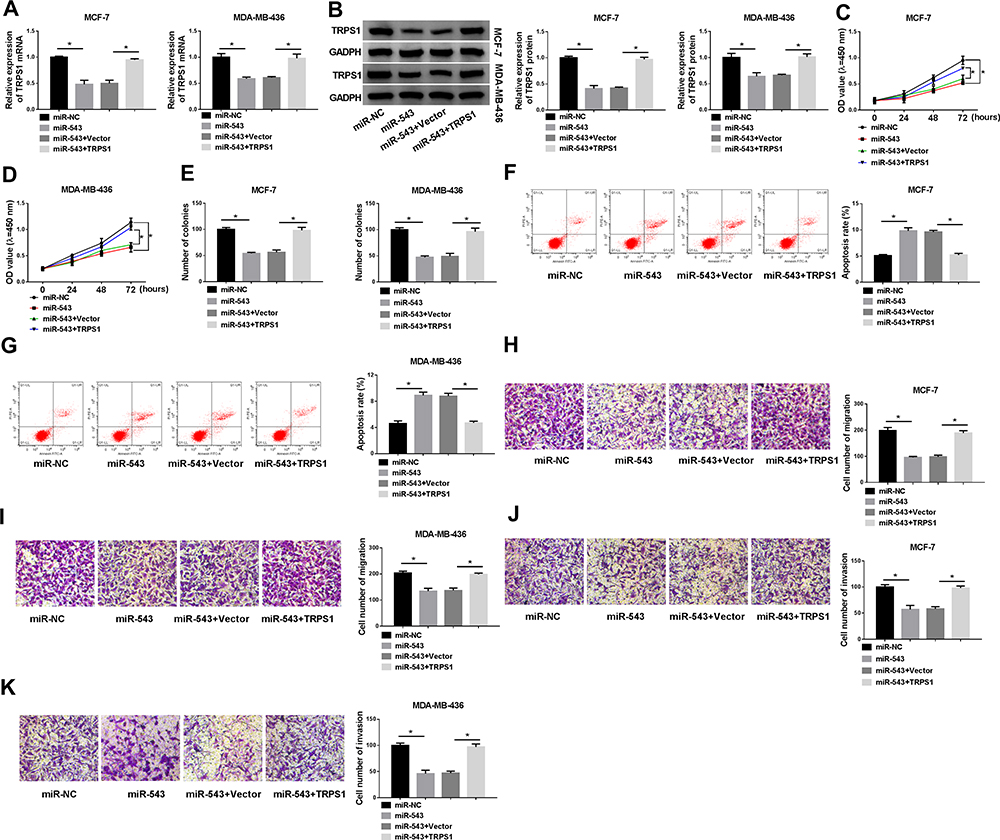 |
Figure 6 Effects of elevated miR-543 in breast cancer cells could be abolished by increasing TRPS1. MCF-7 and MDA-MB-436 cells were transfected with miR-NC, miR-543, miR-543+Vector or miR-543+TRPS1. (A and B) The expression level of TRPS1 was tested in MCF-7 and MDA-MB-436 cells by RT-qPCR and Western blot assay. (C–E) MTT and plate clone formation assays were used to assess cells ability of proliferation. (F and G) Apoptosis of MCF-7 and MDA-MB-436 cells was detected with flow cytometry. (H–K) Cell abilities of migration and invasion of MCF-7 and MDA-MB-436 cells were analyzed with transwell assay after transfection. *P < 0.05. |
PVT1 Overexpression Increased TRPS1 Expression Level in Breast Cancer Cells by Sponging miR-543
As presented in Figure 7A and B, cells were co-transfected with pcDNA3.1/PVT1 and miR-543 to explore their effects on TRPS1 expression. RT-qPCR and Western blot assay results implied that elevated expression of PVT1 prominently enhanced TRPS1 expression in mRNA and protein levels, while overexpression of miR-543 abolished these effects.
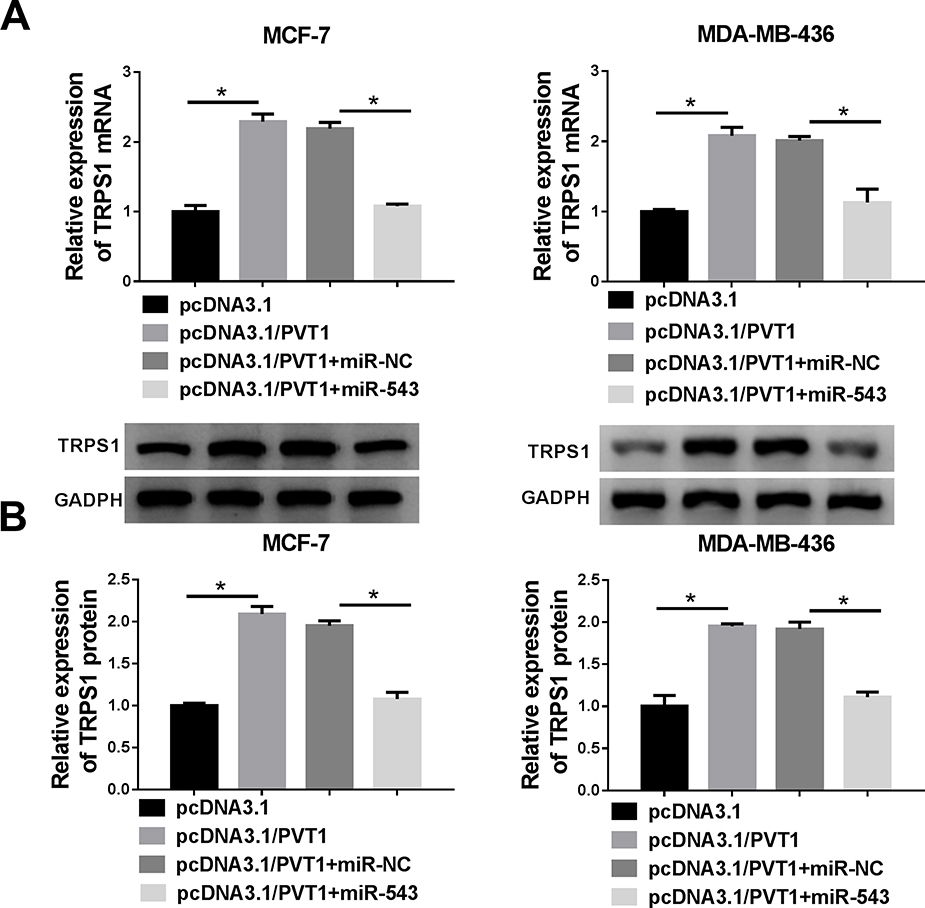 |
Figure 7 The expression level of TRPS1 in breast cancer cells. (A and B) The expression level of TRPS1 was evaluated in MCF-7 and MDA-MB-436 cells transfected with pcDNA3.1, pcDNA3.1/PVT1, pcDNA3.1/PVT1+miR-NC or pcDNA3.1/PVT1+ miR-543 by RT-qPCR or Western blot assay. *P < 0.05. |
Discussion
In this study, our current results implied that PVT1 silencing suppressed growth and motility, while induced apoptosis in breast cancer cells. Besides, functional experiment indicated that lncRNA PVT1 regulated TRPS1 expression by competitively adsorbing miR-543 in breast cancer cells.
PVT1 was recognized as cancer risk and located in the 8q24 gene desert, which was hosted to single nucleotide polymorphisms associated with cancer risk.13 Increasing evidence had shown that the expression of PVT1 was elevated in various cancers, such as hepatocellular carcinoma,14 non-small cell lung cancer,15 malignant pleural mesothelioma,16 gastric cancer,17 ovarian cancer and breast cancer.18 Kong et al reported that PVT1 was notably correlated with deeper invasion and TNM stage, and acted as a prognostic biomarker and potential target for human gastric cancer.19 Consistent with previous research results,20 loss-functional experiment of PVT1 led to increased apoptosis, while induced remarkable inhibition of proliferation, motility and colony formation in MCF-7 cells and MDA-MB-436 cells. Furthermore, we further validated the functional roles of PVT1 in vivo and suggested that PVT1 silencing repressed tumor growth. Li et al results showed that PVT1 promoted esophageal cancer progression via regulating Lim and SH3 domain protein expression by functioning as ‘sponge’ to imbibe miR-203,21 similarly, PVT1 played as a molecular sponge to affect miR-203 expression in osteosarcoma.22 To probe the molecular mechanism by which PVT1 silencing suppressed cell viability and facilitated apoptosis in breast cancer cells, we searched target genes of PVT1 and confirmed the combination through dual-luciferase reporter, RIP and RNA pull down assays. All results indicated that PVT1 bound with miR-543 to mediate TRPS1 expression in breast cancer cells.
Furthermore, previous reports suggested that miR-543 enhanced the proliferation and colony formation of gastric cancer cell via targeting silent information regulator 1.23 Another study demonstrated that miR-543 acted as a tumor inhibitor by suppressing the EMT in breast cancer.24 In our results, miR-543 was highly expressed in breast cancer tissues and its overexpression inhibited breast cancer cell proliferation and motility, while improved apoptosis. Moreover, we reported a new target gene of miR-543. TRPS1 was implicated in the cell cycle and cancer development,25 a previous report conducted by Radvanyi et al indicated the high expression of TRPS1 in breast cancer.26 Additionally, TRPS1 had a critical role in EMT, TRPS1 by targeting miR-221/222 improved the EMT in breast cancer.27 Similarly, we demonstrated that TRPS1 protein and mRNA levels were often downregulated in breast cancer tissues and cells. Mechanically, our results displayed that TRPS1 overexpression abrogated effects of high expressed miR-543 on proliferation, motility and apoptosis of breast cancer cells and indicated a tumor suppressor role for TRPS1 silencing in breast cancer.
In summary, this study indicated that lncRNA PVT1 acted as a central role of breast cancer via affecting miR-543/TRPS1 axis and marked us closer to realize the potential of lncRNA PVT1 in breast cancer.
Conclusion
All data implied that PVT1 was upregulated in breast cancer tissues and cells. Knockdown of PVT1 repressed proliferation, motility and enhanced apoptosis of breast cancer cells in vitro and inhibited tumor growth in vivo. Additionally, overexpression of PVT1 increased TRPS1 expression level in breast cancer cells by sponging miR-543. We concluded that PVT1 mediated miR-543/TRPS1 axis may be a powerful and new positive prognostic marker in breast cancer.
Funding
There is no funding to report.
Disclosure
The authors declare that they have no conflicts of interest for this work.
References
1. Siegel R, Ma J, Zou Z, Jemal A. Cancer statistics, 2014. CA Cancer J Clin. 2014;64(1):9–29. doi:10.3322/caac.21208
2. DeSantis CE, Bray F, Ferlay J, Lortet-Tieulent J, Anderson BO, Jemal A. International variation in female breast cancer incidence and mortality rates. Cancer Epidemiol Biomarkers Prevention. 2015;24(10):1495. doi:10.1158/1055-9965.EPI-15-0535
3. Rodgers RJ, Reid GD, Koch J, et al. The safety and efficacy of controlled ovarian hyperstimulation for fertility preservation in women with early breast cancer: a systematic review. Hum Reprod. 2017;32(5):1033–1045. doi:10.1093/humrep/dex027
4. Zhang JJ, Fau GS, Jia BQ, Jia BQ. Down-regulation of long non-coding RNA MEG3 serves as an unfavorable risk factor for survival of patients with breast cancer. 2016;2284–2729. ((Electronic)).
5. Ponting CP, Oliver PL, Reik W. Evolution and functions of long noncoding RNAs. Cell. 2009;136(4):629–641. doi:10.1016/j.cell.2009.02.006
6. Spizzo R, Almeida MI, Colombatti A, Calin GA. Long non-coding RNAs and cancer: a new frontier of translational research? Oncogene. 2012;31:4577. doi:10.1038/onc.2011.621
7. Gupta RA, Shah N, Wang KC, et al. Long non-coding RNA HOTAIR reprograms chromatin state to promote cancer metastasis. Nature. 2010;464:1071. doi:10.1038/nature08975.
8. Zhao W, Fau AY, Liang Y, Liang Y, Fau - Xie XW, Xie XW. Role of HOTAIR long noncoding RNA in metastatic progression of lung cancer. 2014;2284–2729. ((Electronic)).
9. Shi S-J, Wang L-J, Yu B, Li Y-H, Jin Y, Bai X-Z. LncRNA-ATB promotes trastuzumab resistance and invasion-metastasis cascade in breast cancer. Oncotarget. 2015;6(13):11652–11663. doi:10.18632/oncotarget.3457
10. Bing L, Hong C, Li-Xin S, Wei G. MicroRNA-543 suppresses endometrial cancer oncogenicity via targeting FAK and TWIST1 expression. Arch Gynecol Obstet. 2014;290(3):533–541. doi:10.1007/s00404-014-3219-3
11. Fan C, Lin Y, Mao Y, et al. MicroRNA-543 suppresses colorectal cancer growth and metastasis by targeting KRAS, MTA1 and HMGA2. Oncotarget. 2016;7(16):21825–21839. doi:10.18632/oncotarget.7989
12. Haga CL, Phinney DG. MicroRNAs in the imprinted DLK1-DIO3 region repress the epithelial-to-mesenchymal transition by targeting the TWIST1 protein signaling network. 2012;1083–351X. ((Electronic)).
13. Huppi K, Pitt J, Wahlberg B, Caplen N. The 8q24 gene desert: an oasis of non-coding transcriptional activity. Front Genet. 2012;3(69). doi:10.3389/fgene.2012.00069
14. Wang F, Yuan J-H, Wang S-B, et al. Oncofetal long noncoding RNA PVT1 promotes proliferation and stem cell-like property of hepatocellular carcinoma cells by stabilizing NOP2. Hepatology. 2014;60(4):1278–1290. doi:10.1002/hep.27239
15. Yang Y-R, Zang S-Z, Zhong C-L, Li Y-X, Zhao -S-S, Feng X-J. Increased expression of the lncRNA PVT1 promotes tumorigenesis in non-small cell lung cancer. Int J Clin Exp Pathol. 2014;7(10):6929–6935.
16. Riquelme E, Suraokar MB, Rodriguez J, et al. Frequent coamplification and cooperation between C-MYC and PVT1 oncogenes promote malignant pleural mesothelioma. J Thoracic Oncol. 2014;9(7):998–1007. doi:10.1097/JTO.0000000000000202
17. Ding J, Li D, Gong M, et al. Expression and clinical significance of the long non-coding RNA PVT1 in human gastric cancer. Onco Targets Ther. 2014;7:
18. Guan Y, Kuo WL, Stilwell JL, et al. Amplification of PVT1 contributes to the pathophysiology of ovarian and breast cancer. Clin Cancer Res. 2007;13(19):5745–5755. doi:10.1158/1078-0432.CCR-06-2882
19. Kong R, Zhang E-B, Yin D-D, et al. Long noncoding RNA PVT1 indicates a poor prognosis of gastric cancer and promotes cell proliferation through epigenetically regulating p15 and p16. Mol Cancer. 2015;14(1):82. doi:10.1186/s12943-015-0355-8
20. Tang J, Li Y, Sang Y, et al. LncRNA PVT1 regulates triple-negative breast cancer through KLF5/beta-catenin signaling. Oncogene. 2018;37(34):4723–4734. doi:10.1038/s41388-018-0310-4
21. Li P-D, Hu J-L, Ma C, et al. Upregulation of the long non-coding RNA PVT1 promotes esophageal squamous cell carcinoma progression by acting as a molecular sponge of miR-203 and LASP1. Oncotarget. 2017;8(21):34164–34176. doi:10.18632/oncotarget.15878
22. Zhou Q, Chen F, Zhao J, et al. Long non-coding RNA PVT1 promotes osteosarcoma development by acting as a molecular sponge to regulate miR-195. Oncotarget. 2016;7(50):82620–82633. doi:10.18632/oncotarget.13012
23. Li J, Dong G, Wang B, Gao W, Yang Q. miR-543 promotes gastric cancer cell proliferation by targeting SIRT1. Biochem Biophys Res Commun. 2016;469(1):15–21. doi:10.1016/j.bbrc.2015.11.062
24. Haga CL, Phinney DG. MicroRNAs in the imprinted DLK1-DIO3 region repress the epithelial-to-mesenchymal transition by targeting the TWIST1 protein signaling network. J Biol Chem. 2012;287(51):42695–42707. doi:10.1074/jbc.M112.387761
25. Wu L, Wang Y, Liu Y, et al. A central role for TRPS1 in the control of cell cycle and cancer development. Oncotarget. 2014;5(17):7677–7690. doi:10.18632/oncotarget.2291
26. Radvanyi L, Singh-Sandhu D, Gallichan S, et al. The gene associated with trichorhinophalangeal syndrome in humans is overexpressed in breast cancer. Proc Natl Acad Sci U S A. 2005;102(31):11005. doi:10.1073/pnas.0500904102
27. Stinson S, Lackner MR, Adai AT, et al. TRPS1 targeting by miR-221/222 promotes the epithelial-to-mesenchymal transition in breast cancer. Sci Signal. 2011;4(177):ra41. doi:10.1126/scisignal.2001538
 © 2020 The Author(s). This work is published and licensed by Dove Medical Press Limited. The full terms of this license are available at https://www.dovepress.com/terms.php and incorporate the Creative Commons Attribution - Non Commercial (unported, v3.0) License.
By accessing the work you hereby accept the Terms. Non-commercial uses of the work are permitted without any further permission from Dove Medical Press Limited, provided the work is properly attributed. For permission for commercial use of this work, please see paragraphs 4.2 and 5 of our Terms.
© 2020 The Author(s). This work is published and licensed by Dove Medical Press Limited. The full terms of this license are available at https://www.dovepress.com/terms.php and incorporate the Creative Commons Attribution - Non Commercial (unported, v3.0) License.
By accessing the work you hereby accept the Terms. Non-commercial uses of the work are permitted without any further permission from Dove Medical Press Limited, provided the work is properly attributed. For permission for commercial use of this work, please see paragraphs 4.2 and 5 of our Terms.