")
Back to Journals » Diabetes, Metabolic Syndrome and Obesity » Volume 14
LncRNA PVT1 Regulates High Glucose-Induced Viability, Oxidative Stress, Fibrosis, and Inflammation in Diabetic Nephropathy via miR-325-3p/Snail1 Axis
Received 21 January 2021
Accepted for publication 19 March 2021
Published 19 April 2021 Volume 2021:14 Pages 1741—1750
DOI https://doi.org/10.2147/DMSO.S303151
Checked for plagiarism Yes
Review by Single anonymous peer review
Peer reviewer comments 3
Editor who approved publication: Prof. Dr. Juei-Tang Cheng
Baoyu Qin,1 Xiaoli Cao2
1Division of Endocrinology and Metabolic, Department of Geriatrics, The First Affiliated Hospital of Guangxi Medical University, Nanning, 530021, Guangxi Zhuang Autonomous Region, People’s Republic of China; 2Department of Endocrinology, Shanxi Cardiovascular Hospital, Taiyuan, 030024, Shanxi Province, People’s Republic of China
Correspondence: Baoyu Qin
Division of Endocrinology and Metabolic, Department of Geriatrics, The First Affiliated Hospital of Guangxi Medical University, No. 6 Shuangyong Road, Nanning, 530021, Guangxi Zhuang Autonomous Region, People’s Republic of China
Tel +86-13977179605
Email [email protected]
Background: Diabetic nephropathy (DN), as a complication of diabetes, is a leading cause of mortality in diabetic patients. It has been reported that lncRNA PVT1 (PVT1) could accelerate the progression of DN by promoting ECM accumulation and increasing the expression of fibronectin 1 (FN1). However, the underlying mechanism of PVT1 on DN remains unknown.
Methods: To study the effect of PVT1 on DN, mice were injected 50 mg/kg STZ to build the DN models. Mesangial cells (MCs) were induced by high glucose as in vitro model of DN. The expression level of PVT1, miR-325-3 and Snail1 was assessed by qRT-PCR and Western blot. Luciferase reporter assay, RNA pull-down and RIP were used to explore the interaction among PVT1, miR-325-3 and Snail1.
Results: In in vivo and in vitro DN models, the expression of PVT1 was upregulated. High glucose (HG) induced cell viability, oxidative stress, fibrosis and inflammation in MCs, which were reversed in the PVT1-KD MCs. The level of miR-325-3p was also increased in in vivo and in vitro experiments. Additionally, PVT1 can directly bind to miR-325-3p. Finally, Snail1 was a direct target of miR-325-3p.
Conclusion: PVT1 inhibits viability, oxidative stress, fibrosis, and inflammation in DN via miR-325-3p/Snail1 axis.
Keywords: diabetic nephropathy, lncRNA PVT1, miR-325-3p, Snail1
Introduction
Diabetic nephropathy (DN) is a serious cardiovascular complication of diabetes mellitus,1 which ultimately leads to end-stage renal diseases and shortens the life expectancy in diabetic patients.2 It has been reported that one-third of individuals with diabetes mellitus develop nephropathy.3 A number of factors are involved in the progression of DN. Hyperglycaemia plays an important role in the pathogenesis of DN, as glucose overload results in oxidative stress and inflammation.4 Additionally, high glucose causes MCs viability and induces MCs to secrete fibronectin, which lead to extracellular matrix accumulation and fibrosis.5
LncRNAs are nonprotein coding RNAs with >200 nucleotides, which can regulate many physiological processes.6 Some studies revealed that lncRNAs are related to the development and progression of DN.7–9 For example, lncRNA MALAT1 can regulate renal tubular epithelial pyroptosis by modulating miR-23c targeting of ELAVL1 in DN.10 LncRNA Tug1 can regulate mitochondrial bioenergetics in DN.3 Moreover, lncRNA PVT1 (PVT1) has been shown to be involved in accelerating the progression of DN by promoting ECM accumulation and increasing expression of fibronectin 1 (FN1).11 However, the underlying mechanism of PVT1 on diabetic nephropathy remains unclear.
MicroRNAs (miRNAs) are non-coding RNAs with 20–30 nucleotides that can bind to mRNA to regulate its protein expression.12 Previous reports indicated that miRNA-325-3p can suppress inflammation and fibrosis in the progression of DN.13 Snail1, as a zinc finger protein transcription factor, is related to the formation, development and metastasis of various tumors.14 Studies have highlighted that the Snail1 pathway is related to the progression of renal fibrosis.15 However, whether PVT1 regulates DN by miR-325-3p and Snail1 has not been investigated.
In this study, we explore the function and mechanism of PVT1 on DN in in vitro and in vivo.
Materials and Methods
Materials and Reagents
DNA methyltransferase recombinant protein was purchased from R&D system (USA). Trizol reagent was purchased from Invitrogen (Carlsbad, USA). Fetal bovine serum (FBS, Gibco, USA), dulbecco’s modified eagle’s medium (DMEM, Gibco, USA), and HRP-goat-anti-mouse IgG were purchased from Santa Cruz (USA). Protein marker was purchased from Fermentas (Canada). BCA protein kit was purchased from Pierce (Rockford, USA). ECL luminescence reagent was purchased from Applygen (China). Nitrocellulose filter membrane was purchased from Millipore (Beijing, China).
Animal Studies
A total of 20 male C57BL/6J mice were purchased from Peking University Health Science Center (Beijing, China). Mice were randomly divided into two groups (n = 10 for each group), one was intraperitoneal injected with STZ dissolved in a low pH (pH 4.5) citrate buffer (50 mg/kg for 5 consecutive days) to build the DN models or citrate buffer alone. Hyperglycaemic state was monitored and maintained on a standard rodent diet with water ad libitum and tested with a glucose metre (Sinocare, China) according to the manufacturer’s instructions. At the end of 12 weeks after the onset of diabetes, the blood of the mice was collected from mice through submandibular vein and the serum was extracted for the following experiments. All animal protocols were in accordance with the standards of the Institutional Animal Care and Use Committee (IACUC). And All animal studies were performed based on the review and approval of Animal Ethics Committee of the First Affiliated Hospital of Guangxi Medical University (approval number: [KY-E-2020-01-25]).
Cell Culture and Treatment
Mice MCs were purchased from Shanghai Institute of Biochemistry and Cell Biology (Shanghai, China) and cultured in DMEM supplemented with 10% FBS and 1% penicillin–streptomycin (Invitrogen, USA) in a humidified, 5% CO2, 37 °C incubator in a keratinocyte serum-free medium (K-SFM, Invitrogen, Carlsbad, CA, USA). For glucose treatment, CMs cells were starved in serum-free DMEM for 12 h followed by incubation of 30 mM D-glucose as HG treatment or 5.5 mM
Cell Transfection
Transfection was performed when cell density reached 70% by using Lipofectamine 2000 following the manufacturer’s instructions. Briefly, MCs were inoculated in a 6-well cell culture plate 24 h before transfection. After that, when the cells fuse to about 60%, si-PVT1 and negative control sequences (si-con group) transfected into CMs, and treated MCs without any treatment as the NC group. Cells in the logarithmic growth phase were collected for experiments. MiR-325-3p mimics, inhibitor and negative control of them (miR-NC and NC-inhibitor), PVT1 and snail1 overexpression vector (pcDNA-PVT1, oe snail1) and their pcDNA negative control (pcDNA-NC) were synthesized by Genepharma Company (Shanghai, China). After transfection for 48 h, CMs were used for further assay.
Cell Counting Kit-8 (CCK-8) Analysis
The cell viability assay was performed with CCK-8 assay. Briefly, approximately 5×10³ cells were cultured in 96-well plates and measured via CCK-8 assay (Dojido, Japan) accordance with the manufacturer’s instructions at 0, 24, 48, and 72 h, after incubation with 10 μL CCK-8 solution (Solarbio, Beijing China) for 2 h at 37° C, the Microplate Reader (Bio-Rad) was employed to estimate the optical density at 450 nm.
Western Blot Analysis
MCs were lysed in RIPA lysate (KenGEN, China) and protein concentration was determined by Bicinchoninic acid (BCA) protein assay. The protein was separated on a 10% SDS-PAGE and transferred to polyvinylidene difluoride (PVDF) membrane (Millipore, USA). These, blots were blocked with 5% non-fat milk for 1 h and incubated with rabbit anti-Snail1 (1:5000), rabbit anti-col1IV (1:5000) and mouse anti-GAPDH (1:5000) primary antibody overnight at 4 °C, followed by incubating in horseradish peroxidase (HRP)-conjugated secondary antibodies (1:5000) for 1 h. Subsequently, the membranes were visualized with electrochemiluminescent system (BioRad, USA) and quantified by software Image J (Bio-Rad Laboratories).
Quantitative Real-Time (qRT-PCR) Analysis
In the qRT-PCR analysis, GAPDH is used as a reference gene in the cytoplasm and U6 as a reference gene in the nucleus. Instill 750 µL TRIzol reagent (Invitrogen, Carlsbad, CA, USA) into 250 µL of each fraction for RNA extraction. Then, complementary DNAs (cDNA) were synthesized using 5× All-In-One RT MasterMix (Takara, Tokyo, Japan). qRT-PCR analysis was performed using micro-optical real-time PCR detection system (BioRad Laboratories, Inc.), and EvaGreen qPCR masterbatch. The relative expression was measured using 2−ΔΔCt method.
Intracellular Reactive Oxygen Species (ROS), Superoxide Dismutase (SOD), and Malondialdehyde (MDA) Estimation
MCs ROS contents were evaluated using DCF fluorescence (Sigma-Aldrich) at a wavelength of 525 nm. The activity of SOD and level of MDA was estimated in the cellular supernatant with a commercial kit (Nanjing Institute of Bioengineering, China) at the wavelength of 412 nm in accordance with the manufacturer’s instruction.
ELISA
To detect the level of inflammatory cytokines (TNF-α, IL-6, and IL-1β) produced in the high glucose-induced MCs and explore the role of PTV1 in inflammation, we cultured CMs in 24 well cell culture microplates at 1 × 10⁵ cells/well for 24 h and later treated them with high glucose for another 24 h, respectively. We measured the amount of TNF-α, IL-6, and IL-1β produced by the high glucose-induced MCs, and their respective sham (or control) groups. The levels of TNF-α, IL-6, and IL-1β in the supernatant of the transfection experiment were also measured by ELISA kit (Co., LTD, Location) according to the manufacturer’s instructions. Each of the experiments was done in three replicate wells.
Dual-Luciferase Reporter Assay
Cells (3 × 10⁴/well) were seeded in 24-well plates before transfection. Then, cells were transfected with the wild-type (WT) or mutant (MUT) PITPNA-AS1/PDGFD reporter plasmids with Lipofectamine® 2000 (Invitrogen, CA, USA) as the manufacturer’s advice. After 48 h, luciferase activities were analyzed using the Dual-Luciferase Reporter Assay System (Promega, Madison, WI, USA).
RNA Pull-Down Assay and RNA Immunoprecipitation (RIP)
For RNA pull-down assay, transfection was performed into l × 106 MCs with biotin-labeled Bio-miR-NC and Bio-miR-325-3p (WT and MUT) according to its instruction. After 48 h of transfection, cells were removed, and the collection of bound RNA was done with Pierce™ Magnetic RNA Pull-Down Kit (Thermo Fisher Scientific) in accordance with the guide. Lastly, PVT1 enrichment in the biotin-coupled miRNAs was measured with qRT-PCR. RIP assay was utilized to verify the interaction of PVT1 with miR-325-3p. For the first step, CMs were lysed and cultured with the conjugated Ago2 or IgG antibodies (Cell Signaling Technology, USA) magnetic beads in RIP buffer. And then the precipitated RNA was isolated and quantified by qRT-PCR to obtain the enrichment value.
Statistics Analysis
Statistical analysis was performed by SPSS 20.0 (SPSS, Chicago, IL, USA) software using variance t-test. The difference between the two groups was calculated by Student’s t-test. The significant difference among multiple groups was calculated by One-Way ANOVA with Bonferroni correction. Three independent experiments were performed for each data point, and the data represent the mean ± standard deviation (SD) of the triplicates. P < 0.05 was considered statistically significant.
Results
PVT1 Was Upregulated and miR-325-3p Was Downregulated in DN Blood Samples and HG-Induced MCs
At the first stage of this study, serum was collected from 10 diabetic nephropathy mice and 10 normal mice. After, qRT-PCR was employed to determine the PVT1 differential expression between the two groups. The result showed that the expression of PVT1 was highly upregulated in DN group compared to the normal (Figure 1A, p < 0.01). As showed in Figure S1, the expression of PVT1 in MC cells induced by HG or normal concentration for 0–48 h was detected. It was found that the expression of PVT1 in HG-induced MCs increased with time and even increased by about 3 times at 24 h, but as time increased to 48 h, the growth trend of PVT1 expression was slowed down, so we chose high glucose stimulation follow-up research is carried out under this condition of 24 h. Subsequently, in HG-induced MCs, s same as the results of in vivo experiments, mRNA level of PVT1 increased in high glucose group than that in normal (Figure 1B, p < 0.01). Additionally, miR-325-3p expression was strongly decreased in DN group compared to the normal (Figure 1C, p < 0.01) and same as the results of in vivo experiments, mRNA level of miR-325-3p decreased in high glucose group than that in normal (Figure 1D, p < 0.01).
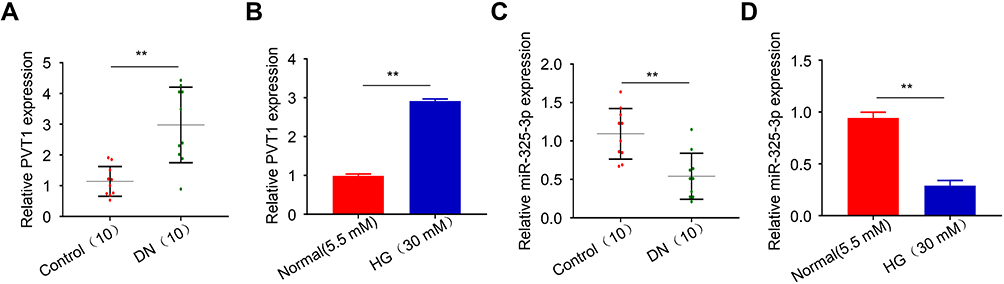 |
Figure 1 PVT1 was upregulated and miR-325-3p was downregulated in DN in vivo and in vitro. (A) The expression of PVT1 in DN blood samples detected by qRT-PCR. (B) The expression of PVT1 in HG-induced MCs detected by qRT-PCR. (C) The expression of miR-325-3p in DN blood samples detected by qRT-PCR. (D) The expression of miR-325-3p in HG-induced MCs detected by qRT-PCR. **P< 0.01. |
PVT1 Regulates HG-Induced Viability, Oxidative Stress, Fibrosis, and Inflammation in MCs
To further explore the effect of PVT1 on DN, si-PVT1 was used to knock down the PVT1 which was verified by q-PCR. The result revealed that the relative expression of PVT1 was significantly inhibited in the HG-induced MCs after knockdown with si-PVT1, compared to the negative control group (Figure 2A, p < 0.01). In addition, CCK-8 assay was applied to evaluate the cell viability. The results showed that silencing PVT1 significantly reduced the viability of the HG-treated cell in a time-dependent manner compared to the negative control group (Figure 2B, p < 0.01). Moreover, we assessed the oxidative stress by measuring ROS, MDA and SOD levels in the HG-induced MCs after silencing PVT1. Our results revealed that the level of ROS and MDA was reduced in si-PVT1 group while the SOD level was elevated, supposing that PVT1 triggered oxidative stress in the HG-induced MCs (Figure 2C, **p < 0.01, ***p < 0.001). Additionally, protein expression of fibronectin and collagen type IV was conducted by Western blot in HG-induced MCs, we found that the protein expression level of fibronectin and collagen type IV was significantly inhibited in the HG si- PVT1 relative to the normal (5.5mM) and control HG si-NC group (Figure 2D). Finally, the inflammation was assessed by ELASE. The content of IL-6, IL-1β and TNF-α was decreased in si-PVT1 group, compared with si-NC group (Figure 2E). The above results indicated that PVT1 regulates HG-induced viability, oxidative stress, fibrosis, and inflammation in MCs.
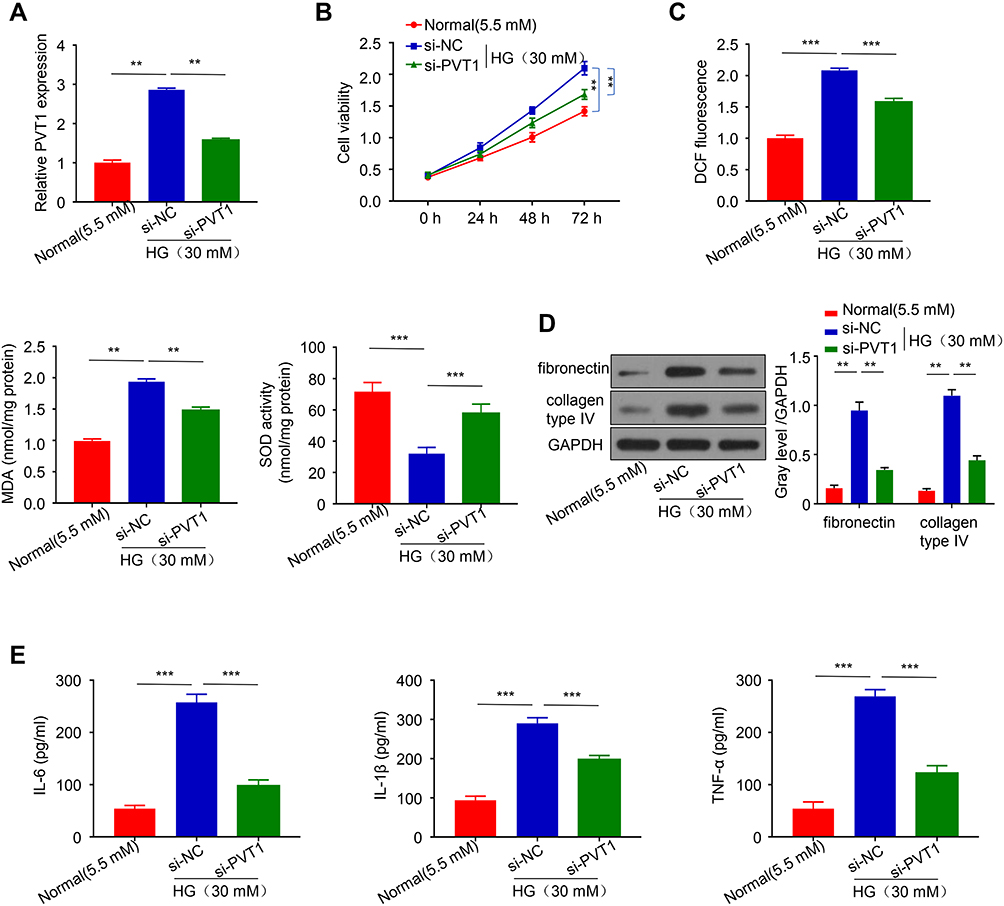 |
Figure 2 PVT1 regulates viability, oxidative stress, fibrosis, and inflammation in HG-induced MCs. (A) The expression of PVT1 when be knocked-down in HG-induced MCs detected by qRT-PCR. (B) The cell viability of MCs transfected with si-PVT1 was assessed through CCK8 assay (C) The level of DCF, MDA, and SOD was evaluated by ELISA in HG-induced MCs. (D) The proteins level of fibronectin and collagen type IV was detected by Western blot. (E) The level of inflammatory cytokines IL-6, IL-1β, and TNF-α, produced by HG-induced MCs after PVT1 knockdown. **P< 0.01, ***P< 0.001. |
In the end, we evaluate the expression of PVT1 in normal glucose-treated MCs which transfected with pcDNA-PVT1 plasmid (Figure S2A) to show that key parameters mimicking high glucose culture are created. The result clearly showed that the level of PVT1 was obviously upregulated than that of control and MCs transfected with empty plasmid. Similarly, CCK-8 was constructed to assess the viability of NG-induced MCs (Figure S2B) and the result revealed that the viability of the NG-induced MCs treated by pcDNA-PVT1 was significantly increased compared to the control. Moreover, the IL-6, IL-1β and TNF-α were assessed for evaluating the inflammation response of NG-induced MCs by ELASE (Figure S2C). And the level of them was increased in pcDNA-PVT1 group compared with in the control.
miR-325-3p Served as a Target of PVT1
To study the underlying mechanism, we found that PVT1 has miR-325-3p binding sites by analyzing the starbase (Figure 3A). This was further confirmed through dual-luciferase reporter assay and the results showed that overexpression of miR-325-3p inhibited the luciferase activity when co-transfection with WT PVT1 reporter plasmid compared to the control group (miR-NC) in HG-induced MCs, but the inhibitory effect disappeared when the predicted PVT1 binding site was mutated (PVT1 MUT) (Figure 3A, p < 0.01). The results of the RNA pull-down experiment also revealed that biotin-coupled probes with WT miR-325-3p could pull-down more PVT1 than the one with the MUT miR-325-3p in HG-induced MCs (Figure 3B, p < 0.01). The binding relationship between PVT1 and miR-325-3p was further assessed by RIP-qrt-PCR in HG-induced MCs (Figure 3C, p < 0.01), and we discovered that more PVT1 and miR-325-3p were significantly enriched in immunoprecipitated Ago2-containing complexes compared to the IgG group, validating the PVT1-miR-325-3p ability of interaction. Besides, the expression of miR-325-3p was evaluated in HG-induced MCs. In si-PVT1 group, the miR-325-3p level was upregulated. But the expression was downregulated in pc-DNA PVT1 group (Figure 3D, p < 0.01). Finally, the correlation between PVT1 and miR-325-3p was analyzed, and the results showed that there was a clear negative correlation between PVT1 and miR-325-3p (Figure 3E). We used qRT-PCR to detect the expression of miR-325-3p in HG-induced MCs transfected with miR-325-3p inhibitor (Figure S3). The results have shown that in cells transfected with miR-325-3p inhibitor, the level of miR-325-3p decreased significantly. It indicated that the transfection was a success and can be further used.
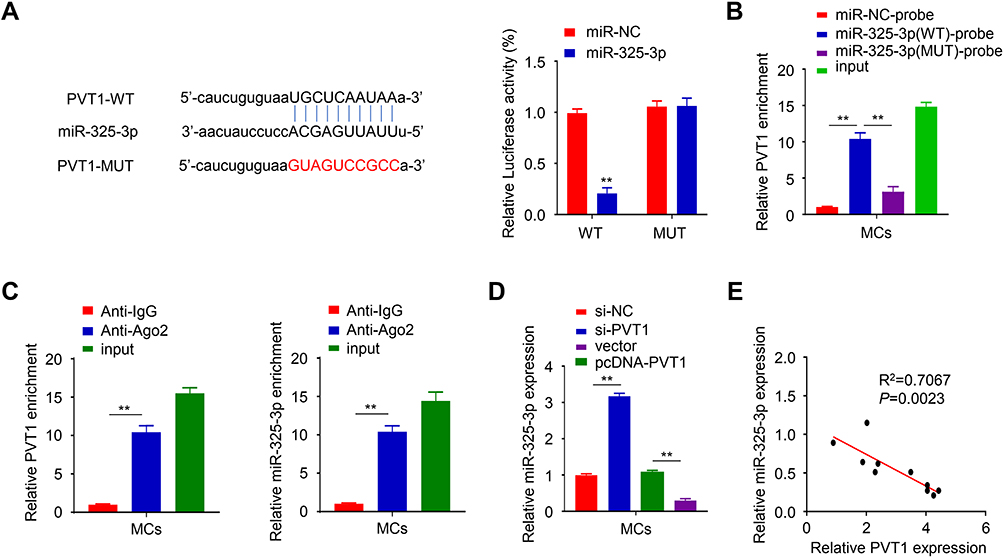 |
Figure 3 miR-325-3p served as a target of PVT1. (A) Potential binding sites of PVT1 were identified through lncbase database and confirmed by luciferase assay. (B) RNA pull-down experiment was used to confirmed the interaction between PVT1 and miR-325-3p. (C) the interaction between PVT1 and miR-325-3p was evaluated by RIP-qrt-PCR. (D) The expression of miR-325-3p in HG-induced MCs was detected by qRT-PCR. (E) The association of the levels of miR-325-3p and PVT1 was analyzed using Spearman correlation coefficient analysis. **P< 0.01. |
Snail1 Was a Direct Target of miR-325-3p
TargetScan software was used to predict that there were miR-325-3p binding sites in the 3ʹ-UTR region of Snail1. Luciferase reporter assay was performed in HG-induced MCs, which showed that the luciferase activity was inhibited by overexpression of miR-325-3p while the luciferase activity was increased after mutating the predicted Snail1 3ʹ-UTR binding site (Figure 4A, p < 0.01). To explore the relation of miR-325-3p and Snail1, qRT-PCR and Western blot were used. The results of them both revealed that the mRNA and protein expression of Snail1 was upregulated in HG-induced MCs transfected with miR-325-3p inhibitor but increased when miR-325-3p overexpressed (Figure 4B, p < 0.01). Furthermore, we study the relationship of PVT1, miR-325-3p and Snail1. MCs of which PVT1 was knocked down were incubated with miR-325-3p inhibitor. The mRNA and protein level of Snail1 was reduced in si-PVT1 group, which was promoted by treated with miR-325-3p inhibitor (Figure 4C, p < 0.001). Consistent with the cell experiment, the expression of Snail1 mRNA was upregulated in STZ-induced mice (Figure 4D, p < 0.001). Finally, the correlation between Snail1 and PVT1 was obviously positive while the correlation between Snail1 and miR-325-3p was a negative trend according to Spearman correlation coefficient analysis (Figure 4E, p = 0.0024).
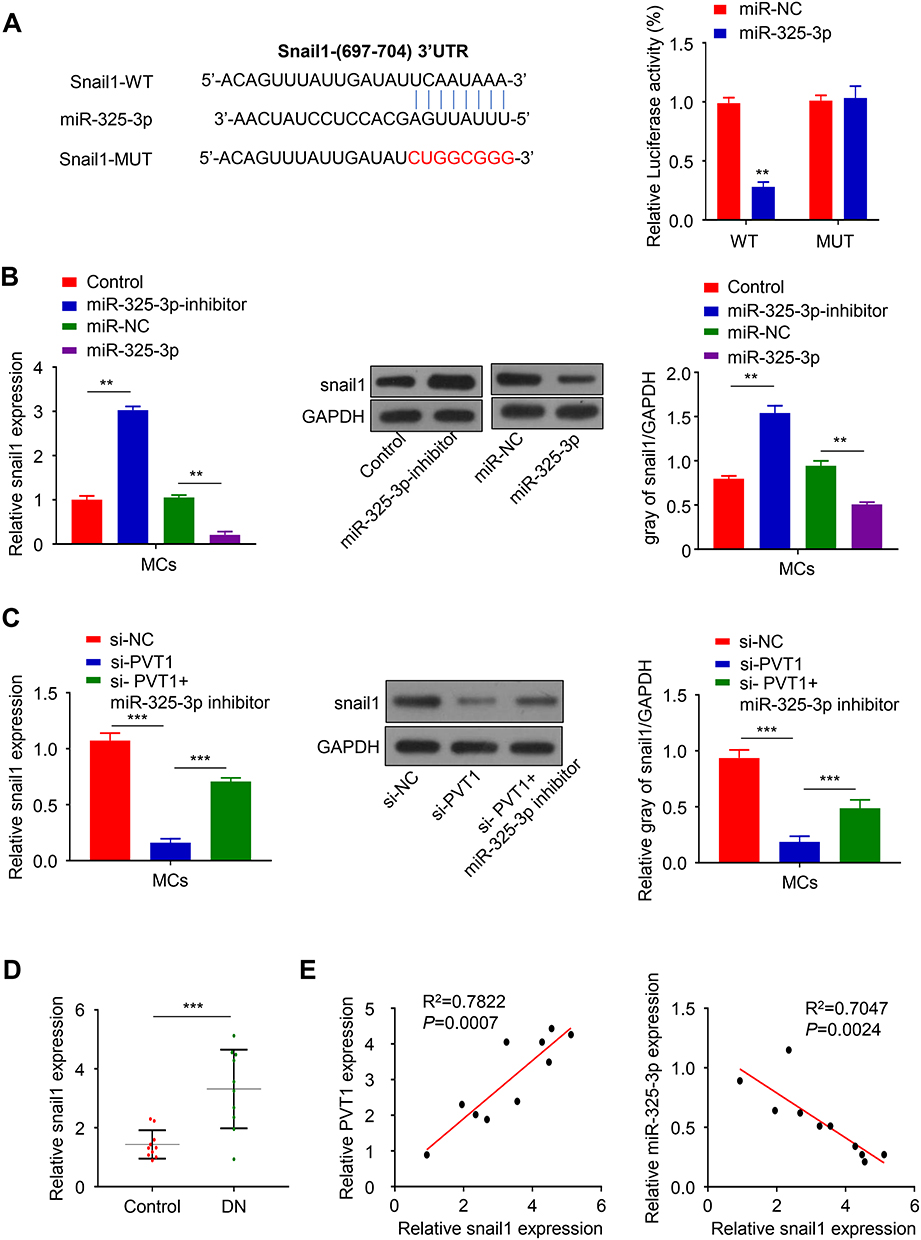 |
Figure 4 Snail1 was a direct target of miR-325-3p. (A) TargetScan software showing 3ʹ-UTR site of Snail1 as the possible target of miR-325-3p and confirmed by luciferase reporter assay. (B) The protein level and mRNA expression of Snail1 in MCs incubated with miR-325-3p mimic and inhibitor. (C) The protein level and mRNA expression of Snail1 in si-PVT1 co-transfected with miR-325-3p inhibitor in HG-induced MCs. (D) The mRNA expression of Snail1 in DN blood samples was detected by qRT-PCR. (E) Spearman correlation coefficient analysis was used to analyze the association of PVT1 and Snail1 as well as miR-325-3p and Snail1. **P< 0.01, ***P< 0.001. |
PVT1 Inhibits HG-Induced Viability, Oxidative Stress, Fibrosis, and Inflammation in MCs via miR-325-3p/Snail1 Axis
To confirm if PVT1 can inhibit the viability, oxidative stress, fibrosis, and inflammation of MCs through the miR-325-3p/Snail1 axis, HG-induced induced MCs were co-transfected with several different gene combinations. The results revealed that cell viability was increased in si-PVT1 group than control but reduced when si-PVT1 co-transfected with miR-325-3p inhibitor or oe Snail1 (Figure 5A, p < 0.01). Our functional analysis experiment result showed that the miR-325-3p inhibitor or oe Snail1 partly restored the depleted level of ROS and MDA and repressed the SOD activity that was increased by si-PVT1 (Figure 5B, p < 0.01). Moreover, assessment of HG-induced MCs fibrosis revealed that miR-325-3p inhibitor or oe Snail1 recovered the downregulated fibronectin and collagen type IV protein expression that was induced by silencing PVT1, suggesting that the miR-325-3p inhibitor or the oe ROCK1 could increase cell fibrosis in DN (Figure 5C, p < 0.01). Besides, the downregulated level of IL-6, IL-1β, and TNF-α with si-PVT1 in the HG-induced MCs was also recovered by miR-588 inhibition or ROCK1 overexpression (Figure 5D, *p < 0.05, **p < 0.01).
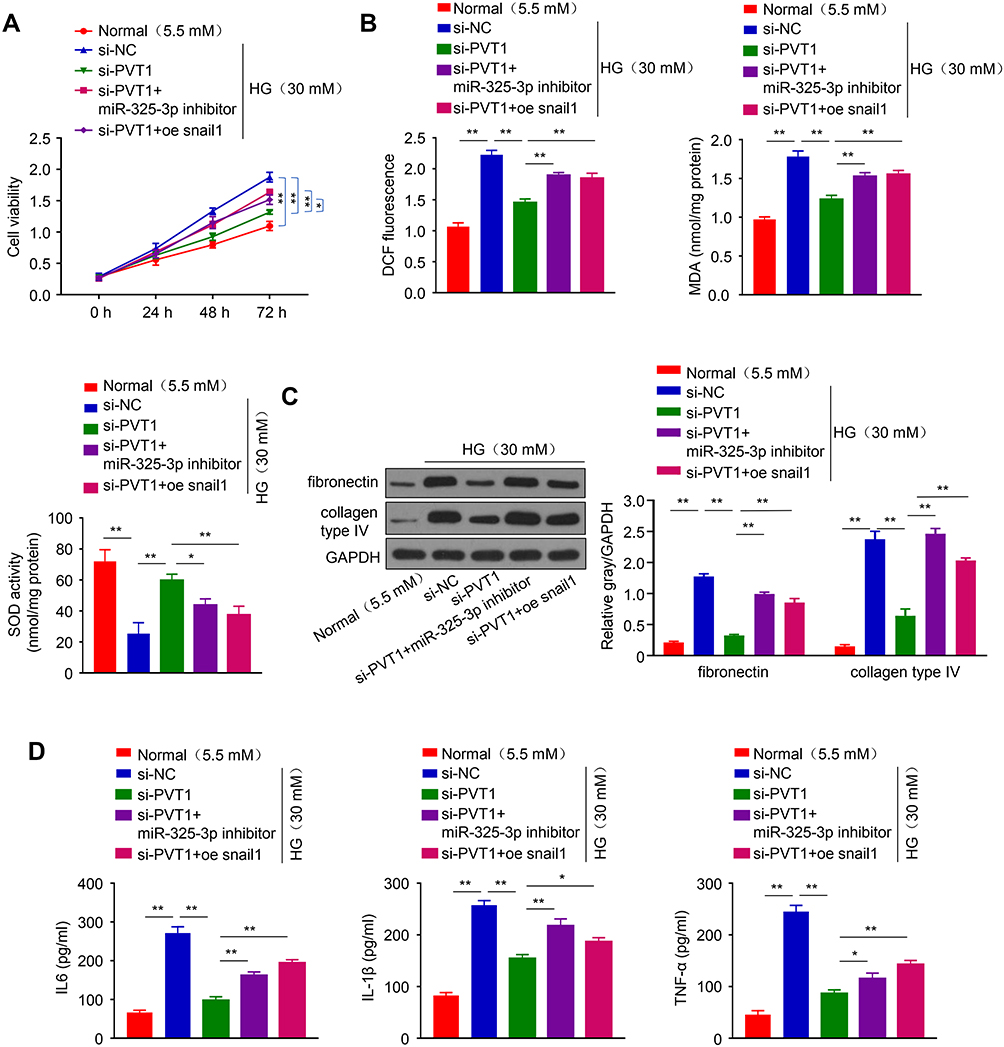 |
Figure 5 PVT1 inhibits HG-induced viability, oxidative stress, fibrosis, and inflammation in MCs via miR-325-3p/Snail1 axis. (A) CCK-8 assay was used to evaluate the cell viability of MCs transfected with various variables. (B) The level of DCF, MDA, and SOD was evaluated by ELISA in MCs. (C) The protein level of fibronectin and collagen type IV was detected by Western blot. (D) The level of inflammatory cytokines IL-6, IL-1β, and TNF-α, produced by HG-induced MCs transfected with various variables. *P< 0.05, **P< 0.01. |
Discussion
DN, a complication of diabetes mellitus (DM), is the leading cause of end-stage renal diseases.16 There are a number of factors involved in the development and progression of DN, such as glucose overload.17 MCs play a central role in the pathogenesis of DN.18 Hyperglycaemia environment caused MCs to secrete fibrosis-related protein, including fibronectin, which accelerated progression of DN.19 So, we incubated MCs with high glucose to establish an in vitro DN model, and the mice were injected STZ to induce DN for in vivo experiments. As the first result, the expression of PVT1 was upregulated both in mice and MCs incubated with high glucose. On the contrary, miR-325-9p was decreased in DN group and high glucose group.
According to the studies, PVT1 regulates DN by promoting fibronectin 1. In this study, we also found cell viability, oxidative stress, inflammation and fibrosis were inhibited in PVT1-KD MCs. According to the analysis of starbase, there was a binding site in PVT1, combining to miR-325-3p. In general, miRNAs control target gene expression by inhibiting translation and destroying target RNAs,20,21 and play an important role in DN, for instance, miR-regulated E-box repressors and expression of profibrotic genes such as collagens.22 Interestingly, miRNAs are usually stable and can be sponged by lncRNA, but endogenous transcripts or sometimes viral transcripts can also control miRNAs by target RNA-directed miRNA degradation (TDMD).23,24 In order to verify that the PVT1 interacts with miR-325-3p in the form of sponge, we conducted luciferase reporter, RNA pull-down and RIP assays, and the results proved that PVT1 can bind to miR-325-3p, owing to the inhibitory effect will not be restored when it is degraded. Next, we found that miR-325-3p can bind to Snail1. It has been reported that Snail1 pathway is involved in the progression of many diseases, for instance, Dub3 inhibition suppresses breast cancer invasion and metastasis by promoting Snail1 degradation.25 CLDN6 promotes tumor progression through the YAP1-snail1 axis in gastric cancer.26 Moreover, it has been reported that Snail1 has involved the progression of DN.27 Consistent with our research, mRNA and protein expression of Snail1 was decreased in PVT1-KD MCs, which was reversed by treating with miR-325-3p inhibitor.
Finally, PVT1-KD MCs were treated with miR-325-3p inhibitor, which induced cell viability, oxidative stress, inflammation and fibrosis. Same as the above results, over-expression of Snail1 in PVT1-KD MCs also aggravated the progression of DN.
In summary, lncRNA PVT1 regulates high glucose-induced viability, oxidative stress, fibrosis, and inflammation in diabetic nephropathy via miR-325-3p/Snail1 axis.
Data Available on Request Owing to Privacy/Ethical Restrictions
All supporting data of this work, which are not available in public because of the ethical restrictions are available from the corresponding author upon request.
Consent for Publication
All authors’ consent to publication.
Acknowledgments
We thank the reviewers for their constructive comments. Baoyu Qin is the first author.
Author Contributions
Baoyu Qin designed and directed the experiments; Baoyu Qin and Xiaoli Cao conducted the experiments and data analysis; each author has approved the final manuscript. All authors made substantial contributions to conception and design, acquisition of data, or analysis and interpretation of data; took part in drafting the article or revising it critically for important intellectual content; agreed to submit to the current journal; gave final approval of the version to be published; and agree to be accountable for all aspects of the work.
Disclosure
The authors declared no competing interests in this work.
References
1. Shi M, Tang R, Huang F, et al. Cardiovascular disease in patients with type 1 diabetes: early evaluation, risk factors and possible relation with cardiac autoimmunity. Diabetes Metab Res Rev. 2020. doi:10.1002/dmrr.3423
2. Feng X, Zhao J, Ding J, et al. LncRNA Blnc1 expression and its effect on renal fibrosis in diabetic nephropathy. Am J Transl Res. 2019;11(9):5664–5672.
3. Long J, Badal SS, Ye Z, et al. Long noncoding RNA Tug1 regulates mitochondrial bioenergetics in diabetic nephropathy. J Clin Invest. 2016;126(11):4205–4218. doi:10.1172/JCI87927
4. Liu B, Qiang L, Wang GD, et al. LncRNA MALAT1 facilities high glucose induced endothelial to mesenchymal transition and fibrosis via targeting miR-145/ZEB2 axis. Eur Rev Med Pharmacol Sci. 2019;23(8):3478–3486. doi:10.26355/eurrev_201904_17713
5. Imasawa T, Obre E, Bellance N, et al. High glucose repatterns human podocyte energy metabolism during differentiation and diabetic nephropathy. FASEB J. 2017;31(1):294–307. doi:10.1096/fj.201600293r
6. Charles Richard JL, Eichhorn PJA. Platforms for investigating LncRNA functions. SLAS Technol. 2018;23(6):493–506. doi:10.1177/2472630318780639
7. Che X, Deng X, Xie K, et al. Long noncoding RNA MEG3 suppresses podocyte injury in diabetic nephropathy by inactivating Wnt/beta-catenin signaling. PeerJ. 2019;7:e8016. doi:10.7717/peerj.8016
8. Jx F, Sun GQ, Wang HL, et al. LncRNA OIP5-AS1 induces epithelial-to-mesenchymal transition and renal fibrosis in diabetic nephropathy via binding to miR-30c-5p. J Biol Regul Homeost Agents. 2020;34(3):961–968. doi:10.23812/20-199-A-68
9. Li Y, Zheng LL, Huang DG, et al. LNCRNA CDKN2B-AS1 regulates mesangial cell proliferation and extracellular matrix accumulation via miR-424-5p/HMGA2 axis. Biomed Pharmacother. 2020;121:109622. doi:10.1016/j.biopha.2019.109622
10. Li X, Zeng L, Cao C, et al. Long noncoding RNA MALAT1 regulates renal tubular epithelial pyroptosis by modulated miR-23c targeting of ELAVL1 in diabetic nephropathy. Exp Cell Res. 2017;350(2):327–335. doi:10.1016/j.yexcr.2016.12.006
11. Alvarez ML, DiStefano JK, Lee LTO. Functional characterization of the plasmacytoma variant translocation 1 gene (PVT1) in diabetic nephropathy. PLoS One. 2011;6(4):e18671. doi:10.1371/journal.pone.0018671
12. Martinez B, Peplow PV. MicroRNAs as diagnostic and prognostic biomarkers of age-related macular degeneration: advances and limitations. Neural Regen Res. 2021;16(3):440–447. doi:10.4103/1673-5374.293131
13. Sun J, Wang J, Lu W, et al. MiR-325-3p inhibits renal inflammation and fibrosis by targeting CCL19 in diabetic nephropathy. Clin Exp Pharmacol Physiol. 2020;47(11):1850–1860. doi:10.1111/1440-1681.13371
14. Baulida J, Díaz VM, García de Herreros A. Snail1: a transcriptional factor controlled at multiple levels. J Clin Med. 2019;8(6):757. doi:10.3390/jcm8060757
15. Grande MT, Sánchez-Laorden B, López-Blau C, et al. Snail1-induced partial epithelial-to-mesenchymal transition drives renal fibrosis in mice and can be targeted to reverse established disease. Nat Med. 2015;21(9):989–997. doi:10.1038/nm.3901
16. Vodošek Hojs N, Bevc S, Ekart R, et al. Oxidative stress markers in chronic kidney disease with emphasis on diabetic nephropathy. Antioxidants (Basel). 2020;9(10). doi:10.3390/antiox9100925.
17. Zhang J, Jiang T, Liang X, et al. lncRNA MALAT1 mediated high glucose-induced HK-2 cell epithelial-to-mesenchymal transition and injury. J Physiol Biochem. 2019;75(4):443–452. doi:10.1007/s13105-019-00688-2
18. Ge X, Xu B, Xu W, et al. Long noncoding RNA GAS5 inhibits cell proliferation and fibrosis in diabetic nephropathy by sponging miR-221 and modulating SIRT1 expression. Aging (Albany NY). 2019;11(20):8745–8759. doi:10.18632/aging.102249
19. Yi H, Peng R, Zhang LY, et al. LincRNA-Gm4419 knockdown ameliorates NF-kappaB/NLRP3 inflammasome-mediated inflammation in diabetic nephropathy. Cell Death Dis. 2017;8(2):e2583. doi:10.1038/cddis.2016.451
20. Bartel DP. Metazoan MicroRNAs. Cell. 2018;173:20–51.
21. Jonas S, Izaurralde E. Towards a molecular understanding of microRNA-mediated gene silencing. Nat Rev Genet. 2015;16(7):421–433. doi:10.1038/nrg3965
22. Kato M, Zhang J, Wang M, et al. MicroRNA-192 in diabetic kidney glomeruli and its function in TGF-beta-induced collagen expression via inhibition of E-box repressors. Proc Natl Acad Sci U S A. 2007;104(9):3432–3437. doi:10.1073/pnas.0611192104
23. Kato M. Target RNA-directed microRNA degradation; which controls which? Noncoding RNA Investig. 2018;2. doi:10.21037/ncri.2018.11.01
24. Shi CY, Kingston ER, Kleaveland B, et al. The ZSWIM8 ubiquitin ligase mediates target-directed microRNA degradation. Science. 2020;370(6523). doi:10.1126/science.abc9359.
25. Wu Y, Wang Y, Lin Y, et al. Dub3 inhibition suppresses breast cancer invasion and metastasis by promoting Snail1 degradation. Nat Commun. 2017;8(1):14228. doi:10.1038/ncomms14228
26. Yu S, Zhang Y, Li Q, et al. CLDN6 promotes tumor progression through the YAP1-snail1 axis in gastric cancer. Cell Death Dis. 2019;10(12):949. doi:10.1038/s41419-019-2168-y
27. Dong R, Yu J, Yu F, et al. IGF-1/IGF-1R blockade ameliorates diabetic kidney disease through normalizing Snail1 expression in a mouse model. Am J Physiol Endocrinol Metab. 2019;317(4):E686–E698. doi:10.1152/ajpendo.00071.2019
 © 2021 The Author(s). This work is published and licensed by Dove Medical Press Limited. The full terms of this license are available at https://www.dovepress.com/terms.php and incorporate the Creative Commons Attribution - Non Commercial (unported, v3.0) License.
By accessing the work you hereby accept the Terms. Non-commercial uses of the work are permitted without any further permission from Dove Medical Press Limited, provided the work is properly attributed. For permission for commercial use of this work, please see paragraphs 4.2 and 5 of our Terms.
© 2021 The Author(s). This work is published and licensed by Dove Medical Press Limited. The full terms of this license are available at https://www.dovepress.com/terms.php and incorporate the Creative Commons Attribution - Non Commercial (unported, v3.0) License.
By accessing the work you hereby accept the Terms. Non-commercial uses of the work are permitted without any further permission from Dove Medical Press Limited, provided the work is properly attributed. For permission for commercial use of this work, please see paragraphs 4.2 and 5 of our Terms.