")
Back to Journals » Cancer Management and Research » Volume 12
LncRNA PLAC2 Positively Regulates CDK2 to Promote Ovarian Carcinoma Cell Proliferation
Authors He Y, Wei L, Zhang S, Liu H, Fang F, Li Y
Received 18 December 2019
Accepted for publication 17 May 2020
Published 12 July 2020 Volume 2020:12 Pages 5713—5720
DOI https://doi.org/10.2147/CMAR.S242781
Checked for plagiarism Yes
Review by Single anonymous peer review
Peer reviewer comments 2
Editor who approved publication: Dr Sanjeev K. Srivastava
Yuanqi He,1 Liqun Wei,1 Shihong Zhang,1,2 Haining Liu,1 Fang Fang,1 Yue Li1
1Department of Gynaecology and Obstetrics, Weihai Municipal Hospital, Cheeloo College of Medicine, Shandong University, Weihai, Shandong Province, 264200, People’s Republic of China; 2Department of Gynaecology and Obstetrics, Affiliated Hospital of Beihua University, Jilin City, Jilin Province 132000, People’s Republic of China
Correspondence: Shihong Zhang
Department of Gynecology and Obstetrics, Weihai Municipal Hospital,Cheeloo College of Medicine, Shandong University, 70 Heping Road, Huancui District, Weihai, Shandong Province 264200, People’s Republic of China
Tel +86-631-5289120
Email [email protected]
Background: PLAC2 has been reported to participate in glioma, but its role in ovarian carcinoma (OC) is unclear. This study investigated the role of lncRNA PLAC2 in OC.
Methods: A 5-year follow-up study of 64 patients was carried out in Weihai Municipal Hospital after the admission of patients. A total of 64 OC patients were selected from 178 OC patients admitted in the aforementioned hospital from August 2011 to January 2014. Cell transfections, cell cycle analysis, cell proliferation assay and Western blot were carried out during the research.
Results: The expression levels of PLAC2 and CDK2 were both upregulated in OC and they were positively correlated. During the 5-year follow-up, patients with high levels of PLAC2 and CDK2 showed significantly lower overall survival rate. In OC cells, overexpression of PLAC2 resulted in upregulated, while silencing of PLAC2 resulted in downregulated expression of CDK2. Cell proliferation assay showed that overexpression of PLAC2 resulted in increased, while silencing of PLAC2 resulted in decreased proliferation rate of OC cells. In addition, overexpression of CDK2 attenuated the effects of silencing of PLAC2.
Conclusion: PLAC2 positively regulates CDK2 to promote OC cell proliferation.
Keywords: ovarian carcinoma, CDK2, PLAC2, survival
Introduction
As the most common type of gynecological malignancies, ovarian carcinoma (OC) is a major cause of cancer-related deaths and its incidence in recent years is continuously increasing.1 OC is responsible for more than 150,000 deaths worldwide annually and this number is getting bigger and bigger every year.2 OC patients are mostly diagnosed at advanced stages because of the lack of specific and effective early diagnosis methods.3 Chemotherapy and cytoreduction are widely used in the treatment of advanced OC patients, while treatment failure frequently occurs due to drug resistance.4 Moreover, more than 70% of OC patients experience relapse after treatment and most recurrent OC patients die within 1 year.5
Inhibition of the accelerated cell cycle progression is a promising therapeutic approach for cancer treatment.6,7 Cell proliferation is an essential mechanism for all aspects of cancer biology, such as cancer growth, regeneration and development.8 Therefore, it is necessary to inhibit cell phase transitions to inhibit cancer progression.6–8 In cell cycle progression, cyclin-dependent kinases (CDKs), such as CDK2, can bind cyclins to promote cell phase transition.9 Besides, CDK2 also interacts with other factors, such as the STAT signaling pathway to regulate cell division.10 A recent study reported that lncRNA PLAC2 can interact with the STAT signaling pathway in glioma to promote cancer progression. In addition, our preliminary RNA-seq analysis also revealed the positive correlation between the expression of PLAC2 and CDK2 mRNA (data not shown), suggesting the potential interaction between them. This study aimed to investigate the role of PLAC2 in OC and its interaction with CDK2.
Materials and Methods
OC Patients and the 5-Year Follow-Up
A 5-year follow-up of 64 patients was carried out in Weihai Municipal Hospital after their admission. A total of 64 OC patients (age range of 32 to 65 years old, mean age of 48.1 ± 5.1 years old) were selected from 178 OC patients admitted by aforementioned hospital from August 2011 and January 2014. Inclusion criteria: 1) medical record showed no initiated therapies within 3 months before the date of admission; 2) new OC cases diagnosed by pathologists; 3) completed the 5-year follow-up. Exclusion criteria: 1) recurrent cases; 2) previous history of malignancies; 3) died of causes other than OC during follow-up. The 64 patients were staged according to AJCC criteria, and 12, 14, 22 and 16 cases were classified into stage I–IV, respectively. The 64 patients included 20 cases of serous subtype, 17 cases of mucinous subtype, and 27 cases of endometrioid subtype. According to patients’ clinical state and health conditions, surgical resection, chemotherapy, radiotherapy or combined therapies were performed. This study was approved by Ethics Committee of Weihai Municipal Hospital. The study followed the principles of the Declaration of Helsinki. The nature and possible consequences of the study were explained to patients and all patients and controls signed the informed written consent.
OC Specimens and Cells
OC tumor tissues and paired non-tumor (3 cm around tumors) tissues were collected from each patient through biopsy. All tissue specimens passed histopathological exams and all tissues were confirmed. The weight of each specimen ranged from 0.01 to 0.015 g. The human OC cell line UWB1.289 (ATCC, USA) was used in this study. UWB1.289 cells were cultivated at 37°C in the mixture of RPMI-1640 Medium (50%) and MEGM medium (50%) containing 3% FBS in a 5% CO2 incubator.
Transfections
Transient transfections were performed to alter gene expression. PLAC2 siRNA and negative control siRNA were synthesized by GenePharma (Shanghai, China). CDK2 and PLAC2 expression vectors (pcDNA3.1) were constructed by Sangon (Shanghai, China). Lipofectamine 2000 (Thermo Fisher Scientific) was used to transfect 40 nM PLAC2 siRNA, or 40 nM negative control siRNA (negative control group, NC), or 15 nM CDK2 or PLAC2 expression vector, or 15 nM empty pcDNA3.1 vector (NC) into 106 cells. Cells without transfections were used as the Control (C) cells. Following experiments were performed at 24 h post-transfections.
RNA Extractions and RT-qPCR
Total RNAs were extracted from tissues (0.1g tissue ground in liquid nitrogen) and 105 UWB1.289 cells with 0.4 mL RNAzol reagent (Sigma-Aldrich, USA). RNA samples were digested with DNase I at 37°C for 1 hr to remove genomic DNAs. Reverse transcriptions were performed to synthesize cDNA using AMV Reverse Transcriptase (NEB, USA). PCR mixtures were prepared using YBR® Green master mix (Takara, Japan). The expression levels of CDK2 and PLAC2 were measured with GAPDH as endogenous control. All reactions were repeated 3 times and data normalizations were performed using 2−ΔΔCT method.
Cell Cycle Analysis
UWB1.289 cells were subjected to trypsinization. Following washing using pre-cold PBS, 105 cells from each transfection group were incubated with 2 mL ethanol (75%) at 4°C for 4 h. After that, cells were washed with pre-cold PBS, followed by staining using BD Pharmingen™ PI/RNase at 22°C for 30 min. Cells at different cell phases were separated using flow cytometer, and 105 events were counted.
Cell Proliferation Assay
UWB1.289 cells were subjected to trypsinization, and 5×10⁴ cells were dissolved in aforementioned cell culture medium to make single-cell suspensions. Cells were seeded onto a 96-well plate (0.1 mL cell suspension per well). UWB1.289 cells were cultivated at 37°C in a 5% CO2 incubator, and 10 µL CCK-8 solution (Sigma,-Aldrich, USA) was added into each well at 4 h before the termination of cell culture. Following the addition of 5 µL DMSO, OD values were measured at 450 nm.
Western Blot
UWB1.289 cells were mixed with RIPA solution (Thermo Fisher Scientific) to extract total proteins. All proteins were boiled in water for 2 h and electrophoresis (10% -PAGE gel) was carried out. Proteins were transferred to PVDF membrane, followed by incubation with 5% non-fat milk at room temperature for 2 h. Membranes were incubated with GAPDH (ab9485, 1:900, Abcam) and CDK2 (ab32147, 1:900, Abcam) rabbit polyclonal primary antibodies (4°C overnight). After that, HRP goat anti-rabbit (IgG) secondary antibody (ab6721, 1:900, Abcam) was used to further incubate with the membranes at room temperature for 2 h. Signals were developed using ECL (Sigma-Aldrich, USA). Gray values were normalized using Image J v1.46 software.
Colony Formation Assay
In the colony formation assay, 400 cells were seeded into 6-well plates and cultured at 37°C for 10 d. The colonies were then fixed with methanol and stained with hematoxylin.
In vivo Experiments
9 BALB/nude mice (aged 6 weeks) were purchased from Vital River (Beijing, China) and housed within a dedicated SPF facility. The nude mice were injected subcutaneously with UWB1.289 cells (5×10⁶ cells, in 100 μL of PBS) into the right flanks of mice. LncRNA PLAC2 shRNA, CDK2 and vector control were directly injected into the mice. Tumor size was measured weekly for 4 weeks according to the equation: (length × width^2)/2. At the end of the experiments, the mice were sacrificed for the collection of tumors. Each tumor was then weighed. All procedures performed in studies involving animals were in accordance with the ethical standards of Weihai Municipal Hospital which the studies were conducted.
Statistical Analysis
All data analyses in this study were performed using mean values, which were calculated using data from 3 biological replicates. Paired t test was used to explore differences between non-tumor and OC patients. One-way ANOVA and Tukey’s test were used to explore differences among multiple cell groups. Correlations were analyzed by linear regression. The patients were divided into high (n = 31) and low (n = 33) CDK2 groups as well as high (n = 30) and low (n = 34) PLAC2 groups with the Youden’s index of the ROC curve of the expression levels of CDK2 mRNA and PLAC2 in OC tissues as cutoff values, respectively. Kaplan-Meier plotter was used to draw survival curves. Long-rank test was used to compare survival curves. P < 0.05 was considered as statistically significant.
Results
PLAC2 and CDK2 Were Upregulated in OC and Positively Correlated
The expression levels of PLAC2 and CDK2 were measured by RT-qPCR. Expression data were compared (non-tumor vs OC) by performing ANOVA (one-way) and Tukey’s test. It was observed that the expression levels of PLAC2 (Figure 1A) and CDK2 (Figure 1B) were significantly higher in OC tissues in comparison to that in non-tumor tissues (p < 0.05). Correlations between PLAC2 and CDK2 were analyzed by linear regression. It was found that the expression of PLAC2 and CDK2 were positively correlated in OC tissues (Figure 1C), but not in non-tumor tissues (Figure 1D). The significant correlation between PLAC2 and CDK2 indicated the potential interaction between them.
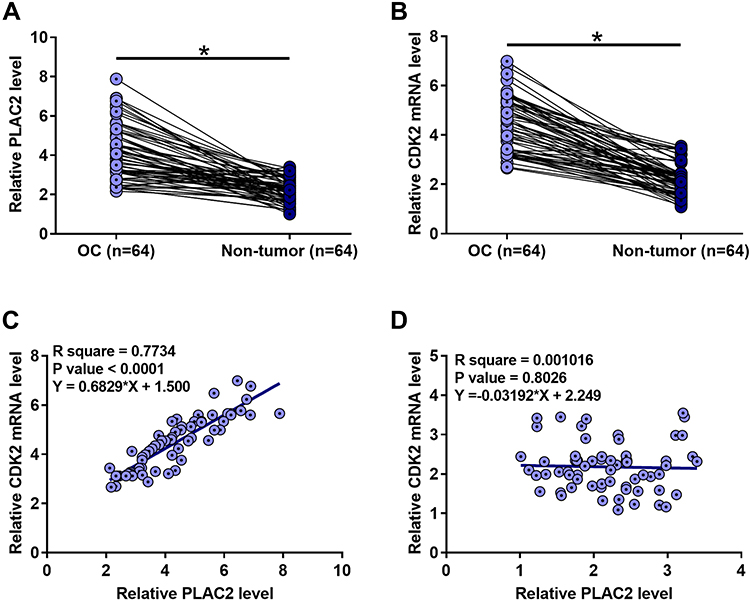 |
Figure 1 PLAC2 and CDK2 were upregulated in OC and positively correlated. The expression levels of PLAC2 and CDK2 measured by RT-qPCR and compared (non-tumor vs OC) by ANOVA (one-way) and Tukey’s test. The expression levels of PLAC2 (A) and CDK2 (B) were significantly higher in OC tissues compared to non-tumor tissues (*p < 0.05). Linear regression showed that PLAC2 and CDK2 were positively correlated in OC tissues (C), but not in non-tumor tissues (D). |
High Expression Levels of PLAC2 and CDK2 Predicted Poor Survival of OC Patients
Survive curves were plotted and compared. Compared to patients in high PLAC2 (n = 30) level group, patients in low PLAC2 (n = 34) level group showed a significantly higher 5-year overall survival rate (Figure 2A). Moreover, the 5-year overall survival rate was also significantly higher in low CDK2 (n = 33) level group than that in high CDK2 (n = 31) level group (Figure 2B). These data suggested that high expression levels of PLAC2 and CDK2in OC tissues might predict the poor survival of OC patients.
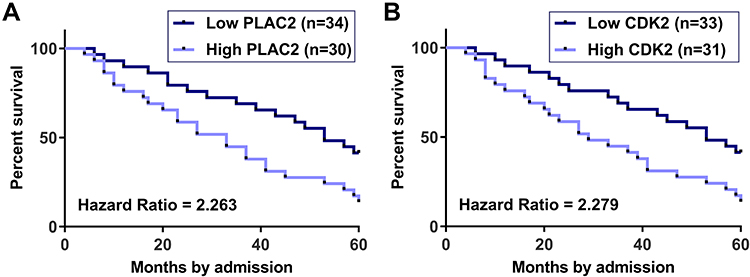 |
Figure 2 High expression levels of PLAC2 and CDK2 predicted poor survival of OC patients. Survival curve comparison showed that high levels of PLAC2 (A) and CDK2 (B) were significantly correlated with low overall survival rate. |
PLAC2 Positively Regulated CDK2 in OC Cells
PLAC2 expression vector and PLAC2 siRNA were transfected into UWB1.289 cells. Significantly altered expression of PLAC2 was observed at 24 h post-transfection compared to C and NC groups, indicating that the transfections were successful (Figure 3A, p < 0.05). Moreover, compared to the C and NC two groups, overexpression of PLAC2 resulted in significant upregulated expression of CDK2 (Figure 3B), while silencing of PLAC2 resulted in downregulated (Figure 3C) expression of CDK2 (p < 0.05). Therefore, PLAC2 might function as a positive regulator of CDK2 in OC cells.
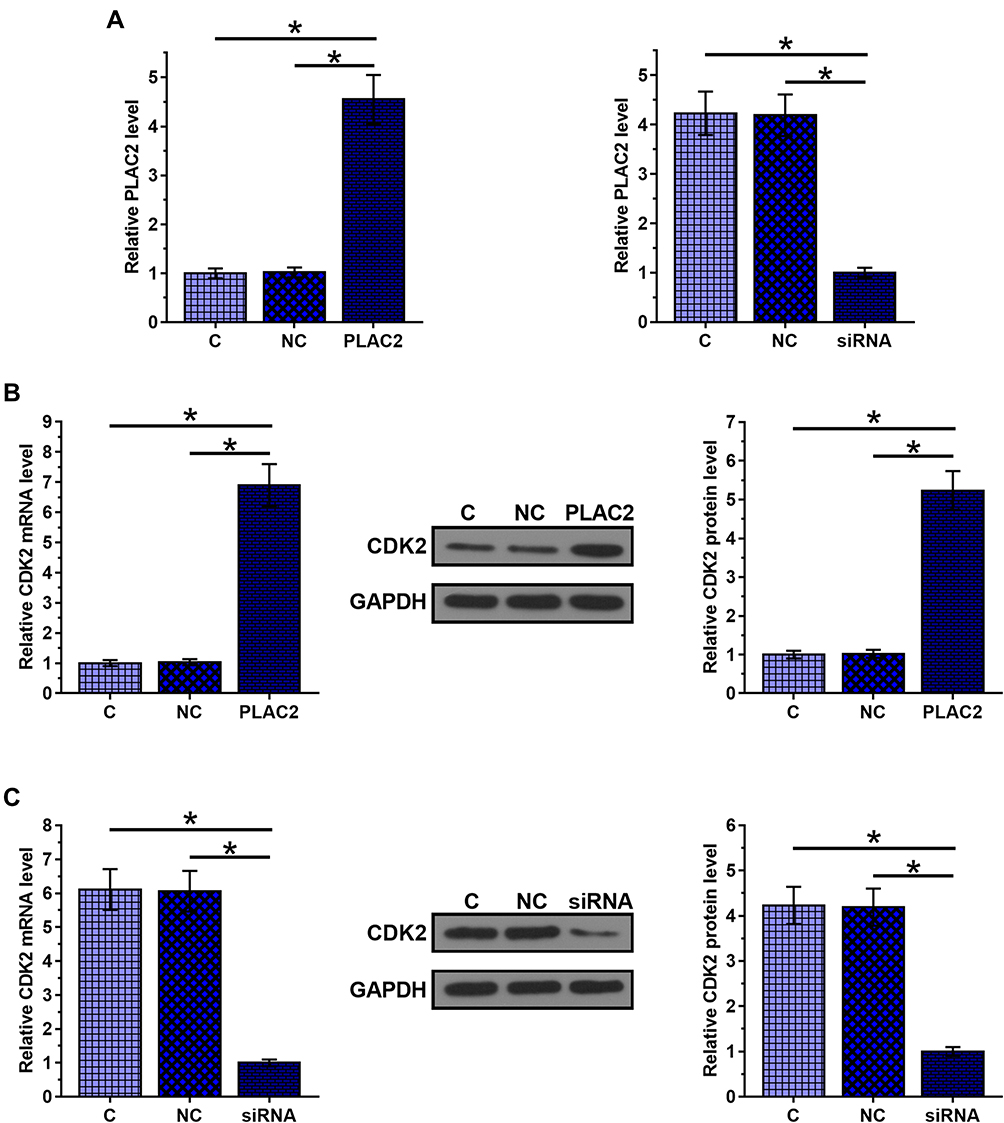 |
Figure 3 PLAC2 positively regulated CDK2 in OC cells. Significantly altered expression of PLAC2 was observed at 24 h after the transfections of PLAC2 expression vector and PLAC2 siRNA compared to C and NC groups (A). PLAC2 overexpression resulted in upregulated (B), while silencing of PLAC2 resulted in downregulated (C) expression of CDK2 (*p < 0.05). |
PLAC2 Positively Regulated OC Cell Proliferation Through Regulation of Cell Cycle Progression
Compared to C and NC groups, overexpression of PLAC2 resulted in decreased percentage of OC cells at S1 phase, while silencing of PLAC2 resulted in increased percentage of OC cells at S1 phase (Figure 4A, p < 0.05). In contrast, overexpression of PLAC2 resulted in increased, while silencing of PLAC2 resulted in decreased percentage of OC cells at S2 phase. Consistently, CCK-8 and colony formation analysis indicated that overexpression of PLAC2 resulted in increased proliferation rate of OC cells, while silencing of PLAC2 resulted in decreased proliferation rate of OC cells (Figure 4B and C, p < 0.05). In addition, co-transfection experiments showed that overexpression of CDK2 attenuated the effects of silencing of PLAC2 on cell cycle progression and proliferation. Therefore, PLAC2 may promote OC cell cycle progression by positively regulating the expression of CDK2, thereby promoting cell proliferation.
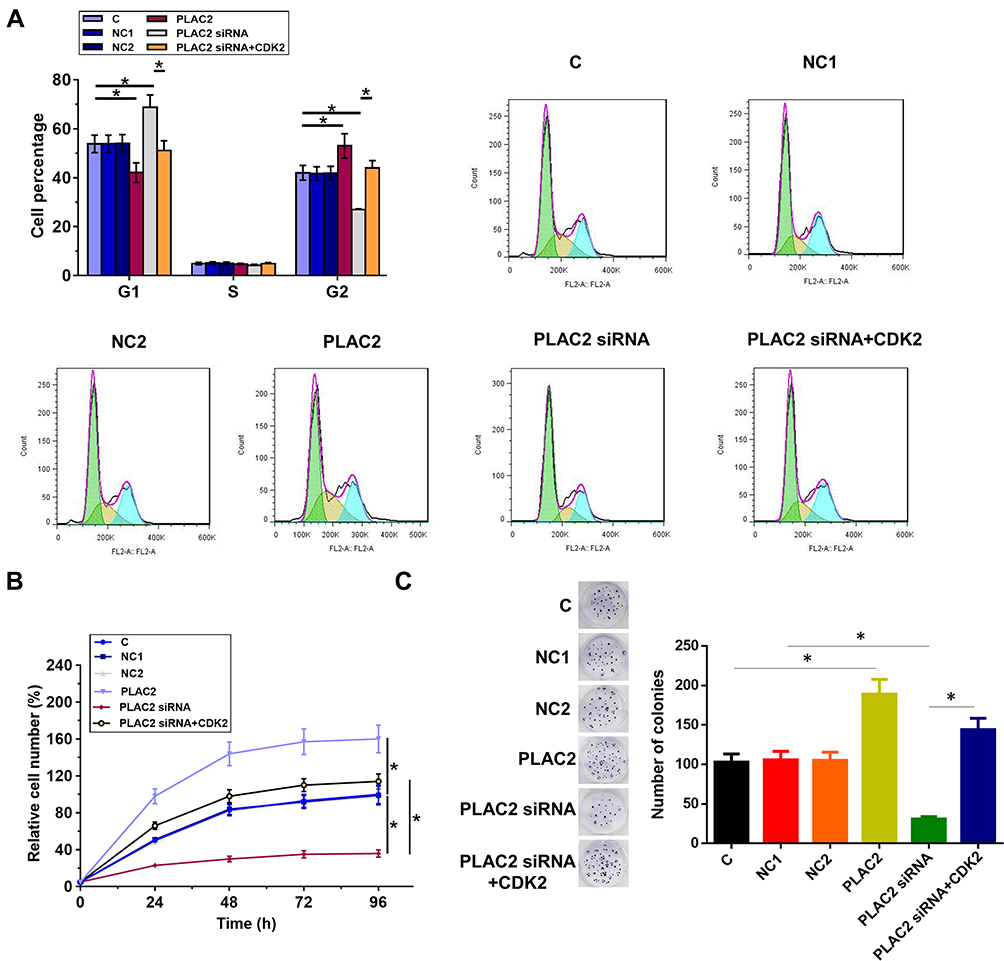 |
Figure 4 PLAC2 positively regulated OC cell proliferation through cell cycle progression regulation. The effects of overexpression of PLAC2 and CDK2 as well as silencing of PLAC2 on cell cycle progression was analyzed by cell cycle (A). The CCK-8 assay to determine cell viabilities (B). The colony formation was used to determine cell proliferation (C). Data were compared by performing ANOVA (one-way) and Tukey’s test (*p < 0.05). |
Silencing of CDK2 Ameliorated the Severity of Ovarian Cancer and PLAC2 Promoted Tumorigenesis in vivo
Whether PLAC2 had the tumor-forming ability was then evaluated in vivo. Xenograft tumor model showed that overexpression of PLAC2 promoted the subcutaneous tumor growth of OC cells, but knockdown of CDK2 significantly reduced the effects (Figure 5A–C). We further found that restoration of PLAC2 expression partially rescued the inhibition of tumor growth by silencing of CDK2.
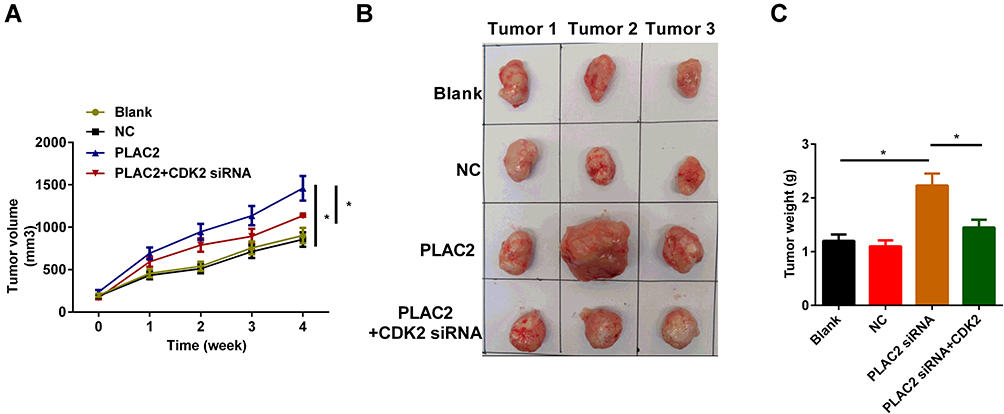 |
Figure 5 Silencing of CDK2 ameliorated the severity of ovarian cancer and PLAC2 promoted tumorigenesis in vivo. (A) Measurements of tumor volumes every 1 week for 4 weeks. (B) Representative images of neoplasms from each group of nude mice. (C) Determination of tumor weights. Data are denoted by means ± standard deviation (SD) (*p < 0.05). |
Discussion
This study mainly investigated the functionality of PLAC2 in OC. We found that PLAC2 not only promotes cancer cell progression but also had prognostic values for OC. The actions of PLAC2 in OC are likely mediated by the interactions with CDK2.
It is worth noting that our study observed opposite functions of PLAC2 in OC compared to its functionality in glioma.11 In glioma, PLAC2 blocks cell cycle progression and inhibits cancer cell proliferation.11 In contrast, our study showed that PLAC2 was upregulated in OC and promoted cell cycle progression and cell proliferation of OC cells. It is known that different types of cancer may have different pathogenesis that involves different signaling pathways.12 In addition, the same gene or lncRNA may have opposite expression patterns and functions in different types of cancer. For example, TUG1 was upregulated in colon cancer and regulate cancer cell behaviors to promote colon cancer progression.13 In contrast, in glioma, TUG1 is downregulated and plays a tumor-suppressive role.14
In this study, we found that PLAC2 can positively regulate the expression of CDK2. The interactions between CDK2 and lncRNAs have been widely reported in previous studies. LncRNA UCA1 regulates the CDK2 signaling to participate in the cell growth and the development of tumorigenesis.15 LINC00958 promotes gliomagenesis by indirectly regulating CDK2 through miR-203.16 We did not characterize the mechanism mediates the interaction between PLAC2 and CDK2. It is known that PLAC2 has interactions with the STAT1 signaling and CDKs can respond to the activation of STATs.10 Therefore, STAT1, or other STATs may mediate the interactions between PLAC2 and CDK2. Our future studies will investigate this possibility in OC. Our study is limited by the lack of animal model experiments. Our future studies will try to include in vivo animal experiments to further confirm our conclusions.
Conclusions
In conclusion, PLAC2 was upregulated in OC and promoted cancer cell proliferation by inducing cell cycle progression through the positive regulation of CDK2.
Disclosure
The authors declare that they have no competing interests.
References
1. Menon U, Gentry-Maharaj A, Jacobs I. Ovarian cancer screening and mortality. JAMA. 2011;306(14):
2. Di Lorenzo G, Ricci G, Severini GM, Romano F, Biffi S. Imaging and therapy of ovarian cancer: clinical application of nanoparticles and future perspectives. Theranostics. 2018;8(16):4279–4294. doi:10.7150/thno.26345
3. Webb PM, Jordan SJ. Epidemiology of epithelial ovarian cancer. Best Pract Res Clin Obstet Gynaecol. 2017;41:3–14. doi:10.1016/j.bpobgyn.2016.08.006
4. Tan J. Targeting resistance. Cell. 2016;166(3):523. doi:10.1016/j.cell.2016.07.017
5. Itamochi H. Targeted therapies in epithelial ovarian cancer: molecular mechanisms of action. World J Biol Chem. 2010;1(7):209–220. doi:10.4331/wjbc.v1.i7.209
6. Vermeulen K, Van Bockstaele DR, Berneman ZN. The cell cycle: a review of regulation, deregulation and therapeutic targets in cancer. Cell Prolif. 2003;36(3):131–149. doi:10.1046/j.1365-2184.2003.00266.x
7. Altieri DC. Survivin in apoptosis control and cell cycle regulation in cancer. Prog Cell Cycle Res. 2003;5:447–452.
8. Diaz-Moralli S, Tarrado-Castellarnau M, Miranda A, Cascante M. Targeting cell cycle regulation in cancer therapy. Pharmacol Ther. 2013;138(2):255–271. doi:10.1016/j.pharmthera.2013.01.011
9. Malumbres M, Barbacid M. Cell cycle, CDKs and cancer: a changing paradigm. Nat Rev Cancer. 2009;9(3):153–166. doi:10.1038/nrc2602
10. Chen X, Oh SW, Zheng Z, Chen HW, Shin HH, Hou SX. Cyclin D-Cdk4 and cyclin E-Cdk2 regulate the Jak/STAT signal transduction pathway in drosophila. Dev Cell. 2003;4(2):179–190. doi:10.1016/S1534-5807(03)00024-8
11. Hu YW, Kang CM, Zhao JJ, et al. LncRNA PLAC2 down-regulates RPL36 expression and blocks cell cycle progression in glioma through a mechanism involving STAT1. J Cell Mol Med. 2018;22(1):497–510. doi:10.1111/jcmm.13338
12. Fidler IJ. The pathogenesis of cancer metastasis: the ‘seed and soil’ hypothesis revisited. Nat Rev Cancer. 2003;3(6):453–458. doi:10.1038/nrc1098
13. Zhai HY, Sui MH, Yu X, et al. Overexpression of long non-coding RNA TUG1 promotes colon cancer progression. Med Sci Monit. 2016;22:3281–3287. doi:10.12659/MSM.897072
14. Li J, Zhang M, An G, Ma Q. LncRNA TUG1 acts as a tumor suppressor in human glioma by promoting cell apoptosis. Exp Biol Med (Maywood). 2016;241(6):644–649. doi:10.1177/1535370215622708
15. Hu JJ, Song W, Zhang SD, et al. HBx-upregulated lncRNA UCA1 promotes cell growth and tumorigenesis by recruiting EZH2 and repressing p27Kip1/CDK2 signaling. Sci Rep. 2016;6:23521. doi:10.1038/srep23521
16. Guo E, Liang C, He X, et al. Long noncoding RNA LINC00958 accelerates gliomagenesis through regulating miR-203/CDK2. DNA Cell Biol. 2018;37(5):465–472. doi:10.1089/dna.2018.4163
 © 2020 The Author(s). This work is published and licensed by Dove Medical Press Limited. The full terms of this license are available at https://www.dovepress.com/terms.php and incorporate the Creative Commons Attribution - Non Commercial (unported, v3.0) License.
By accessing the work you hereby accept the Terms. Non-commercial uses of the work are permitted without any further permission from Dove Medical Press Limited, provided the work is properly attributed. For permission for commercial use of this work, please see paragraphs 4.2 and 5 of our Terms.
© 2020 The Author(s). This work is published and licensed by Dove Medical Press Limited. The full terms of this license are available at https://www.dovepress.com/terms.php and incorporate the Creative Commons Attribution - Non Commercial (unported, v3.0) License.
By accessing the work you hereby accept the Terms. Non-commercial uses of the work are permitted without any further permission from Dove Medical Press Limited, provided the work is properly attributed. For permission for commercial use of this work, please see paragraphs 4.2 and 5 of our Terms.