")
Back to Journals » Journal of Inflammation Research » Volume 14
LncRNA NEAT1 Promote Inflammatory Responses in Coronary Slow Flow Through Regulating miR-148b-3p/ICAM-1 Axis
Authors Zhu Q, Zhao C, Wang Y, Li X, Xue Y, Ma C
Received 25 March 2021
Accepted for publication 13 May 2021
Published 9 June 2021 Volume 2021:14 Pages 2445—2463
DOI https://doi.org/10.2147/JIR.S312583
Checked for plagiarism Yes
Review by Single anonymous peer review
Peer reviewer comments 2
Editor who approved publication: Professor Ning Quan
Qing Zhu,1 Cuiting Zhao,1 Yonghuai Wang,1 Xinxin Li,1 Yixue Xue,2– 4 Chunyan Ma1
1Department of Cardiovascular Ultrasound, The First Hospital of China Medical University, Shenyang, People’s Republic of China; 2Department of Neurobiology, School of Life Sciences, China Medical University, Shenyang, People’s Republic of China; 3Key Laboratory of Cell Biology, Ministry of Public Health of China, China Medical University, Shenyang, People’s Republic of China; 4Key Laboratory of Medical Cell Biology, Ministry of Education of China, China Medical University, Shenyang, People’s Republic of China
Correspondence: Chunyan Ma
Department of Cardiovascular Ultrasound, The First Hospital of China Medical University, No. 155 Nanjingbei Street, Shenyang, Liaoning, 110001, People’s Republic of China
Tel +86 2483282129
Email [email protected]
Background: Coronary slow flow (CSF) is an angiographic phenomenon characterized by delayed coronary opacification with normal or near-normal epicardial coronary arteries. The pathogenesis of CSF is closely related to inflammatory response. Accumulating evidence shows that long non-coding RNAs (lncRNAs) play an important role in cardiovascular disease. However, the mechanism underlying the influence of the lncRNA nuclear enriched abundant transcripts 1 (NEAT1) on CSF is still unknown.
Patients and Methods: Forty CSF patients and forty control subjects were included in the study and underwent coronary angiography, Seattle angina questionnaire (SAQ) and echocardiography. The plasma levels of the inflammatory factors soluble intercellular adhesion molecule-1 (sICAM-1), interleukin-6 (IL-6) and tumor necrosis factor alpha (TNF-α) were determined by ELISA. The expression levels of NEAT1, miR-148b-3p and ICAM-1 in cells were measured by qRT-PCR or Western blotting. Cell proliferation was measured by 5‐Ethynyl‐2ʹ‐deoxyuridine (EdU) and Cell Counting Kit-8 (CCK-8) assay. Cell apoptosis was detected by apoptosis assay. The relationship between NEAT1 and miR-148b-3p was verified by luciferase reporter gene assay, RNA immunoprecipitation (RIP) assay and avidin-biotin pull-down assay. The relationship between ICAM-1 and miR-148b-3p was verified by luciferase reporter gene assay and avidin-biotin pull-down assay.
Results: This study showed that plasma sICAM-1, miR-148b-3p, and NEAT1 as independent predictors of a CSF diagnosis. Furthermore, plasma NEAT1 level showed superior diagnostic ability for CSF compared with sICAM-1 and miR-148b-3p. It was also shown that high expression of NEAT1 in oxygen-glucose deprivation (OGD)-treated human umbilical vein endothelial cells (HUVECs) functions as a competing endogenous RNA (ceRNA). By specifically binding miR-148b-3p, it weakened the negative regulatory effects of miR-148b-3p on the ICAM-1 target gene leading to upregulated expression of ICAM-1. This interaction was also shown to inhibit HUVEC proliferation and enhance apoptosis.
Conclusion: This study demonstrated for the first time the important mechanism of action of the NEAT1/miR-148b-3p/ICAM-1 axis in the progression of CSF disease, and indicated the potential of NEAT1, miR-148b-3p, and ICAM-1 as a new target for the diagnosis and treatment of CSF.
Keywords: coronary slow flow, ncRNA, inflammation, biomarkers, cell biology
Introduction
Coronary slow flow (CSF) is an angiographic phenomenon characterized by delayed coronary opacification with normal or near-normal epicardial coronary arteries. Clinical studies have shown that 80–90% of CSF patients experience recurrent chest pain, and 33% of patients require subsequent hospitalized for treatment, which seriously affects their quality of life. In addition, 2.5% of patients have a poor prognosis and may have critical events, including sudden death.1,2 The pathogenesis of CSF is unclear, and it is currently believed to be related to factors such as inflammation, reduced vascular endothelial function, abnormal microvascular reserve function, early atherosclerosis lesion and genetic factors.3–6 Among these factors, the role of inflammation in the occurrence and development of CSF is recognized by most researchers,7–10 although the mechanism remains to be established. Due to the unclear pathogenesis of CSF, biomarkers closely related to the development, diagnosis and treatment of CSF have not been identified for use in clinical practice.
Leukocyte exudation is one of the most important features of the inflammatory process, which includes the adhesion of leukocytes to vascular endothelial cells. Intercellular adhesion molecule-1 (ICAM-1), an adhesion molecule of the immunoglobulin superfamily, is a single-chain transmembrane glycoprotein of 90–115 kDa, expressed in vascular endothelial cells, macrophages, smooth muscle and dendritic cells, which plays an important role in the adhesion of leukocytes and the migration of transendothelial cells. Studies have shown that ICAM-1 enhances the adhesion between leukocytes, inflammatory cells and endothelial cells through specific binding to receptors such as lymphocyte function associated antigen-1 and macrophage surface antigen-1, and promotes endothelial cell activation. An increased level of soluble ICAM-1 (sICAM-1) level is considered to be a biomarker of inflammation and endothelial activation, and plays an important role in a variety of cardiovascular diseases.11
MicroRNAs (miRNAs) can be targeted bind to the 3ʹ-untranslated region (UTR) of target genes to negatively regulate their expression, thereby regulating changes in cell function. Studies have shown that some abnormally expressed miRNAs play an important role in the regulation of vascular inflammation in cardiovascular diseases such as coronary atherosclerosis.12,13 MiR-148b-3p, is a member of the miR-148/152 family, which is involved in the regulation of tumor growth, apoptosis, proliferation and angiogenesis.14 Furthermore, studies have confirmed that miR-148b-3p also has an important role in inhibiting inflammation through its ability to function as a negative regulator of inflammatory genes and exert anti-inflammatory effects.15 In cardiovascular and cerebrovascular diseases, miR-148b-3p also plays an important role, and its expression is reduced in acute ischemic stroke and transient cerebral ischemia gerbil models.16,17 Reduced expression of miR-148b-3p has been identified in adult IgA vasculitis18 and it has also been confirmed as a potential marker of heart failure in patients with atrial fibrillation and mitral regurgitation.19,20 However, the role of miR-148b-3p in CSF has not yet been reported.
In the human genome, more than 90% of genes can be transcribed, while the genes encoding proteins account for only 2%.21 Most are transcribed into non-protein-coding RNAs longer than 200 nucleotides known as long non-coding RNA (lncRNA). LncRNAs are widely expressed in eukaryotic organisms, and can serve as a “miRNA molecular sponge” to participate in the formation of a competitive endogenous RNA network, and regulate gene expression by combining with miRNAs. In this way, lncRNAs play an important regulatory role in various cardiovascular diseases such as hypertension, coronary atherosclerosis, and cardiomyopathy. LncRNA NEAT1 (nuclear enriched abundant transcripts 1) is a lncRNA expressed in the nucleus, which can combine with some nuclear proteins to form a nuclear substructure known as a paraspeckle.22 Studies have shown that NEAT1 expression is increased in hypoxia and ischemia-reperfusion myocardium.23,24
In this study, we aimed to provide anew theoretical and experimental basis for the occurrence and development of CSF, and to provide possible biomarkers for the diagnosis and treatment of CSF. We first detected the plasma levels of sICAM-1, miR-148b-3p and NEAT1 in CSF patients, and explored their correlation with clinical factors. We then used the oxygen-glucose deprivation (OGD) cell model to simulate the functional changes in CSF endothelial cells, and to explore the interaction between ICAM-1, miR-148b-3p and NEAT1 at the cellular level as well as the possible mechanism underlying its effect in CSF cells.
Patients and Methods
An extended material and methods section is available in the Data Supplement including information regarding quantitative real-time PCR (qRT-PCR), Western blotting (WB), reporter vector construction and luciferase reporter gene assays, RNA immunoprecipitation (RIP) assay and avidin-biotin pull-down assay.
Participants
This study included patients who received coronary angiography at the First Affiliated Hospital of China Medical University from March 2018 to September 2019, and the coronary thrombolysis in myocardial infarction frame count (TFC) was calculated. Patients with coronary angiography showing that all three coronary arteries were ≤50% stenosis were included. Patients with the following characteristics were excluded from the study: previous history of myocardial infarction, coronary artery spasm or dilation, positive exercise stress test, abnormal heart structure (congenital heart disease, valve dysfunction, hypertrophic or dilated cardiomyopathy), abnormal cardiac conduction (ventricular pre-excitation, abnormal atrioventricular conduction, bundle-branch block, atrial fibrillation, pacing rhythm), heart failure, uncontrolled hypertension, hyperthyroidism, hypothyroidism, malignant tumor, autoimmune disease, known inflammatory or immune disease, local or systemic infections, lung, liver, kidney and blood system diseases.
According to the recommendations of Gibson et al,25 the included patients were divided into the CSF group: at least one main epicardial coronary artery with TFC >27 frames and the control group: three coronary arteries with TFC ≤27 frames. All research involving humans was conducted in compliance with the Declaration of Helsinki and approved by the Institutional Review Committee of the First Affiliated Hospital of China Medical University (the approval reference number: AF-SOP-07-1.1-01). Written informed consent was obtained from all participants.
Coronary Angiography and TFC
The blood flow velocity of the coronary arteries was measured according to the TFC. TFC was calculated as the last frame minus the first frame is the exact number of coronary arteries. The first frame was defined as the point when the contrast agent begins to fill the coronary artery lumen, while the last frame is when the contrast agent reaches the distal mark of each coronary artery but does not need to completely fill the distal mark. The distal end was defined as the distal branch of the left anterior descending artery (LAD), the distal branch of the longest segment of the left circumflex artery (LCX), and the first branch of the posterolateral artery of the right coronary artery (RCA). Due to the longer LAD, the number of frames was corrected by dividing the number by dividing 1.7. The acquisition speed of coronary angiography image data in this study was 30 frames/s. The mean corrected TFC (cTFC) for each subject was calculated by dividing the sum of the obtained RCA, LCx, and cLAD TFC by three. The TFC measurements were performed by two independent cardiologists, and any differences were resolved by a third cardiologist.
Seattle Angina Questionnaire (SAQ) and Echocardiography
The SAQ was completed within 24 h before coronary angiography. Subjects were required to complete the SAQ within 5 min. The SAQ comprises 19 questions in the following five dimensions: physical limitation (Question 1), angina stability (Question 2), angina frequency (Questions 3–4), treatment satisfaction (Questions 5–8) and quality of life (Questions 9–11). Each question is scored item by item, and the score is then converted into standard points according to the following formula: standard points = (actual score - lowest score in this area)/(highest score in this area - lowest score in this area) × 100. The score ranges from 0 to 100, with higher scores reflecting fewer the symptoms and the superior functional status and quality of life of the patient.26
Echocardiographic examination was performed within 72 h after coronary angiography. An Echopac ultrasound workstation (GE Healthcare, USA) was used for offline analysis, and the following conventional echocardiographic parameters were measured: Left ventricular size and systolic function parameters – left ventricular end diastolic diameter and end systolic diameter, left ventricular end diastolic volume and end systolic volume and left ventricular ejection fraction, left ventricular global longitudinal strain (LVGLS); Left ventricular diastolic function parameters – left atrial volume index, early and late mitral valve (MV) flow velocity (E and A), early mitral annulus diastolic velocity (E’), and tricuspid regurgitation velocity. The MV E/A and E/E’ were also calculated.
Collection, Processing and Testing of Human Blood Samples
The plasma levels of the inflammatory factors sICAM-1, interleukin-6 (IL-6) and tumor necrosis factor alpha (TNF-α) were measured within 24 h before coronary angiography. Blood samples were obtained via the anterior cubital vein from patients in the morning following fasting for 12 h and stored in a test tube containing sodium citrate. The blood sample was immediately centrifuged at 3000 ×g for 15 min at 4°C to obtain a plasma sample, which was stored in a 2-mL EP tube at −80°C prior to analysis. The plasma levels of sICAM-1, IL-6 and TNF-α were measured by enzyme-linked immunosorbent assay (ELISA) according to the manufacturer’s instructions (Bioss, Beijing, China).
Cell Culture
Human umbilical vein endothelial cells (HUVECs) were purchased from BeNa Culture Collection (Being, China), and maintained in F12 medium containing 10% fetal bovine serum (FBS) (Gibco, USA), 1% endothelial cell (EC) growth factor. Human embryonic kidney (HEK) 293T cells were purchased from the Cell Resource Center of the Shanghai Institute of Biological Sciences and maintained in Dulbecco’s modified Eagle’s medium (high glucose) supplemented with 10% FBS. To determine the effect of OGD on HUVECs, a model mimicking ischemic conditions was established by exposure of cells to OGD as described previously.27 Briefly, the cells were cultured in glucose-free medium (Gibco, USA) for 48 h in a humidified atmosphere at 37°C under 5% CO2 and 3% O2. As a control, the cells were cultured in F12 medium for 48 h in a humidified atmosphere at 37°C under 5% CO2 and 95% air.
Cell Transfection
To construct a lentiviral vector for overexpression of ICAM-1, the Ubi promoter and the CDS region (1599 bp) of ICAM-1 were subcloned into the GV358 vector (Genechem, China). For knockdown lentiviral vectors, shRNA targeting ICAM-1, NEAT1, or scrambled non-targeting shRNA sequences were subcloned into the GV248 vector. The sequences of the three shRNAs targeting ICAM-1, NEAT1, or scrambled non-targeting shRNA sequences were in Table supplementary 1 (Table S1). Lentiviruses carrying these genes were produced and purified by GeneChem. Cell transfections were performed as the manufacturer’s instructions. Briefly, after 72 h of infection of the cells with the virus, stably infected cells were selected by culture with puromycin. To evaluate the effect of NEAT1 on OGD-treated HUVECs, cells were divided into three groups: control, sh-NC and sh-NEAT1 groups. To evaluate the effect of ICAM-1 on OGD-treated HUVECs, cells were divided into five groups: control, pre-ICAM-1-NC, pre-ICAM-1, sh-ICAM-1-NC and sh-ICAM-1 groups.
MiR-148b-3p mimic (5ʹ-TCAGTGCATCACAGAACTTTGT-3ʹ), miR-148b-3p inhibitor (5ʹ-ACAAAGTTCTGTGATGCACTGA-3ʹ), and the untargeted negative control shRNA (5ʹ-TTCTCCGAACGTGTCACGT-3ʹ) were synthesized (GenePharma, China) according to the manufacturer’s instructions.
Cell Counting Kit‐8 (CCK-8) Assay
Cell viability was measured using the CCK-8 method (Glpbio, USA). Cells were seeded into 96-well plates (2000 cells/well) and cultured overnight. Subsequently, 10 μL of the CCK-8 reagent was added into each well and incubated at 37°C for another 2 hours. OD at 450 nm was measured using an ELISA plate reader.
5‐Ethynyl‐2ʹ‐deoxyuridine (EdU) Assay
Cell proliferation was measured using an EdU incorporation assay (Ribobio, China). Briefly, cells were inoculated into 96-well plates (0.5 × 10⁴ cells/well) for 24 h, then EdU (10−2 mol/m3) was added and incubated at 37°C for 24 h. According to the manufacturer’s instructions, the cells were fixed in 4% formaldehyde for 30 min, and then infiltrated with 0.5% Triton X-100 for 10 min at room temperature. After washing three times with phosphate-buffered saline (PBS), the cells were treated with 100 μL 1× Apollo reaction mixture for 30 min. The DNA in the cells in each well was then stained with 100 μL Hoechst 33342 for 30 min and observed under a fluorescence microscope (Nikon, Japan). For each sample, cell proliferation was analyze using the mean cell number in three fields.
Apoptosis Assay
HUVEC apoptosis was detected using the Annexin-V-633 Apoptosis Detection Kit (Dojindo, Japan). After washing twice with PBS at 4°C, the cells were trypsinized with EDTA-free trypsin and harvested by centrifugation. After discarding the supernatant, and washing with cold PBS, the cell pellet was resuspended with 1×binding buffer to a final concentration of 1×10⁶ cells/mL, followed by the addition of 10 μL annexin V-633. The cells were then incubated for 15 min in the dark before adding 400 μL of 1× binding buffer. Within 1 h, apoptotic cells were detected by flow cytometry (BD Biosciences, USA) and analyzed using software (BD Accuri C6, USA).
Statistical Analysis
All statistical analysis was conducted using SPSS 23.0 software (SPSS, USA). Continuous data were expressed as mean ± standard deviation, and categorical variables were expressed as frequency and percentage. The Shapiro–Wilk test was used to evaluate normal distribution of a variable. Student’s t-test was used to compare differences between continuous variables with normal distribution, and the chi-squared test was used to compare differences between categorical variables. Pearson correlation analysis was performed to evaluate the correlation between continuous variable parameters. Spearman correlation analysis was performed to evaluate the correlation between the parameters of each grade. Binary logistic regression analysis and linear regression analysis were performed to identify independent variables related to CSF. Receiver operating characteristic (ROC) curves were generated to determine the intercept value of the independent influencing factors. For all parameters, P-values < 0.05 (two-tailed) were considered to indicate statistical significance.
Results
Plasma sICAM-1 is an Independent Predictor of CSF
In total, 40 CSF patients and 40 controls were included in this study. The demographics, medical history, routine biochemical data, drug treatment, angiography results, SAQ scores and echocardiographic parameters of the study population are shown in Table 1. The TFC values of cLAD, LCX, RCA and the mean cTFC values of CSF patients were significantly higher than those of the control group (Table 1). Compared with the control group, the physical limitation score in the CSF group was significantly lower than that in the control group (Table 1). Compared with the control group, the LVGLS, MV E and MV E/A of CSF patients were significantly reduced (Table 1).
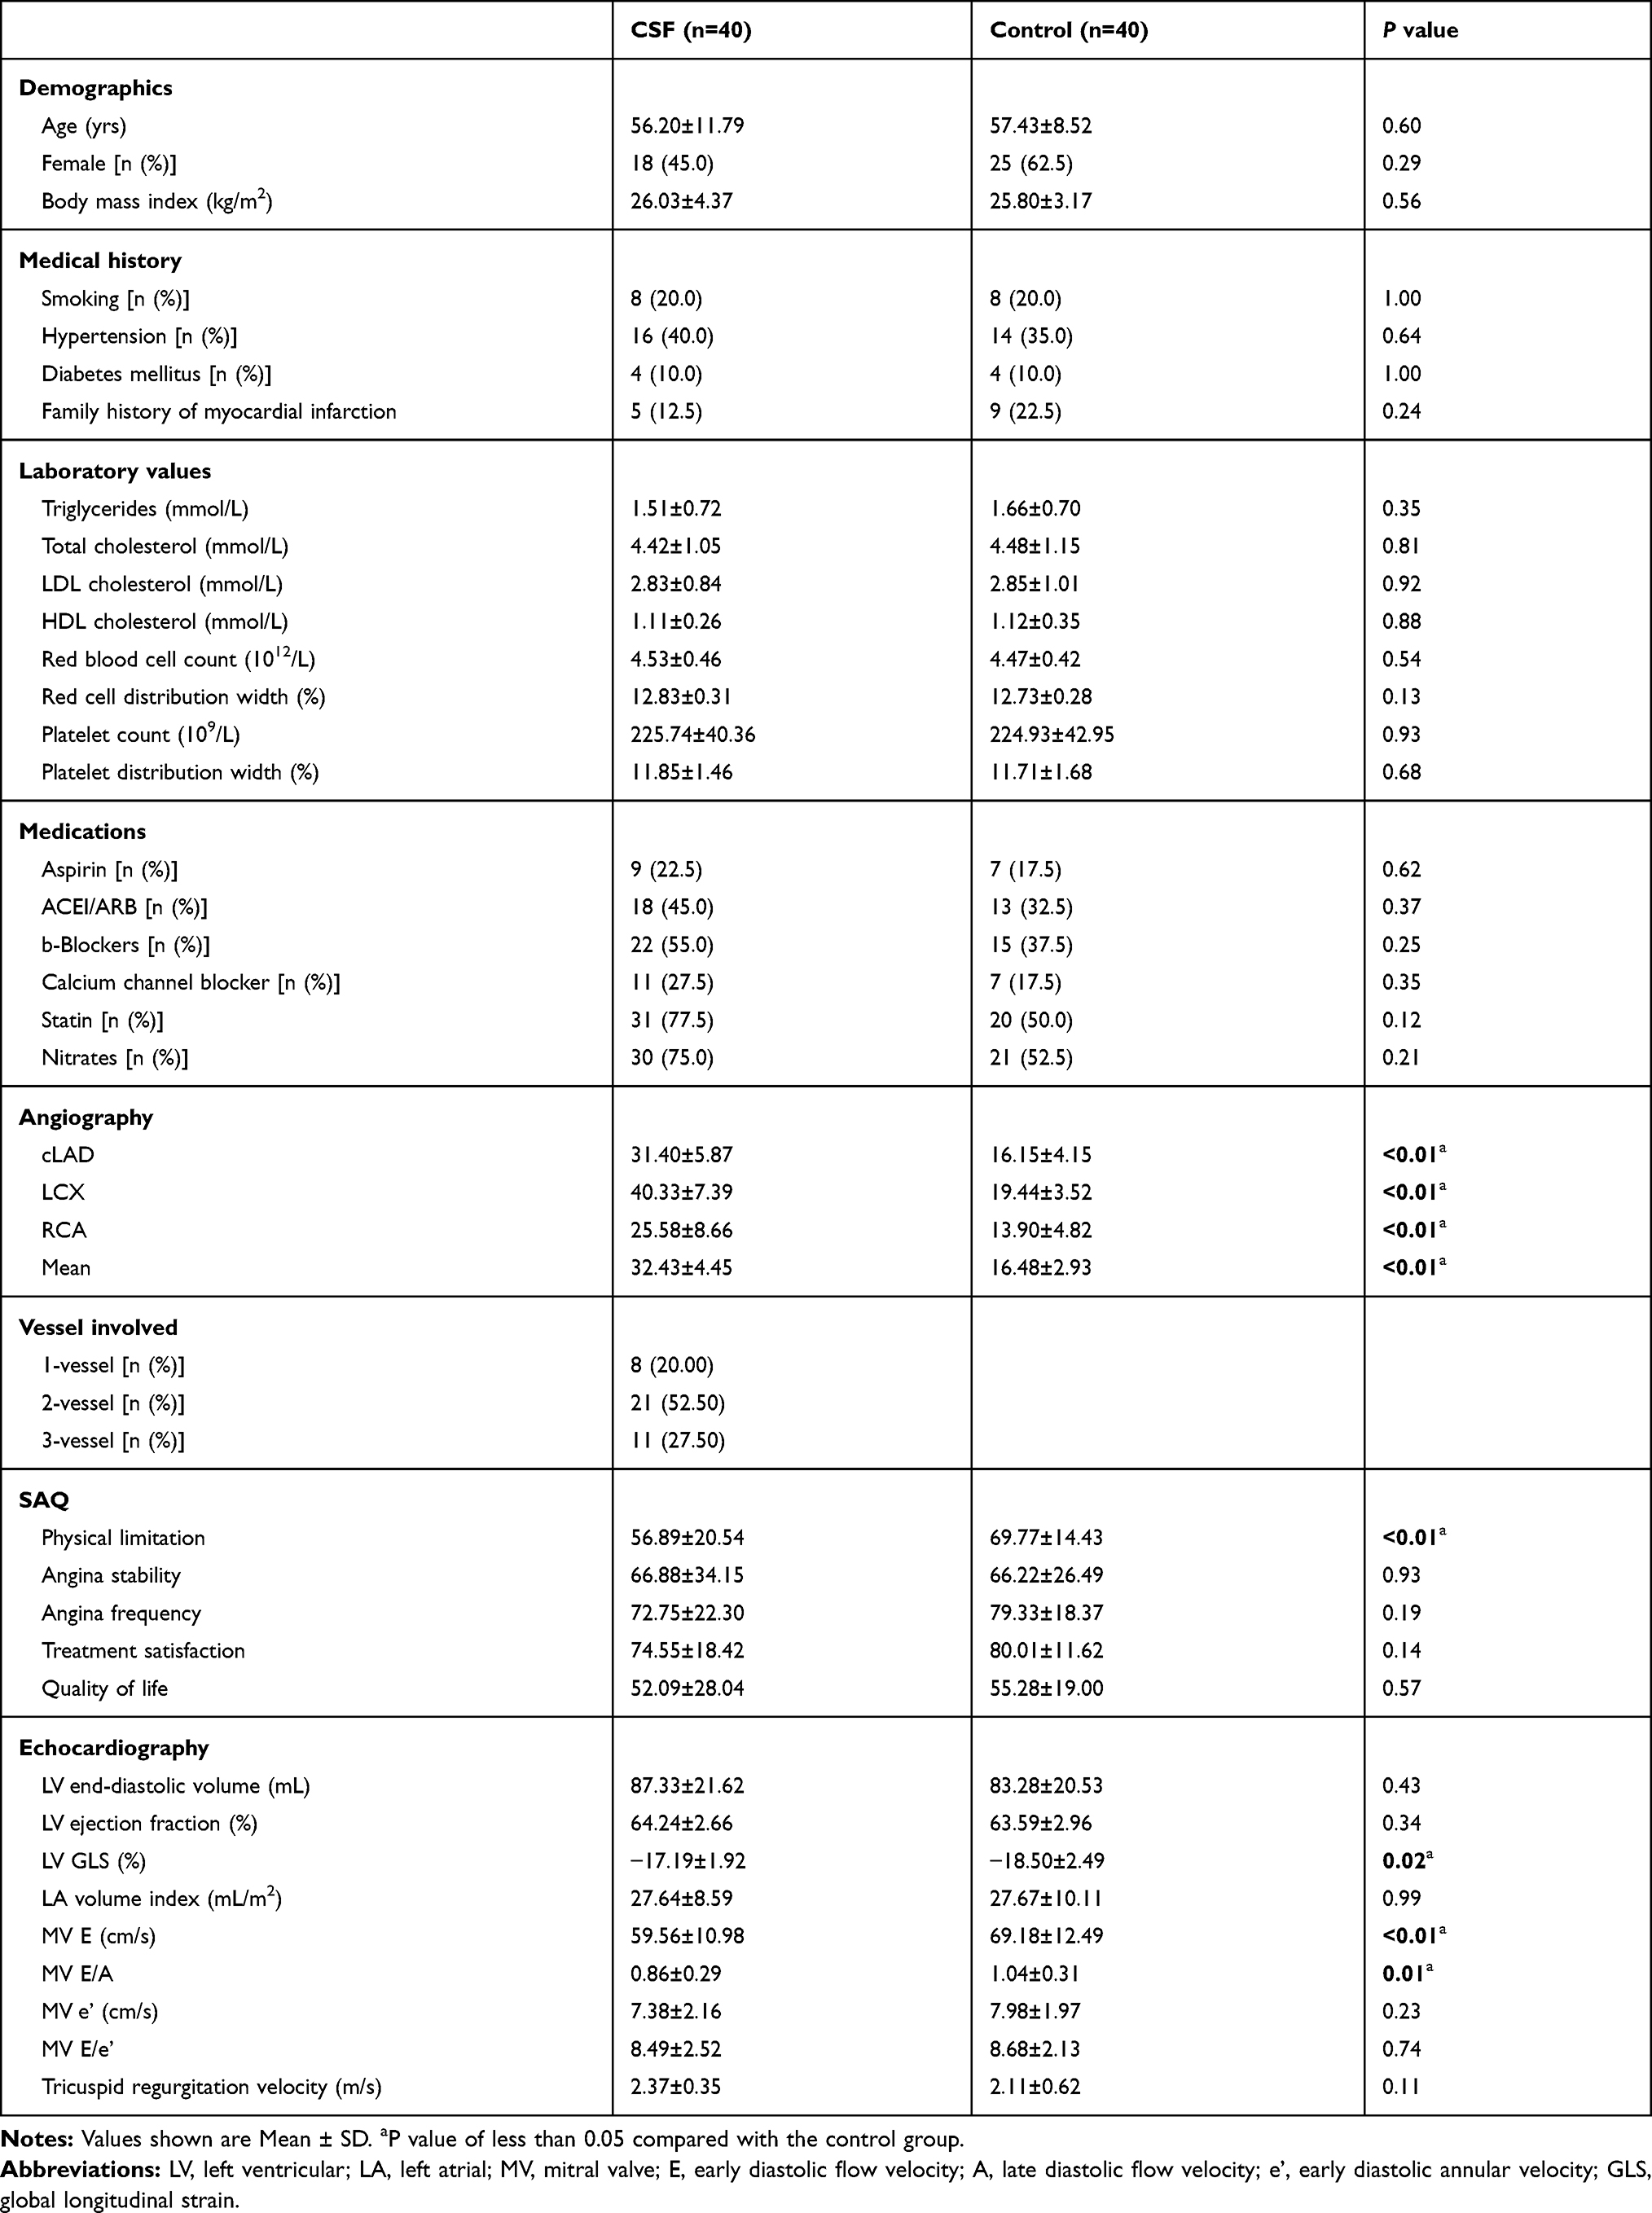 |
Table 1 Baseline Demographic, Clinical and Echocardiographic Characteristics of the Study Population |
As shown in Figure 1, the plasma sICAM-1 level in the CSF group was significantly higher than that in the control group (Figure 1A), and was significantly positively correlated with the mean cTFC (r = 0.78, P < 0.01). The plasma levels of IL-6 and TNF-α in the CSF group were also significantly higher than those in the control group (Figure 1B and C), and were significantly positively correlated with the mean cTFC (r = 0.42, P < 0.01; r = 0.30, P < 0.01).
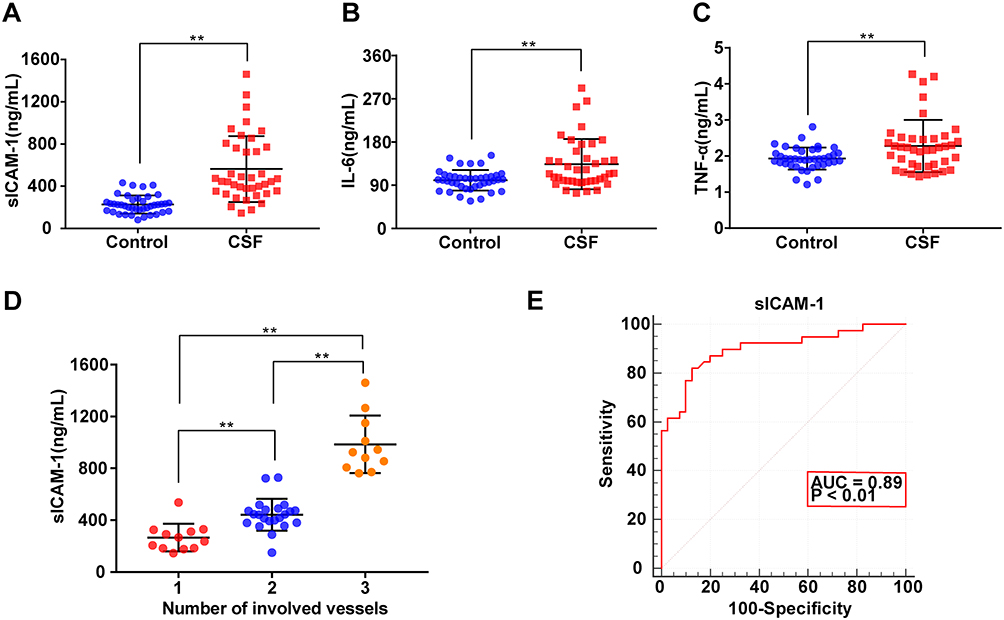 |
Figure 1 Relationship between plasma inflammation-associated biomarkers and coronary slow flow (CSF). (A) Plasma sICAM-1 levels were significantly higher in patients with CSF than in controls. (B) Plasma IL-6 levels were significantly higher in patients with CSF. (C) Plasma TNF-α levels were significantly higher in patients with CSF. (D) Correlation between the number of coronary arteries involved in CSF and plasma sICAM-1 level. (E) Receiver-operating characteristic (ROC) curve analysis of plasma sICAM-1 for diagnosing CSF; Data were analysed using Student’s t-test (A–C); one-way ANOVA for pairwise comparisons or comparisons between multiple groups with a single variable (D). Data represent the mean ± SD, **P < 0.01 vs Control group. Abbreviations: CSF, coronary slow flow; sICAM-1, soluble intercellular adhesion molecule-1; IL-6, interleukin-6; TNF-α, tumor necrosis factor alpha; AUC, area under the curve. |
The variables for which statistically significant differences were identified were incorporated into univariate regression analysis. The results showed that physical limitation score, MV E, LVGLS, and plasma levels of sICAM-1, IL-6 and TNF-α were significantly correlated with the mean cTFC. Incorporating these variables into the multiple linear regression analysis revealed significant correlations of physical limitation score and plasma sICAM-1 with mean cTFC (Table 2). Plasma sICAM-1 level (OR = 1.02, 95% CI: 1.00–1.03) was identified as an independent predictor of CSF by logistic regression analysis after adjusting for age, sex, body mass index (BMI), MV E, MV E/A, LVGLS, IL-6 and TNF-α (Table 3).
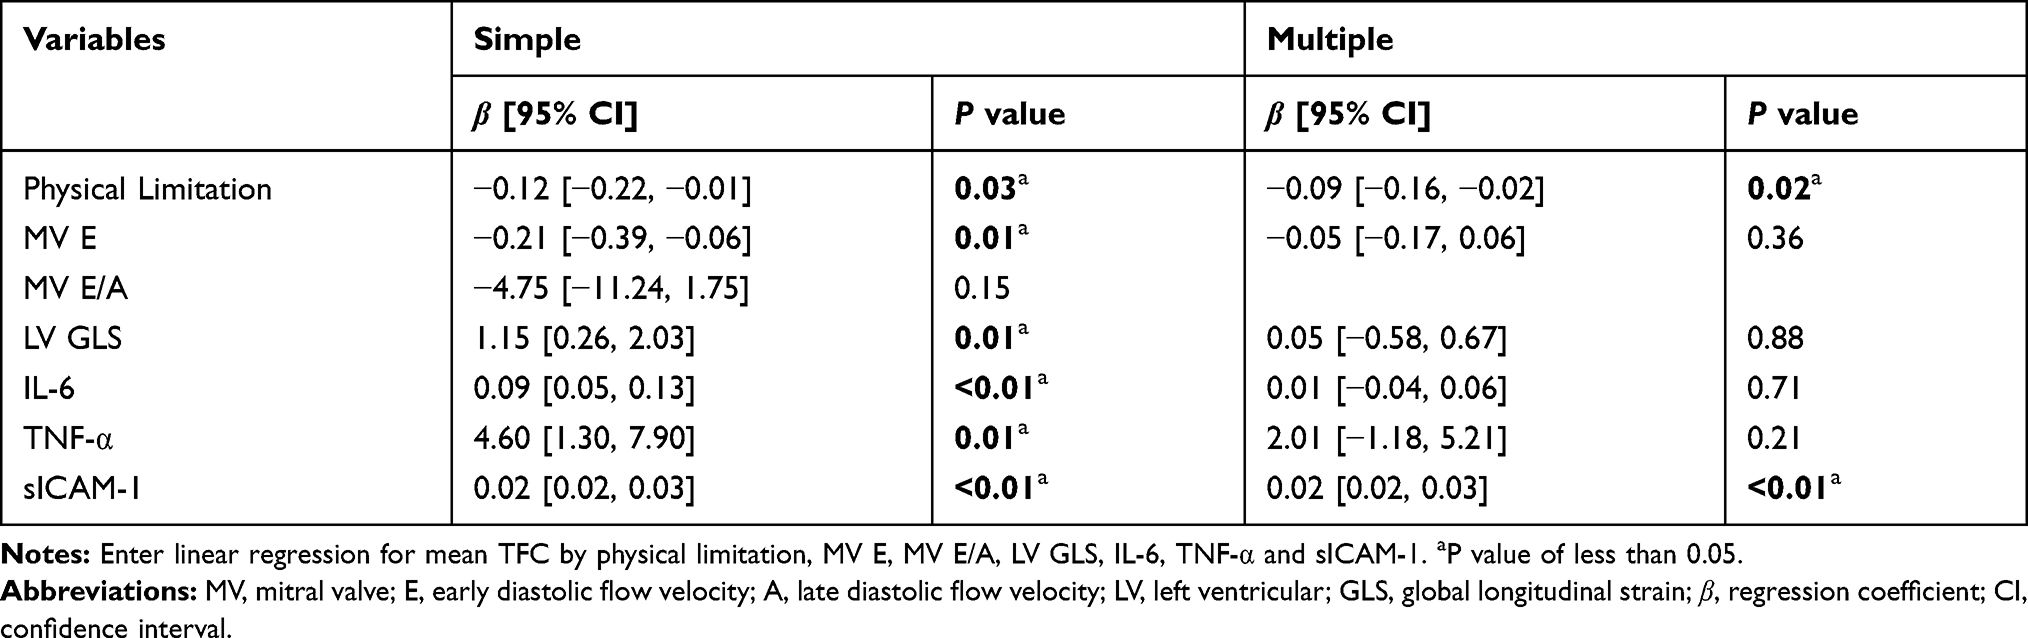 |
Table 2 Simple and Multiple Linear Regression Analysis for Mean TFC |
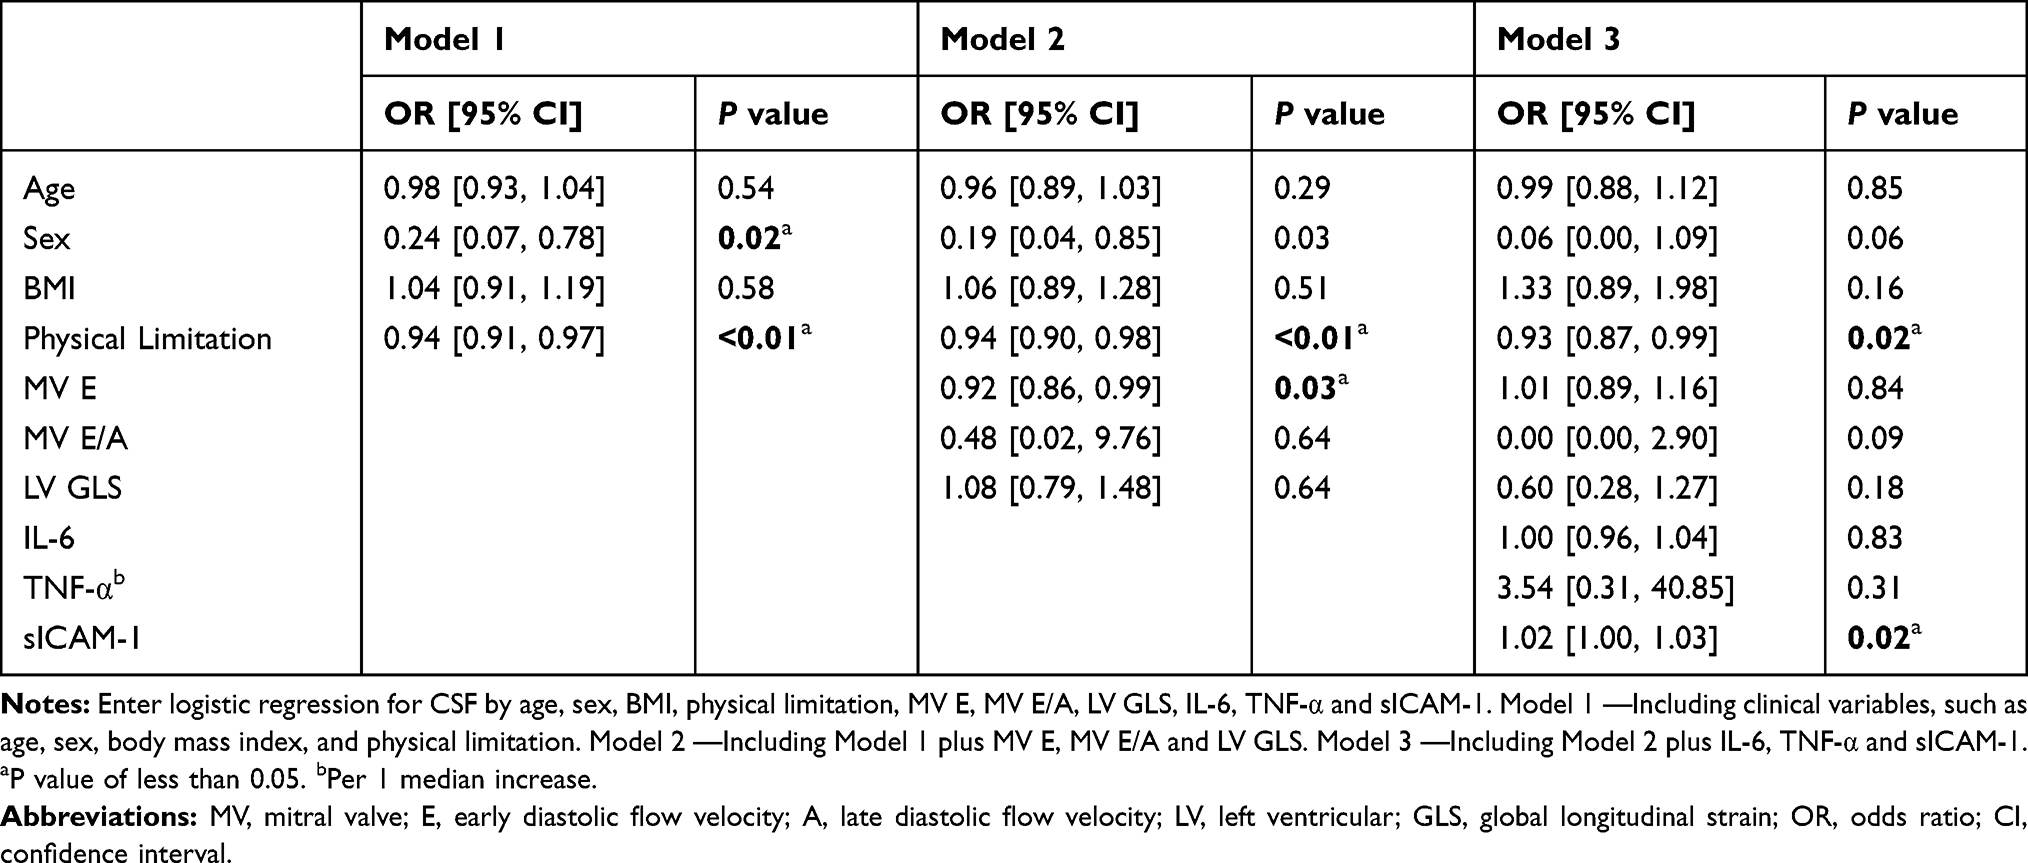 |
Table 3 Logistic Regression Analysis for CSF |
Further analysis showed that plasma sICAM-1 levels in CSF patients increased with the number of involved coronary arteries (Figure 1D), and the level was positively correlated with the number of involved coronary arteries (r = 0.84, P < 0.01).
ROC curve analysis showed that plasma sICAM-1 levels had statistical significance for the diagnosis of CSF (Area Under Curve [AUC]: 0.89) (Figure 1E), with higher sICAM-1 levels indicating an increased possibility of CSF. When sICAM-1 was greater than 320.13 ng/mL, the sensitivity for diagnosing CSF was 82.05%, and the specificity was 87.50%.
Plasma miR-148b-3p and NEAT1 are Independent Predictors of CSF
Using the bioinformatics database Starbase (http://starbase.sysu.edu.cn/), the 3ʹ-UTR region of ICAM-1 was predicted to contain a 5ʹ-GCACUG-’3 sequence targeted by miR-148b-3p. LncRNA NEAT1 was predicted to target the 5ʹ-GCACUG-’3 sequence of miR-148b-3p, which is consistent with the miR-148b-3p binding sequence in the ICAM-1 gene (Figure S1A and B). Fluorescence qRT-PCR was used to determine plasma miR-148b-3p and NEAT1 levels. As shown in Figure 2, compared with the control group, the plasma miR-148b-3p level in the CSF group was significantly reduced, and was negatively correlated with the mean cTFC and the sICAM-1 level (Figure 2A–C). The plasma NEAT1 level in the CSF group was significantly higher than that in the control group, and was positively correlated with the mean cTFC and the sICAM-1 level (Figure 2D–F).
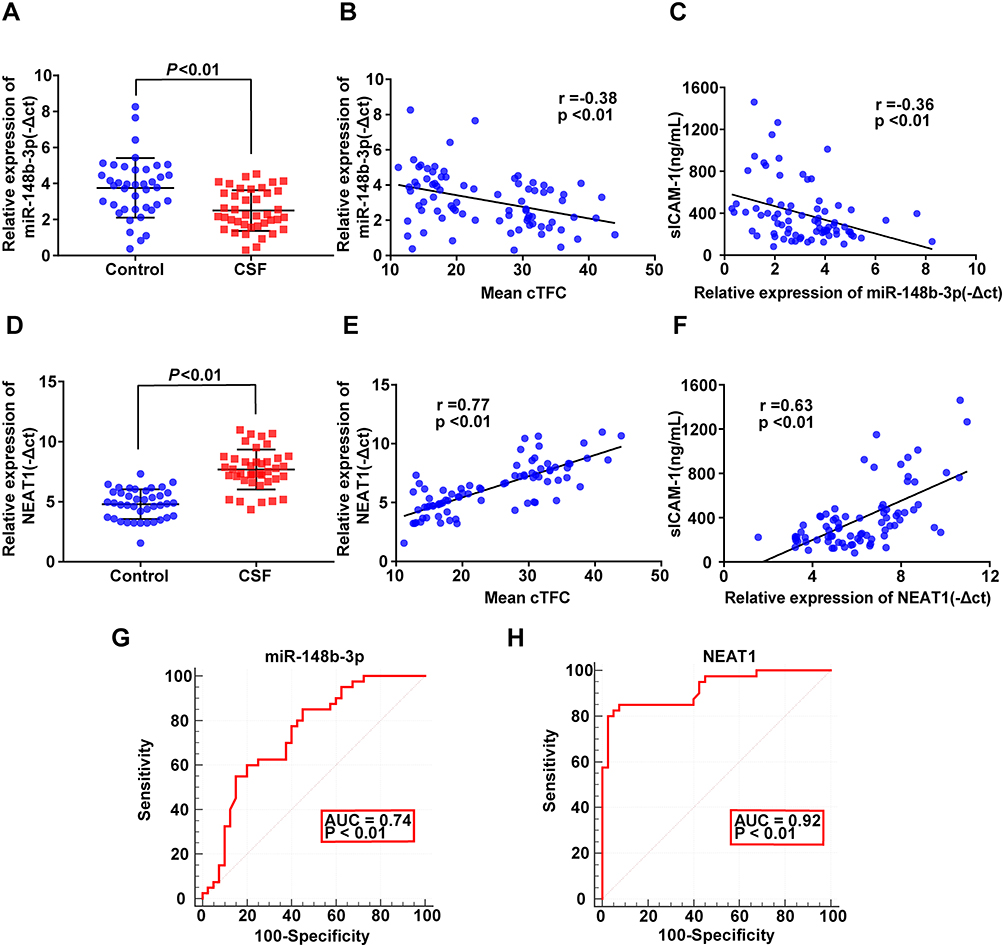 |
Figure 2 Expression of plasma miR-148b-3p and NEAT1 in CSF and controls and their relationship with CSF. (A) Plasma miR-148b-3p levels were significantly lower in patients with CSF. Data represent the mean ± SD. (B) Plasma miR-148b-3p levels were negatively correlated with the mean corrected thrombolysis in myocardial infarction frame count (cTFC). (C) Plasma miR-148b-3p levels were negatively correlated with sICAM-1. (D) Plasma NEAT1 levels were significantly higher in patients with CSF. Data represent the mean ± SD. (E) Plasma NEAT1 levels were positively correlated with the mean cTFC. (F) Plasma NEAT1 levels were positively correlated with sICAM-1. (G and H) ROC curve analysis of plasma miR-148b-3p and NEAT1 for diagnosing CSF. Data were analysed using Student’s t-test (A and D); Significance was determined using linear regression analysis (B, C, E and F). Abbreviations: CSF, coronary slow flow; cTFC, corrected TIMI frame count; sICAM-1, soluble intercellular adhesion molecule-1; NEAT1, nuclear enriched abundant transcripts 1; AUC, area under the curve. |
To evaluate the diagnostic ability of circulating plasma miR-148b-3p and NEAT1 for diagnosing CSF, we generated ROC curves and performed logistic regression analysis, respectively. The results showed that the AUCs of miR-148b-3p and NEAT1 were 0.74 and 0.92, respectively (Figure 2G and H). After adjusting confounding factors such as age, sex and BMI, logistic regression analysis confirmed that plasma miR-148b-3p (OR = 0.45, 95% CI: 0.24–0.80, P = 0.01) and NEAT1 level (OR = 5.74, 95% CI: 2.46–13.37, P < 0.01) were independent predictors of CSF. Meanwhile, ROC curve analysis indicated that NEAT1 combined with miR-148b-3p (AUC: 0.94), miR-148b-3p combined with sICAM-1 (AUC: 0.92) and NEAT1 combined with sICAM-1 (AUC: 0.96) could predict CSF. Moreover, NEAT1 combined with miR-148b-3p and sICAM-1 demonstrated better predictive power (AUC: 0.97).
The Expression of ICAM-1 and NEAT1 Was Upregulated in OGD-Treated HUVECs, While miR-148b-3p Expression Was Downregulated. OGD-Treated HUVECs Inhibits Proliferation and Promotes Apoptosis
In this study, HUVECs cultured under OGD conditions were used to as an in vitro model of CSF cells. RNA and protein was extracted from OGD-treated HUVECs and ICAM-1, miR-148b-3p and NEAT1 expression levels were evaluated by qRT-PCR and WB analyses. Compared with the control group, the expression of NEAT1 and ICAM-1 was upregulated in the OGD group, while miR-148b-3p expression was downregulated (Figure 3A).
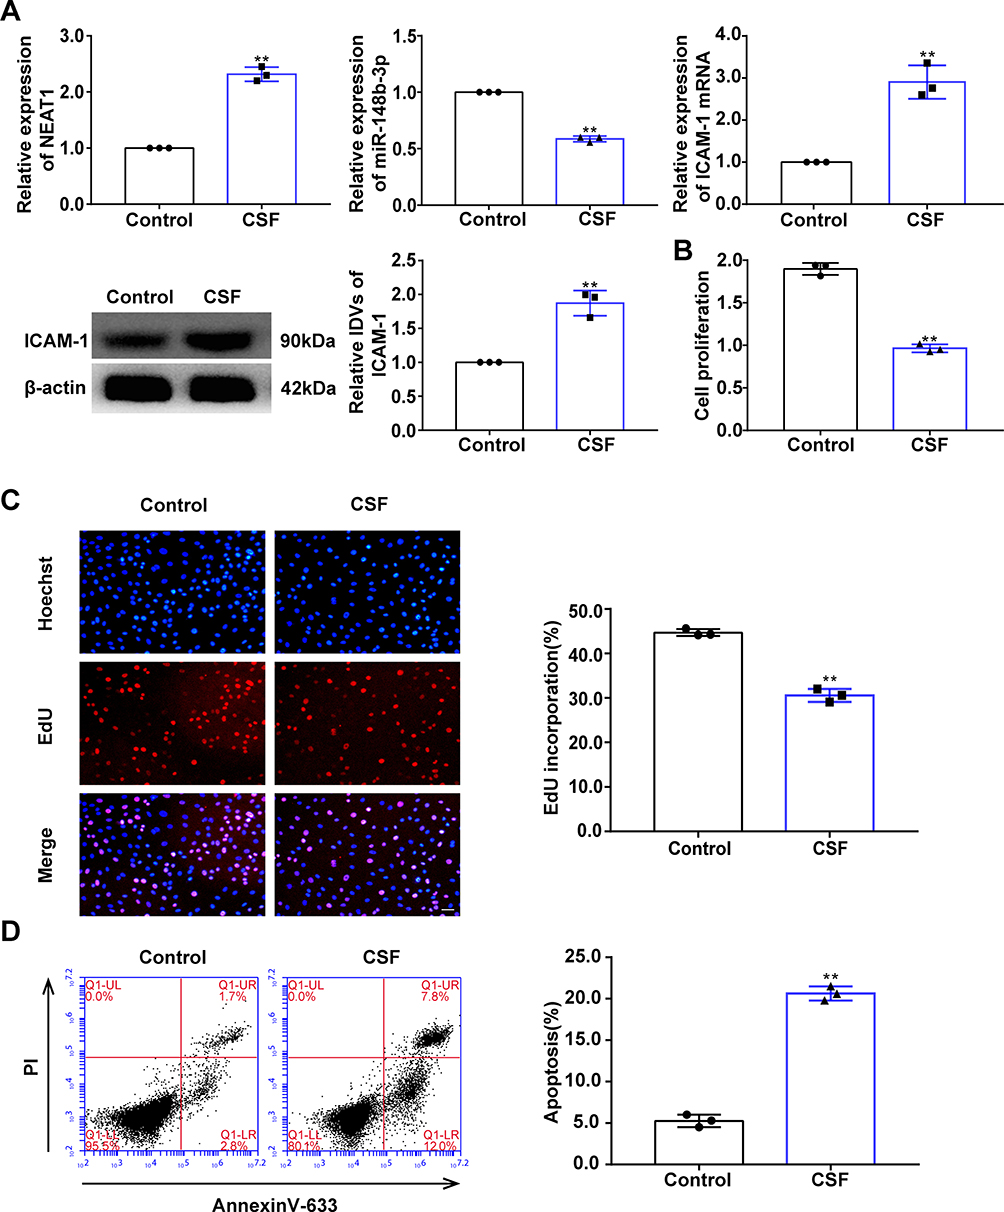 |
Figure 3 Effect of oxygen glucose deprivation (OGD) on HUVEC proliferation and apoptosis and relative expression levels of NEAT1, miR-148b-3p, and ICAM-1. (A) qRT-PCR and WB analyses were performed to detect the relative expression levels of NEAT1, miR-148b-3p and ICAM-1. Data represent the mean ± SD, **P < 0.01 vs Control group. (B) CCK-8 assays were performed to measure the effect of OGD on HUVEC proliferation (n = 3 per group). Data represent mean ± SD, **P < 0.01 vs Control group. (C) EdU assays were performed to measure the effect of OGD on HUVEC proliferation (n = 3 per group). Data represent mean ± SD, **P < 0.01 vs Control group. Scale bars represent 40 μm. (D) Flow cytometric analysis of annexinV-633 staining was used to detect the effect of OGD on HUVEC apoptosis (n = 3 per group). Data represent the mean ± SD, **P < 0.01 vs Control group. All data were analysed using Student’s t-test. Abbreviations: CSF, coronary slow flow; NEAT1, nuclear enriched abundant transcripts 1; ICAM-1, intercellular adhesion molecule-1; IDV, integrated density value. |
The levels of proliferation and apoptosis of HUVECs exposed to OGD were analyzed to evaluate the changes in biological behavior. CCK-8 and EdU assays showed that HUVEC proliferation in the OGD group was significantly reduced compared with that in the control group (Figure 3B and C). Flow cytometric analysis of annexinV-633 staining showed that the percentage of apoptotic HUVECs in the OGD group was significantly increased compared with that in the control group (Figure 3D).
ICAM-1 Knockdown Promotes the Proliferation of OGD-Treated HUVECs and Inhibits Apoptosis
In this study, after stable overexpression or knockdown of ICAM-1, we analyzed the expression, proliferation and apoptosis of OGD-treated HUVECs. As shown in Figure 4A, compared with the pre-ICAM-1-NC group, ICAM-1 expression in the pre-ICAM-1 group was upregulated, and compared with the sh-ICAM-1-NC group, ICAM-1 expression in the sh-ICAM-1 group was downregulated (Figure 4A). Compared with the pre-ICAM-1-NC group, cell proliferation was significantly inhibited in the pre-ICAM-1 group, while compared with the sh-ICAM-1-NC group, cell proliferation was significantly promoted in the sh-ICAM-1 group (Figure 4B and C). As shown in Figure 4D, compared with the pre-ICAM-1-NC group, apoptosis in the pre-ICAM-1 group was notably increased, and compared with the sh-ICAM-1-NC group, apoptosis in the sh-ICAM-1 group was markedly reduced (Figure 4D). Meanwhile, after stable overexpression or knockdown of ICAM-1, there were no significant differences in the expression of NEAT1 and miR-148b-3p between the groups (Figure S2A and B).
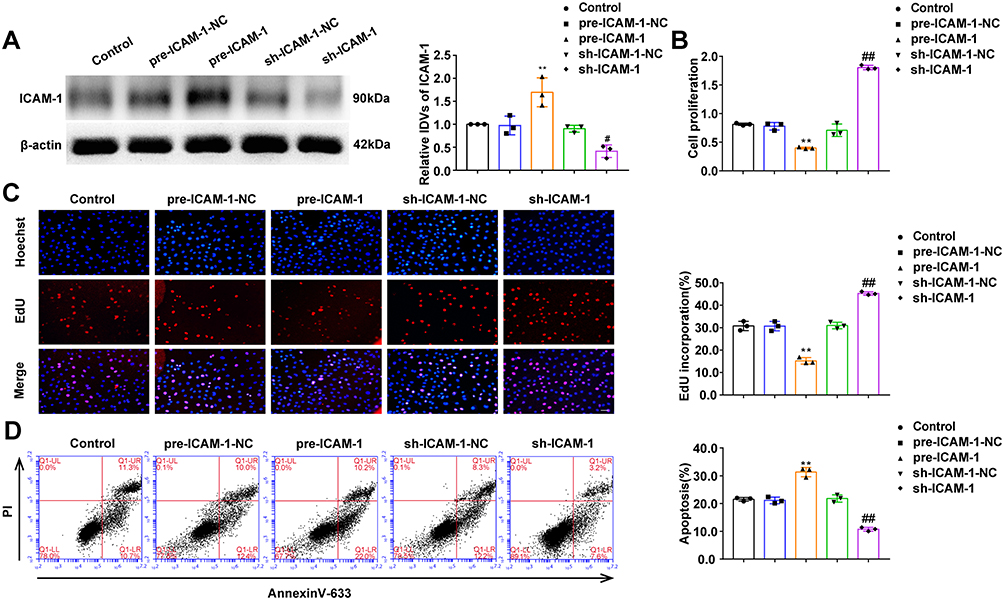 |
Figure 4 The effects of ICAM-1 on the proliferation and apoptosis of OGD-treated HUVECs. (A) Expression of ICAM-1 protein (n = 3 per group) after ICAM-1 over-expression or inhibition in OGD-treated HUVECs. Data represent the mean ± SD, **P < 0.01 vs pre-ICAM-1-NC group, #P < 0.05 vs sh-ICAM-1-NC group. (B) CCK-8 assays were performed to measure the effect of ICAM-1 on the proliferation of OGD-treated HUVECs (n = 3 per group). Data represent the mean ± SD, **P < 0.01 vs pre-ICAM-1-NC group, ##P < 0.01 vs sh-ICAM-1-NC group. (C) EdU assays were performed to measure the effect of ICAM-1 on the proliferation of OGD-treated HUVECs (n =3 per group). Data represent the mean ± SD, **P < 0.01 vs pre-ICAM-1-NC group, ##P < 0.01 vs sh-ICAM-1-NC group. Scale bars represent 40 μm. (D) Flow cytometric analysis of annexinV-633 staining was used to measure the percentages of apoptotic OGD-treated HUVECs (n = 3 per group) after ICAM-1 over-expression or inhibition. Data represent the mean ± SD, **P < 0.01 vs pre-ICAM-1-NC group, ##P < 0.01 vs sh-ICAM-1-NC group. One-way ANOVA for pairwise comparisons or comparisons between multiple groups with a single variable. Abbreviations: ICAM-1, intercellular adhesion molecule-1; IDV, integrated density value. |
MiR-148b-3p Promotes the Proliferation of OGD-Treated HUVECs and Inhibits Apoptosis, and Reverses the Effects of ICAM-1-Mediated Cell Proliferation and Apoptosis
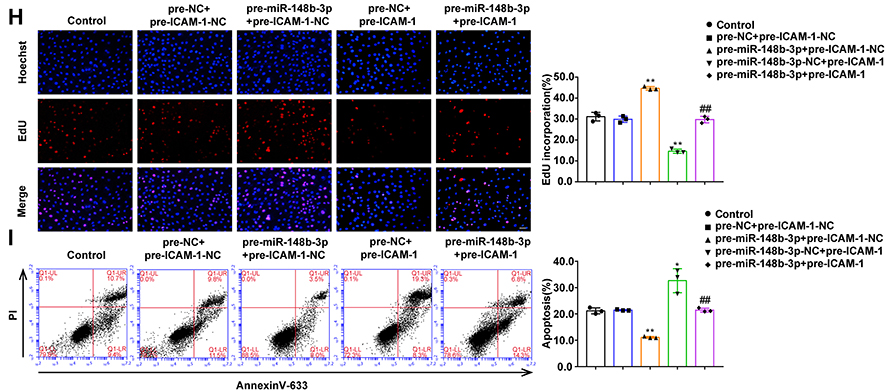
We further analyzed the expression, proliferation and apoptosis of OGD-treated HUVECs after mimics and inhibitors of miR-148b-3p. Compared with the pre-miR-148b-3p-NC group, ICAM-1 expression in pre-miR-148b-3p group was significantly downregulated, while compared with the anti-miR-148b-3p-NC group, ICAM-1 expression in the anti-miR-148b-3p group was significantly upregulated (Figure 5A). Compared with the pre-miR-148b-3p-NC group, miR-148b-3p mimics promoted cell proliferation, while compared with the anti-miR-148b-3p-NC group, miR-148b-3p knockdown significantly inhibited cell proliferation (Figure 5B and C). As shown in Figure 5D, flow cytometric analysis showed that compared with the pre-miR-148b-3p-NC group, HUVEC apoptosis was inhibited in the pre-miR-148b-3p group, and compared with the anti-miR-148b-3p-NC group, HUVEC apoptosis was significantly increased in the anti-miR-148b-3p group (Figure 5D). Meanwhile, NEAT1 expression was downregulated between the groups after mimics of miR-148b-3p and was upregulated after inhibitors of miR-148b-3p (Figure S2C). Figure 5 Continued. Figure 5 The effects of miR-148b-3p on OGD-treated HUVECs and miR-148b-3p over-expression reversed the ICAM-1-mediated on the proliferation and apoptosis of OGD-treated HUVECs. (A) qRT-PCR and WB analyses were performed to measure the expression of ICAM-1 mRNA and protein, respectively (n = 3 per group) after miR-148b-3p over-expression or inhibition in OGD-treated HUVECs. Data represent the mean ± SD, *P < 0.05 vs pre-miR-148b-3p-NC group; **P < 0.01 vs pre-miR-148b-3p-NC group; ##P < 0.01 vs anti-miR-148b-3p-NC group. (B) CCK-8 assays were performed to measure the effect of miR-148b-3p on the proliferation of OGD-treated HUVECs (n = 3 per group). Data represent the mean ± SD, **P < 0.01 vs pre-miR-148b-3p-NC group; #P < 0.05 vs anti-miR-148b-3p-NC group. (C) EdU assays were performed to measure the effect of miR-148b-3p on the proliferation of OGD-treated HUVECs (n = 3 per group). Data represent the mean ± SD, **P < 0.01 vs pre-miR-148b-3p-NC group; ##P < 0.01 vs anti-miR-148b-3p-NC group. Scale bars represent 40 μm. (D) Flow cytometric analysis of annexinV-633 staining was used to measure the percentages of apoptotic OGD-treated HUVECs (n = 3 per group) after miR-148b-3p over-expression or inhibition. Data represent as the mean ± SD, **P < 0.01 vs pre-miR-148b-3p-NC group; ##P < 0.01 vs anti-miR-148b-3p-NC group. (E) The predicted miR-148b-3p binding sites in the 3ʹ-UTR region of ICAM-1(ICAM-1–3ʹ-UTR-Wt) and the designed mutant sequence (ICAM-1–3ʹUTR-Mut) are indicated. Relative luciferase activity was measured after cells were transfected with ICAM-1–3ʹ-UTR-Wt or ICAM-1–3ʹUTR-Mut. Data represent the mean ± SD (n = 3 pre group), **P < 0.01 vs ICAM-1–3ʹUTR-Wt+miR-148b-3p-NC group. (F) qRT-PCR and WB analyses were performed to measure the expression of ICAM-1 mRNA and protein, respectively (n = 3 per group) in OGD-treated HUVECs after transfection with miR-148b-3p and ICAM-1. Data represent the mean ± SD, *P < 0.05 vs pre-miR-148b-3p-NC+pre-ICAM-1-NC group, **P < 0.01 vs pre-miR-148b-3p-NC+pre-ICAM-1-NC group, ##P < 0.01 vs pre-miR-148b-3p+pre-ICAM-1-NC group. (G) CCK-8 assays were performed to measure the effect of miR-148b-3p and ICAM-1 on the proliferation of OGD-treated HUVECs (n = 3 per group). Data represent the mean ± SD, **P < 0.01 vs pre-miR-148b-3p-NC+pre-ICAM-1-NC group, ##P < 0.01 vs pre-miR-148b-3p+ pre-ICAM-1-NC group. (H) EdU assays were performed to measure the effect of miR-148b-3p and ICAM-1 on the proliferation of OGD-treated HUVECs (n = 3 per group). Data represent the mean ± SD, **P < 0.01 vs pre-miR-148b-3p-NC+pre-ICAM-1-NC group, ##P < 0.01 vs pre-miR-148b-3p+pre-ICAM-1-NC group. Scale bars represent 40 μm. (I) Flow cytometric analysis of annexinV-633 staining was used to evaluate the effect of miR-148b-3p and ICAM-1 on the apoptosis of OGD-induced HUVECs.Data represent the mean ± SD (n = 3 per group), *P < 0.05 vs pre-miR-148b-3p-NC+pre-ICAM-1-NC group, **P < 0.01 vs pre-miR-148b-3p-NC+pre-ICAM-1-NC group, ##P < 0.01 vs pre-miR-148b-3p+pre-ICAM-1-NC group. One-way ANOVA for pairwise comparisons or comparisons between multiple groups with a single variable. Abbreviations: ICAM-1, intercellular adhesion molecule-1; IDV, integrated density value; UTR, untranslated region.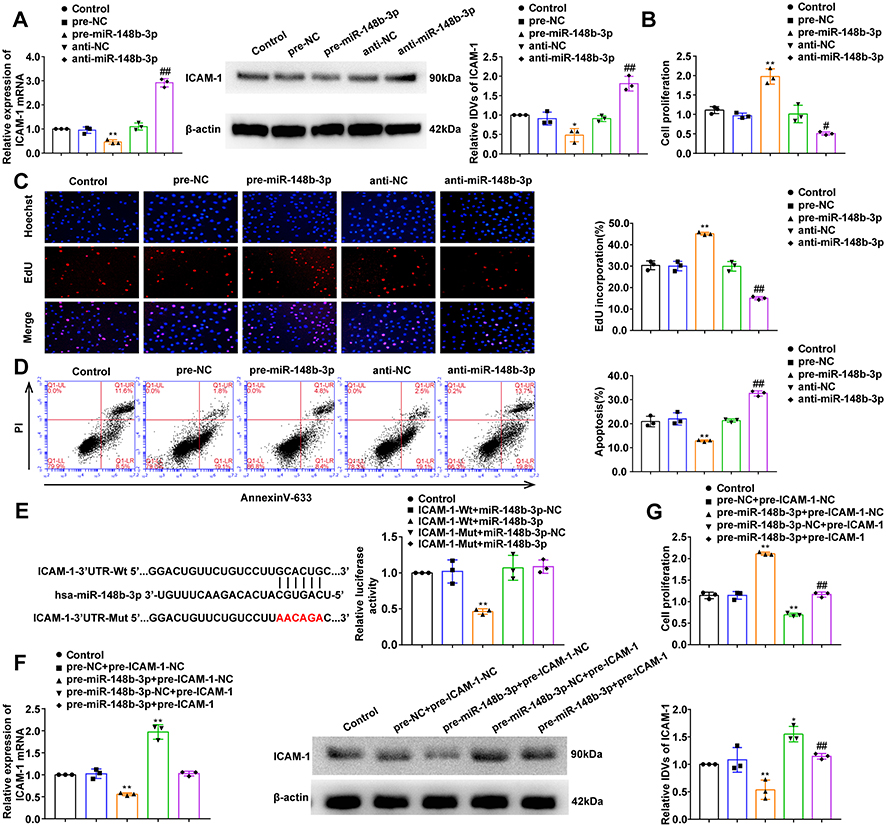
In this study, we used a luciferase reporter system to verify the potential ICAM-1 and miR-148b-3p binding sites predicted by the Starbase v2.0 database. In the ICAM-1-3ʹ-UTR-Wt group, luciferase activity was significantly inhibited in cells co-transfected with ICAM-1-3ʹ-UTR-Wt and miR-148-3p, while there was no change in luciferase activity in the NC group. In the ICAM-1-3ʹ-UTR-Mut group, There was no significant difference in the luciferase activity of the cells co-transfected with ICAM-1-3ʹ-UTR-Mut and miR-148-3p-NC and those co-transfected with ICAM-1-3ʹ-UTR-Mut and miR-148-3p (Figure 5E). At the same time, an avidin-biotin pull-down assay also confirmed the specific interactions between ICMA-1 mRNA and miR-148b-3p. As shown in Figure S2E, the biotin-labeled miR-148b-3p probe captured more ICMA-1 mRNA compared with the NC probe.
To further confirm that ICAM-1 is the target gene of miR-148b-3p, we analyzed cells the expression of ICAM-1 as well as the proliferation and apoptosis of HUVECs co-transfected with miR-148b-3p and ICAM-1. Compared with the pre-miR-148b-3p-NC+pre-ICAM-1-NC group, ICAM-1 expression in the pre-miR-148b-3p+pre-ICAM-1-NC group was significant downregulated, while ICAM-1 expression in the pre-miR-148b-3p-NC+pre-ICAM-1 group was significantly upregulated. In addition, in the pre-miR-148b-3p+pre-ICAM-1 group, ICAM-1 overexpression reversed the downregulation of ICAM-1 in the pre-miR-148b-3p+pre-ICAM-1-NC group (Figure 5F). Compared with the pre-miR-148b-3p-NC+pre-ICAM-1-NC group, cell proliferation was significantly promoted in the pre-miR-148b-3p+pre-ICAM-1-NC group, but was significantly inhibited in the pre-miR-148b-3p-NC+pre-ICAM-1 group. Furthermore, in the pre-miR-148b-3p+pre-ICAM-1 group, ICAM-1 overexpression reversed the promotion of cell proliferation in the pre-miR-148b-3p+pre-ICAM-1-NC group (Figure 5G and H). Moreover, compared with the pre-miR-148b-3p-NC+pre-ICAM-1-NC group, cell apoptosis was significantly reduced in the pre-miR-148b-3p+pre-ICAM-1-NC group, but was promoted in the pre-miR-148b-3p-NC+pre-ICAM-1 group. In addition, in the pre-miR-148b-3p+pre-ICAM-1 group, ICAM-1 overexpression reversed the inhibitory effect of pre-miR-148b-3p+pre-ICAM-1-NC group on apoptosis (Figure 5I).
NEAT1 Knockdown Promotes the Proliferation of OGD-Treated HUVECs and Inhibits Apoptosis, and Reverses the Effect of miR-148b-3p-Mediated Cell Proliferation and Apoptosis
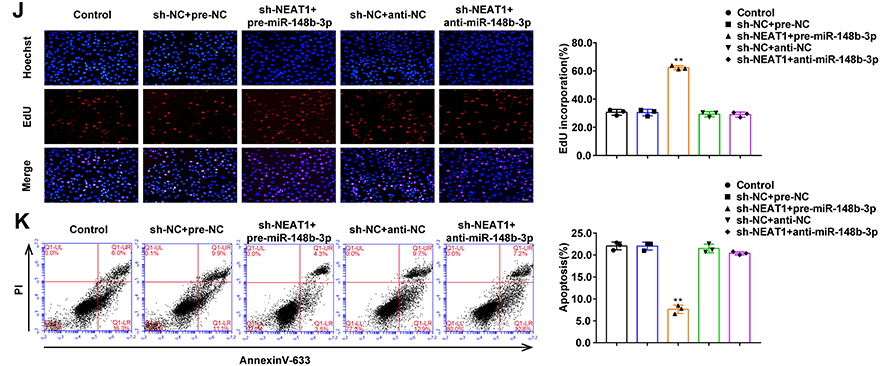
We constructed three NEAT1 shRNAs for transfection into HUVECs to knockdown NEAT1 expression. The maximum knockdown efficiency was achieved using sh-NEAT1-1, which was selected for subsequent experiments (Figure S2D). Compared with the sh-NC group, miR-148b-3p expression in the sh-NEAT1 group was significantly upregulated (Figure 6A), and ICAM-1 expression was significantly downregulated (Figure 6B). Compared with the sh-NC group, NEAT1 knockdown promoted cell proliferation (Figure 6C and D). Flow cytometry analysis showed that compared with sh-NC group, cell apoptosis was significantly inhibited in the sh-NEAT1 group (Figure 6E). Figure 6 Continued. Figure 6 The effects of NEAT1 in OGD-HUVECs and reversed the miR-148b-3p-mediated on the proliferation and apoptosis of OGD-induced HUVECs. (A) MiR-148b-3p expression in OGD-treated HUVECs (n = 3 per group) after transfection with sh-NEAT1. Data represent the mean ± SD, **P < 0.01 vs sh-NC group. (B) qRT-PCR and WB analyses were performed to measure the expression of ICAM-1 mRNA and protein, respectively (n = 3 per group) in OGD-induced HUVECs after transfection with sh-NEAT1. Data represent the mean ± SD, **P <0.01 vs sh-NC group. (C) CCK-8 assays were performed to measure the effect of NEAT1 knockdown on the proliferation of OGD-induced HUVECs (n = 3 per group). Data represent the mean ± SD, **P <0.01 vs sh-NC group. (D) EdU assays were performed to measure the effect of NEAT1 knockdown on the proliferation of OGD-induced HUVECs. Data represent the mean ± SD, **P <0.01 vs sh-NC group. Scale bars represent 40 μm. (E) Flow cytometric analysis of annexinV-633 staining was used to measure the percentages of apoptotic OGD-treated HUVECs after NEAT1 knockdown. Data represent the mean ± SD (n = 3 per group). **P < 0.01 vs sh-NC group. (F) The predicted miR-148b-3p binding site in the NEAT1 sequence (NEAT1-Wt) and the designed mutant sequence of the miR-148b-3p binding site (NEAT1-Mut) are indicated. Relative luciferase activity was measured after cells were transfected with NEAT1-Wt or NEAT1-Mut and miR-148b-3p or the miR-148b-3p-NC. Data represent the mean ± SD (n = 3 per group), **P < 0.01 vs NEAT1-Wt+miR-148b-3p-NC group. (G) MiR-148b-3p was identified in the NEAT1-RISC complex. Relative expression levels of NEAT1 and miR-148b-3p were determined by qRT PCR (n = 3 per group). Data represent the mean ± SD, **P < 0.01 vs anti-normal IgG. (H) qRT-PCR and WB analyses were performed to measure the expression of ICAM-1 mRNA and protein, respectively (n = 3 per group) in OGD-induced HUVECs after transfection with NEAT1 and miR-148b-3p. Data represent the mean ± SD, **P < 0.01 vs sh-NEAT1-NC+pre-miR-148b-3p-NC group. (I) CCK-8 assays were performed to measure the effect of NEAT1 and miR-148b-3p on the proliferation of OGD-induced HUVECs (n = 3 per group). Data represent the mean ± SD, **P < 0.01 vs sh-NEAT1-NC+pre-miR-148b-3p-NC group. (J) EdU assays were performed to measure the effect of NEAT1 and miR-148b-3p on the proliferation of OGD-treated HUVECs (n = 3 per group). Data represent the mean ± SD, **P < 0.01 vs sh-NEAT1-NC+pre-miR-148b-3p-NC group. Scale bars represent 40 μm. (K) Flow cytometric analysis of annexinV-633 staining was used to evaluate the effect of NEAT1 and miR-148b-3p on the apoptosis of OGD-induced HUVECs. Data represent the mean ± SD (n = 3 per group), **P < 0.01 vs sh-NEAT1-NC+pre-miR-148b-3p-NC group. Data were analysed using Student’s t-test (G); One-way ANOVA for pairwise comparisons or comparisons between multiple groups with a single variable (A–F and H–K). Abbreviations: NEAT1, nuclear enriched abundant transcripts 1; ICAM-1, intercellular adhesion molecule-1; IDV, integrated density value.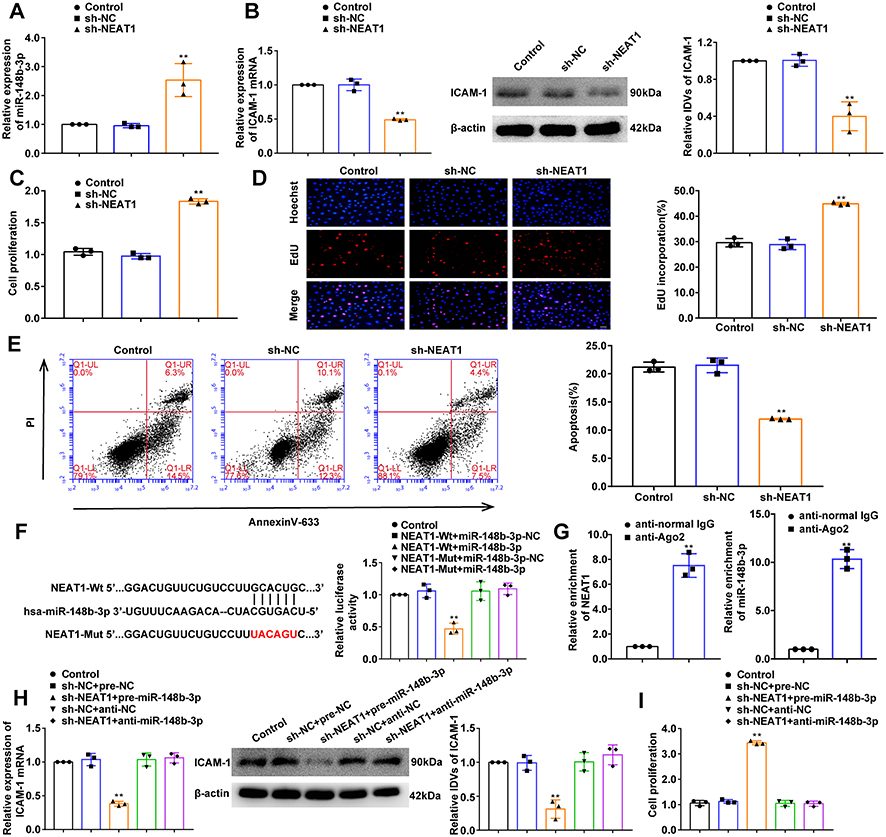
NEAT1 and miR-148b-3p binding sites were predicted by the Starbase v2.0 database. In reporter gene assays, luciferase activity was significantly inhibited in the NEAT1-Wt+miR-148b-3p group (Figure 6F). Moreover, RIP assay showed that NEAT1 and miR-148b-3p were both enriched in the anti-Ago2 group (Figure 6G). In addition, the avidin-biotin pull-down assay also confirmed the specific interactions between NEAT1 and miR-148b-3p. As shown in Figure S2F, the biotin-labeled miR-148b-3p probe captured more NEAT1 compared with the NC probe. While biotin-labeled NEAT1 probe could not capture more ICAM-1 mRNA compared with the NC probe (Figure S2G). These results indicated the potential of miR-148b-3p to bind NEAT1 directly.
In this study, NEAT1 knockdown was transfected into miR-148b-3p mimics and inhibitors stable cells, respectively. ICAM-1 expression in cells stably co-transfected with sh-NEAT1 and pre-miR-148b-3p was significantly downregulated. Furthermore, transfection with sh-NEAT1 reversed the effect of the miR-148b-3p inhibitors on the downregulation of ICAM-1 expression (Figure 6H). Co-transfection of miR-148b-3p-mimics-stable cells with sh-NEAT1 promoted cell proliferation and had the most obvious inhibitory effect on cell apoptosis. Furthermore, sh-NEAT1 transfection reversed the ability of the miR-148b-3p inhibitors to inhibit cell proliferation and promote apoptosis (Figure 6I–K).
Discussion
In this study, we showed that plasma sICAM-1, miR-148b-3p and NEAT1 levels are independent predictors of a CSF diagnosis, and the diagnostic ability of plasma NEAT1 levels is superior to that of sICAM-1 and miR-148b-3p. Cytological studies showed that ICAM-1 was highly expressed in OGD-treated HUVECs, and ICAM-1 knockdown significantly promoted cell proliferation and inhibited apoptosis. MiR-148b-3p was expressed at low levels in OGD-treated HUVECs, while miR-148b-3p mimics significantly promoted cell proliferation and inhibited apoptosis. MiR-148b-3p mimics reduced the expression of ICAM-1 by binding to the 3ʹ-UTR of the ICAM-1 gene. In addition, NEAT1 was highly expressed in OGD-treated HUVECs, and NEAT1 knockdown significantly promoted cell proliferation and inhibited apoptosis. NEAT1 knockdown upregulated miR-148b-3p expression by specifically binding to miR-148b-3p. This study demonstrates for the first time that the NEAT1/miR-148b-3p/ICAM-1 axis plays an important role in regulating CSF (Figure 7).
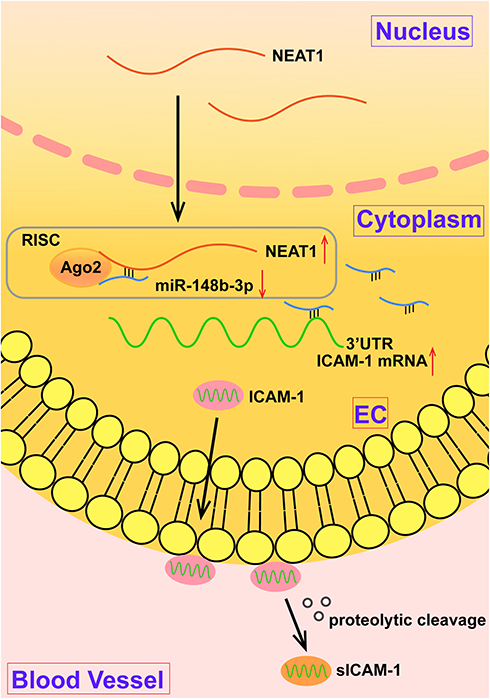 |
Figure 7 The schematic diagram of the mechanism of NEAT1/miR-148b-3p/ICAM-1 axis in CSF disease. Abbreviations: NEAT1, nuclear enriched abundant transcripts 1; RISC, RNA-induced silencing complex; UTR, untranslated region; ICAM-1, intercellular adhesion molecule-1; EC, endothelial cell. |
In recent years, patients with angina-like chest pain who have no obstructive coronary artery disease and no clear structural heart disease on coronary angiography have received increasing attention. CSF refers to the phenomenon in which coronary arteriography is normal or nearly normal, but with delayed distal vessel blood flow. In this study, we demonstrate for the first time that CSF patients have a significantly reduced physical limitation score determined by completion of the SAQ, suggesting that the functional status and quality of life of CSF patients is decreased compared with control individuals. Moreover, the LVGLS, MV E and MV E/A of CSF patients were significantly reduced, suggesting that the left ventricular systolic and diastolic function of CSF patients is reduced. This result is consistent with our previous reports.28,29
The pathogenesis of CSF is currently unclear, but studies have indicated that CSF is closely related to inflammatory response.30,31 In accordance with the results of previous studies, we also found that plasma IL-6, TNF-α, and ICAM-1 levels were significantly increased in CSF patients, and were significantly positively correlated with the mean cTFC, suggesting that coronary blood flow velocity is closely related to inflammation.7,8,10 At present, the diagnosis of CSF relies mainly on invasive and high-cost coronary angiography. There is no clear molecular marker for the diagnosis and treatment of CSF. Through multivariate linear regression and logistic regression analyses in this study, we identified plasma sICAM-1 is an independent predictor for the diagnosis of CSF with has high sensitivity and specificity. Thus, it indicates that sICAM-1 levels have good diagnostic ability for CSF, suggesting that plasma sICAM-1 is a candidate biomarker related to CSF diagnosis. Studies have shown that ICAM-1 is shed from injured endothelial cells and can be measured as a soluble form in plasma. The level of sICAM-1 in peripheral blood can reflect the degree of ICAM-1 expression on the cell surface.32 Plasma ICAM-1 has also been implicated as a molecular marker for the development of atherosclerosis and coronary heart disease.11,33 In this study, we also showed that plasma miR-148b-3p levels in the CSF group were significantly reduced, and were negatively correlated with the mean cTFC and sICAM-1 levels. Statistical analysis of these data showed that the plasma miR-148b-3p AUC was 0.74, and the plasma miR-148b-3p level was an independent predictor of CSF diagnosis, suggesting that the plasma miR-148b-3p level is a potential biomarker of CSF. It has reported that plasma miR-148b-3p is reduced in patients with MV regurgitation and ischemic stroke, and can be used as a biological marker for the diagnosis of these conditions.20,34
Circulating lncRNAs are unusually stable in the blood, and may be a non-invasive tool for rapid diagnosis and prognosis of diseases.35,36 In this study, we found that the plasma NEAT1 level in the CSF group was significantly higher than that in the control group, and was positively correlated with the mean cTFC and sICAM-1 levels. ROC curve analysis showed that the plasma NEAT1 AUC was 0.92, suggesting that the plasma NEAT1 level may be a biomarker for the diagnosis of CSF. In accordance with this study of CSF, high plasma NEAT1 levels have also been identified as a new biomarker for the diagnosis of acute myocardial infarction and the prognosis of acute ischemic stroke.37,38
Studies have shown that clinical biomarkers may be related to the pathogenesis of the disease.39 Our ROC curve analysis indicated that NEAT1 combined with miR-148b-3p and sICAM-1 demonstrates better predictive power (AUC: 0.97) compared with other factors. Combined with correlation analysis, this finding indicated that NEAT1 combined with miR-148b-3p and sICAM-1 is a potential biomarker for the diagnosis of CSF and it is also potentially related to the mechanism of action as biomarkers. On this basis, we used the OGD cell model to simulate the functional changes of CSF vascular endothelial cells and explore the underlying mechanism. Studies have shown that ICAM-1 expression is significantly increased in HUVECs exposed to intermittent hypoxia or hypoxia and hypoglycemia.40,41 ICAM-1 is upregulated in HUVECs under conditions of hypoxia, and promotes apoptosis.42 The results of this study showed that ICAM-1 expression was significantly increased in OGD-treated HUVECs. Furthermore, ICAM-1 knockdown promoted cell proliferation and inhibited apoptosis. These results suggest that ICAM-1 exerts anti-proliferative and pro-apoptotic effects in OGD-treated HUVECs.
Predictive analysis using the bioinformatics database, Starbase, revealed that a potential miR-148b-3p binding site (5ʹ-GCACUG-’3) in the 3ʹ-UTR region of the ICAM-1 gene. qRT-PCR analysis confirmed miR-148b-3p expression was significantly reduced in OGD-treated HUVECs. MiR-148b-3p mimics promoted the proliferation of HUVECs and inhibited apoptosis, while miR-148b-3p inhibitors had the opposite effect, suggesting that miR-148b-3p plays a protective role in OGD-treated HUVECs. Other studies have also shown that miR-148b-3p mimics promoted HUVECs apoptosis and inhibited cell proliferation.14 In this study, we used the dual-luciferase reporter system and the avidin-biotin pull-down assay to show that miR-148b-3p directly targets and binds to ICAM-1 3ʹ-UTR, suggesting that ICAM-1 is the downstream target gene of miR-148b-3p. Studies have shown that miR-148b-3p can participate in regulating the occurrence and development of many diseases by binding and regulating target genes. MiR-148b-3p promotes the metastasis of gastric cancer through targeted regulation of Dock6.43 In addition, we found that miR-148b-3p mimics promoted the proliferation of HUVECs and inhibited apoptosis, while ICAM-1 overexpression had the opposite effects. The results of rescue experiments showed that miR-148b-3p mimics reversed the anti-proliferative and pro-apoptotic effects of ICAM-1 in HUVECs. These results suggest that miR-148b-3p mimics inhibits the anti-proliferative and pro-apoptotic effects of OGD-treated HUVECs by negatively regulating the expression of target gene ICAM-1.
Some lncRNAs have been identified as biomarkers for the diagnosis, treatment and prognosis of different cardiovascular diseases.44,45 In this study, predictive analysis using the Starbase bioinformatics database revealed a potential binding site (5ʹ-GCACUG-3ʹ) for NEAT1 in the miR-148b-3p sequence, which is consistent with the binding sequence of miR-148b-3p in ICAM-1. NEAT1 was found to be highly expressed in OGD-treated HUVECs, and NEAT1 knockdown significantly promoted cell proliferation and inhibited apoptosis. Similarly, Zhou et al reported increased NEAT1 expression in OGD-treated brain microvascular endothelial cells.46 When studying lncRNA sensitive to hypoxia, Franziska et al found that NEAT1 was present with the highest abundance in cardiac vesicles under hypoxia.47 NEAT1 is increased in the plasma of patients with acute kidney injury, and can promote renal tubular epithelial cell apoptosis under conditions of hypoxia.48 Our studies using a dual-luciferase reporter system, RIP assay and avidin-biotin pull-down assay confirmed that NEAT1 binds directly to miR-148b-3p. NEAT1 and miR-148b-3p are enriched in the Ago2 protein complexes, suggesting that NEAT1 acts as a molecular sponge or ceRNA of miR-148b-3p in an Ago2-dependent manner. And the avidin-biotin pull-down assay show that miR-148b-3p could directly bind to NEAT1 and ICAM-1 mRNA, respectively, while NEAT1 could not bind to ICAM-1 mRNA. We also found that NEAT1 knockdown increased miR-148b-3p expression and promoted HUVEC proliferation while inhibiting apoptosis. The NEAT1 binding sequence in miR-148b-3p is consistent with the miR-148b-3p binding sequence in ICAM-1 (5ʹ-GCACUG-3ʹ), suggesting that NEAT1 functions as a ceRNA and regulates the proliferation or apoptosis of HUVECs. These results suggested that by specifically binding to miR-148b-3p, NEAT1 weakens the negative regulatory effects of miR-148b-3p on the target gene ICAM-1 to upregulate ICAM-1 expression, as well as inhibiting the proliferation of HUVECs and promoting their apoptosis. In accordance with the results of this study, other lncRNAs have been shown to regulate HUVEC functions. For example, lncRNA-TTTY15 regulates the HUVEC damage induced by hypoxia in cardiovascular diseases by targeting miR-186-5p.49 LINC00305 acts as a molecular sponge of miR-136 and promotes hypoxia-induced apoptosis of HUVEC.50 At the same time, we confirmed whether the upstream factors changed after ICAM-1 or miR-148b-3p regulation. We detected the expression of NEAT1 and miR-148b-3p after ICAM-1 overexpression or knockdown, and measured the expression of NEAT1 after mimics and inhibitors of miR-148b-3p. The results further clarify the upstream and downstream relationship of the NEAT1/miR-148b-3p/ICAM-1 signaling pathway, NEAT1 serve as a “miRNA molecular sponge” to participate in the formation of a competitive endogenous RNA, and regulate ICAM-1 by combining with miR-148b-3p.
In summary, this study shows for the first time the clinical value of plasma sICAM-1, miR-148b-3p and NEAT1 expression levels as independent predictors of a CSF diagnosis. Furthermore, we showed that the diagnostic ability of plasma NEAT1 level is superior to that of sICAM-1 and miR-148b-3p. Furthermore, cytological studies showed that the highly expressed NEAT1 functions as a ceRNA in OGD-treated HUVECs. By specifically binding to miR-148b-3p, NEAT1 weakens the negative regulatory effects of miR-148b-3p on the target gene ICAM-1 to upregulates ICAM-1 expression, as well as inhibiting the proliferation of HUVECs and promoting their apoptosis. The combined results of our clinical and cytological studies clarify for the first time the crucial role of the NEAT1/miR-148b-3p/ICAM-1 axis in CSF disease progression and highlighting the potential value of these as new targets for CSF diagnosis and treatment. Further investigation of the therapeutic value of the corresponding targets is warranted.
Data Sharing Statement
The data used and analysed during the current study are available from the corresponding author on reasonable request.
Ethics Approval and Informed Consent
All research involving humans was conducted in compliance with the Declaration of Helsinki and approved by the Institutional Review Committee of the First Affiliated Hospital of China Medical University (the approval reference number: AF-SOP-07-1.1-01). Written informed consent was obtained from all participants.
Consent for Publication
Not applicable. The details of any images, etc can be published, and that the person(s) providing consent have been shown the article contents to be published.
Author Contributions
All authors made a significant contribution to the work reported, whether that is in the conception, study design, execution, acquisition of data, analysis and interpretation, or in all these areas; have drafted, revised or critically reviewed the article; have agreed on the journal to which the article will be submitted; gave final approval of the version to be published; and agree to be accountable for all aspects of the work.
Funding
This work was supported by the National Natural Science Foundation of China (grant number 81871373 and 81901766) and the Shenyang Science and Technology Plan Project (grant numbers 20-205-4-014) in study design and in the collection, analysis and interpretation of data.
Disclosure
The authors declare no competing interests.
References
1. Beltrame JF, Limaye SB, Horowitz JD. The coronary slow flow phenomenon–a new coronary microvascular disorder. Cardiology. 2002;97(4):197–202. doi:10.1159/000063121
2. Hawkins BM, Stavrakis S, Rousan TA, Abu-Fadel M, Schechter E. Coronary slow flow–prevalence and clinical correlations. Circ J. 2012;76(4):936–942. doi:10.1253/circj.CJ-11-0959
3. Serne EH, de Jongh RT, Eringa EC, Stehouwer CD. Microvascular dysfunction: a potential pathophysiological role in the metabolic syndrome. Hypertension. 2007;50(1):204–211. doi:10.1161/HYPERTENSIONAHA.107.089680
4. Sezgin AT, Sigirci A, Barutcu I, et al. Vascular endothelial function in patients with slow coronary flow. Coron Artery Dis. 2003;14(2):155–161. doi:10.1097/00019501-200304000-00008
5. Yasri S, Wiwanitkit V. Interleukin-1 gene cluster polymorphisms associated with coronary slow flow phenomenon. Anatol J Cardiol. 2018;19(3):229. doi:10.14744/AnatolJCardiol.2018.26429
6. Danaii S, Shiri S, Dolati S, et al. The association between inflammatory cytokines and miRNAs with slow coronary flow phenomenon. Iran J Allergy Asthma Immunol. 2020;19(1):56–64. doi:10.18502/ijaai.v19i1.2418
7. Li JJ, Qin XW, Li ZC, et al. Increased plasma C-reactive protein and interleukin-6 concentrations in patients with slow coronary flow. Clin Chim Acta. 2007;385(1–2):43–47. doi:10.1016/j.cca.2007.05.024
8. Huang J, Yang Q, He L, Huang J. Role of TLR4 and miR-155 in peripheral blood mononuclear cell-mediated inflammatory reaction in coronary slow flow and coronary arteriosclerosis patients. J Clin Lab Anal. 2018;32(2). doi:10.1002/jcla.22232
9. Gazi E, Barutcu A, Altun B, et al. Intercellular adhesion molecule-1 K469E and angiotensinogen T207M polymorphisms in coronary slow flow. Med Princ Pract. 2014;23(4):346–350. doi:10.1159/000363451
10. Turhan H, Saydam GS, Erbay AR, et al. Increased plasma soluble adhesion molecules; ICAM-1, VCAM-1, and E-selectin levels in patients with slow coronary flow. Int J Cardiol. 2006;108(2):224–230. doi:10.1016/j.ijcard.2005.05.008
11. Hwang SJ, Ballantyne CM, Sharrett AR, et al. Circulating adhesion molecules VCAM-1, ICAM-1, and E-selectin in carotid atherosclerosis and incident coronary heart disease cases: the Atherosclerosis Risk in Communities (ARIC) Study. Circulation. 1997;96(12):4219–4225. doi:10.1161/01.CIR.96.12.4219
12. Cheng HS, Besla R, Li A, et al. Paradoxical suppression of atherosclerosis in the absence of microRNA-146a. Circ Res. 2017;121(4):354–367. doi:10.1161/CIRCRESAHA.116.310529
13. Pankratz F, Hohnloser C, Bemtgen X, et al. MicroRNA-100 suppresses chronic vascular inflammation by stimulation of endothelial autophagy. Circ Res. 2018;122(3):417–432. doi:10.1161/CIRCRESAHA.117.311428
14. Zhang H, Ye Q, Du Z, Huang M, Zhang M, Tan H. MiR-148b-3p inhibits renal carcinoma cell growth and pro-angiogenic phenotype of endothelial cell potentially by modulating FGF2. Biomed Pharmacother. 2018;107:359–367. doi:10.1016/j.biopha.2018.07.054
15. Liu X, Zhan Z, Xu L, et al. MicroRNA-148/152 impair innate response and antigen presentation of TLR-triggered dendritic cells by targeting CaMKIIalpha. J Immunol. 2010;185(12):7244–7251. doi:10.4049/jimmunol.1001573
16. Zhu Y, Ni T, Lin J, Zhang C, Zheng L, Luo M. Long non-coding RNA H19, a negative regulator of microRNA-148b-3p, participates in hypoxia stress in human hepatic sinusoidal endothelial cells via NOX4 and eNOS/NO signaling. Biochimie. 2019;163:128–136. doi:10.1016/j.biochi.2019.04.006
17. Takata T, Nonaka W, Iwama H, et al. Light exercise without lactate elevation induces ischemic tolerance through the modulation of microRNA in the gerbil hippocampus. Brain Res. 2020;1732:146710. doi:10.1016/j.brainres.2020.146710
18. Jurcic V, Bolha L, Matjasic A, et al. Association between histopathological changes and expression of selected microRNAs in skin of adult patients with IgA vasculitis. Histopathology. 2019;75(5):683–693. doi:10.1111/his.13927
19. Kiyosawa N, Watanabe K, Morishima Y, et al. Exploratory analysis of circulating miRNA signatures in atrial fibrillation patients determining potential biomarkers to support decision-making in anticoagulation and catheter ablation. Int J Mol Sci. 2020;21(7):2444. doi:10.3390/ijms21072444
20. Chen MC, Chang TH, Chang JP, et al. Circulating miR-148b-3p and miR-409-3p as biomarkers for heart failure in patients with mitral regurgitation. Int J Cardiol. 2016;222:148–154. doi:10.1016/j.ijcard.2016.07.179
21. Sallam T, Sandhu J, Tontonoz P. Long noncoding RNA discovery in cardiovascular disease: decoding form to function. Circ Res. 2018;122(1):155–166. doi:10.1161/CIRCRESAHA.117.311802
22. Clemson CM, Hutchinson JN, Sara SA, et al. An architectural role for a nuclear noncoding RNA: NEAT1 RNA is essential for the structure of paraspeckles. Mol Cell. 2009;33(6):717–726. doi:10.1016/j.molcel.2009.01.026
23. Choudhry H, Mole DR. Hypoxic regulation of the noncoding genome and NEAT1. Brief Funct Genomics. 2016;15(3):174–185. doi:10.1093/bfgp/elv050
24. Ma M, Hui J, Zhang QY, Zhu Y, He Y, Liu XJ. Long non-coding RNA nuclear-enriched abundant transcript 1 inhibition blunts myocardial ischemia reperfusion injury via autophagic flux arrest and apoptosis in streptozotocin-induced diabetic rats. Atherosclerosis. 2018;277:113–122. doi:10.1016/j.atherosclerosis.2018.08.031
25. Gibson CM, Cannon CP, Daley WL, et al. TIMI frame count: a quantitative method of assessing coronary artery flow. Circulation. 1996;93(5):879–888. doi:10.1161/01.CIR.93.5.879
26. Spertus JA, Winder JA, Dewhurst TA, et al. Development and evaluation of the Seattle angina questionnaire: a new functional status measure for coronary artery disease. J Am Coll Cardiol. 1995;25(2):333–341. doi:10.1016/0735-1097(94)00397-9
27. Liu J, An P, Xue Y, et al. Mechanism of Snhg8/miR-384/Hoxa13/FAM3A axis regulating neuronal apoptosis in ischemic mice model. Cell Death Dis. 2019;10(6):441. doi:10.1038/s41419-019-1631-0
28. Wang YH, Zhang Y, Ma CY, et al. Evaluation of left and right atrial function in patients with coronary slow-flow phenomenon using two-dimensional speckle tracking echocardiography. Echocardiogr J Card. 2016;33(6):871–880. doi:10.1111/echo.13197
29. Li Y, Wang Y, Jia D, et al. Assessment of risk factors and left ventricular function in patients with slow coronary flow. Heart Vessels. 2016;31(3):288–297. doi:10.1007/s00380-014-0606-4
30. Su Q, Yang H, Li L. Circulating miRNA-155 as a potential biomarker for coronary slow flow. Dis Markers. 2018;2018:6345284. doi:10.1155/2018/6345284
31. Yayla C, Akboga MK, Gayretli yayla K, et al. A novel marker of inflammation in patients with slow coronary flow: lymphocyte-to-monocyte ratio. Biomark Med. 2016;10(5):485–493. doi:10.2217/bmm-2016-0022
32. Meydani M. Soluble adhesion molecules: surrogate markers of cardiovascular disease? Nutr Rev. 2003;61(2):63–68. doi:10.1301/nr.2003.febr.63-68
33. Blankenberg S, Rupprecht HJ, Bickel C, et al. Circulating cell adhesion molecules and death in patients with coronary artery disease. Circulation. 2001;104(12):1336–1342. doi:10.1161/hc3701.095949
34. Cheng X, Kan P, Ma Z, et al. Exploring the potential value of miR-148b-3p, miR-151b and miR-27b-3p as biomarkers in acute ischemic stroke. Biosci Rep. 2018;38(6):6. doi:10.1042/BSR20181033
35. Omura J, Habbout K, Shimauchi T, et al. Identification of long noncoding RNA H19 as a new biomarker and therapeutic target in right ventricular failure in pulmonary arterial hypertension. Circulation. 2020;142(15):1464–1484. doi:10.1161/CIRCULATIONAHA.120.047626
36. Gomes CPC, Schroen B, Kuster GM, et al. Regulatory RNAs in heart failure. Circulation. 2020;141(4):313–328. doi:10.1161/CIRCULATIONAHA.119.042474
37. Wei Q, Zhou HY, Shi XD, Cao HY, Qin L. Long noncoding RNA NEAT1 promotes myocardiocyte apoptosis and suppresses proliferation through regulation of miR-129-5p. J Cardiovasc Pharmacol. 2019;74(6):535–541. doi:10.1097/FJC.0000000000000741
38. Li P, Duan S, Fu A. Long noncoding RNA NEAT1 correlates with higher disease risk, worse disease condition, decreased miR-124 and miR-125a and predicts poor recurrence-free survival of acute ischemic stroke. J Clin Lab Anal. 2020;34(2):e23056.
39. Creemers EE, Tijsen AJ, Pinto YM, van Rooij E. Circulating microRNAs: novel biomarkers and extracellular communicators in cardiovascular disease? Circ Res. 2012;110(3):483–495. doi:10.1161/CIRCRESAHA.111.247452
40. Sun H, Zhang H, Li K, et al. ESM-1 promotes adhesion between monocytes and endothelial cells under intermittent hypoxia. J Cell Physiol. 2019;234(2):1512–1521. doi:10.1002/jcp.27016
41. Buras JA, Stahl GL, Svoboda KK, Reenstra WR. Hyperbaric oxygen downregulates ICAM-1 expression induced by hypoxia and hypoglycemia: the role of NOS. Am J Physiol Cell Physiol. 2000;278(2):C292–302. doi:10.1152/ajpcell.2000.278.2.C292
42. Yang S, Yin J, Hou X. Inhibition of miR-135b by SP-1 promotes hypoxia-induced vascular endothelial cell injury via HIF-1alpha. Exp Cell Res. 2018;370(1):31–38. doi:10.1016/j.yexcr.2018.06.001
43. Li X, Jiang M, Chen D, et al. miR-148b-3p inhibits gastric cancer metastasis by inhibiting the Dock6/Rac1/Cdc42 axis. J Exp Clin Cancer Res. 2018;37(1):71. doi:10.1186/s13046-018-0729-z
44. Lorenzen JM, Thum T. Long noncoding RNAs in kidney and cardiovascular diseases. Nat Rev Nephrol. 2016;12(6):360–373. doi:10.1038/nrneph.2016.51
45. Uchida S, Dimmeler S. Long noncoding RNAs in cardiovascular diseases. Circ Res. 2015;116(4):737–750. doi:10.1161/CIRCRESAHA.116.302521
46. Zhou ZW, Zheng LJ, Ren X, Li AP, Zhou WS. LncRNA NEAT1 facilitates survival and angiogenesis in oxygen-glucose deprivation (OGD)-induced brain microvascular endothelial cells (BMECs) via targeting miR-377 and upregulating SIRT1, VEGFA, and BCL-XL. Brain Res. 2019;1707:90–98. doi:10.1016/j.brainres.2018.10.031
47. Franziska K, Bang C, Xiao K, et al. Long noncoding RNA-enriched vesicles secreted by hypoxic cardiomyocytes drive cardiac fibrosis. Mol Ther Nucleic Acids. 2019;18:363–374. doi:10.1016/j.omtn.2019.09.003
48. Jiang X, Li D, Shen W, Shen X, Liu Y. LncRNA NEAT1 promotes hypoxia-induced renal tubular epithelial apoptosis through downregulating miR-27a-3p. J Cell Biochem. 2019;120(9):16273–16282. doi:10.1002/jcb.28909
49. Zheng J, Zhuo YY, Zhang C, Tang GY, Gu XY, Wang F. LncRNA TTTY15 regulates hypoxia-induced vascular endothelial cell injury via targeting miR-186-5p in cardiovascular disease. Eur Rev Med Pharmacol Sci. 2020;24(6):3293–3301. doi:10.26355/eurrev_202003_20697
50. Zhang BY, Jin Z, Zhao Z. Long intergenic noncoding RNA 00305 sponges miR-136 to regulate the hypoxia induced apoptosis of vascular endothelial cells. Biomed Pharmacother. 2017;94:238–243. doi:10.1016/j.biopha.2017.07.099
 © 2021 The Author(s). This work is published and licensed by Dove Medical Press Limited. The full terms of this license are available at https://www.dovepress.com/terms.php and incorporate the Creative Commons Attribution - Non Commercial (unported, v3.0) License.
By accessing the work you hereby accept the Terms. Non-commercial uses of the work are permitted without any further permission from Dove Medical Press Limited, provided the work is properly attributed. For permission for commercial use of this work, please see paragraphs 4.2 and 5 of our Terms.
© 2021 The Author(s). This work is published and licensed by Dove Medical Press Limited. The full terms of this license are available at https://www.dovepress.com/terms.php and incorporate the Creative Commons Attribution - Non Commercial (unported, v3.0) License.
By accessing the work you hereby accept the Terms. Non-commercial uses of the work are permitted without any further permission from Dove Medical Press Limited, provided the work is properly attributed. For permission for commercial use of this work, please see paragraphs 4.2 and 5 of our Terms.