")
Back to Journals » OncoTargets and Therapy » Volume 13
lncRNA MT1JP Suppresses Biological Activities of Breast Cancer Cells in vitro and in vivo by Regulating the miRNA-214/RUNX3 Axis
Authors Ouyang Q, Cui Y, Yang S, Wei W, Zhang M , Zeng J , Qu F
Received 8 December 2019
Accepted for publication 1 April 2020
Published 4 June 2020 Volume 2020:13 Pages 5033—5046
DOI https://doi.org/10.2147/OTT.S241503
Checked for plagiarism Yes
Review by Single anonymous peer review
Peer reviewer comments 2
Editor who approved publication: Professor Yong Teng
Qianwen Ouyang,1 Yanru Cui,2 Shixin Yang,1 Wensong Wei,1 Mingyue Zhang,3 Jie Zeng,1 Fei Qu3
1Department of Breast Surgery, The Third Hospital of Nanchang, Jiangxi, China Jiangxi Province Key Laboratory for Breast Diseases, Nanchang, Jiangxi 330009, People’s Republic of China; 2Department of Physiology, Jiangxi University of Traditional Chinese Medicine, Nanchang 330004, People’s Republic of China; 3Department of Pharmacology, Jiangxi University of Traditional Chinese Medicine, Nanchang 330004, People’s Republic of China
Correspondence: Fei Qu
Department of Pharmacology, Jiangxi University of Traditional Chinese Medicine, Nanchang 330004, People’s Republic of China
Email [email protected]
Introduction: The purpose of our research was to evaluate MT1JP in breast cancer.
Material and Methods: For clinical purpose, tissues were collected, and a correlation analysis ofMT1JP and miRNA-214 gene expressions was conducted. Using an in vitro study, MDA-MB-231 and MCF-7 cell lines were used as research objects in our research. Colony, flow cytometry, TUNEL, transwell, adhesion and wound healing assay were used to discuss the biological activities of the cells. In an in vivo study, tumor weight and volume were measured, and cell apoptosis was measured by TUNEL assay. The relative mechanism’s proteins were evaluated by Western blotting or immunohistochemistry assay.
Results: Compared with adjacent tissues, MT1JP and miRNA-214 gene expressions were significantly different (P< 0.001, respectively). By in vitro and in vivo studies, the biological activities of the cells were significantly decreased in MDA-MB-231 and MCF-7 cell lines with MT1JP overexpression. The relative mechanism was correlated with miRNA-214/RUNX3 axis.
Conclusion: The overexpression of MT1JP suppresses the biological activities of breast cancer cells by regulation miRNA-214/RUNX3 axis in vitro and vivo study.
Keywords: MT1JP, MCF-7, MDA-MB-231, invasion, proliferation, migration
Introduction
Breast cancer is one of the most common cancers among females worldwide and has a high mortality rate.1 An estimated 40,610 patients with breast cancer were reported in the United States in 2017.2 In the past decade, treatment and diagnosis of breast cancer have developed rapidly; however, problems exist in the prognosis of breast cancer due to tumor metastasis.3 Exploring relevant biological molecular mechanisms of breast cancer is therefore crucial for advancing the development of novel therapeutics for this disease.
Long noncoding RNAs (lncRNAs) are molecules of noncoding RNA with a length greater than 200 nucleotides.4 LncRNAs do not encode proteins and were previously thought to be the “noise” of transcription.5 However, studies have demonstrated that lncRNA exerts significant influence in a variety of biological activities.6 lncRNAs were found to be differentially expressed in gastric cancer, colorectal cancer and thyroid cancer.7 Dysfunction of lncRNA is indicated to have an intimate association with tumor prognosis, affecting the biological processes of tumors.8 For example, it was reported that the lncRNA encoded by metallothionein 1J (MT1JP) was involved in tumorigenesis, and its expression was down-regulated in gastric cancer, bladder cancer, glioma, lung cancer and other cancerous tissues and cells.9–12 Meanwhile, other studies indicated that MT1JP could function by regulating particular miRNAs.13,14 However, to date, there are limited studies concerning the role of MT1JP in breast cancer and related mechanisms. This study, therefore, aimed to investigate the expression of MT1JP and related miRNAs in clinical breast cancer tissue samples and adjacent normal tissues, conducting a correlation analysis, and exploring specific mechanisms of action of MT1JP in breast cancer through in vitro and in vivo experiments.
Materials and Methods
Clinical Samples
The clinical samples in this study were 23 cancer tissues and normal paracancerous tissue (>5 cm from the tumor tissue) collected from breast cancer patients confirmed in the Third Hospital of Nanchang from September 2016 to June 2018. All samples were confirmed by the Department of Pathology in our hospital. Enrolled patients had an average age of 48.4±7.09 years (range 38~65 years). All patients were diagnosed with primary breast cancer and had received no radiotherapy or chemotherapy before the operation. Extracted samples were divided into two parts, one of which was placed in 4% paraformaldehyde for pathological examination, and the other in liquid nitrogen for cryopreservation. This study was approved by the ethics committee of third Hospital of Nanchang, which was in accordance with the Declaration of Helsinki. We informed consent was obtained either from the patient or the patient’s family and the patient provided written informed consent before continuing treatment.
Cell Transfection
Breast cancer cell lines MCF-7, MDA-MB-231, BT-549, MDA-MNB-468 and MDA-MB-436, as well as human breast normal epithelial cells MCF10A, were seeded in 6-cm tissue culture dishes and were transfected at a cell density of approximately 80%. For transfection, MT1JP overexpression vector (MT1JP), vector, miRNA-NC (BL) and miRNA-214 overexpression vector (miRNA-214) (8 μg each) in appropriate combinations were mixed with fetal bovine serum (FBS)-free culture medium (500 μL), and labeled as solution A. Lipofectamine 2000 transfection reagent (8 μL) was added to 500μL FBS-free culture medium, mixed well, and labeled as solution B. Solutions A and B were combined and the mixture was incubated at room temperature for 20 min. Culture medium was removed from the tissue culture dishes and cells were washed with PBS. The mixture of solutions A and B was added to the cells and incubated for 5 h before replacing with fresh culture medium. At 48 h post-transfection, the cell was used for subsequent experiments. All cell lines were purchased from KeyGen Biotech (Nanjing, China).
RT-qPCR
Trizol (1 mL) was added to the tissue sample (100 mg) or each well of the 6-well plates containing breast cancer cell lines. With static treatment at room temperature after mixing for 10 min, 500 μL of chloroform was added and samples were placed on ice for 2 min before centrifugation at 12,000 rpm, 4°C for 15 min. The supernatant was transferred to a centrifugal tube, 500 μL isopropanol was added and the mixture was incubated statically for 10 min, followed by centrifugation at 12,000 rpm, 4°C for 15 min. The supernatant was discarded and the pellet was resuspended in 75% ethanol (1 mL) and then centrifuged at 8000 rpm, 4°C for 15 min. The concentration and purity of RNA were detected by UV spectrophotometer. Expression of MT1JP and miRNA-214 was measured by RT-PCR detection kit, with GAPDH or U6 as the internal reference, and the level of MT1JP expression was calculated by the Ct method. Table 1 lists the primer sequences for RT-PCR. The RT-PCR conditions were 40 cycles at 95°C for 30 s, 95°C for 5 s and 60°C for 30 s, followed by 95°C for 15 s, 60°C for 1 min, and 95°C for 15 s. Three replicates were made for each sample, and the data were obtained by averaging.
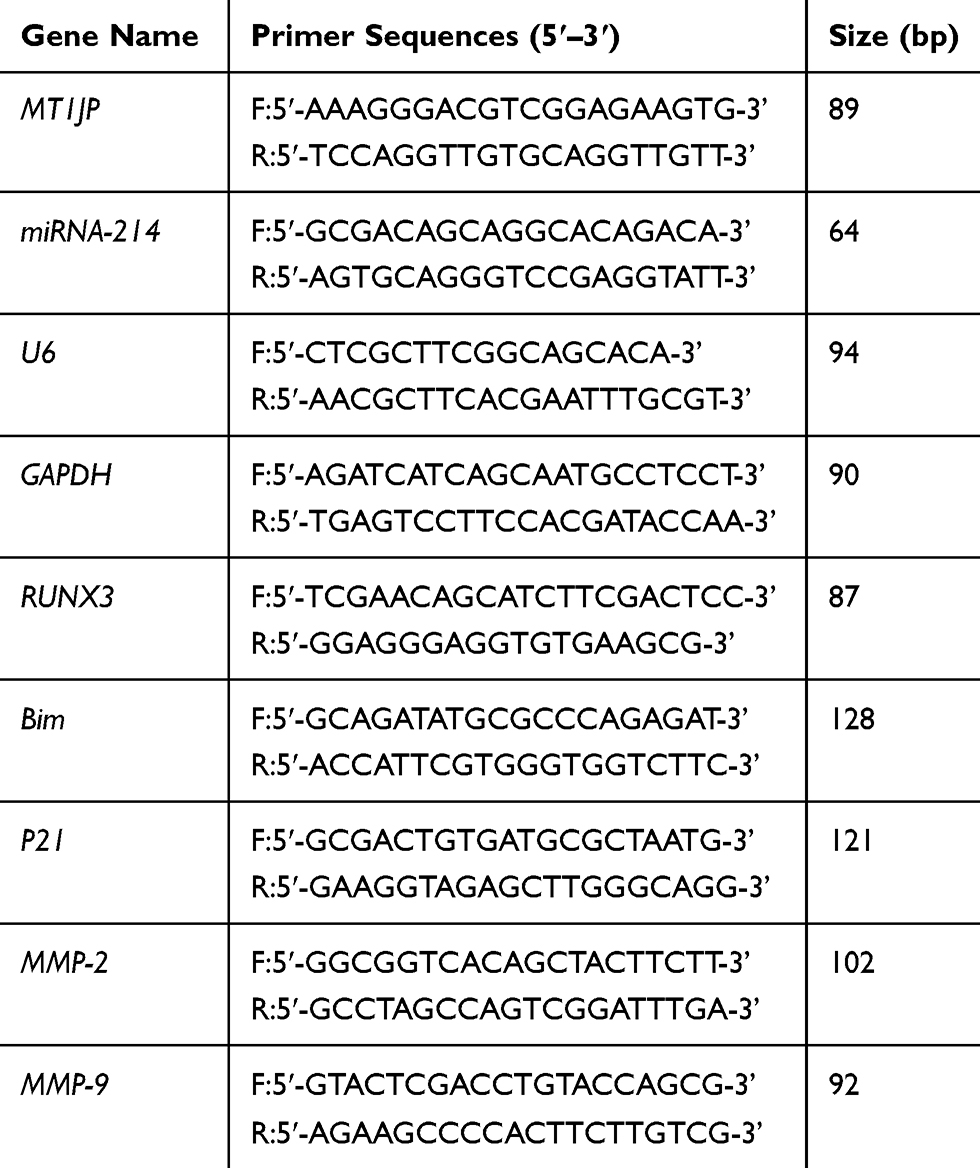 |
Table 1 Primer Sequences |
MTT Assay for Cell Proliferation
After treatment for 48 h, cells were collected and seeded in 96-well tissue culture plates at 2×10³ cells per well, with six replicates for each treatment. Cell culture medium alone was used as the blank control. After incubation for 48 h at 37°C under 5% CO2, 20 μL 4,5-dimethythiazoyl-zyl 2,5-diphenylterrajolium bromide (MTT, 5 mg mL−1) solution was added to each well and incubated for 4 h. The culture medium was then discarded and 150 μL dimethyl sulfoxide was added to each well and mixed for 10 min. Following dissolution of the crystals, the absorbance of each well at 490 nm was measured by a microplate reader, and the cell survival rate was calculated.
Colony Formation Assay
Cells were collected by trypsin digestion 48 h post-transfection. The cell concentration was adjusted to 2×10³ cells mL−1 and 2 mL was added per well of 6-well culture plates and incubated overnight at room temperature. The culture medium was then discarded and cells were fixed with methanol for 10 min and stained with Giemsa for 20 min. Cells were examined under the microscope for the formation of clones, with effective clones assessed as colonies containing >50 cells. The number of cloned cells was calculated for each group.
Detection of Apoptosis Rate by Flow Cytometry
Cells of each group were collected by trypsin digestion 48 h post-transfection, and the concentration was adjusted to 1×10⁵ cells mL−1. The apoptosis rate of each group was then determined according to the instructions of the apoptosis kit (KeyGEN Biotech, Nanjing, Jiangsu, China).
Cell Cycle Analysis by Flow Cytometry
Cells (1×10⁵) from each group were collected and 5 μL RNase (final concentration of 10 mg mL−1) was added and mixed well, followed by incubation at 37°C for 1 h. Propidium iodide (PI) dye solution was then added, mixing with a pipette, and samples were incubated at room temperature in the dark for 30 min. Cell cycle analysis by flow cytometry was carried out within 1 h after the addition of PI.
Detection of Apoptotic DNA Fragments (TUNEL Assay)
Detection of apoptotic DNA fragments was achieved by TUNEL assay. Specifically, after 48 h of treatment, cells in each group were collected (2×10⁴ cells per well, from 8-well plate), fixed with 4% formaldehyde, and embedded onto glass slides. DNA fragment 3ʹ-OH terminal nucleotides were labeled with biotin-dUTP at 37°C for 1.5 h. Slides were then co-incubated with horseradish peroxidase (HRP)-labeled antibodies, and then with 3,3ʹ-diaminobiphenylamine (DAB) and H2O2. Nuclear fluorescence of the DNA fragments was detected under a fluorescence microscope (BX41, Olympus, Japan). Quantitative fluorescence intensity was analyzed by LS5.0 within a square area.
Cell Adhesion Assay
Fibronectin (FN, Sigma L4544, USA) was diluted with serum-free medium (final concentration 10 mg l−1), added into a 96-well plate (50 μL per well), incubated overnight at 4°C, and then the excess liquid was removed. After trypsin digestion and cell counting, 100 μL cells at a density of 1×10⁵ cells mL−1 were added to each well and cultured in a 5% CO2 incubator at 37°C for 1 h. After discarding the culture medium and washing with PBS to remove non-adherent cells, 200 μL serum-free medium was added to each well, and the cells were examined under a microscope, carrying out photography and cell counting.
Transwell Assay
A transwell chamber was used to assess the invasiveness of cells in each group. The cells to be tested were placed in the upper chamber with the addition of serum-free DMEM, and DMEM with serum was added to the lower chamber, which had been pretreated with Matrigel to simulate the extracellular matrix. After incubation for 48 h, invasive cells were fixed with 4% paraformaldehyde, stained slightly with 0.1% crystal violet solution (Beyotime Biotechnology, China), and counted under the microscope.
Wound Healing Assay
Cell migration ability was evaluated by wound healing assay. Treated cells were cultured in a 6-well plate until they reached a cell density of 90%, then a wound was created on the cell surface with a pipette tip. The degree of wound healing was observed at 0, 24 and 48 h after scratching.
Immunofluorescence
Cells of each group were inoculated into 24-well plates, incubated in a CO2 cell incubator for 24 h, after that, taken out in 24-well plates, followed by another incubation in the CO2 cell incubator for 24 h. The cells were then taken out, fixed with 95% ethanol for 1 h, and permeabilized with 0.05% Triton X-100 for 20 min. After washing with PBS, the primary antibody RUNX3 (1:100) was added and incubated at 4°C overnight. Cells were washed with PBS, the goat anti-rabbit fluorescence-labeled secondary antibody was added and incubated in the dark for 1 h, followed by PBS washing (×3). After incubation with DAPI in the dark for 15 min and further PBS washing (×3), cells were observed and photographed under a fluorescence inverted microscope ((BX41, Olympus, Japan)).
Western Blotting
Transfected cells in each group were collected after 48 h of culture, cellular proteins were extracted using a cell protein concentration extraction kit (Key GENE Biotech, Nanjing, Jiangsu, China) and the protein concentration of each sample was determined by BCA protein concentration detection kit. Each protein sample was mixed with an equal volume of 2× sample buffer and boiled at 100°C for 5 min to denature proteins. Subsequently, 50 μL protein samples were added to each well of 10% protein electrophoresis gels, followed by electrophoresis at 90 V for 30 min and then at 120 V for 6 h. Membrane transfer was carried out at 100 V for 90 min at 4°C, and the processed nitrocellulose membrane was sealed with 5% skimmed milk powder at room temperature for 90 min. The primary antibody (×800 dilution, incubation overnight at 4°C) and secondary antibody (×1000 dilution, incubation at room temperature for 90 min) were added in turn, followed by the addition of developer. Glyceraldehyde-3-phosphate dehydrogenase (GAPDH) was used as an internal reference to analyze the expression level of target proteins. RUNX3 (UK, abcam ab224641), Bim (UK, abcam ab32158); P21 (UK, abcam ab109520); MMP-2 (UK, abcam ab92536); MMP-9 (UK, abcam ab76003); GAPDH (UK, abcam ab181602); Goat anti-rabbit IgG-HRP (China, KeyGENE, KGAA35).
Luciferase Constructs and Detection of Luciferase Activity
A luciferase vector was purchased from GenePharm (Shanghai, China). The 3ʹUTR of RUNX3 or MT1JP was cloned into the vector downstream of the luciferase gene, generating RUNX3-WT or MT1JP-WT vectors. Constructs with hypothetical binding sequence mutation sites were prepared by overlapping PCR. Luciferase activity was measured 48 h after transfection using the Dual-Luciferase Assay Kit (Promega, Madison, WI, USA) according to the manufacturer’s instructions.
Establishment of Tumor Model in Nude Mice
Twenty-four male BALB/c nude mice, SPF grade, aged 4~5 weeks were randomly divided into four groups after 3 days of adaptive feeding. The groups comprised Vector (MDA-MB-231 cells transfected with Vector), MT1JP (MDA-MB-231 cells transfected with MT1JP), MT1JP+BL (MDA-MB-231 cells transfected with MT1JP and miRNA-NC) and MT1JP+miRNA-214 (MDA-MB-231 cells transfected with MT1JP and miRNA-214). Cells of each group in the logarithmic growth phase were collected by trypsin digestion and counted, the supernatant was discarded after centrifugation and a single cell suspension was prepared in PBS. After adjusting the concentration to 2×10⁷ cells per mL, 100 μL cell suspension was injected into the armpit of each nude mouse. After injection, the spirit, diet, drinking, defecation and activity of the mice, and growth of subcutaneous tumors were observed regularly. Animal experiments were approved by the ethics committee of Jiangxi University of Traditional Chinese Medicine. This “Animal Experiment Program” has been approved by the Laboratory Animal Ethics Committee, which conforms to the principles of animal protection, animal welfare and ethics and the relevant provisions of the National Laboratory Animal Welfare ethics.
Measurement of Tumor Growth and Weight
The tumor size of each group was recorded once a week when the tumor diameter was 4–5 mm. Long diameter (a) and short diameter (b) of the subcutaneous tumors were measured with vernier calipers. Tumor volume (V) was calculated according to the formula of a×b2/2. After 15 days of tumorigenesis, nude mice were sacrificed and the tumor tissue was collected and weighed.
Detection of Apoptosis in Tumor Tissues
Paraffin-embedded sections of tumor tissues were taken from each group, dewaxed with xylene, hydrated with a gradient concentration of ethanol, washed with PBS and dried, then incubated with protease K at room temperature for 20 min, and dried again after washing. Terminal deoxynucleotidyl transferase (TdT)-mediated dUTP nick end labeling (TUNEL) working solution (50 μL, including 5μL TdT enzyme and 45 μL FITC-labeled dUTR) was dripped onto the section, followed by coverage with preservative film and incubation at 37°C in the dark for 1 h. The reaction was observed and the reaction time was controlled under a light microscope (×400 magnification) after PBS washing and DAB development. The reaction was stopped with tap water after successful color development, followed by hematoxylin nuclear staining for 2 min, returning to blue with lithium carbonate for 20 s, sealing with neutral gum and observation under a microscope. A random selection of five visual fields were examined and cells stained brown or yellow-brown were judged as apoptotic. The apoptotic rate for each group was then calculated.
Pathological Examination of Tumor Tissues
After removal of tumor tissues, they were fixed in 10% neutral formaldehyde and paraffin sections were prepared. The prepared sections were dewaxed with xylene and hydrated by gradient concentration of ethanol, followed by hematoxylin-eosin (HE) staining and observation under the light microscope after sealing with neutral gum.
Immunohistochemistry for Protein Expression in Tumor Tissues
Paraffin sections of tumor tissue were prepared, followed by dewaxing, hydration, antigen repair, and incubation with 3% H2O2 at room temperature for 10 min to eliminate endogenous peroxidase activity. Sections were then incubated at 37°C for 15 min with a sealing solution, and the sealing solution was discarded without washing. The primary antibody (1:100) was added and incubated at 4°C overnight. Washing clear, the corresponding biotin-labeled secondary antibody working solution was added and incubated at 37°C for 15 min, followed by the addition of HRP-labeled working solution of Streptomyces ovalbumin and incubation at 37°C for 10~15 min. After development with DAB for 1–2 min, the reaction was stopped by rinsing with tap water, followed by washing with tap water and re-staining with hematoxylin, dehydration by ethanol and transparent, and sealing with neutral gum. Image J image analysis software was used to analyze the expression level of related proteins in each group.
Statistical Analysis
SPSS 20.0 statistical software was used for statistical analysis. Measurement data were presented as mean ± SD. An analysis of variance was used for comparison of measurement data among multiple groups, and the SNK-q test was used for pairwise comparison. P<0.05 indicated that the difference was statistically significant.
Results
Clinicopathological Analysis, and Gene Expression and Correlation Analysis of MT1JP and miRNA-214
HE staining showed that compared with the adjacent normal tissues, the cells of breast cancer tissues had obvious infiltration and fuzzy intercellular boundaries, indicating a higher degree of deterioration in breast cancer tissue (Figure 1A). RT-qPCR revealed that MT1JP gene expression was significantly lower in breast cancer tissues than in normal tissues (P<0.001, Figure 1B), while miRNA-214 gene expression was obviously higher in breast cancer tissues (P<0.001, Figure 1C). Correlation analysis showed that MT1JP gene expression was negatively correlated with that of miRNA-214 in breast cancer tissue (P=0.0003, Figure 1D).
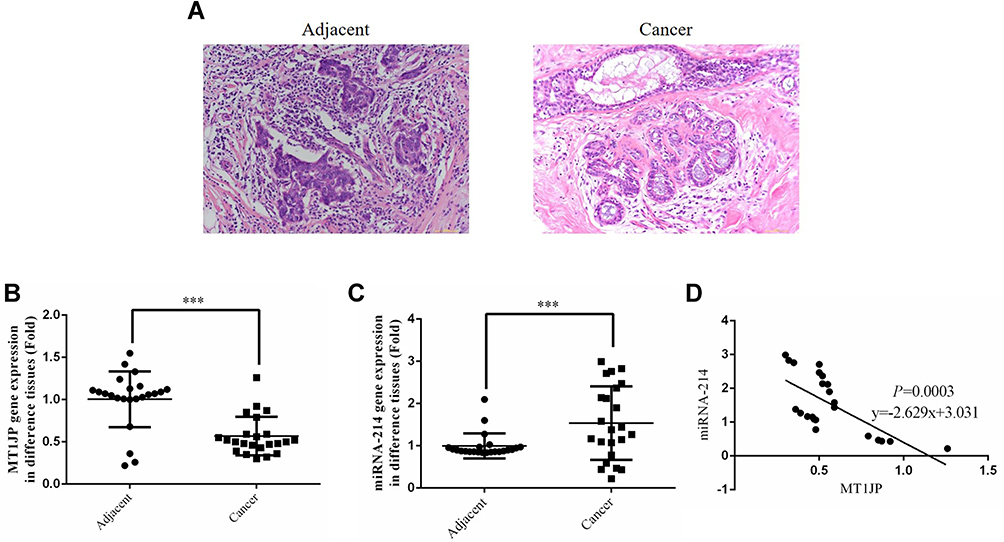 |
Figure 1 Clinicopathological analysis, detection of gene expression and correlation analysis of MT1JP and miRNA-214. (A) Pathology of adjacent and cancer tissues by HE staining (×200 magnification). (B) MT1JP gene expression of adjacent and tumor tissues by RT-qPCR assay. ***P<0.001, compared with adjacent normal tissues. (C) miRNA-214 gene expression of adjacent and tumor tissues by RT-qPCR assay. ***P<0.001, compared with adjacent normal tissues. (D) Correlation between MT1JP and miRNA-214 in tumor tissues. |
Expression of MT1JP in Various Cell Lines and Its Effect on Proliferation of Breast Cancer Cells
In comparison with MCF-10A human normal breast epithelial cells, MT1JP expression decreased significantly in the breast cancer cell lines MCF-7, MDA-MB-231, BT-549, MDA-MB-468, MDA-MB-436 and HCC1937 (P<0.01 or P<0.001, respectively, Figure 2A), with the lowest expression observed in MCF-7 and MDA-MB-231 cell lines. This was in agreement with the RT-qPCR data from breast cancer tissues and adjacent normal tissues. MTT and clone formation assays further showed that following transfection of MT1JP into breast cancer cell lines, the proliferation of MDA-MB-231 and MCF-7 cells was obviously suppressed, and was associated with a significantly reduced number of formed colonies (P<0.001, respectively, Figure 2B–E). However, upon simultaneous transfection with miRNA-214 and MT1JP, cell proliferation and colony formation were evidently reversed and increased in MDA-MB-231 and MCF-7 cell lines when compared with cells transfected with MT1JP alone (P<0.001, respectively, Figure 2B–E).
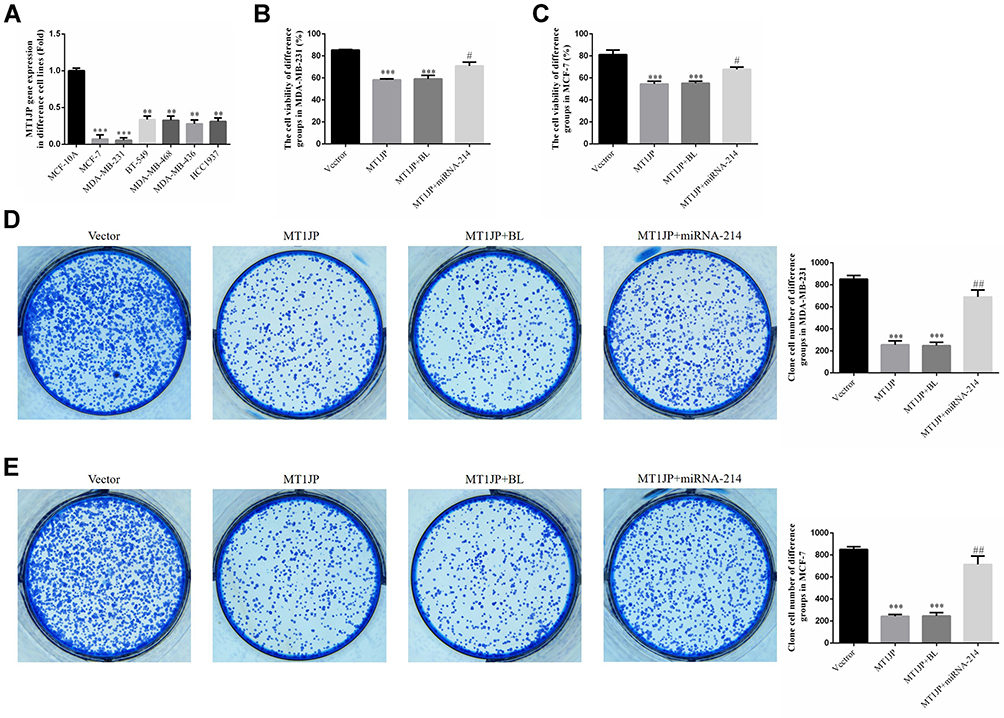 |
Figure 2 Expression of MT1JP in various breast cancer cell lines and its effect on cell proliferation. (A) MT1JP gene expression in various breast cancer cell lines. **P<0.01, ***P<0.001, compared with MCF-10A. (B) MT1JP gene expression in MDA-MB-231 cells transfected with different constructs. ***P<0.001, compared with the Vector group; #P<0.05, compared with the MT1JP group. (C) MT1JP affects colony formation of MDA-MB-231 cells. *** P<0.001, compared with the Vector group; #P<0.05, compared with the MT1JP group. (D) MT1JP affects colony formation of MCF-7 cells. ***P<0.001, compared with the Vector group; ##P<0.01, compared with the MT1JP group. (E) MT1JP affects colony formation of MDA-MB-231 cells. ***P<0.001, compared with the Vector group; ##P<0.01, compared with the MT1JP group. |
Effect of MT1JP on Apoptosis and Cell Cycle of Breast Cancer Cells
TUNEL and flow cytometry were used to detect the apoptosis rate of each group. Compared with the Vector group, the number of apoptotic cells and apoptosis rate in MDA-MB-231 and MCF-7 cells transfected with MT1JP were significantly increased (P<0.001, Figure 3A–D). Following simultaneous transfection with miRNA-214 and MT1JP, the number of apoptotic cells and apoptosis rate of MDA-MB-231 and MCF-7 cells were both remarkably inhibited compared to cells transfected with MT1JP or miRNA-NC and MT1JP (MT1JP+BL) (P<0.001, respectively, Figure 3A–D). Furthermore, based on cell cycle analysis using flow cytometry, the G1 phase ratio of MDA-MB-231 and MCF-7 cells in the MT1JP group and the MT1JP+BL group was significantly increased compared with the Vector group, while the G2 phase ratio was obviously inhibited (P<0.001, respectively, Figure 3E and F). However, in the case of simultaneous cell transfection with miRNA-214 and MT1JP, the cell cycle of both MDA-MB-231 and MCF-7 cells recovered significantly (P<0.001, respectively, Figure 3E and F).
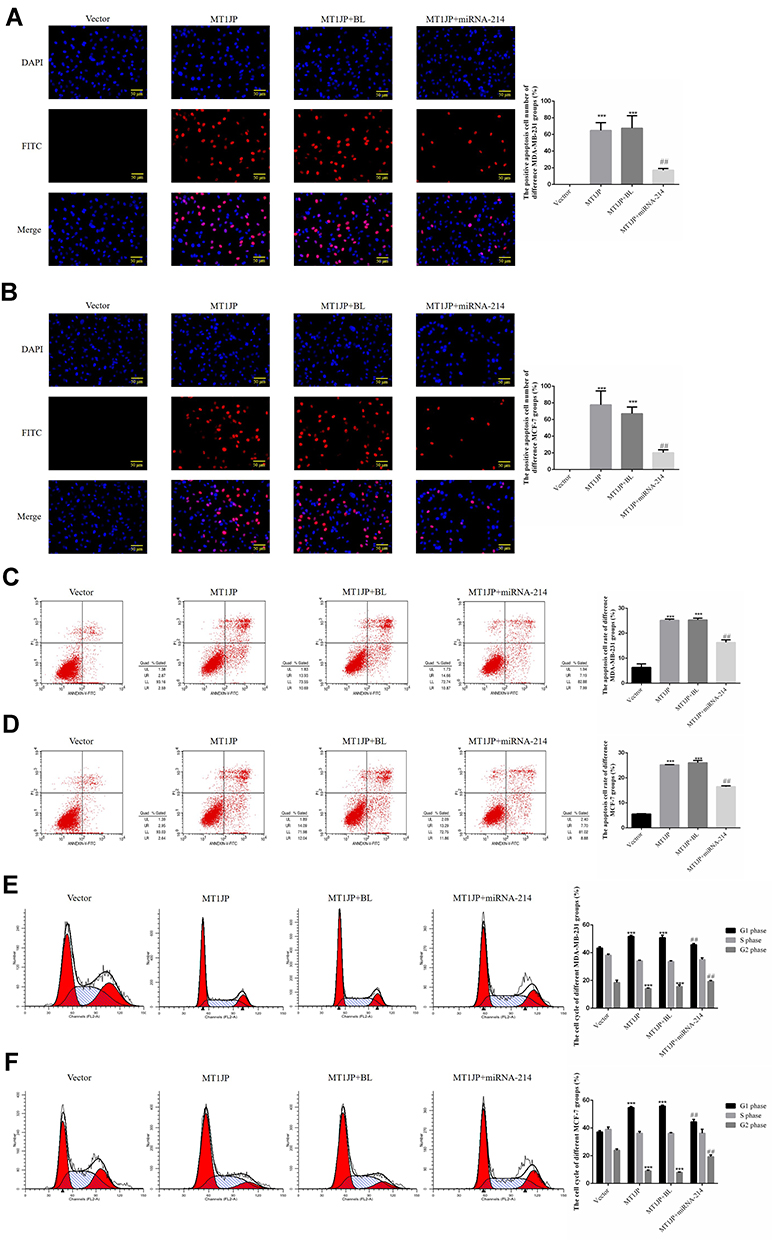 |
Figure 3 Effect of MT1JP on apoptosis and cell cycle of breast cancer cells. (A) MT1JP affects MDA-MB-231 cell apoptosis by TUNEL assay. ***P<0.001, compared with the Vector group; ##P<0.01, compared with the MT1JP group. (B) MT1JP affects MCF-7 cell apoptosis by TUNEL assay. ***P<0.001, compared with the Vector group; ##P<0.01, compared with the MT1JP group. (C) MT1JP affects MDA-MB-231 cell apoptosis by flow cytometry. ***P<0.001, compared with the Vector group; ##P<0.01, compared with the MT1JP group. (D) MT1JP affects MCF-7 cell apoptosis by flow cytometry. ***P<0.001, compared with the Vector group; ##P<0.01, compared with the MT1JP group. (E) MT1JP affects the MDA-MB-231 cell cycle by flow cytometry, ***P<0.001, compared with the Vector group; ##P<0.01, compared with the MT1JP group. (F) MT1JP affects the MCF-7 cell cycle by flow cytometry. ***P<0.001, compared with the Vector group; ##P<0.01, compared with the MT1JP group. |
Effect of MT1JP on Invasion, Migration and Adhesion of Breast Cancer Cells
Assessment of the effect of MT1JP on the invasive ability of breast cancer cells using Transwell assay revealed that the number of invasive MDA-MB-231 and MCF-7 cells in MT1JP and MT1JP+BL groups decreased significantly compared with that of the Vector group (P<0.001, respectively, Figure 4A and B). Meanwhile, in comparison with the MT1JP group, the number of invasive MDA-MB-231 and MCF-7 cells was obviously increased in the MT1JP+miRNA-214 group (P<0.001, Figure 4A and B). The effect of MT1JP on breast cancer cell migration in each group was analyzed using a wound healing assay. Following the transfection of MT1JP into MDA-MB-231 and MCF-7 cells, the wound healing rate of these cell lines was evidently decreased at 24 and 48 h compared with cells of the Vector-transfected group (P<0.001, Figure 4C and D). Following simultaneous transfection of miRNA-214 and MT1JP into MDA-MB-231 and MCF-7 cells, the cell migration activity was remarkably reversed (P<0.05, Figure 4C and D). The adhesion assay results of the effect of MT1JP on the adhesion of breast cancer cells provided further support. Transfection of MT1JP or miRNA-NC and MT1JP (MT1JP+BL) into MDA-MB-231 and MCF-7 cells resulted in a significant decrease in the number of adherent cells (P<0.001, respectively, Figure 4E and F), while simultaneous transfection of miRNA-214 with MT1JP significantly restored the adhesion defect in MDA-MB-231 and MCF-7 cells (P<0.01, Figure 4E and F).
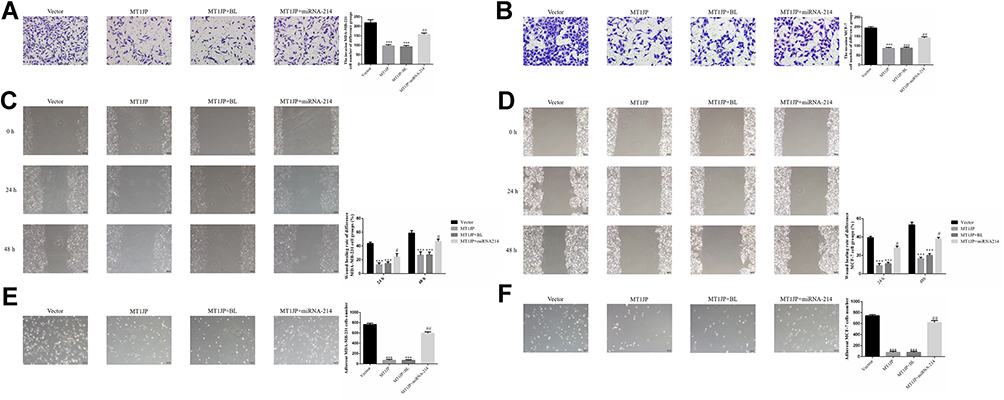 |
Figure 4 Effect of MT1JP on invasion, migration and adhesion of breast cancer cells (A) MT1JP affects invasiveness of MDA-MB-231 cells by transwell assay (×200 magnification) ***P<0.001, compared with Vector group; ##P<0.01, compared with MT1JP group. (B) MT1JP affects the invasiveness of MCF-7 cells by transwell assay (×200 magnification)***P<0.001, compared with the Vector group; ##P<0.01, compared with MT1JP group. (C) MT1JP affects wound healing of MDA-MB-231 cells (×100 magnification) ***P<0.001, compared with the Vector group; #P<0.05, compared with the MT1JP group. (D) MT1JP affects wound healing of MCF-7 cells (×100 magnification). ***P<0.001, compared with the Vector group; #P<0.05, compared with the MT1JP group. (E) MT1JP affect cell adherent ability in MDA-MB-231 cell (×100 magnification). ***P<0.001, compared with the Vector group; ##P<0.01, compared with the MT1JP group. (F) MT1JP affects cell adherent ability in MCF-7 cell (×100 magnification) ***P<0.001, compared with the Vector group; ##P<0.01, compared with the MT1JP group. |
Effect of MT1JP on the Expression of RUNX3 and Related Proteins, and the Effect on Localization of RUNX3
Western blotting revealed that expression of the proteins RUNX3, Bim and P21 in MDA-MB-231 and MCF-7 cells of the MT1JP group and MT1JP+BL group was much higher than in cells of the Vector group, while expression of MMP-2 and MMP-9 proteins was significantly lower (P<0.01, respectively, Figure 5A and B). Following the simultaneous transfection of miRNA-214 with MT1JP, expression of RUNX3, Bim and P21 in MDA-MB-231 and MCF-7 cells was significantly inhibited, while expression of MMP-2 and MMP-9 was obviously increased (P<0.01, respectively, Figure 5A and B). Furthermore, immunofluorescence analysis of the transfected cells showed that RUNX3 was predominantly expressed in the nucleus and that the intensity of expression of RUNX3 in MDA-MB-231 and MCF-7 cells was significantly higher in MT1JP and MT1JP+BL groups compared with the Vector group (P<0.001, respectively, Figure 5C and D). For the MT1JP+miRNA-214 group, in both MDA-MB-231 and MCF-7 cells, the expression of RUNX3 was decreased compared with the MT1JP group (P<0.01, respectively, Figure 5C and D).
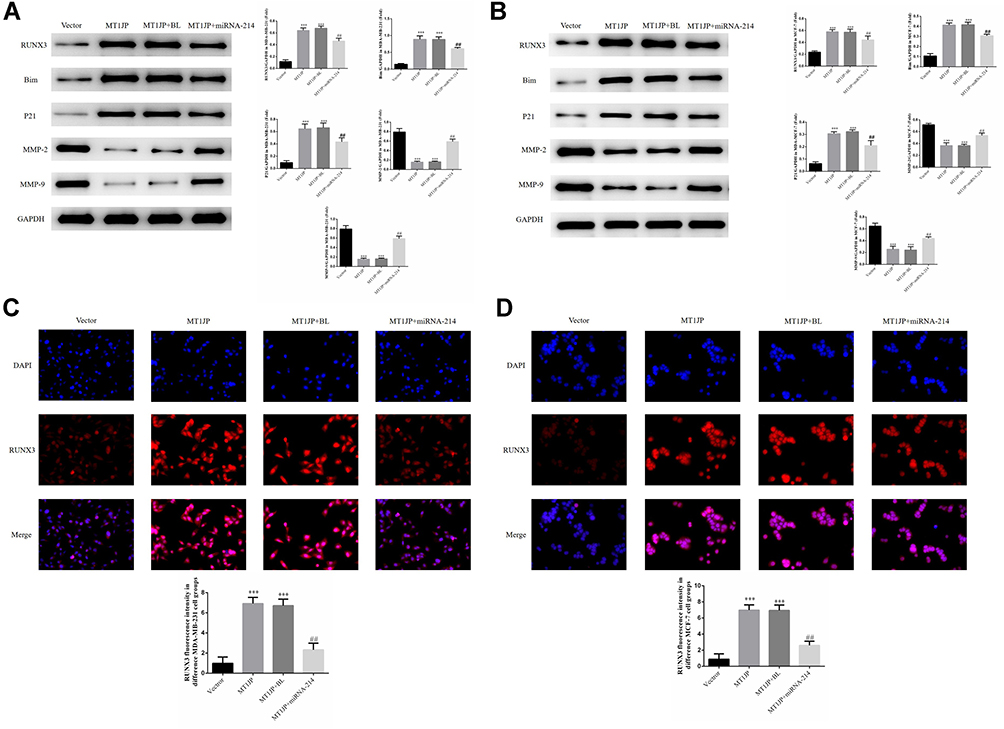 |
Figure 5 Effect of MT1JP on the expression of RUNX3 and related proteins, and the effect on the localization of RUNX3 (A) MT1JP affects relative protein expression in MDA-MB-231 cells as assessed by Western blotting ***P<0.001, compared with Vector group; ##P<0.01, compared with MT1JP group. (B) MT1JP affects relative protein expression in MCF-7 cells as assessed by Western blotting. ***P<0.001, compared with the Vector group; ##P<0.01, compared with the MT1JP group. (C) MT1JP affects RUNX3 protein localization and expression in MDA-MB-231 cells as assessed by immunofluorescence analysis. ***P<0.001, compared with the Vector group; ##P<0.01, compared with the MT1JP group. (D) MT1JP affects RUNX3 protein localization and expression in MCF-7 cells as assessed by immunofluorescence analysis. ***P<0.001, compared with the Vector group; ##P<0.01, compared with the MT1JP group. |
Effect of MT1JP on the Expression of Related Genes and Verification by Dual-Luciferase Reporter Gene Assay
RT-qPCR analysis showed that in MDA-MB-231 and MCF-7 cells, MT1JP gene expression was significantly higher in the MT1JP, MT1JP+BL and MT1JP+miRNA-214 groups compared with the Vector group (P<0.001, respectively, Figure 6A and B). RUNX3, Bim and P21 gene expression was also significantly higher in MT1JP and MT1JP+BL groups (P<0.001, respectively, Figure 6A and B), while expression of miRNA-214, MMP-2 and MMP-9 genes decreased obviously in the MT1JP+miRNA-214 group (P<0.001, respectively, Figure 6A and B). Following simultaneous transfection of miRNA-214 with MT1JP, in MDA-MB-231 and MCF-7 cells, gene expression levels of miRNA-214, RUNX3, Bim, P21, MMP-2 and MMP-9 were significantly reversed compared with those in the MT1JP group (P<0.01, respectively, Figure 6A and B). The dual-luciferase reporter gene assay (Figure 6C) verified that MT1JP could target and regulate miRNA-214, and that miRNA-214 specifically regulated RUNX3.
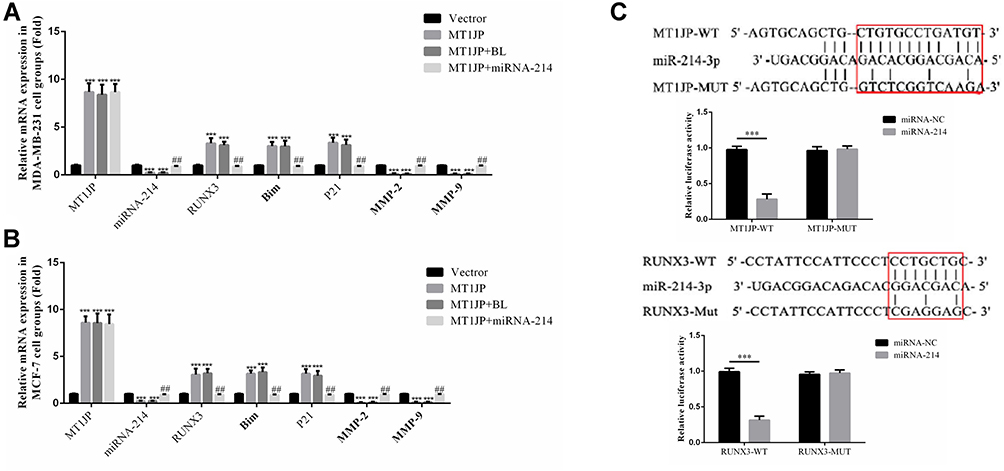 |
Figure 6 Effect of MT1JP on the expression of related genes and verification by dual-luciferase reporter gene assay. (A) MT1JP affects relative gene expression by RT-qPCR assay in MDA-MB-231 cells ***P<0.001, compared with the Vector group; ##P<0.01, compared with MT1JP group. (B) MT1JP affects relative gene expression by RT-qPCR assay in MCF-7 cells ***P<0.001, compared with the Vector group; ##P<0.01, compared with the MT1JP group. (C) Correlation among MT1JP, miRNA-214-3p and RUNX3***P<0.001, compared with the miRNA-NC group. |
Effect of MT1JP on Breast Cancer Cells in vivo
As shown in Figure 7A, compared with the normal Vector group at the same time point, the tumor volume of MT1JP and MT1JP+BL groups decreased significantly from 7 days (P<0.01 or P<0.001, respectively, Figure 7A). After 14 days of treatment, MT1JP and MT1JP+BL groups had significantly reduced tumor weight after tumor tissue stripping and weighing compared with the Vector group (P<0.001, respectively, Figure 7A), while the MT1JP+miRNA-214 group had significantly increased tumor weight compared with the MT1JP group (P<0.01, Figure 7B). In terms of the pathological changes observed in each group by using HE staining (Figure 7C), cells of the Vector group were rich in quantity, tightly distributed, displayed a cord-like appearance, with rich blood supply, different cell sizes, large nuclei and appeared hyperchromatic with mitotic phase. Meanwhile, there were fewer tumor cells in the MT1JP and MT1JP+BL groups than in the Vector group, and the cells displayed a disordered arrangement, with pyknosis of nuclei and light staining of chromatin. There was no significant difference observed between cells of the Vector group and cells of the MT1JP+miRNA-214 group. RT-qPCR was used to detect the expression of related genes. Compared with the Vector group, MT1JP gene expression was much higher in MT1JP, MT1JP+BL and MT1JP+miRNA-214 groups (P<0.001, respectively, Figure 7D), while RUNX3, Bim and P21 gene expression was significantly higher in MT1JP and MT1JP+BL groups (P<0.001, respectively, Figure 7D). Nevertheless, the gene expression levels of miRNA-214, MMP-2 and MMP-9 in the MT1JP+miRNA-214 group decreased significantly (P<0.001, respectively, Figure 7D). Furthermore, upon simultaneous transfection of miRNA-214 with MT1JP, gene expression levels of miRNA-214, RUNX3, Bim, P21, MMP-2 and MMP-9 were significantly reversed when compared to the MT1JP group (P<0.001, respectively, Figure 7D). In addition, TUNEL staining confirmed that the apoptosis rate of the MT1JP and MT1JP+BL groups was obviously higher than that of the Vector group (P<0.001, respectively, Figure 7E), and the apoptosis rate of the MT1JP+miRNA-214 group was obviously lower than that of the MT1JP group (P<0.01, Figure 7E).
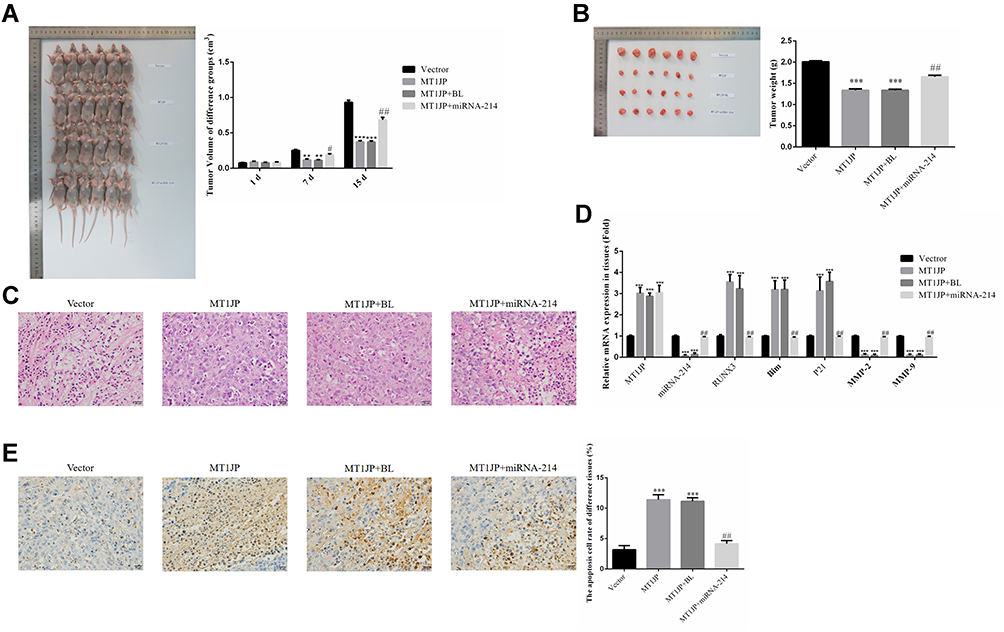 |
Figure 7 Effect of MT1JP on breast cancer cells in vivo. (A) Tumor volume of different experimental groups at different time points. **P<0.01, ***P<0.001, compared with Vector group; #P<0.05, ##P<0.01, compared with MT1JP group. (B) Tumor weight of different experimental groups ***P<0.001, compared with the Vector group; ##P<0.01, compared with the MT1JP group. (C) Pathology of different experimental groups by HE staining (×400 magnification). (D) Relative gene expression in different experimental groups by RT-qPCR assay. ***P<0.001, compared with the Vector group; ##P<0.01, compared with the MT1JP group. (E) Apoptotic cell number of different tissues by TUNEL assay (×400 magnification) ***P<0.001, compared with the Vector group; ##P<0.01, compared with the MT1JP group. |
In vivo Study of the Effect of MT1JP on Related Proteins
Expression levels of RUNX3, Bim and P21 proteins were much higher in the MT1JP and MT1JP+BL groups compared with the Vector group, while expression levels of MMP-2 and MMP-9 proteins were obviously lower (P<0.001, respectively, Figure 8). Meanwhile, in comparison with the MT1JP group, the expression levels of RUNX3, Bim and P21 proteins in the MT1JP+miRNA-214 group were evidently inhibited, while those of MMP-2 and MMP-9 proteins were significantly increased (P<0.001, respectively, Figure 8).
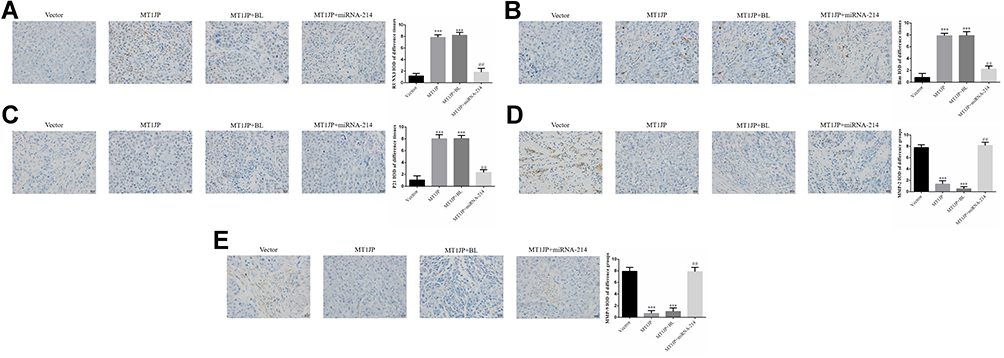 |
Figure 8 Relative protein expression in different experimental groups as assessed by immunohistochemistry (×400 magnification) (A) RUNX3 protein expression ***: P<0.001, compared with Vector group; ##P<0.01, compared with MT1JP group (B) Bim protein expression ***P<0.001, compared with Vector group; ##P<0.01, compared with MT1JP group. (C) P21 protein expression ***P<0.001, compared with the Vector group; ##P<0.01, compared with the MT1JP group. (D) MMP-2 protein expression ***P<0.001, compared with the Vector group; ##P<0.01, compared with the MT1JP group. (E) MMP-9 protein expression ***P<0.001, compared with the Vector group; ##P<0.01, compared with the MT1JP group. |
Discussion
LncRNA was initially considered as a noncoding RNA without biological function, but its role in tumors has become apparent with the continuous deepening of research.15 Previous studies showed expression of lncRNA MT1JP was down-regulated in gastric cancer, lung cancer, squamous cell carcinoma of the tongue and other cancer tissues, while the survival rate of cancer cells decreased with the transfection of an MT1JP overexpression vector.16–18 Recently, it has been confirmed that lncRNA MT1JP can inhibit tumor development by regulating miRNA-214/RUNX3.13 In this study, RT-qPCR was performed to detect MT1JP expression in breast cancer tissue and cell lines. Expression of lncRNA MT1JP was down-regulated in breast cancer tissue, while the expression of miRNA-214 was significantly increased. In addition, correlation analysis revealed a significant negative correlation between MT1JP and miRNA-214. In subsequent cell and in vivo tumor-bearing experiments, it was confirmed that overexpression of lncRNA MT1JP could effectively inhibit the biological activity of breast cancer cells. However, the biological activity of breast cancer cells was significantly reversed after miRNA-214 was transfected into the breast cancer cells with MT1JP. Consequently, the inhibition of lncRNA MT1JP on breast cancer may be strongly correlated with decreased expression of miRNA-214. Meanwhile, a luciferase assay verified that miRNA-214 could target and regulate RUNX3.
Human Runt-related transcription factor 3 (RUNX3) is a negative regulatory gene of malignant tumors whose abnormal expression is closely related to various human malignant tumors. For example, RUNX3 expression has been reported to be down-regulated in gastric cancer,19 liver cancer,20 breast cancer,21 adenoid cystic carcinoma22–24 and other tumor tissues, and indicated poor prognosis. Prior in vitro experiments showed that overexpression of RUNX3 could induce tumor cell apoptosis while inhibiting proliferation, migration and invasion.25,26 In this study, considering that MT1JP overexpression effectively inhibited the expression of miRNA-214 in breast cancer, and RUNX3 was the target gene of miRNA-214, the expression level of RUNX3 was significantly increased in breast cancer cells transfected with MT1JP, thus inhibiting the biological activity of breast cancer cells.
Bim belongs to the BH3-only subfamily of the Bcl-2 family and is an important pro-apoptotic protein. Multiple studies have shown that Bim expression deficiency is related to the poor prognosis of many tumors. For instance, Zhao et al27 found that Bim deficiency was strongly associated with the development of lung cancer. Maimaiti et al28 showed that Bim expression deficiency might indicate poor prognosis of breast cancer, especially Luminal A breast cancer. In addition, Zantl et al29 found that the deficiency of Bim was related to chemotherapy resistance of renal cell carcinoma. Accordingly, Bim is classed a tumor suppressor. Furthermore, it has been shown that RUNX3 can positively regulate the expression of Bim.30 Overexpression of P21 can cause multiple cells to stay in the G1 phase of the cell cycle, leading to apoptosis.31,32 Related research reported that overexpression of RUNX3 could activate P21 expression.33 The present study also confirmed that the expression of Bim and P21 increased simultaneously with the overexpression of RUNX3. Flow cytometry showed that multiple breast cancer cells remained in the G1 phase of the cell cycle, which may be the main cause leading to a large number of apoptotic cells.
RUNX3 can also effectively inhibit the expression of MMP-2 and MMP-9.34,35 Both MMP-2 and MMP-9 are critical members of the matrix metalloproteinase (MMP) family, and overexpression of these proteins significantly promotes tumor invasion and migration.36,37 This study revealed that the role of MT1JP overexpression in inhibiting the invasion and migration of breast cancer cells may be attributed primarily to the inhibition of MMP-2 and MMP-9 expression.
In conclusion, this study confirms that overexpression of MT1JP effectively inhibits miRNA-214 to induce the subsequent up-regulation of its target gene RUNX3, thus suppressing the biological activity of breast cancer cells. The role and mechanism of MT1JP have been confirmed in this study both in vitro and in vivo. MT1JP, therefore, shows promise as a potential target gene in the development of novel treatments for breast cancer.
Funding
This study was supported by the National Natural Science Foundation of China (grant/award number 81760527) and Jiangxi University of Traditional Chinese Medicine (grant/award numbers JXSYLXK-ZHYAO123, JXSYLXK-ZHYAO134).
Disclosure
The authors report no conflicts of interest in this work.
References
1. Torre LA, Bray F, Siegel RL, Ferlay J, Lortet-Tieulent J, Jemal A. Global cancer statistics, 2012. CA Cancer J Clin. 2015;65(2):87–108. doi:10.3322/caac.21262
2. Zhang P, Chen Y, Gong M, et al. Gab2 ablation reverses the stemness of HER2-overexpressing breast cancer cells. Cell Physiol Biochem. 2018;50(1):52–65. doi:10.1159/000493957
3. DeSantis CE, Ma J, Goding Sauer A, Newman LA, Jemal A. Breast cancer statistics, 2017, racial disparity in mortality by state. CA Cancer J Clin. 2017;67(6):439–448. doi:10.3322/caac.21412
4. Yang R, Xing L, Wang M, Chi H, Zhang L, Chen J. Comprehensive analysis of differentially expressed profiles of lncRNAs/mRNAs and miRNAs with associated ceRNA networks in triple-negative breast cancer. Cell Physiol Biochem. 2018;50(2):473–488. doi:10.1159/000494162
5. Panda S, Setia M, Kaur N, et al. Noncoding RNA Ginir functions as an oncogene by associating with centrosomal proteins. PLoS Biol. 2018;16(10):e2004204. doi:10.1371/journal.pbio.2004204
6. Zhou CX, Wang X, Yang N, Xue SK, Li WC, Xie PP. LncRNA LET function as a tumor suppressor in breast cancer development. Eur Rev Med Pharmacol Sci. 2018;22(18):6002–6007. doi:10.26355/eurrev_201809_15935
7. Wang G, Chen X, Liang Y, Wang W, Fang Y, Shen K. Long noncoding RNA signature and disease outcome in estrogen receptor-positive breast cancer patients treated with tamoxifen. J Breast Cancer. 2018;21(3):277–287. doi:10.4048/jbc.2018.21.e39
8. Zheng X, Ning C, Zhao P, et al. Integrated analysis of long noncoding RNA and mRNA expression profiles reveals the potential role of long noncoding RNA in different bovine lactation stages. J Dairy Sci. 2018;101(12):11061–11073. doi:10.3168/jds.2018-14900
9. Ma J, Yan H, Zhang J, Tan Y, Gu W. Long-chain non-coding RNA (lncRNA) MT1JP suppresses biological activities of lung cancer by regulating miRNA-423-3p/Bim axis. Med Sci Monit. 2019;25:5114–5126. doi:10.12659/MSM.914387
10. Yu H, Wang S, Zhu H, Rao D. LncRNA MT1JP functions as a tumor suppressor via regulating miR-214-3p expression in bladder cancer. J Cell Physiol. 2019;234(9):16160–16167. doi:10.1002/jcp.28274
11. Zhu C, Ma J, Li Y, Zhang Y, Da M. Low expression of long noncoding RNA MT1JP is associated with poor overall survival in gastric cancer patients: protocol for meta-analysis. Medicine (Baltimore). 2018;97(21):e10394. doi:10.1097/MD.0000000000010394
12. Zhang Y, Sui R, Chen Y, Liang H, Shi J, Piao H. Long noncoding RNA MT1JP inhibits proliferation, invasion, and migration while promoting apoptosis of glioma cells through the activation of PTEN/Akt signaling pathway. J Cell Physiol. 2019;234(11):19553–19564. doi:10.1002/jcp.28553
13. Xu Y, Zhang G, Zou C, et al. LncRNA MT1JP suppresses gastric cancer cell proliferation and migration through MT1JP/MiR-214-3p/RUNX3 axis. Cell Physiol Biochem. 2018;46(6):2445–2459. doi:10.1159/000489651
14. Zhang G, Li S, Lu J, et al. LncRNA MT1JP functions as a ceRNA in regulating FBXW7 through competitively binding to miR-92a-3p in gastric cancer. Mol Cancer. 2018;17(1):87. doi:10.1186/s12943-018-0829-6
15. Prensner JR, Chinnaiyan AM. The emergence of lncRNAs in cancer biology. Cancer Discov. 2011;1(5):391–407. doi:10.1158/2159-8290.CD-11-0209
16. Liu L, Yue H, Liu Q, et al. LncRNA MT1JP functions as a tumor suppressor by interacting with TIAR to modulate the p53 pathway. Oncotarget. 2016;7(13):15787–15800. doi:10.18632/oncotarget.7487
17. Caballero D, Kaushik S, Correlo VM, Oliveira JM, Reis RL, Kundu SC. Organ-on-chip models of cancer metastasis for future personalized medicine: from chip to the patient. Biomaterials. 2017;149:98–115. doi:10.1016/j.biomaterials.2017.10.005
18. Spizzo R, Almeida MI, Colombatti A, Calin GA. Long non-coding RNAs and cancer: a new frontier of translational research? Oncogene. 2012;31(43):4577–4587. doi:10.1038/onc.2011.621
19. Lu -X-X, Yu J-L, Ying L-S, et al. Stepwise cumulation of RUNX3 methylation mediated by Helicobacter pylori infection contributes to gastric carcinoma progression. Cancer. 2012;118(22):5507–5517. doi:10.1002/cncr.27604
20. Zhang X, He H, Zhang X, Guo W, Wang Y. RUNX3 promoter methylation is associated with hepatocellular carcinoma risk: a meta-analysis. Cancer Invest. 2015;33(4):121–125. doi:10.3109/07357907.2014.1003934
21. Zhou E-X, Song X-Y, Li B-Y, Wu F-X. The clinicopathological significance of RUNX3 hypermethylation and mRNA expression in human breast cancer, a meta-analysis. Onco Targets Ther. 2016;9:5339–5347. doi:10.2147/OTT.S77828
22. Ge MH, Chen C, Xu JJ, Ling ZQ. Unfavorable clinical implications for hypermethylation of RUNX3 in patients with salivary gland adenoid cystic carcinoma. Oncol Rep. 2011;26(2):349–357. doi:10.3892/or.2011.1282
23. Ge M-H, Chen C, Xu -J-J, Ling Z-Q. Critical regions and spreading of runt-related transcription factor-3 C-phosphate-G (CpG) island methylation in human salivary gland adenoid cystic carcinoma. Hum Pathol. 2011;42(12):1862–1872. doi:10.1016/j.humpath.2011.02.003
24. He JF, Ge MH, Zhu X, et al. Expression of RUNX3 in salivary adenoid cystic carcinoma: implications for tumor progression and prognosis. Cancer Sci. 2008;99(7):1334–1340. doi:10.1111/j.1349-7006.2008.00826.x
25. Kim HJ, Park J, Lee SK, Kim KR, Park KK, Chung WY. Loss of RUNX3 expression promotes cancer-associated bone destruction by regulating CCL5, CCL19 and CXCL11 in non-small cell lung cancer. J Pathol. 2015;237(4):520–531. doi:10.1002/path.4597
26. Chen Y, Wei X, Guo C, et al. Runx3 suppresses gastric cancer metastasis through inactivation of MMP-9 by upregulation of TIMP-1. Int J Cancer. 2011;129(7):1586–1598. doi:10.1002/ijc.25831
27. Zhao M, Zhang Y, Cai W, et al. The Bim deletion polymorphism clinical profile and its relation with tyrosine kinase inhibitor resistance in Chinese patients with non-small cell lung cancer. Cancer. 2014;120(15):2299–2307. doi:10.1002/cncr.28725
28. Maimaiti Y, Dong L, Aili A, Maimaitiaili M, Huang T, Abudureyimu K. Bim may be a poor prognostic biomarker in breast cancer patients especially in those with luminal A tumors. Cancer Biomark. 2017;19(4):411–418. doi:10.3233/CBM-160377
29. Zantl N, Weirich G, Zall H, et al. Frequent loss of expression of the pro-apoptotic protein Bim in renal cell carcinoma: evidence for contribution to apoptosis resistance. Oncogene. 2007;26(49):7038–7048. doi:10.1038/sj.onc.1210510
30. Yano T, Ito K, Fukamachi H, et al. The RUNX3 tumor suppressor upregulates Bim in gastric epithelial cells undergoing transforming growth factor beta-induced apoptosis. Mol Cell Biol. 2006;26(12):4474–4488. doi:10.1128/MCB.01926-05
31. Farghadani R, Seifaddinipour M, Rajarajeswaran J, et al. In vivo acute toxicity evaluation and in vitro molecular mechanism study of antiproliferative activity of a novel indole Schiff base β-diiminato manganeseIII complex in hormone-dependent and triple negative breast cancer cells. PeerJ. 2019;7:e7686. doi:10.7717/peerj.7686
32. Gupta S, Silveira DA, Mombach JCM. ATM/miR-34a-5p axis regulates a p21-dependent senescence-apoptosis switch in non-small cell lung cancer: a Boolean model of G1/S checkpoint regulation. FEBS Lett. 2019. doi:10.1002/1873-3468.13615
33. Deng T, Zhang Y. Possible involvement of activation of P53/P21 and demethylation of RUNX 3 in the cytotoxicity against Lovo cells induced by 5-Aza-2ʹ-deoxycytidine. Life Sci. 2009;84(9–10):311–320. doi:10.1016/j.lfs.2008.12.015
34. Chen F, Wang M, Bai J, et al. Role of RUNX3 in suppressing metastasis and angiogenesis of human prostate cancer. PLoS One. 2014;9(1):e86917. doi:10.1371/journal.pone.0086917
35. Mei PJ, Bai J, Liu H, et al. RUNX3 expression is lost in glioma and its restoration causes drastic suppression of tumor invasion and migration. J Cancer Res Clin Oncol. 2011;137(12):1823–1830. doi:10.1007/s00432-011-1063-4
36. Zhou W, Yu X, Sun S, et al. Increased expression of MMP-2 and MMP-9 indicates poor prognosis in glioma recurrence. Biomed Pharmacother. 2019;118:109369. doi:10.1016/j.biopha.2019.109369
37. Abdollahi A, Nozarian Z, Nazar E. Association between expression of tissue inhibitors of metalloproteinases-1, matrix metalloproteinase-2, and matrix metalloproteinase-9 genes and axillary lymph nodes metastasis in patients with breast cancer. Int J Prev Med. 2019;10:127. doi:10.4103/ijpvm.IJPVM_355_16
 © 2020 The Author(s). This work is published and licensed by Dove Medical Press Limited. The full terms of this license are available at https://www.dovepress.com/terms.php and incorporate the Creative Commons Attribution - Non Commercial (unported, v3.0) License.
By accessing the work you hereby accept the Terms. Non-commercial uses of the work are permitted without any further permission from Dove Medical Press Limited, provided the work is properly attributed. For permission for commercial use of this work, please see paragraphs 4.2 and 5 of our Terms.
© 2020 The Author(s). This work is published and licensed by Dove Medical Press Limited. The full terms of this license are available at https://www.dovepress.com/terms.php and incorporate the Creative Commons Attribution - Non Commercial (unported, v3.0) License.
By accessing the work you hereby accept the Terms. Non-commercial uses of the work are permitted without any further permission from Dove Medical Press Limited, provided the work is properly attributed. For permission for commercial use of this work, please see paragraphs 4.2 and 5 of our Terms.