")
Back to Journals » Cancer Management and Research » Volume 11
LncRNA miR143HG Up-Regulates p53 In Endometrial Carcinoma By Sponging miR-125a
Authors Shi F, Wang T, Liu Z, Zhang Y, Wang J, Zhang K, Su J
Received 6 July 2019
Accepted for publication 22 October 2019
Published 2 December 2019 Volume 2019:11 Pages 10117—10123
DOI https://doi.org/10.2147/CMAR.S222215
Checked for plagiarism Yes
Review by Single anonymous peer review
Peer reviewer comments 2
Editor who approved publication: Professor Harikrishna Nakshatri
Fan Shi, Tao Wang, Zi Liu, Yingbing Zhang, Juan Wang, Kaishuo Zhang, Jin Su
Department of Radiation Oncology, First Affiliated Hospital of Xi’an Jiaotong University, Xi’an, Shaanxi Province 710061, People’s Republic of China
Correspondence: Fan Shi
Department of Radiation Oncology, First Affiliated Hospital of Xi’an Jiaotong University, No.277 Yanta West Road, Xi’an, Shaanxi Province 710061, People’s Republic of China
Tel +86 29 8532 4019
Email [email protected]
Introduction: MiR143HG is a recently identified tumor suppressor in bladder cancer. We performed bioinformatics prediction and found that miR143HG can form base pairs with miR-125a. This study was therefore carried out to explore the interaction between miR143HG and miR-125a in endometrial carcinoma (EC).
Methods: Gene expression was analyzed by qPCR and Western blot. Interactions among genes were analyzed by over-expression experiments. Cell apoptosis after transfections was analyzed by cell apoptosis assay.
Results: We found that the down-regulation of miR143HG in EC predicted poor survival. Bioinformatics analysis showed that miR-125a could bind miR143HG. In EC tissues, miR143HG was positively correlated with p53, not miR-125a. In EC cells, miR143HG and miR-125a over-expression failed to affect the expression of each other. However, miR143HG over-expression led to the up-regulated p53. MiR-125a over-expression played the opposite role and attenuated the effects of miR143HG over-expression. Cell apoptosis analysis showed that miR143HG and p53 over-expression led to an increased cell apoptotic rate. MiR-125a over-expression played the opposite role and attenuated the effects of miR143HG over-expression.
Conclusion: MiR143HG may up-regulate p53 in EC by sponging miR-125a to promote cancer cell apoptosis.
Keywords: miR143HG, endometrial carcinoma, miR-125a, p53
Introduction
The mortality rate of endometrial carcinoma (EC) ranks as 6th among all malignancies in females in the United States.1 In 2018, EC caused about 11,350 deaths in this country.1 EC patients at early stages can be cured by surgical resection and outcomes are generally satisfactory.2,3 However, effective treatment strategies for stage IV remain to be weak, and only 20% of patients could survive.3 Obesity is considered as the main risk factor for EC.4 In addition, genetic mutations, such as p53 and PTEN mutations are also closely correlated with the tumorigenesis of EC.5 However, pathogenesis of EC is still unclear and the development of novel therapeutic approaches is limited by the unclear gene regulation network involved in EC.
P53 is a well-characterized tumor suppressor in cancer biology.6 P53 participates in cancer biology mainly by regulating cell cycle progression and apoptosis through DNA repair, cell phase transition and apoptosis initiation.7 Therefore, activation of p53 is considered as a promising approach for cancer therapies.8 In effect, some oncogenic miRNAs, such as miR-125a, can target p53 to increase cancer cell viability.9,10 It is known that long (>200nt) non-coding RNAs (lncRNAs) can interact with miRNAs to regulate biological processes.11 MiR143HG is a recently identified tumor suppressor in bladder cancer.12 We performed bioinformatic prediction and found that miR143HG can form base pairs with miR-125a. This study was therefore carried out to explore the interaction between miR143HG and miR-125a in EC.
Materials And Methods
EC Patients And Follow-Up
First Affiliated Hospital of Xi’an Jiaotong University admitted 99 EC patients between April 2012 and April 2014. This study selected 60 cases of EC (all females; range from 46 to 73 years old; average age at 59.6±6.8 years old) from these patients. This study passed the review board of First Affiliated Hospital of Xi’an Jiaotong University before the enrollment of patients. Inclusion criteria: 1) EC patients diagnosed for the first time; 2) no therapies for any diseases were performed with 3 months before admission. Exclusion criteria: 1) recurrent EC; 2) other clinical disorders were also diagnosed; 3) therapies were initiated. The 60 patients were staged based on clinical findings and AJCC staging system. There were 10, 17, 15 and 18 cases at clinical stage I–IV, respectively. All patients signed informed consent after they were informed of experimental design and the potential publication of data derived from the analysis of tissue samples from them.
All the 60 patients were followed up for 5 years after admission. Survival conditions were recorded and used in survival analysis. Patients died of causes other than EC or the ones who did not complete the whole follow-up were excluded.
Specimens And EC Cell Line
All patients were diagnosed by histopathological biopsy. The biopsy was performed under the guidance of MRI. During biopsy, EC (cancer) and adjacent (3cm around tumor) non-cancer tissue samples were collected from each patient. All tissue samples were confirmed by histopathological test- all non-cancer samples contained less than 1% cancer cells, while all EC tissues contained more than 98% cancer cells.
The human EC cell line HEC-1 (ATCC, USA) was used as the cell model. A mixture containing 10% FBS and 90% Dulbecco’s modified Eagle’s medium was used to cultivate the cells under conditions of 95% humidity, 37°C and 5% CO2.
Cell Transfections
Vectors expressing miR143HG or p53 were constructed using the pcDNA3 vector (GenePharma, Shanghai, China). MiR-125a mimic and negative control (NC) miRNA were from RIBOBIO (Guangzhou, China). HEC-1 cells were cultivated under aforementioned conditions and were harvested when 80% confluence was reached. All transient transfections were performed using lipofectamine 2000 (Sigma-Aldrich) to transfect 50nM miRNAs (NC miRNA as NC group) or 10nM vectors (empty vector as NC group) into 3×10⁶ HEC-1 cells. At 24h post-transfection, cells were collected to perform subsequent experiments. In all transfections, un-transfected cells were control cells.
qPCR
HEC-1 cells were harvested at 24h post-transfection and were counted. EC and non-cancer tissues from all 60 EC patients were ground in liquid nitrogen. RNAzol (Sigma-Aldrich) was used to extract total RNAs from 0.03g tissue or 3×10⁵ HEC-1 cells. 85% of ethanol was used to perform the RNA precipitation and washing steps to harvest miRNAs.
All RNA samples were digested with DNase I for 2h at 37°C to completely removed genomic DNAs. RNA quality was checked by performing denaturing agarose gel electrophoresis. Tetro Reverse Transcriptase (Bioline, USA) was used to perform reverse transcriptions and TB Green Advantage qPCR Premix (Clontech, USA) was used to prepare qPCR assays with GAPDH as endogenous control to measure the expression levels of miR143HG and p53 mRNA. It is worth noting that multiple endogenous controls were included, such as β-actin and 18S rRNA. Similar results were obtained.
To measure mature miR-125a expression level, All-in-One™ miRNA qRT-PCR Detection Kit (Genecopoeia) was used to perform the addition of poly (A), miRNA reverse transcriptions and qPCR assays. U6 was used as the endogenous control of miR-125a.
Primer sequences were: 5ʹ-CTACGGCCCTGGAGCCCAAG-3ʹ (forward) and 5ʹ-TCCGGGCTGCCTGCTGCTGG-3ʹ (reverse) for p53; 5ʹ-GCCCAACAACACCAGCTCCT-3ʹ (forward) and 5ʹ-CCTGGGCATCCTTGAGTTCC-3ʹ (reverse) for p53; 5ʹ-GTCTCCTCTGACTTCAA-3ʹ(forward) and 5ʹ-ACCACCCTGTTGCTGTA-3 (reverse) for GAPDH. The forward primer of miR-125a was 5ʹ-UCCCUGAGACCCUUUAAC-3ʹ. Reverse primer of miR-125a and U6 primers was included in the kit. PCR products were sequenced to ensure correct products were obtained.
The 2−ΔΔCT method was used to process all Ct values and all PCR reactions were performed in triplicate manner. PCR efficiency of all primer pairs reached 90–95%.
Western Blot
To analyze the effects of transfections on p53 expression, total proteins in HEC-1 cells (collected at 24h post-transfection) were extracted using RIPA solution (GenePharma). After protein quantification using a BCA kit (GenePharma), protein samples were denatured (10mins in boiling water), followed by performing electrophoresis using 10% SDS-PAGE gel. After that, proteins were transferred to PVDF membranes, and membranes were blocked in PBS containing 5% non-fat milk for 2h at 25°C. After that, membranes were first incubated with anti-GAPDH (1:2000, ab37168, Abcam) or anti-p53 (1:2000, ab131442, Abcam) rabbit primary antibodies (15h at 4°C), followed by incubation with HRP (IgG) (1:2000; ab6721; Abcam) goat secondary antibody (2h at 25°C). After that, ECL (Sigma-Aldrich) was dropped onto the membranes to develop signals. Signals were normalized using Image J v1.46 software.
Cell Apoptosis Analysis
HEC-1 cells were harvested at 24hrs post-transfection and were counted. 3×10⁵ HEC-1 cells were mixed with 10mL serum-free Dulbecco’s modified Eagle’s medium to prepare a single-cell suspension. Cells were cultivated in a 6-well plate (2mL per well) under aforementioned conditions. Three replicate wells were set for each transfection group. After that, Annexin-V (5µL) and PI solution (5µL) were added into each well and incubation was performed for 15mins in dark. Finally, apoptotic cells were detected by performing flow cytometry.
Statistical Analysis
All experiments were performed in 3 biological replicates and mean values were calculated to perform all data analysis. Correlations were analyzed by Pearson’s Correlation Coefficient. Differences between two tissue types of multiple cell groups were analyzed by performed paired t-test and one-way ANOVA combined with Tukey’s test, respectively. Survival analysis was performed by grouping the 60 EC patients into high and low miR143HG level groups (n=30) with the median expression level of miR143HG in EC as cutoff value. K-M plotter and log-rank tests were used to plot and compare survival curves. A chi-squared test was used to analyze the correlation between the expression levels of miR143HG and patients’ clinical data using the same grouping method. p<0.05 was statistically significant.
Results
Down-Regulation Of miR143HG In EC Predicted Poor Survival
Levels of miR143HG expression in both EC and non-cancer tissues were measured and compared by qPCR and paired t-test, respectively. It can be observed that, comparing to the expression levels in non-cancer tissues, expression levels of miR143HG were significantly lower in EC tissues (Figure 1A, p<0.05). Survival curves were plotted and compared through aforementioned methods. Comparing to high miR143HG level groups, overall survival rate was significantly lower in low miR143HG level group (Figure 1B). The chi-squared test showed that expression levels of miR143HG were not significantly correlated with patients’ age (> or ≤60 years), BMI (> or ≤25), smoking habit, drinking habit and clinical stages (all p>0.05).
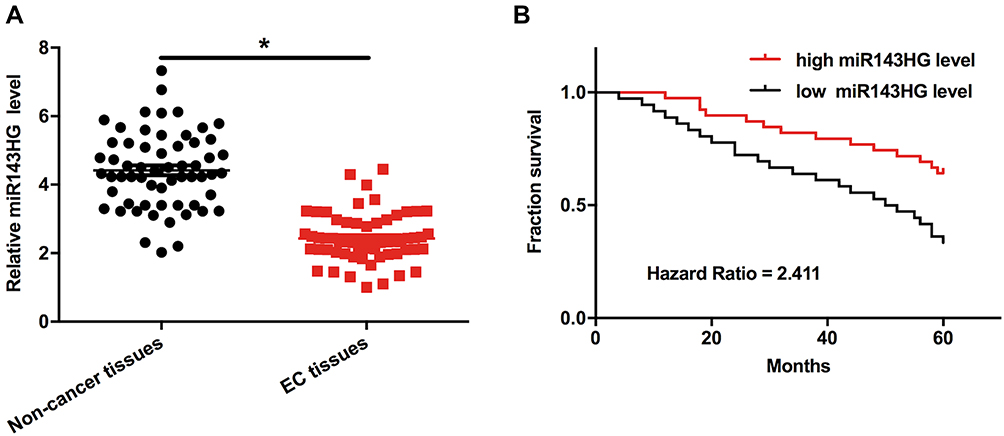 |
Figure 1 Down-regulation of miR143HG in EC predicted poor survival. Notes: Levels of miR143HG expression in both EC and non-cancer tissues were measured and compared by performing qPCR and paired t-test, respectively (A). Survival analysis was performed by comparing the 60 EC patients into high and low miR143HG level groups (n=30) with the median expression level of miR143HG in EC as cutoff value. K-M plotter and log-rank tests were used to plot and compare survival curves (B). Mean values of 3 replicates were presented, *p<0.05. |
MiR-125b May Bind miR143HG But Was Not Significantly Correlated With It
Bioinformatics analysis performed using IntaRNA (http://rna.informatik.uni-freiburg.de/IntaRNA/Input.jsp) showed that miR-125a can bind miR143HG (Figure 2A). Expression levels of miR-125a and its downstream target p53 mRNA were in EC cells were measured by qPCR. Correlations between miR143HG and miR-125a/p53 were analyzed by performing Pearson’s correlation coefficient. It can be observed that expression levels of miR143HG were not significantly correlated with the expression levels of miR-125a (Figure 2B). However, a significant and positive correlation was found between miR143HG and p53 mRNA (Figure 2C).
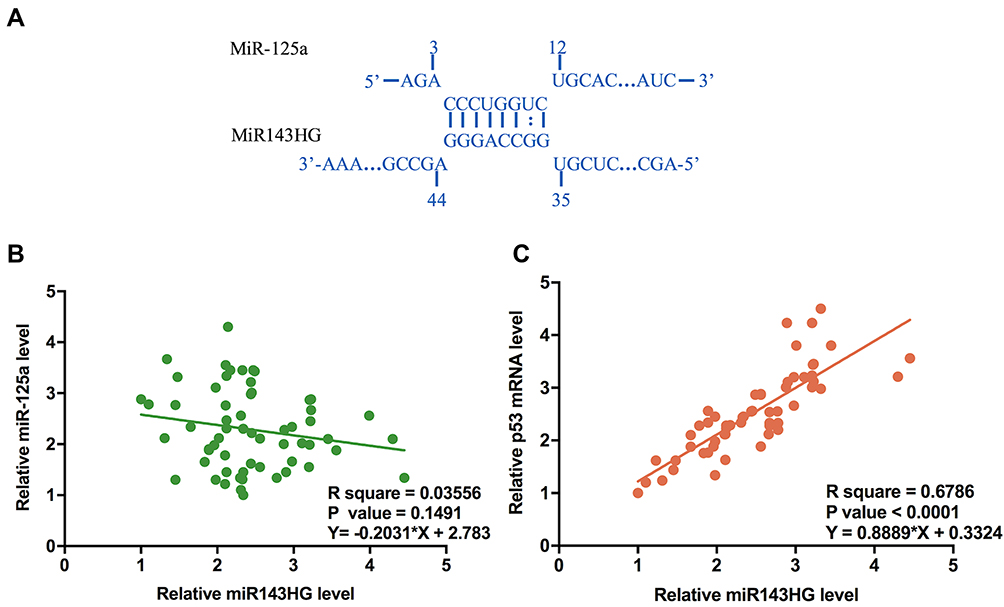 |
Figure 2 MiR-125b may bind miR143HG but was not significantly correlated with it. Notes: Bioinformatics analysis performed using IntaRNA (http://rna.informatik.uni-freiburg.de/IntaRNA/Input.jsp) showed that miR-125a can bind miR143HG (A). Expression levels of miR-125a and its downstream target p53 mRNA were in EC cells were measured by qPCR. Correlations between miR143HG and miR-125a (B)/p53 (C) were analyzed by performing Pearson’s correlation coefficient. qPCRs were performed in triplicate manner and mean values were used in the analysis. |
MiR143HG Failed To Affect miR-125a Expression But Down-Regulate Its Target P53
To explore the potential interactions among miR143HG, miR-125a, and p53, HEC-1 cells were transfected with vectors expressing miR143HG or p53, or miR-125a mimic. Over-expression of miR143HG, miR-125a, and p53 was confirmed at 24hrs post-transfection by performing qPCR. Comparing to C and NC (NC miRNA or empty pcDNA3 vector) groups, expression levels of miR143HG, miR-125a and p53 were significantly increased (Figure 3A, p<0.05). Moreover, miR143HG and miR-125a over-expression failed to affect the expression of each other (Figure 3B). However, miR143HG over-expression led to the up-regulated p53, while miR-125a over-expression played an opposite role and attenuated the effects of miR143HG over-expression at both p53 mRNA (Figure 3C) and protein (Figure 3D) levels (p<0.05).
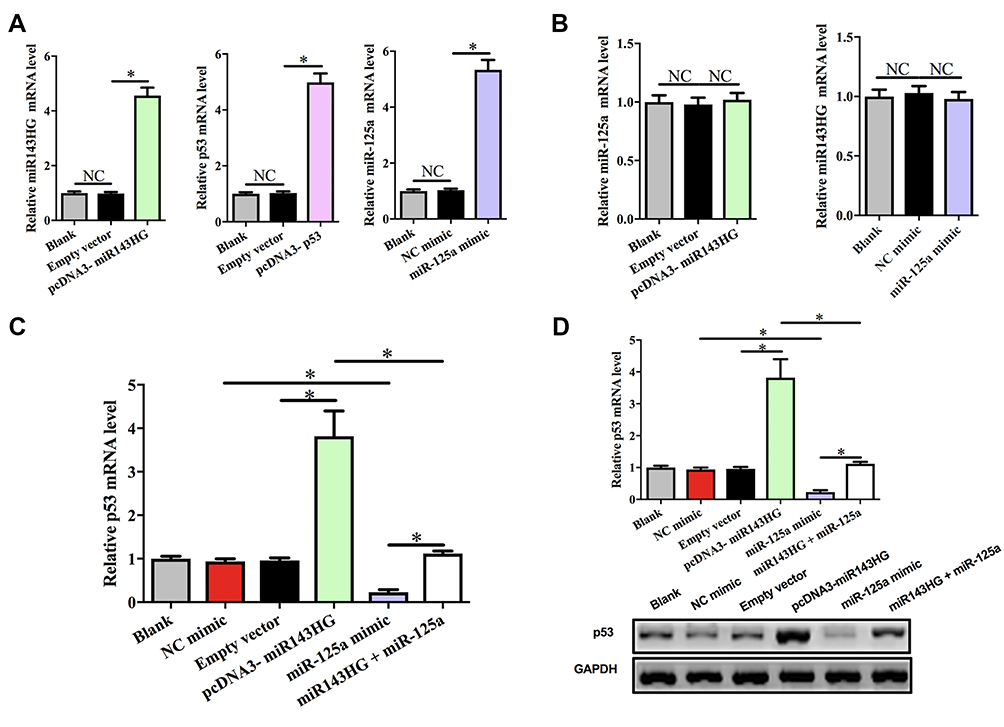 |
Figure 3 MiR143HG failed to affect miR-125a expression but down-regulate its target p53. Notes: To explore the potential interactions among miR143HG, miR-125a, and p53, HEC-1 cells were transfected with vectors expressing miR143HG or p53, or miR-125a mimic. Over-expression of miR143HG, miR-125a, and p53 was confirmed at 24hrs post-transfection by performing qPCR (A). The interaction between miR143HG and miR-125a was analyzed by qPCR (B). The effects of miR143HG and miR-125a over-expression on p53 expression at mRNA (C) and protein (D) levels were analyzed by qPCR and Western blot, respectively. Experiments were performed in triplicate manner, *p<0.05; NC, negative control (p>0.05). |
MiR143HG Promoted The Apoptosis Of HEC-1 Cells Through P53 And miR-125a
Cell apoptosis assay was performed to analyze the effects of miR143HG, miR-125a and p53 over-expression on the apoptosis of HEC-1 cells. Comparing to C and NC (empty vector or NC miRNA transfection) groups, miR143HG, and p53 over-expression led to decreased cell apoptotic rate. MiR-125a over-expression played the opposite role and attenuated the effects of miR143HG over-expression (Figure 4, p<0.05).
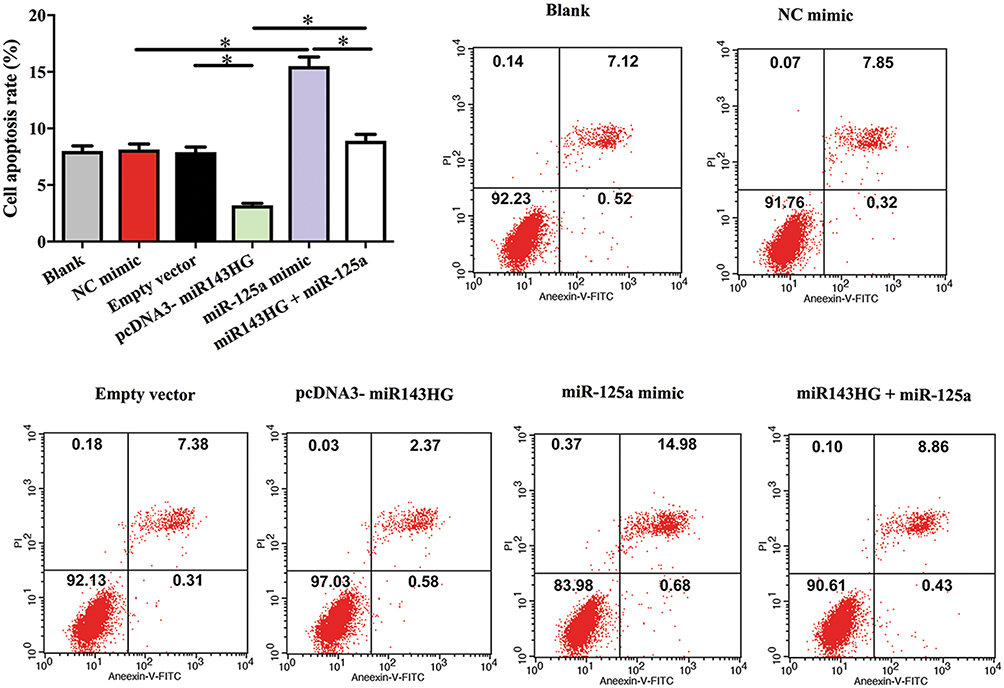 |
Figure 4 MiR143HG promoted the apoptosis of HEC-1 cells through p53 and miR-125a. Notes: Cell apoptosis assay was performed to analyze the effects of miR143HG, miR-125a and p53 over-expression on the apoptosis of HEC-1 cells. Experiments were performed in triplicate manner, *p<0.05. |
Discussion
In this study, we analyzed the functions of miR143HG in EC. We found that miR143HG was down-regulated in EC and the low levels of miR143HG are correlated with the poor survival of EC patients. In addition, miR143HG may sponge miR-125a to up-regulate p53, thereby promoting cancer cell apoptosis.
The functions of miR143HG have only been reported in bladder cancer and liver cancer.12,13 In bladder cancer, miR143HG is down-regulated and the over-expression of miR143HG can inactivate Wnt/β- catenin signaling to inhibit invasion, migration, and proliferation of cancer cells.12 In liver cancer, miR143HG is also down-regulated and up-regulation of miR143HG can inhibit tumor growth and metastasis by suppressing both Wnt signaling pathways and mitogen-activated protein kinase.13 In this study, we first reported the down-regulation of miR143HG in EC. In addition, miR143HG over-expression led to increased cell apoptotic rate. Therefore, miR143HG is also a tumor-suppressive lncRNA in EC.
We predicted the potential base-pairing formed by miR143HG and miR-125a. However, no significant correlation between miR143HG and miR-125a was observed in EC tissues. In addition, over-expression of miR143HG and miR-125a failed to affect the expression of each other. Therefore, miR143HG is unlikely a downstream target of miR-125a. It is known that lncRNAs can be miRNA sponges to reduce their effects on the expression of downstream genes.14,15 In this study, we observed a significant and positive correlation between miR143HG and miR-125a. It is known that miR-125a can directly target p5310 In this study, we found that miR143HG led to the up-regulation of p53 in EC cells. Therefore, our study suggested that miR143HG may sponge miR-125a to up-regulate p53.
Due to the lack of curative cancer therapies, an accurate prognostic assignment is critical. Accurate prognosis can help the selection of therapeutic approaches and development of post-operative care program.16 In this study, we found that low levels of miR143HG expression were closely correlated with the poor survival of EC patients. However, more clinical studies are needed to further validate the accuracy.
Conclusion
miR143HG was down-regulated in EC and may sponge miR-125a to up-regulate p53, thereby promoting EC cell apoptosis.
Disclosure
The authors report no conflicts of interest in this work.
References
1. Bray F, Ferlay J, Soerjomataram I, Siegel RL, Torre LA, Jemal A. Global cancer statistics 2018: GLOBOCAN estimates of incidence and mortality worldwide for 36 cancers in 185 countries. CA Cancer J Clin. 2018;68(6):394–424. doi:10.3322/caac.v68.6
2. Singh N, Hirschowitz L, Zaino R, et al. Pathologic prognostic factors in endometrial carcinoma (other than tumor type and grade). Int J Gynecol Pathol. 2019;38(Suppl 1):S93–S113.
3. Matsuo K, Moeini A, Machida H, et al. Tumor characteristics and survival outcome of endometrial cancer arising in adenomyosis: an exploratory analysis. Ann Surg Oncol. 2016;23(3):959–967. doi:10.1245/s10434-015-4952-y
4. Busch EL, Crous-Bou M, Prescott J, et al. Endometrial cancer risk factors, hormone receptors, and mortality prediction. Cancer Epidemiol Biomarkers Prev. 2017;26(5):727–735. doi:10.1158/1055-9965.EPI-16-0821
5. Mirakhor Samani S, Ezazi Bojnordi T, Zarghampour M, Merat S, Fouladi DF. Expression of p53, Bcl-2 and bax in endometrial carcinoma, endometrial hyperplasia and normal endometrium: a histopathological study. J Obstet Gynaecol. 2018;38(7):999–1004. doi:10.1080/01443615.2018.1437717
6. Labuschagne CF, Zani F, Vousden KH. Control of metabolism by p53 - cancer and beyond. Biochim Biophys Acta Rev Cancer. 2018;1870(1):32–42. doi:10.1016/j.bbcan.2018.06.001
7. Joerger AC, Fersht AR. The p53 pathway: origins, inactivation in cancer, and emerging therapeutic approaches. Annu Rev Biochem. 2016;85:375–404. doi:10.1146/annurev-biochem-060815-014710
8. Bykov VJN, Eriksson SE, Bianchi J, Wiman KG. Targeting mutant p53 for efficient cancer therapy. Nat Rev Cancer. 2018;18(2):89–102.
9. Mantovani F, Walerych D, Sal GD. Targeting mutant p53 in cancer: a long road to precision therapy. FEBS J. 2017;284(6):837–850.
10. Chen J, Ouyang H, An X, Liu S. miR-125a is up-regulated in cancer stem-like cells derived from TW01 and is responsible for maintaining stemness by inhibiting p53. Oncol Lett. 2019;17(1):87–94. doi:10.3892/ol.2018.9587
11. Paraskevopoulou MD, Hatzigeorgiou AG. Analyzing miRNA-lncRNA interactions. Methods Mol Biol. 2016;1402:271–286.
12. Xie H, Huang H, Huang W, Xie Z, Yang Y, Wang F. LncRNA miR143HG suppresses bladder cancer development through inactivating Wnt/beta-catenin pathway by modulating miR-1275/AXIN2 axis. J Cell Physiol. 2019;234(7):11156–11164. doi:10.1002/jcp.27764
13. Lin X, Xiaoqin H, Jiayu C, Li F, Yue L, Ximing X. Long non-coding RNA miR143HG predicts good prognosis and inhibits tumor multiplication and metastasis by suppressing mitogen-activated protein kinase and Wnt signaling pathways in hepatocellular carcinoma. Hepatol Res. 2019. doi:10.1111/hepr.v49.8
14. Liang WC, Fu WM, Wong CW, et al. The lncRNA H19 promotes epithelial to mesenchymal transition by functioning as miRNA sponges in colorectal cancer. Oncotarget. 2015;6(26):22513–22525. doi:10.18632/oncotarget.4154
15. Wu XS, Wang F, Li HF, et al. LncRNA-PAGBC acts as a microRNA sponge and promotes gallbladder tumorigenesis. EMBO Rep. 2017;18(10):1837–1853. doi:10.15252/embr.201744147
16. Hueman MT, Wang H, Yang CQ, et al. Creating prognostic systems for cancer patients: a demonstration using breast cancer. Cancer Med. 2018;7(8):3611–3621. doi:10.1002/cam4.2018.7.issue-8
 © 2019 The Author(s). This work is published and licensed by Dove Medical Press Limited. The full terms of this license are available at https://www.dovepress.com/terms.php and incorporate the Creative Commons Attribution - Non Commercial (unported, v3.0) License.
By accessing the work you hereby accept the Terms. Non-commercial uses of the work are permitted without any further permission from Dove Medical Press Limited, provided the work is properly attributed. For permission for commercial use of this work, please see paragraphs 4.2 and 5 of our Terms.
© 2019 The Author(s). This work is published and licensed by Dove Medical Press Limited. The full terms of this license are available at https://www.dovepress.com/terms.php and incorporate the Creative Commons Attribution - Non Commercial (unported, v3.0) License.
By accessing the work you hereby accept the Terms. Non-commercial uses of the work are permitted without any further permission from Dove Medical Press Limited, provided the work is properly attributed. For permission for commercial use of this work, please see paragraphs 4.2 and 5 of our Terms.