")
Back to Journals » International Journal of Women's Health » Volume 13
LncRNA MIAT Services as a Noninvasive Biomarker for Diagnosis and Correlated with Immune Infiltrates in Breast Cancer
Authors Ye T , Feng J, Cui M, Yang J, Wan X, Xie D, Liu J
Received 25 March 2021
Accepted for publication 8 October 2021
Published 22 October 2021 Volume 2021:13 Pages 991—1004
DOI https://doi.org/10.2147/IJWH.S312714
Checked for plagiarism Yes
Review by Single anonymous peer review
Peer reviewer comments 2
Editor who approved publication: Professor Elie Al-Chaer
Ting Ye,1,* Jia Feng,1,* Meng Cui,2 Jia Yang,2 Xue Wan,1 Dan Xie,1 Jinbo Liu1
1Department of Laboratory Medicine, The Affiliated Hospital of Southwest Medical University, Luzhou, Sichuan, 646000, People’s Republic of China; 2Department of Laboratory Medicine, The Leshan People’s Hospital, Luzhou, Sichuan, 614000, People’s Republic of China
*These authors contributed equally to this work
Correspondence: Ting Ye; Jinbo Liu
Department of Laboratory Medicine, The Affiliated Hospital of Southwest Medical University, No. 25, Taiping Street, Jiangyang District, Luzhou, Sichuan, 646000, People’s Republic of China
Tel +86-830-3165730
Email [email protected]; [email protected]
Background: Myocardial infarction associated transcript (MIAT) is identified as a long chain non-coding RNA (lncRNA), which was associated with myocardial infarction susceptibility. While intense efforts have been made to elucidate the relationship between MIAT and carcinogenesis, the tumor immunoreaction of MIAT remains elusive. Thus, this study aimed to investigate the role of MIAT in the immunoregulation of breast cancer (BC) and further explore the better clinical significance.
Methods: The differential expression of MIAT between BC and normal/adjacent tissues was compared using Wilcoxon rank sum test. The diagnostic and prognostic values of elevated MIAT expression in BC tissues were unveiled via receiver operating characteristic (ROC) analysis and KM-plotter analysis. Limma and edgeR package were used to identify differentially expressed genes (DEGs) and microRNAs (DEMs) from TCGA database respectively. A co-expression dataset was constructed to comprehensively understand the relationship between MIAT and DEGs based on the Pearson correlation coefficient. Furthermore, GO and KEGG analyses were conducted to predict the potential functions of MIAT. We next intersected immune-related genes (IRGs) from ImmPort database with MIAT-co-expressed genes to obtain MIAT-co-expressed IRGs, in order to construct MIAT-microRNA (miRNA)-mRNA network. And the correlation between MIAT and tumor-infiltrating immune cells (TICs) and immunophenoscore (IPS) analysis was analyzed by TIMER and CIBERSORT. Finally, the reverse transcription quantitative real-time polymerase chain reaction (RT-qPCR) was used to detect the expression profiles of MIAT in serum samples.
Results: The expression levels of MIAT were notably higher in BC than in normal or adjacent tissues. And MIAT expression could be used as a prognostic indicator of mortality risk in patients with BC in different aspects. Moreover, the enrichment analyses suggested that MIAT was strongly involved in BC immune response. In addition, TIMER database and CIBERSORT analyses indicated that MIAT was significantly correlated with 13 types of TICs (B cells, dendritic cells, neutrophils, CD8 T cells, CD4 memory resting T cells, CD4 memory activated T cells, gamma delta T cells, M1 macrophages, plasma cells, activated NK cells, monocytes, M2 macrophages, activated mast cells). Simultaneously, the IPS analysis implied that the higher the MIAT expression, the better the immunotherapy effect. The ROC curve analysis showed that the area under the curve (AUC) value of MIAT was 0.86 (sensitivity = 87.80%, specificity = 75.61%). And the high MIAT expression in serum was positive related to TNM stage (P = 0.032) and lymph node metastasis (P = 0.028).
Conclusion: MIAT may be a valuable noninvasive diagnostic biomarker for BC and is associated with tumor-infiltrating immune cells in tumor microenvironment, suggesting MIAT as a potential target for future treatment of BC.
Keywords: lncRNA MIAT, BC, biomarker, immune regulation, tumor-infiltrating, immune cells
Introduction
BC is the most common cancer among women that is responsible for the most of the cancer-related death in worldwide.1 The occurrence of BC accounts for 7–8% of the entire number of malignant tumors.2 Accumulating evidence have shown that immunoreaction plays an important role in oncogenesis and progression.3,4 However, the immune related genes of BC and underlying molecular pathogenic mechanisms are still obscure.
LncRNA is a new kind of non-coding RNA with a length of more than 200 nucleotides and limited protein coding potential. Moreover, lncRNA plays a key role in a variety of cell processes, including gene expression regulation, post-transcriptional, and translation regulation.5,6 In literature, lncRNA could be a sensitive predictive marker and therapeutic candidate for cancers.7,8 Thus, search for new molecular mechanism associated with oncogenesis and progression is ongoing. lncRNA myocardial infarction associated transcript (MIAT) was originally reported to be correlation with myocardial infarction.9 Subsequent studies have also implicated that MIAT was involved in cancer initiation and progression,10–12 including neuroendocrine prostate cancer,13 chronic lymphocytic leukemias10 and non-small cell lung cancer.14 However, mechanistic understanding underlying the immunoregulation of MIAT in BC is sketchy and limited.
In recent years, integrated analyses of the genomic, transcriptomic, and proteomic datasets have become powerful tools in discovering and validating of tumor markers,15 as well as providing evidence for further researches. In this study, we systematically investigated highly upregulated of MIAT in BC based on multiple databases including TCGA, GTEx, GEO, TIMER and Kaplan–Meier plotter database. Besides, we found that MIAT was significantly correlated with immune pathways, immune-related genes and also with TICs. Further, we constructed a differentially expressed MIAT-miRNA-mRNA competitive endogenous RNA (ceRNA) network for BC by comparing, predicting and integrating differentially expressed RNAs. And lastly, we provide the convincing experimental evidence supporting a rather definitive role of MIAT in diagnosis of BC as well as the vital clinical implications. This is the first research to identify key genes and pathways related with MIAT which were in the immunoregulation of BC and explored the potential biomarker for early diagnosis, treatment, and prognosis. The workflow of the study design is presented in Figure S1.
Materials and Methods
TIMER Database Analysis
The Tumor Immune Estimation Resource (TIMER) database (https://cistrome.shinyapps.io/timer/) was performed to explore the expression levels of MIAT in different cancers and adjacent normal tissues from TCGA database based on the “DiffExp” modules. Distributions of gene expression levels are displayed using box plots, with statistical significance of differential expression evaluated using Wilcoxon test.16
Analysis of Breast Cancer Data in Public Database
The expression profiles of MIAT in the tumor and normal/adjacent tissues were analyzed using the Genotype-Tissue Expression (GTEx) project (https://www.gtexportal.org/) from the UCSC Xena browser (https://xenabrowser.net/datapages/) and the Cancer Genome Atlas (TCGA) project from TCGA data portal (https://portal.gdc.cancer.gov/). GSE70905 and GSE70947 were chosen to validate the MIAT expression from the Gene Expression Omnibus (GEO) database (https://www.ncbi.nlm.nih.gov/geo/). All the above differential expression analyses were performed using R package limma.17 The differentially expressed genes (DEGs) between BC and normal samples in TCGA with | log2FoldChange | > 1 were considered as statistically significant.
Prognostic Analysis of MIAT in BC Subtypes
Based on the prognostic online tool Kaplan–Meier plotter database (http://kmplot.com/analysis/index.php?p=service), we conduct the survival analysis of BC patients with high and low expression of MIAT through Kaplan–Meier curve analysis, including overall survival (OS) and post-progression survival (PPS).
Screening Co-Expressed Genes of MIAT
The similarity in TCGA-BRCA samples was calculated based on Pearson correlation coefficients in order to find the highly correlated genes with MIAT among DEGs depending on a cut off of P < 0.001, r > 0.40.
Function and Pathway Enrichment Analysis
We performed Gene Ontology18 (GO), Kyoto Encyclopedia of Genes and Genomes19 (KEGG) enrichment analysis for the MIAT-co-expressed DEGs using the R Bioconductor package cluster profiler20 to identify the most significant biological processes and pathways. A strict cutoff of P < 0.05 and PFDR < 0.05 were set as the cut-off criterion.
The Definition of Immune-Related Genes
A list of 1811 immune-related genes were downloaded from the Immunology Database and Analysis Portal (ImmPort) database (http://www.immport.org).21 Then, these 1811 IRGs were intersected with MIAT-co-expressed DEGs to obtain the MIAT-co-expressed IRGs.
Screening of Differential Expression microRNAs
We performed a differential analysis of isoform expression data from the TCGA website containing 1057 BC and 103 normal specimens to obtain differentially expressed miRNAs (DEMs) as candidate miRNAs. The data were analyzed using the R-package edgeR22 with the previous defined cut-off value.
Construction of the ceRNA Network
We obtained the miRNAs that interacted with MIAT after prediction in the miRcode database (http://www.mircode.org/).23 And we took the overlap of these miRNAs with DEMs for acquiring the final MIAT-DEMs relationship file. Then, the relationship between these key miRNAs and the MIAT-co-expressed IRGs were analyzed with TargetScan (http://www.targetscan.org/)24 and the DEMs-IRGs file was established. In the end, we combined MIAT-DEMs and DEMs-IRGs and applied them to Cytoscape software (v3.7.1) (https://cytoscape.org/) visualization topology network for obtaining the topological network diagram of ceRNA.
Correlation Analysis of MIAT with TICs and Immune Checkpoints
The Gene module was selected from the TIMER database to analyze MIAT expression and 4 immune cells (B cells, CD4+ T cells, CD8+ T cells, neutrophils, macrophages, and dendritic cells) and tumor purity. Using the CIBERSORT algorithms (https://cibersort.stanford.edu/),25 the infiltration of immune cells in the high and low MIAT expression groups was compared. And the correlation module of TIMER was used to analyze the relationship between MIAT and immune checkpoint molecules PD-1 (PDCD1), PD-L1 (CD274) and CTLA4. Then, the correlation analysis between MIAT and biomarkers of immune cells in BC was determined by GEPIA database (http://gepia.cancer-pku.cn/). |R| > 0.1 and P value < 0.05 were set as selection criteria for identifying as statistically significant.
Analysis of the Correlation Between MIAT and IPS
IPS is calculated by analyzing gene expression in the tumor samples, which comprise the four major categories of genes that determine immunogenicity (effector cells, immunosuppressive cells, MHC molecules and immunomodulators). The IPS for BC patients was downloaded from the Cancer Immunome Atlas (TCIA, https://tcia.at/home). We calculated the IPS with a range of 0–10 based on the z-score for gene expression of representative cell types. And the differential analysis of IPS was performed between the high and low MIAT groups by t-test.
Validation of Clinical Samples with RT-qPCR
A total of 164 serum samples were collected from the Affiliated Hospital of Southwest Medical University, among which 82 cases were healthy control and 82 cases were BC patients without therapy. This study was approved by the Ethical Review Committee of the Affiliated Hospital of Southwest Medical University and the informed consents were provided for all participants.
MIAT was detected by RT-qPCR. All the RNA was isolated from serum using TRIzol Reagent (BioTeke, China) and reverse transcribed into cDNA using PrimeScript RT reagent Kit (Takara, Japan). RT-qPCR was performed using SYBR Green assays (Takara, Japan) according to the manufacturer’s protocol. Primers were synthesized by Sangon Biotech (Shanghai, China), and sequenced as follows: 5ʹ-CTGCCCTCTTCTGGTCTGTG-3ʹ (forward) and 5ʹ-AGCCCTAACGCCAAATGTGAA-3ʹ (reverse) for MIAT; 5ʹ-TCCTCTCCCAAGCCACACA-3ʹ (forward) and 5ʹ-GCACGAAGGCTCATCATTCA-3ʹ (reverse) for β-actin.
Statistical Analysis
The clinicopathological characteristics were statistically compared using the t-test or the Wilcoxon test. All the statistical analyses were performed using Microsoft Excel 2010, R software (v.3.5.1) and GraphPad Prism 5. In our analyses, the P-values less than 0.05 were considered statistically significant.
Results
The Clinicopathologic and Prognostic Importance of High MIAT Expression in BC
We firstly compared the expression levels of MIAT in 19 types of cancers with their normal counterparts by TIMER database, which indicated MIAT expression was notably higher in 11 types of cancers including BC, as shown in Figure 1A. These findings for the first time revealed that overexpressed MIAT is a rather common feature of human cancer that is currently under appreciated. We then conducted in-depth analysis in BC and found that the MIAT expression was significantly higher in 1066 tumor tissues compared to 179 normal tissues from GTEx project (P < 0.001) (Figure 1B) and 112 adjacent tissues from TCGA project respectively (P < 0.001) (Figure 1C). Further, MIAT expression was also higher in BC tissues (P < 0.001) than that in paired adjacent tissues in the GSE70905 and the GSE70947 datasets from GEO database (Figure 1D). These results confirmed that the expression of MIAT was upregulated in most of human cancers, including BC.
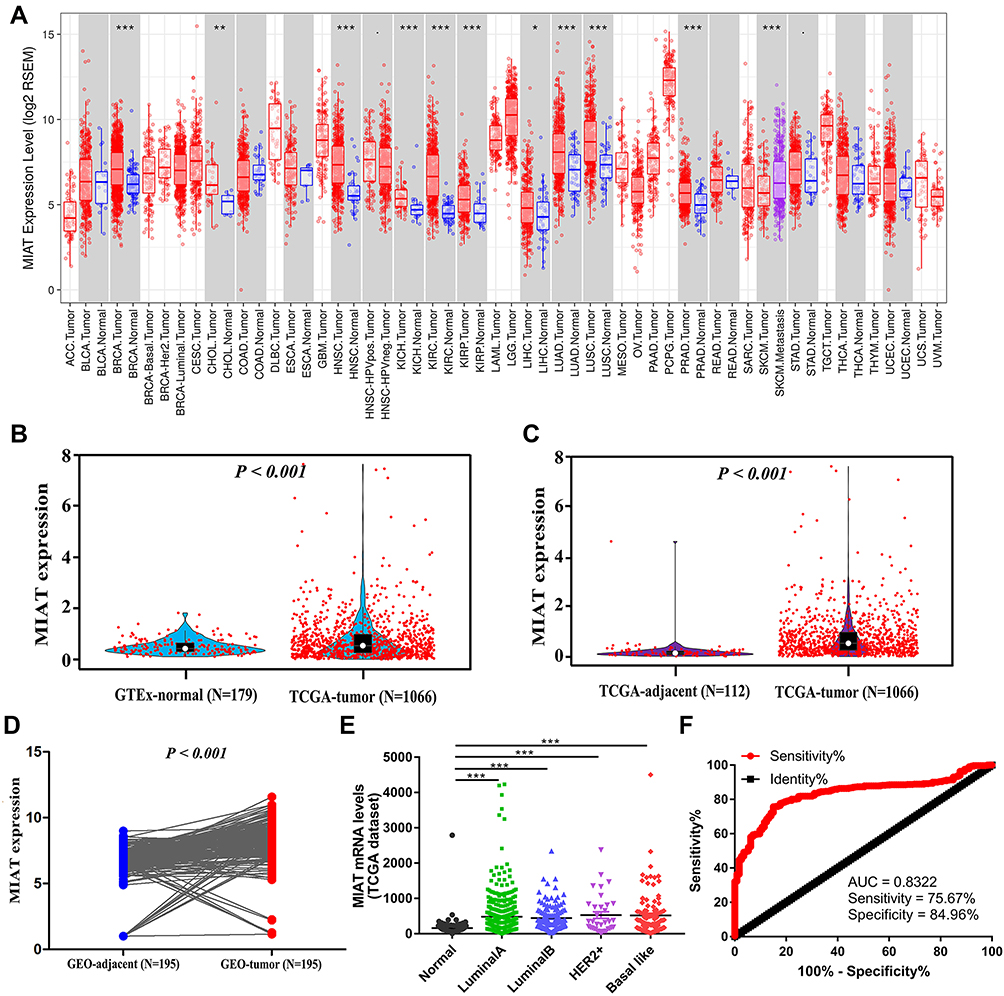 |
Figure 1 MIAT expression levels were upregulated in BC tissues. (A) Human lncRNA MIAT expression levels in different tumor types from TCGA database in TIMER. (B) The expression of MIAT in BC and normal breast tissues analyzed. (C) MIAT expression in BC tissues based on TCGA data was significantly higher than that in adjacent tissues. (D) In 195 pairs of adjacent and tumor tissues based on GEO data, MIAT was more highly expressed in BC tissues. (E) MIAT expression levels in different BC subtypes compared to normal samples. (F) ROC curve of MIAT mRNA expression in BC patients. *P < 0.05, **P < 0.01, ***P < 0.001. |
Furthermore, we analyzed the mRNA expression of MIAT between BC subtypes (Luminal A, Luminal B, Her2+ and basal like) and normal breast tissues using TCGA database. MIAT was remarkably overexpressed due to increased mRNA in all BC subtypes (Figure 1E). To assess the diagnostic importance of MIAT, we generated ROC curve using the mRNA expression data of BC patients and healthy individuals from TCGA database (Figure 1F). The area under the ROC curve was 0.832, with a sensitivity of 75.7% and a specificity of 85.0%, which indicated that MIAT conferred well diagnostic value. Subsequently, we analyzed the prognostic value of MIAT expression in BC subtyping by Kaplan-Meier Plotter (Figure 2). Notably, in basal like BC, high MIAT expression was positively associated with poor OS (Figure 2D). Whereas in Luminal A, Luminal B and Her2+ BC, MIAT confers a poor prognosis for PPS (Figure 2E–G).
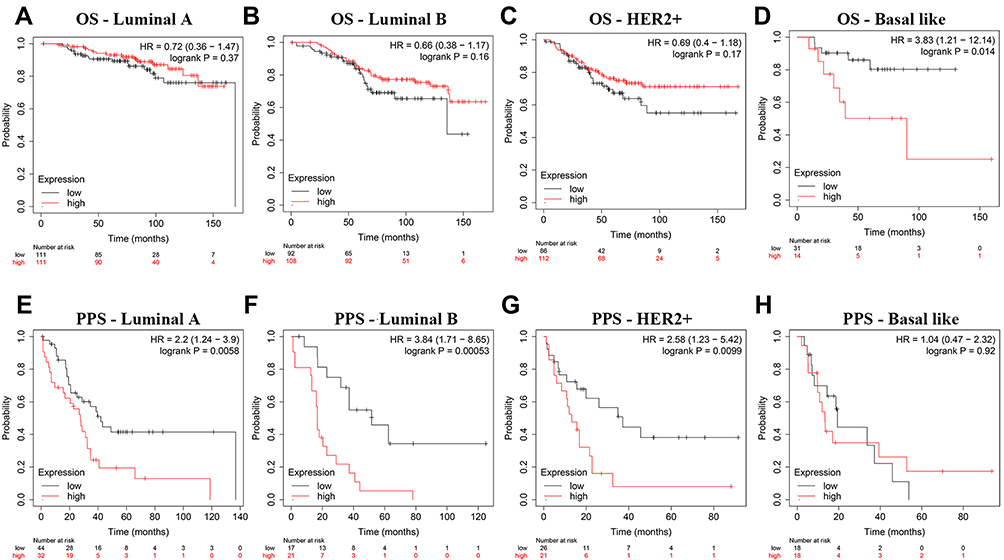 |
Figure 2 The prognostic significance of MIAT in BC patients across different subtypes. (A–H) Analysis of OS and PPS rates in BC subtypes. (A–D) OS, (E–H) PPS. |
The Function Enrichment Analysis of MIAT and Its Co-Expression Genes in BC
In order to investigate the potential functions of MIAT and identify the key genes associated with MIAT, we first identified a total of 4146 DEGs (|log2FC| > 1, PFDR < 0.05) between BC and normal samples from TCGA-BRCA database as shown in Figure 3A, and then analyzed the correlation between DEGs and MIAT in BC tissues with Pearson correlation coefficient method. The results presented that there were 129 genes highly positively correlated with MIAT (R > 0.4, P < 0.001) (Supplementary Table S1). A heat map of the relationship between the top 30 genes and MIAT was shown in Figure 3B.
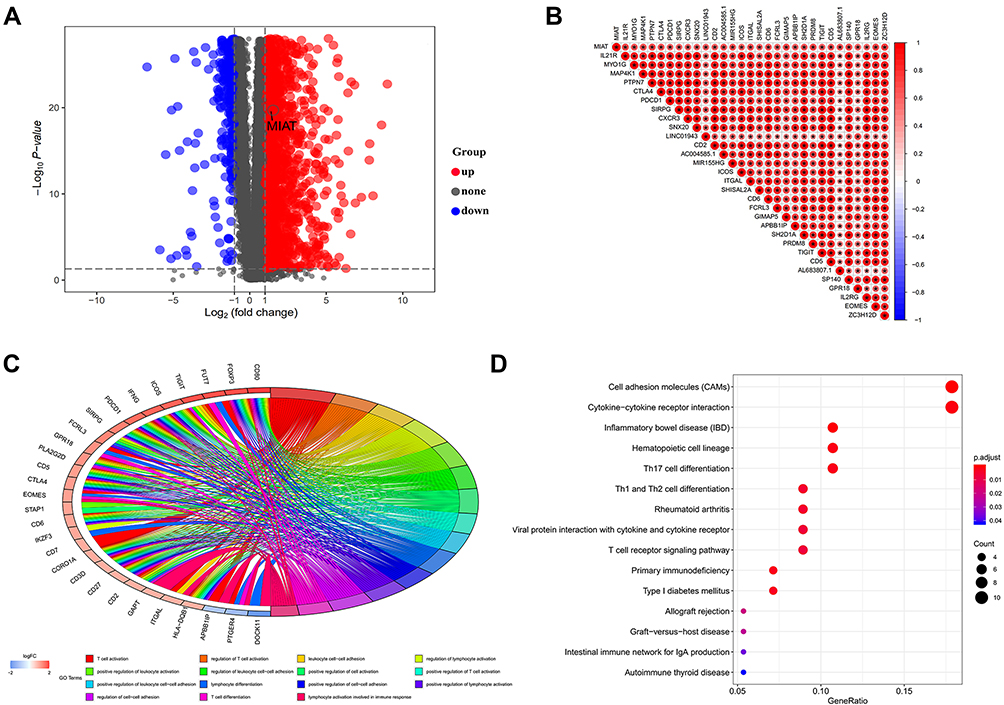 |
Figure 3 The function enrichment analysis of MIAT and its co-expression genes in BC. (A) The volcano map for difference analysis was plotted between the normal samples and the tumor samples from TCGA. (B) Correlation analysis between MIAT and the top 30 co-expressed genes, “*”Indicates statistical significance. (C) Top 15 GO-BP terms for MIAT co-expressed genes. (D) Top 15 KEGG pathways enriched by MIAT co-expressed DEGs. |
Subsequently, we conducted the GO and the KEGG pathway analysis to explore the biological significance and function of MIAT-co-expressed genes. As illustrated in the most valuable 15 GO biological process (BP) function enrichment, the MIAT-co-expressed genes were mainly significantly enriched in immune-related functions, including T cell activation, regulation of T cell activation, positively regulation of T cell activation; leukocyte cell-cell adhesion, regulation of leukocyte cell-cell adhesion, positively regulation of leukocyte cell-cell adhesion, positively regulation of leukocyte activation; regulation of lymphocyte activation, lymphocyte activation involved in immune response, lymphocyte differentiation, etc. (Figure 3C). Additionally, the KEGG results demonstrated that MIAT-co-expressed genes were also mainly enriched in immune-related pathways, such as cell adhesion molecules (CAMs),26 cytokine-cytokine receptor interaction,27 Th1/ Th2/Th17 cell differentiation, T cell receptor (TCR) signaling pathway, primary immunodeficiency and so on (Figure 3D). All of these function and pathways enrichment were associated with immune response.
Noticeably, literatures have shown that activated CD8+ T cells and CD4+ effector T cells possess anti-tumor properties, whereas regulatory T cells (CD4+ CD25+ Tregs) may be responsible for immunological hypo-responsiveness observed in cancer.28–31 Base on the immune cell adhesion mechanisms, leukocytes rely on CAMs to travel through the bloodstream and locate specific entry sites into cancer tissues. Regulation of leukocyte cell-cell adhesion can affect the abundance of TICs and immune response of tumor.32 In addition, the activation of TCR signals not only induces the proliferation of T cells and the production of cytokines, but also promotes the differentiation of T cells into effector cells and the exercise of immune response function.33
The Construction of MIAT Immune-Associated ceRNA Network
To investigate the potential molecular mechanisms underlying the immune regulation of MIAT in BC, we first downloaded 1811 immune-related genes from ImmPort database and intersected with 129 MIAT-co-expressed genes. And we then obtained 25 MIAT co-expressed IRGs (Figure 4A). Meanwhile, 304 DEMs were analyzed from TCGA database and visualized by heatmap in Figure 4B. Further, we predicted 138 MIAT-targeting miRNAs by miRcode and then intersected with 304 DEMs to acquire 52 MIAT-targeting DEMs (Figure 4C). To better understand the regulatory relationship of the MIAT, DEMs and IRGs in BC, the ceRNA network was constructed on the hypothesis that MIAT is involved in posttranscriptional regulation by working as a sponge to directly modulate DEMs and indirectly effect mRNA expressional levels. In this present study, the reconstructed ceRNA network consisted of 1 lncRNA MIAT node, 44 DEMs nodes, 24 IRGs nodes and 343 edges, which was visualized using Cytoscape (Figure 4D). Namely, a total of 299 MIAT-miRNA-mRNA interaction pairs were identified in the proposed ceRNA network. Taken together, the regulatory mechanism of immune-related MIAT in BC was revealed through the analysis of MIAT-miRNA-mRNA network based on competitive endogenous RNA.
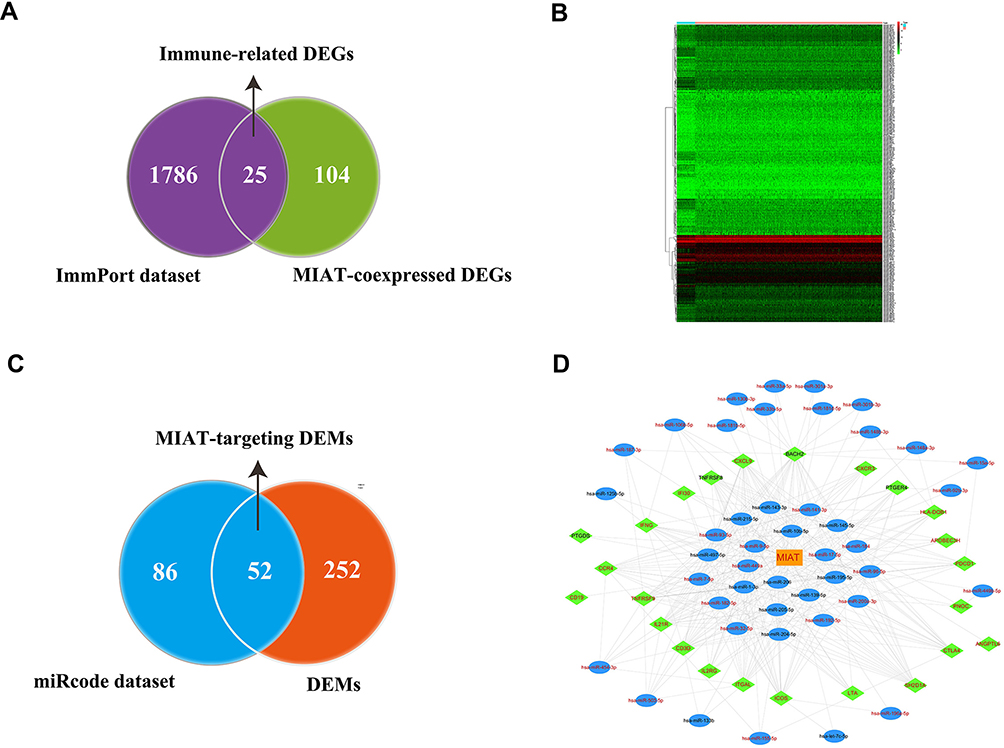 |
Figure 4 Reconstruction of MIAT-associated ceRNA network. (A) Screening of candidate immune-related DEGs related to MIAT. (B) Heat map showed distinct miRNA expression profiles of cases belong to normal vs tumor groups. (C) Screening of MIAT-targeting miRNAs between DEMs and miRcode dataset. (D) Construction of MIAT-related and immune-related ceRNA regulatory networks. Orange rectangles indicate lncRNA MIAT, blue ellipses indicate DEMs, green diamond indicate IRGs, red fonts indicate upregulation, black fonts indicate downregulated, edges indicate interactions. |
Significant Correlation Between MIAT Expression and TICs in Tumor Microenvironment of BC
In order to understand the relationship between the MIAT and TICs, we evaluated the correlations between the MIAT levels and immune cells and tumor purity in BC through TIMER analysis. The expression of MIAT was positively correlated with different types of immune cells, including B cells, CD8+ T cells, CD4+ T cells, Macrophages, Neutrophils and Dendritic cells (Figure 5A). Our results showed that the correlation between the upregulated MIAT and high immune infiltration in BC, which suggested the lower tumor purity. We next used an established computational resource (CIBERSORT) to explore gene expression profiles of downloaded samples to infer the density of 22 types of immune cells. And Figure 5B exhibits the results of difference analysis of 21 subpopulations of immune cells. Hereinto, Plasma cells, CD8 T cells, CD4 memory resting T cells, CD4 memory activated T cells, gamma delta T cells, activated NK cells, monocytes, M1 macrophages, M2 macrophages and activated mast cells are the main immune cells effected by MIAT expression. Noteworthy, CD8 T cells, CD4 memory resting T cells, CD4 memory activated T cells, gamma delta T cells and M1 macrophages are increased in high MIAT expression group compared with low MIAT expression group. In contrast, plasma cells, activated NK cells, monocytes, M2 macrophages and activated mast cells showed the opposite. To further explore the role of MIAT in tumor immune, we determined the expression correlation of MIAT with biomarkers of immune cells in BC using GEPIA database. As listed in Table 1, MIAT was positively correlated with various immune cell related biomarkers in BC. These findings partially support that MIAT is positively linked to immune cell infiltration. Altogether, MIAT was involved in the immune regulation of BC via immune infiltration, which was consistent with the previous enrichment results.
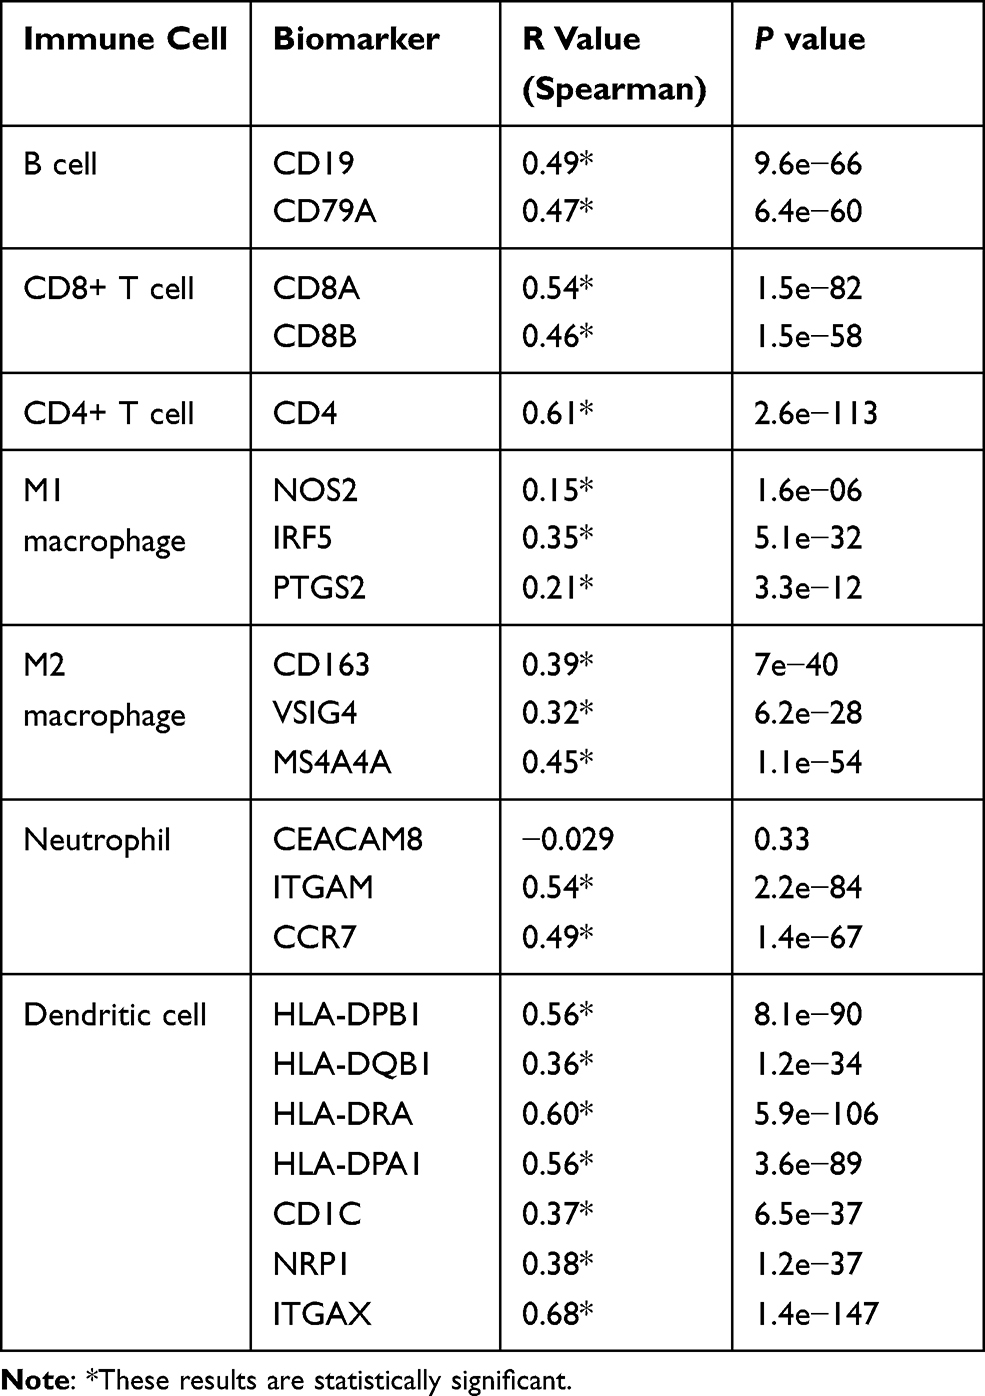 |
Table 1 Correlation Analysis Between MIAT and Immune Cells Related Biomarkers in BRCA Determined from GEPIA Database |
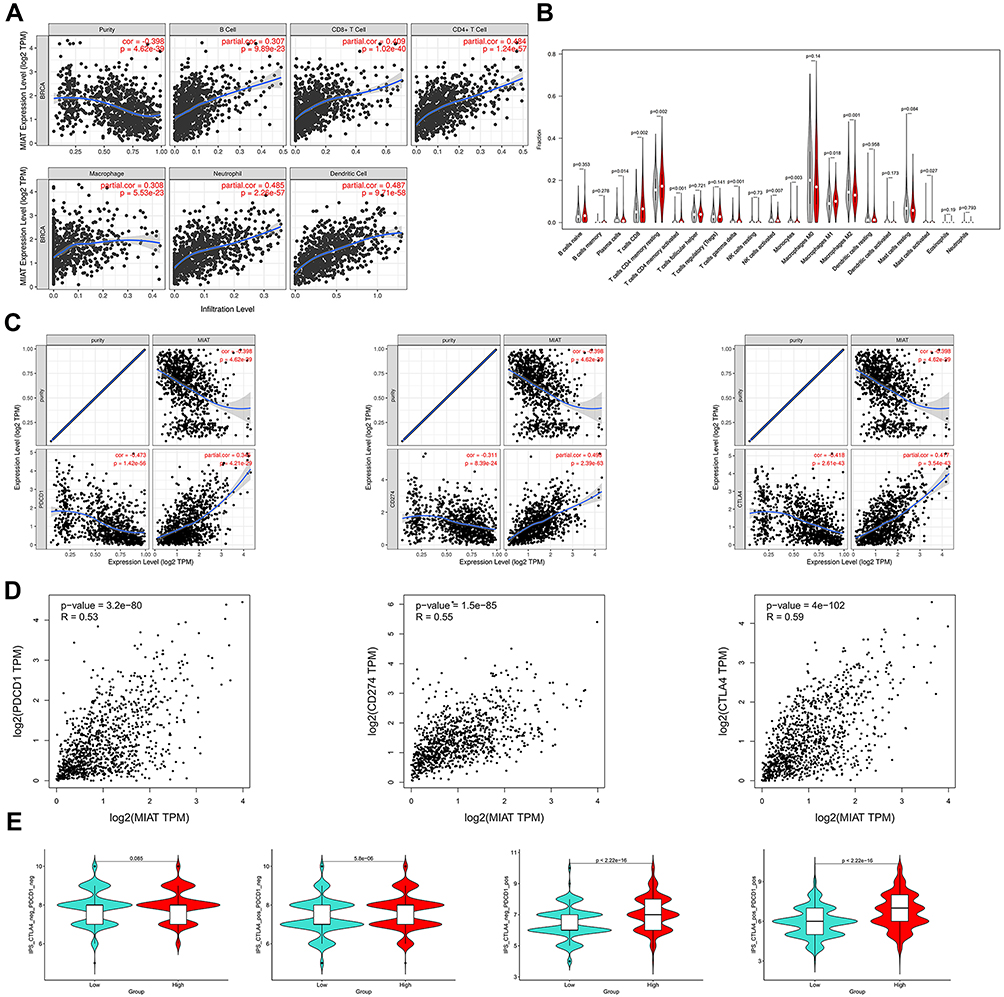 |
Figure 5 MIAT correlates with immune infiltrates in BC. (A) Based on TIMER database, there is a significant correlation between MIAT expression and immune cells, including CD4+ T cells, CD8+ T cells, B cells, macrophages, neutrophils, and dendritic cells. (B) Correlation analysis between MIAT expression and TICs in tumor microenvironment of BC. (C) Spearman correlation of MIAT with expression of PDCD1 (PD-1), CD274 (PD-L1) and CTLA-4 adjusted by purity using TIMER. (D) Spearman correlation of MIAT with PDCD1, CD274 and CTLA-4 expression determined by GEPIA database. (E) The association between IPS and the MIAT expression level of BC patients in TCGA. |
In addition, we analyzed the relationship of MIAT with immune checkpoints PDCD1 (PD-1)/CD274 (PD-L1) and CTLA-4 by TIMER database. As suggested in Figure 5C, MIAT expression was significantly positively correlated with PDCD1, CD274 and CTLA-4 in BC, which is consistent with the findings in GEPIA database (Figure 5D). These results demonstrated that tumor immune escape might be involved in MIAT-mediated carcinogenesis in BC. IPS is on the basis of the high pre-existing immunogenic potential. Recent studies have reported the roles that IPS played in the prediction of the response to immune checkpoint inhibitors (ICIs) of cancer patients.34 The relationship between IPS and MIAT was investigated in our study (Figure 5E). The other IPS were significantly higher in the high MIAT expression group except IPS_CTLA4_neg_PD1_neg. The results suggested that MIAT high-expressed group patients had a better opportunity for ICI application.
Validation in Serum
To further verify the clinical implications, we detected MIAT expression in serum samples from 82 tumor patients and 82 healthy volunteers. As shown in Figure 6A, the relative expression level of MIAT in tumor group was higher than in healthy normal group (P < 0.001). And the area under the ROC curve of MIAT in serum was 0.86 with a sensitivity of 87.80% and a specificity of 75.61%, which demonstrates that MIAT has higher clinical value as a non-invasive biomarker in BC (Figure 6B). Additionally, we compared the transcription levels of MIAT among groups of patients, according to different clinicopathological characteristics. The results demonstrated that there was no significant difference in body mass index (BMI), menopausal status, oestrogen receptor (ER), progesterone receptor (PR), Her2 and Ki-67. Notably, high MIAT expression was positively associated with TNM stage and lymph node metastasis (Table 2).
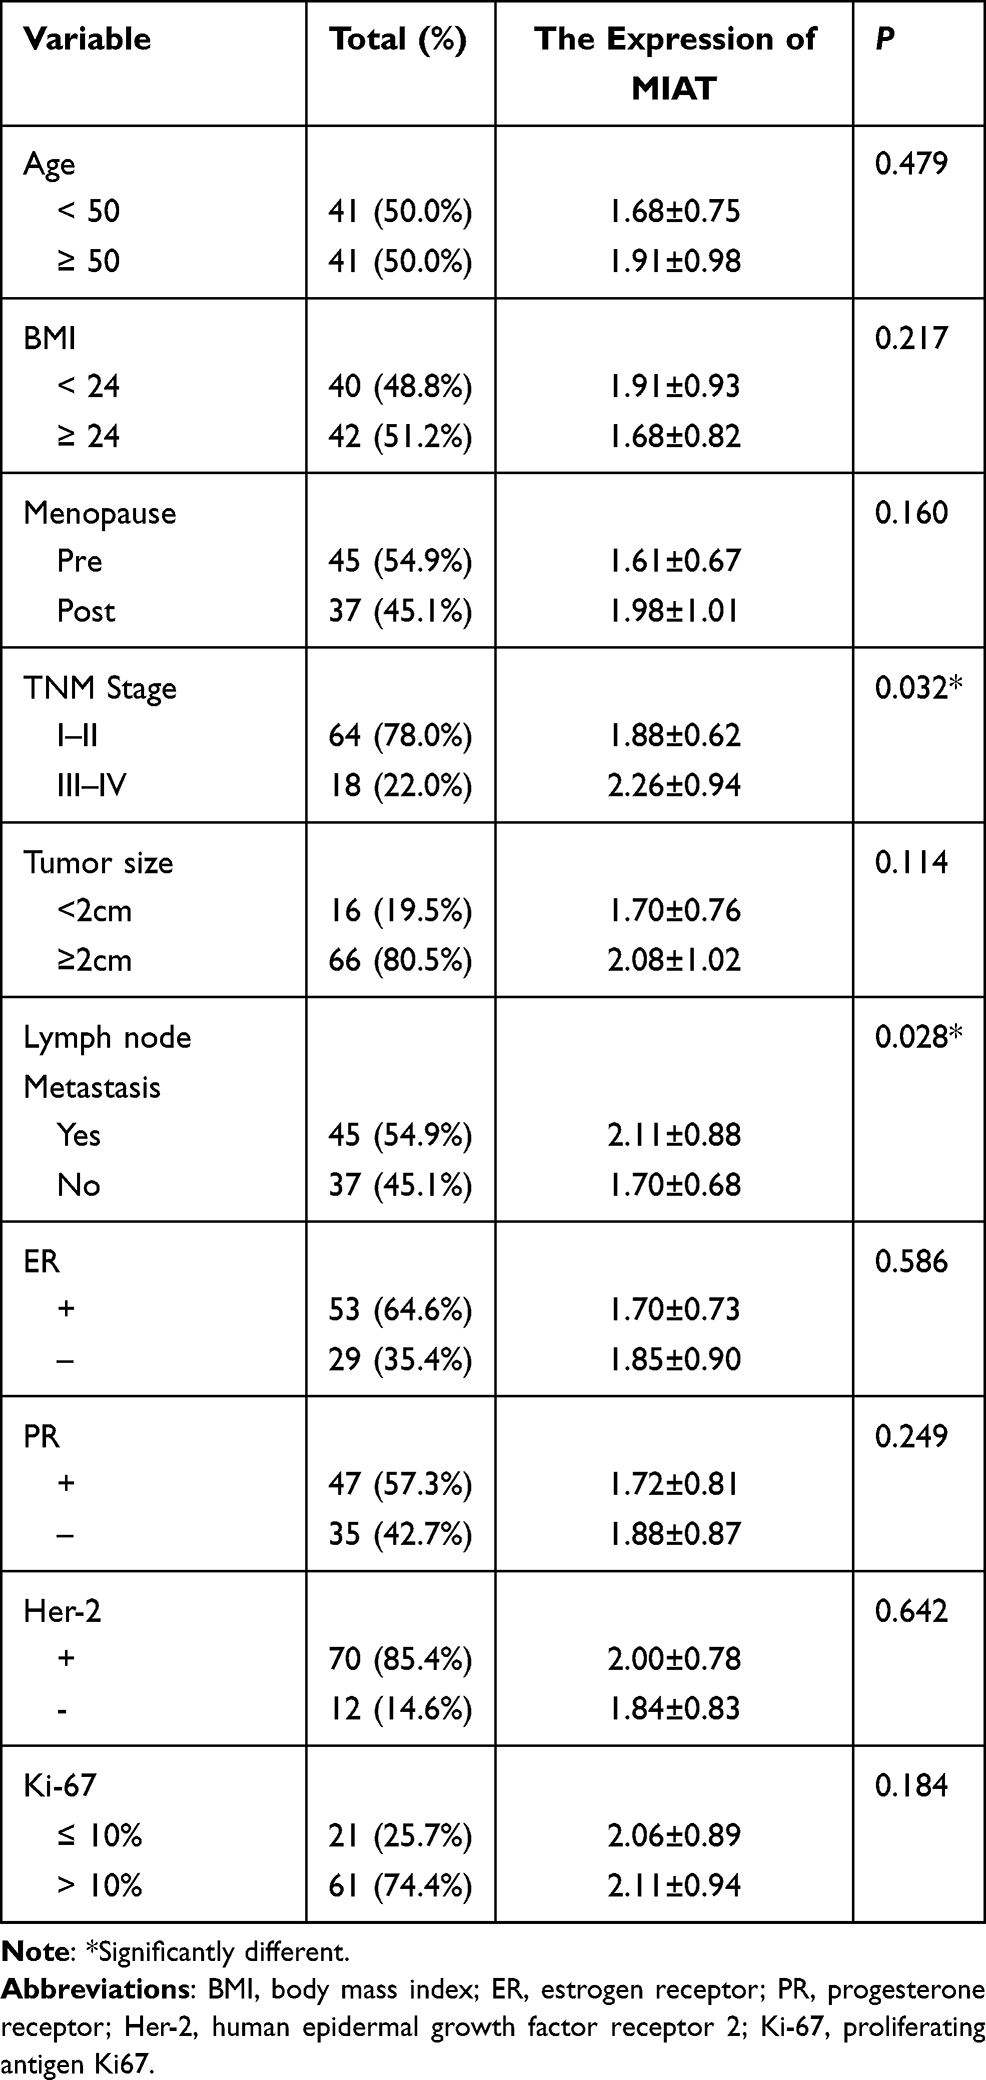 |
Table 2 Serum MIAT and Clinical Characteristic Correlations in BC Patients |
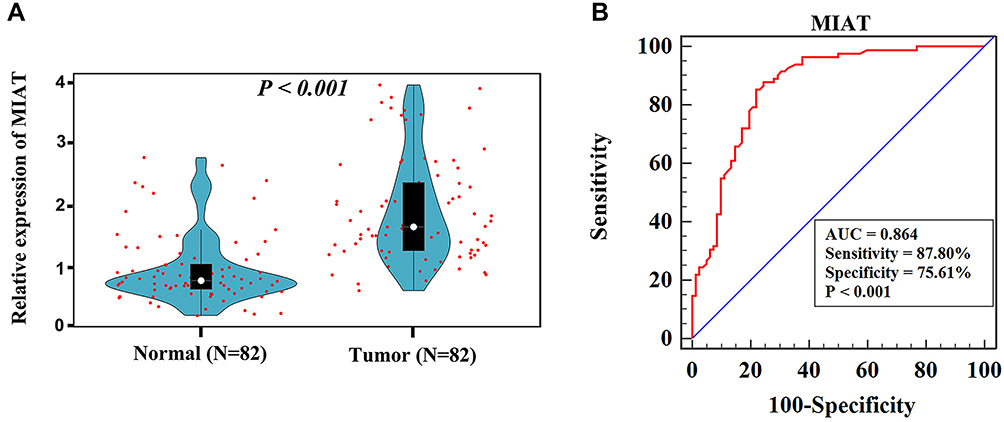 |
Figure 6 Clinical validation of MIAT in BC patients. (A) Relative expression of MIAT in clinical serum samples. (B) The diagnostic value of serum MIAT in distinguishing BC patients from normal persons was confirmed by ROC analysis. |
Discussion
Although lncRNA MIAT is related to BC progression, the detailed function and mechanism of MIAT in BC remains unclear and need to be elucidated.11,12,35,36 Prior to the present study, the role of MIAT in regulating immune response of BC has not been fully established. This study demonstrated for the first time that MIAT may service as a noninvasive biomarker for diagnosis and correlated with immune infiltrates in BC.
We made the following new findings that had not been previously reported:
First, high MIAT expression is a rather general feature of human cancer without limited to BC, which was uncovered by data mining of publicly available cancer clinical databases (Figure 1A). Further, we identified MIAT as the specific upregulate molecule based on analysis of bulk gene expression data from nearly 1500 cases of BC and its subtypes (Figure 1B–E). Moreover, ROC analysis confirmed that the high expression of MIAT has the potential diagnostic value in patients with BC tissues (Figure 1F). In-depth analysis also shows the poor PPS of SPDEF high expression in Luminal A, Luminal B and Her2+ BC, whereas poor OS in Basal like BC (Figure 2). The literature has approved that high-expressed MIAT promotes BC progression and functions as a ceRNA to regulate dual specificity phosphatase 7 (DUSP7) expression by sponging miR-155-5p in BC.12 And it was also demonstrated that knockdown MIAT significantly elevated the expression of p16Ink4A and cytochrome c oxidase subunit 2 (Cox2), which commitment cellular senescence in BC cells.11 In brief, further in-depth mechanistic characterization will answer whether MIAT is a novel target for therapeutic development.
Second, the present study provided the first evidence that MIAT and its co-expression genes may participate in multiple biological processes and pathways involving in tumor immune response (Figure 3C–D). The GO analysis suggested that the high expression of MIAT could be involved in the regulation of T cell activation, regulation of leukocyte cell-cell adhesion, etc. Thereinto, T cell activation score has significantly positive relationship with patients’ overall survival, and may serve as a marker of personalized immunotherapy in BC patients.37 In vivo, angiogenic stimuli prevent the formation of an effective leukocyte infiltrate in BC by suppressing endothelial intercellular adhesion molecule 1 (ICAM-1) expression.38 Pathway enrichment analysis with reference to KEGG mainly focused on CAMs, cytokine-cytokine receptor interaction, Th1/ Th2/Th17 cell differentiation, TCR signaling pathway, primary immunodeficiency and so on. Recent study has suggested that tumour necrosis factor (TNF) and its receptor 2 (TNFR2) expressed on BC cells have important functional consequences, this cytokine/receptor interaction is critical for promoting highly immune-suppressive phenotypes by regulatory T cells.27 The involvement of MIAT in tumor immune response has been rarely reported before which could be the focus of our next research.
Third, we have constructed the MIAT-related ceRNA network to infer how MIAT is involved in the immune response of BC based on 24 immune-related MIAT co-expressed IRGs and 44 potential MIAT-targeting DEMs (Figure 4D). In the ceRNA regulatory network, we discovered that 10 DEMs had been confirmed to have a targeted relationship with MIAT in the 44 DEMs. These 10 DEMs include, miR-155-5p,12 miR181b-5p,39 miR-200a-3p,40 miR-133-3p,41 miR-93-5p,42 miR-139-5p,43 miR-145-5p,44 miR-204-5p,45 miR-141-3p,46 and miR-106.47 The remaining 34 DEMs have not been previously reported to be associated with MIAT, which may help us to find new MIAT-miRNA relationship axis that are involved in the BC regulation. Although it has not been reported that MIAT as a ceRNA directly promotes the expression of IRGs, we found that MIAT-targeting miRNAs can interfere with the expression of IRGs. Zhang et al confirmed that miR-155-5p overexpression in CD4+ T cells resulted in decreased cytotoxic T lymphocyte antigen 4 (CTLA-4) levels and a subsequent increased Th cells proliferative response.48 When mir-148a is expressed prematurely, targeting BTB and CNC homology 2 (Bach2) can promote the differentiation and survival of plasma blast, thereby affecting the immune system.49 And miR-200a-3p is a negative regulator of the chemokine (C-X-C motif) ligand 9 (CXCL9), depletion of which exacerbates cecal inflammation in Mdr1a-/- mice.50 Altogether, these findings were not previously reported in the literature, thus and merits further studies.
Fourth, this study reveals the significant correlation of MIAT expression level with high immune infiltration in BC. In recent years, the microenvironment involving diverse cell clusters (such as immune cells, tumor cells, and fibroblasts) in cancer has been a hotspot. How MIAT participates in tumor microenvironment and influence TICs in BC should be explored. Based on the expression levels of MIAT, we found six types of TICs and their surface markers, including B cells, CD8+ T cells, CD4+ T cells, Macrophages (M1/M2), Neutrophils and Dendritic cells, which were indicated to be positively correlated with MIAT (Figure 5A). In addition, previous study has suggested that breast cancers might be an immunogenic tumor.51 Detailed characterization of the immune cell composition in tumor may be the basis for determining the biomarkers of immunotherapy. Thus, we further assessed the estimated fraction of tumor-infiltrating immune cells in BC based on differentially expressed MIAT with CIBERSORT analysis (Figure 5B). The results demonstrated a substantial positive connection of MIAT expression with filtration levels of CD8 T cells, CD4 memory resting T cells, CD4 memory activated T cells, gamma delta T cells and M1 macrophages. Whereas, plasma cells, activated NK cells, monocytes, M2 macrophages and activated mast cells were negatively correlated with MIAT high expression in BC. Several studies have suggested CD8 T as a prognostic favorable factor of immunotherapy in some breast cancers,52,53 which provides new insights to the development of effective cancer immunotherapeutic approaches. On the other hand, programmed cell death protein-1 (PD-1) and programmed cell death-ligand 1 (PD-L1) eliminate T cell activation by binding to the cell membrane of CD8 T, thereby promoting immune escape of cancer cells.54 Therefore, immunotherapy of anti-PD1/anti-PD-L1 maybe a potential treatment of BC with high MIAT expressions. MIAT can be used as a predictor of the efficacy of immunotherapy. Therefore, we explored the association MIAT expression with the immune checkpoints and IPS (Figure 5C–E). The expression of PDCD1, CD274 and CTLA4 was positively correlated with abundant MIAT, and the IPS_CTLA4_pos_PD1_neg, IPS_CTLA4_neg_PD1_pos, IPS_CTLA4_pos_PD1_pos markedly increased in the high MIAT expression group. It’s suggested that MIAT may reflect the immunogenic tumor microenvironment of BC to some extent. All above results support that MIAT can predict which patients will benefit from ICI.
Finally, high MIAT expression is a promising biomarker for BC thus is of high clinical relevance (Figure 6). Moreover, MIAT overexpression is positively associated with TNM stage and lymph node metastasis in BC, which is consistent with the previous report.12 Together these findings suggested that the levels of MIAT could be explored as non-invasive screening for BC patients with a better sensitivity and specificity.
In summary, the present study provides convincing evidence for the first time that MIAT may serve as an immune-related lncRNA and involve in tumor immune infiltration. Moreover, MIAT may be a great potential biomarker for the diagnosis and treatment for BC thus is of highly clinical relevance. In a word, the results of this study suggested that lncRNA MIAT plays an important role in BC immune response and provides a novel insight into the immune regulation of BC.
Ethics Approval and Consent to Participate
This study was conducted in accordance with the Declaration of Helsinki. Ethics Approval and Consent to Participate were obtained from the Laboratory Medicine Department of the Affiliated Hospital of Southwest Medical University. Patient Consent Forms were obtained according to protocols approved by the Institutional Review Board of the Affiliated Hospital of Southwest Medical University.
Acknowledgments
This work was supported by the Sichuan Science and Technology Program for key Research and Development, China (Grant No. 2021YFS0226, Grant No. 2021YFS0332), Doctoral Research Initiation Fund of Affiliated Hospital of Southwest Medical University, China (Grant No.19077). We would like to thank the members of the research group who are not listed in the authors.
Disclosure
The authors declare no conflicts of interest.
References
1. Bray F, Ferlay J, Soerjomataram I, Siegel RL, Torre LA, Jemal A. Global cancer statistics 2018: GLOBOCAN estimates of incidence and mortality worldwide for 36 cancers in 185 countries. CA Cancer J Clin. 2018;68(6):394–424.
2. DeSantis CE, Ma J, Gaudet MM, et al. Breast cancer statistics, 2019. CA Cancer J Clin. 2019;69(6):438–451. doi:10.3322/caac.21583
3. Kouketsu A, Sato I, Oikawa M, et al. Regulatory T cells and M2-polarized tumour-associated macrophages are associated with the oncogenesis and progression of oral squamous cell carcinoma. Int J Oral Maxillofac Surg. 2019;48(10):1279–1288. doi:10.1016/j.ijom.2019.04.004
4. Huang Y, Ma C, Zhang Q, et al. CD4+ and CD8+ T cells have opposing roles in breast cancer progression and outcome. Oncotarget. 2015;6(19):17462–17478. doi:10.18632/oncotarget.3958
5. Quinn JJ, Chang HY. Unique features of long non-coding RNA biogenesis and function. Nat Rev Genet. 2016;17(1):47–62. doi:10.1038/nrg.2015.10
6. Rasool M, Malik A, Zahid S, et al. Non-coding RNAs in cancer diagnosis and therapy. Non-Coding RNA Res. 2016;1(1):69–76. doi:10.1016/j.ncrna.2016.11.001
7. Ulitsky I, Bartel DP. lincRNAs: genomics, evolution, and mechanisms. Cell. 2013;154(1):26–46. doi:10.1016/j.cell.2013.06.020
8. Schmitt AM, Chang HY. Long noncoding RNAs in cancer pathways. Cancer Cell. 2016;29(4):452–463. doi:10.1016/j.ccell.2016.03.010
9. Zhang C, Xie L, Fu Y, Yang J, Cui Y. lncRNA MIAT promotes esophageal squamous cell carcinoma progression by regulating miR-1301-3p/INCENP axis and interacting with SOX2. J Cell Physiol. 2020;235(11):7933–7944.
10. Sattari A, Siddiqui H, Moshiri F, et al. Upregulation of long noncoding RNA MIAT in aggressive form of chronic lymphocytic leukemias. Oncotarget. 2016;7(34):54174–54182. doi:10.18632/oncotarget.11099
11. Alipoor FJ, Asadi MH, Torkzadeh-Mahani M. MIAT lncRNA is overexpressed in breast cancer and its inhibition triggers senescence and G1 arrest in MCF7 cell line. J Cell Biochem. 2018;119(8):6470–6481. doi:10.1002/jcb.26678
12. Luan T, Zhang X, Wang S, et al. Long non-coding RNA MIAT promotes breast cancer progression and functions as ceRNA to regulate DUSP7 expression by sponging miR-155-5p. Oncotarget. 2017;8(44):76153–76164. doi:10.18632/oncotarget.19190
13. Crea F, Venalainen E, Ci X, et al. The role of epigenetics and long noncoding RNA MIAT in neuroendocrine prostate cancer. Epigenomics. 2016;8(5):721–731. doi:10.2217/epi.16.6
14. Lin D, Xu HP, Lin JH, Hu HH, Wang Q, Zhang J. Long non-coding RNA MIAT promotes non-small cell lung cancer progression by sponging miR-1246. Eur Rev Med Pharmacol Sci. 2019;23(13):5795–5801.
15. Goossens N, Nakagawa S, Sun X, Hoshida Y. Cancer biomarker discovery and validation. Transl Cancer Res. 2015;4(3):256–269.
16. Li T, Fan J, Wang B, et al. TIMER: a web server for comprehensive analysis of tumor-infiltrating immune cells. Cancer Res. 2017;77(21):e108–e110. doi:10.1158/0008-5472.CAN-17-0307
17. Ritchie ME, Phipson B, Wu D, et al. Limma powers differential expression analyses for RNA-sequencing and microarray studies. Nucleic Acids Res. 2015;43(7):e47. doi:10.1093/nar/gkv007
18. Makabe T, Arai E, Hirano T, et al. Genome-wide DNA methylation profile of early-onset endometrial cancer: its correlation with genetic aberrations and comparison with late-onset endometrial cancer. Carcinogenesis. 2019;40(5):611–623. doi:10.1093/carcin/bgz046
19. Kanehisa M, Sato Y, Furumichi M, Morishima K, Tanabe M. New approach for understanding genome variations in KEGG. Nucleic Acids Res. 2019;47(D1):D590–D595. doi:10.1093/nar/gky962
20. Yu G, Wang LG, Han Y, He QY. clusterProfiler: an R package for comparing biological themes among gene clusters. Omics. 2012;16(5):284–287. doi:10.1089/omi.2011.0118
21. Bhattacharya S, Andorf S, Gomes L, et al. ImmPort: disseminating data to the public for the future of immunology. Immunol Res. 2014;58(2–3):234–239. doi:10.1007/s12026-014-8516-1
22. Robinson MD, McCarthy DJ, Smyth GK. edgeR: a bioconductor package for differential expression analysis of digital gene expression data. Bioinformatics. 2010;26(1):139–140. doi:10.1093/bioinformatics/btp616
23. Jeggari A, Marks DS, Larsson E. miRcode: a map of putative microRNA target sites in the long non-coding transcriptome. Bioinformatics. 2012;28(15):2062–2063. doi:10.1093/bioinformatics/bts344
24. Agarwal V, Bell GW, Nam JW, Bartel DP. Predicting effective microRNA target sites in mammalian mRNAs. eLife. 2015;4:e05005. doi:10.7554/eLife.05005
25. Newman AM, Liu CL, Green MR, et al. Robust enumeration of cell subsets from tissue expression profiles. Nat Methods. 2015;12(5):453–457. doi:10.1038/nmeth.3337
26. Liddelow S, Hoyer D. Astrocytes: adhesion molecules and immunomodulation. Curr Drug Targets. 2016;17(16):1871–1881. doi:10.2174/1389450117666160101120703
27. Al-Hatamleh MAI, Ahmad S, Boer JC, et al. A perspective review on the role of nanomedicine in the modulation of TNF-TNFR2 axis in breast cancer immunotherapy. J Oncol. 2019;2019:6313242. doi:10.1155/2019/6313242
28. Sutmuller RP, van Duivenvoorde LM, van Elsas A, et al. Synergism of cytotoxic T lymphocyte-associated antigen 4 blockade and depletion of CD25(+) regulatory T cells in antitumor therapy reveals alternative pathways for suppression of autoreactive cytotoxic T lymphocyte responses. J Exp Med. 2001;194(6):823–832. doi:10.1084/jem.194.6.823
29. Yu P, Fu YX. Tumor-infiltrating T lymphocytes: friends or foes? Lab Invest. 2006;86(3):231–245. doi:10.1038/labinvest.3700389
30. Shimizu J, Yamazaki S, Sakaguchi S. Induction of tumor immunity by removing CD25+CD4+ T cells: a common basis between tumor immunity and autoimmunity. J Immunol. 1999;163(10):5211–5218.
31. Onizuka S, Tawara I, Shimizu J, Sakaguchi S, Fujita T, Nakayama E. Tumor rejection by in vivo administration of anti-CD25 (interleukin-2 receptor alpha) monoclonal antibody. Cancer Res. 1999;59(13):3128–3133.
32. Dustin ML. Integrins and their role in immune cell adhesion. Cell. 2019;177(3):499–501. doi:10.1016/j.cell.2019.03.038
33. Smith-Garvin JE, Koretzky GA, Jordan MS. T cell activation. Annu Rev Immunol. 2009;27(1):591–619. doi:10.1146/annurev.immunol.021908.132706
34. Singh S, Numan A, Agrawal N, Tambuwala MM, Singh V, Kesharwani P. Role of immune checkpoint inhibitors in the revolutionization of advanced melanoma care. Int Immunopharmacol. 2020;83:106417. doi:10.1016/j.intimp.2020.106417
35. Li Y, Jiang B, Wu X, et al. Long non-coding RNA MIAT is estrogen-responsive and promotes estrogen-induced proliferation in ER-positive breast cancer cells. Biochem Biophys Res Commun. 2018;503(1):45–50. doi:10.1016/j.bbrc.2018.05.146
36. Almnaseer ZA, Mourtada-Maarabouni M. Long noncoding RNA MIAT regulates apoptosis and the apoptotic response to chemotherapeutic agents in breast cancer cell lines. Biosci Rep. 2018;38(4):BSR20180704. doi:10.1042/BSR20180704
37. Lu L, Bai Y, Wang Z. Elevated T cell activation score is associated with improved survival of breast cancer. Breast Cancer Res Treat. 2017;164(3):689–696. doi:10.1007/s10549-017-4281-x
38. Bouma-ter Steege JC, Baeten CI, Thijssen VL, et al. Angiogenic profile of breast carcinoma determines leukocyte infiltration. Clin Cancer Res. 2004;10(21):7171–7178. doi:10.1158/1078-0432.CCR-04-0742
39. Zhong X, Ma X, Zhang L, Li Y, He R. MIAT promotes proliferation and hinders apoptosis by modulating miR-181b/STAT3 axis in ox-LDL-induced atherosclerosis cell models. Biomed Pharmacother. 2018;97:1078–1085. doi:10.1016/j.biopha.2017.11.052
40. Wang H, Ding XG, Yang JJ, et al. LncRNA MIAT facilitated BM-MSCs differentiation into endothelial cells and restored erectile dysfunction via targeting miR-200a in a rat model of erectile dysfunction. Eur J Cell Biol. 2018;97(3):180–189. doi:10.1016/j.ejcb.2018.02.001
41. Li TF, Liu J, Fu SJ. The interaction of long non-coding RNA MIAT and miR-133 play a role in the proliferation and metastasis of pancreatic carcinoma. Biomed Pharmacother. 2018;104:145–150. doi:10.1016/j.biopha.2018.05.043
42. Li Y, Wang J, Sun L, Zhu S. LncRNA myocardial infarction-associated transcript (MIAT) contributed to cardiac hypertrophy by regulating TLR4 via miR-93. Eur J Pharmacol. 2018;818:508–517. doi:10.1016/j.ejphar.2017.11.031
43. Yan C, Li J, Feng S, Li Y, Tan L. Long noncoding RNA Gomafu upregulates Foxo1 expression to promote hepatic insulin resistance by sponging miR-139-5p. Cell Death Dis. 2018;9(3):289.
44. Chen S, Chen H, Yu C, et al. Long noncoding RNA myocardial infarction associated transcript promotes the development of thoracic aortic by targeting microRNA-145 via the PI3K/Akt signaling pathway. J Cell Biochem. 2019;120(9):14405–14413. doi:10.1002/jcb.28695
45. Deng W, Fan C, Shen R, Wu Y, Du R, Teng J. Long noncoding MIAT acting as a ceRNA to sponge microRNA-204-5p to participate in cerebral microvascular endothelial cell injury after cerebral ischemia through regulating HMGB1. J Cell Physiol. 2019;235(5):4571–4586.
46. Sha M, Lin M, Wang J, et al. Long non-coding RNA MIAT promotes gastric cancer growth and metastasis through regulation of miR-141/DDX5 pathway. J Exp Clin Cancer Res. 2018;37(1):58. doi:10.1186/s13046-018-0725-3
47. Li DS, Ainiwaer JL, Sheyhiding I, Zhang Z, Zhang LW. Identification of key long non-coding RNAs as competing endogenous RNAs for miRNA-mRNA in lung adenocarcinoma. Eur Rev Med Pharmacol Sci. 2016;20(11):2285–2295.
48. Zhang Y, Sun E, Li X, et al. miR-155 contributes to Df1-induced asthma by increasing the proliferative response of Th cells via CTLA-4 downregulation. Cell Immunol. 2017;314:1–9. doi:10.1016/j.cellimm.2017.01.005
49. Porstner M, Winkelmann R, Daum P, et al. miR-148a promotes plasma cell differentiation and targets the germinal center transcription factors Mitf and Bach2. Eur J Immunol. 2015;45(4):1206–1215. doi:10.1002/eji.201444637
50. Wu D, Kittana H, Shu J, et al. Dietary depletion of milk exosomes and their microRNA cargos elicits a depletion of miR-200a-3p and elevated intestinal inflammation and chemokine (C-X-C Motif) ligand 9 expression in Mdr1a(-/-) mice. Curr Dev Nutr. 2019;3(12):nzz122. doi:10.1093/cdn/nzz122
51. Hendrickx W, Simeone I, Anjum S, et al. Identification of genetic determinants of breast cancer immune phenotypes by integrative genome-scale analysis. Oncoimmunology. 2017;6(2):e1253654. doi:10.1080/2162402X.2016.1253654
52. Ibrahim EM, Al-Foheidi ME, Al-Mansour MM, Kazkaz GA. The prognostic value of tumor-infiltrating lymphocytes in triple-negative breast cancer: a meta-analysis. Breast Cancer Res Treat. 2014;148(3):467–476. doi:10.1007/s10549-014-3185-2
53. Sconocchia G, Eppenberger S, Spagnoli GC, et al. NK cells and T cells cooperate during the clinical course of colorectal cancer. Oncoimmunology. 2014;3(8):e952197. doi:10.4161/21624011.2014.952197
54. Thompson ED, Taube JM, Asch-Kendrick RJ, et al. PD-L1 expression and the immune microenvironment in primary invasive lobular carcinomas of the breast. Mod Pathol. 2017;30(11):1551–1560. doi:10.1038/modpathol.2017.79
 © 2021 The Author(s). This work is published and licensed by Dove Medical Press Limited. The full terms of this license are available at https://www.dovepress.com/terms.php and incorporate the Creative Commons Attribution - Non Commercial (unported, v3.0) License.
By accessing the work you hereby accept the Terms. Non-commercial uses of the work are permitted without any further permission from Dove Medical Press Limited, provided the work is properly attributed. For permission for commercial use of this work, please see paragraphs 4.2 and 5 of our Terms.
© 2021 The Author(s). This work is published and licensed by Dove Medical Press Limited. The full terms of this license are available at https://www.dovepress.com/terms.php and incorporate the Creative Commons Attribution - Non Commercial (unported, v3.0) License.
By accessing the work you hereby accept the Terms. Non-commercial uses of the work are permitted without any further permission from Dove Medical Press Limited, provided the work is properly attributed. For permission for commercial use of this work, please see paragraphs 4.2 and 5 of our Terms.