")
Back to Journals » Diabetes, Metabolic Syndrome and Obesity » Volume 12
lncRNA GAS5/miR-452-5p Reduces Oxidative Stress and Pyroptosis of High-Glucose-Stimulated Renal Tubular Cells
Authors Xie C, Wu W, Tang A, Luo N, Tan Y
Received 25 August 2019
Accepted for publication 7 November 2019
Published 9 December 2019 Volume 2019:12 Pages 2609—2617
DOI https://doi.org/10.2147/DMSO.S228654
Checked for plagiarism Yes
Review by Single anonymous peer review
Peer reviewer comments 2
Editor who approved publication: Prof. Dr. Antonio Brunetti
Cuisong Xie,1 Weiling Wu,1 Ainan Tang,2 Ning Luo,1 Yanfei Tan1
1Department of Endocrinology, Chenzhou No.1 People’s Hospital, Chenzhou, Hunan 423000, People’s Republic of China; 2Department of Endocrinology, Chenzhou 3rd People’s Hospital, Chenzhou, Hunan 423000, People’s Republic of China
Correspondence: Cuisong Xie
Department of Endocrinology, Chenzhou No.1 People’s Hospital, 102 Xijie Street, Beihu District, Chenzhou, Hunan 423000, People’s Republic of China
Email [email protected]
Background: Diabetic nephropathy (DN) is the leading cause of end-stage renal failure worldwide. lncRNAs are demonstrated to improve the DN by changing the expression of miRNAs. This study was aimed to investigate the effect of lncRNA GAS5/miR-452-5p on the inflammation, oxidative stress and pyroptosis of high-glucose-induced renal tubular cells.
Methods: HK-2 cells were induced by HG to simulate DN cells. RT-qPCR analysis confirmed the transfection effects and detected the expression of GAS5, NLRP3, caspase1, IL-1β, pro-caspase1, pro-IL-1β, GSDMD-N and miR-452-5p. Western blot analysis determined the protein expression of NLRP3, caspase1, IL-1β, pro-caspase1, pro-IL-1β and GSDMD-N. The expression of GSDMD-N was also verified by immunofluorescence. The levels of TNF-α, IL-6, MCP-1, ROS, MDA and SOD were measured by commercial assay kits, respectively. Dual-luciferase reporter assay indicated that GAS5 could combine with miR-452-5p.
Results: GAS5 expression was decreased in HG-induced HK-2 cells. GAS5 overexpression could decrease the levels of TNF-α, IL-6, MCP-1, ROS and MDA and increase the levels of SOD. Moreover, GAS5 overexpression suppressed the expression of NLRP3, caspase1, IL-1β and GSDMD-N, and the results of immunofluorescence verified the above results. miR-452-5p interference could cause the same changes as GAS5 overexpression for HG-induced HK-2 cells, and GAS5 inhibition could reverse the effect of miR-452-5p interference.
Conclusion: GAS5 overexpression inhibited the inflammation, oxidative stress and pyroptosis of HG-induced renal tubular cells by downregulating the expression of miR-452-5p.
Keywords: lncRNA GAS5, miR-452-5p, oxidative stress, pyroptosis, high glucose, renal tubular cells
Introduction
Diabetes is a kind of metabolic and noncommunicable disease, characterized by a continuous increase of blood glucose, and often involves multiple organs. About 30% of diabetic patients will eventually develop into diabetic nephropathy (DN).1–3 DN not only has a high incidence rate, but also a high mortality rate, which brings great physical and mental pressure and economic burden to individual family and society. Therefore, how to effectively treat DN has become a focusing problem.
The present study has demonstrated that high blood glucose levels in DN are due to insufficient insulin secretion in the body of patients or the body’s resistance to insulin tissues, which produce excessive inflammatory cytokines caused by hypoxia. If the oxidative stress response exists for a long time, it will cause renal cell apoptosis and immersion of many inflammatory cells in the stroma.4 DN could be alleviated by coumarin glycosides, owing to its antioxidation and anti-inflammation activities.5 The overactivation of inflammatory cytokines could enhance the progression of renal fibrosis.6 Hence, inflammatory and oxidative stress are closely related to the development of DN.
Long noncoding RNAs (lncRNAs) are longer than 200 nucleotides in length.7 Recently, various lncRNAs have been studied in the treatment of DN.8–10 lncRNA MEG3 promoted fibrosis and inflammatory response by targeting the miR-181a in vitro and in vivo experiments of DN.11 Ma et al12 found that lncRNA NEAT1 was increased in the DN cellular model, and silencing of lncRNA NEAT1 suppressed cell proliferation, fibrosis and inflammation but increased cell apoptosis in the DN cellular model. Li et al13 indicated that lncRNA GAS5 was obviously downregulated in ovarian cancer tissues, and GAS5 overexpression inhibited proliferation, colony formation and apoptosis of ovarian cancer cells. Moreover, GAS5 was related to inflammasome formation and pyroptosis in ovarian cancer cells. A previous study has shown that the expression of GAS5 in the serum of diabetic patients is reduced,14 while the effect of GAS5 on DN is unknown. miR-452-5p expression was increased in the umbilical vein endothelial cells of patients with gestational diabetes.15 Therefore, it can be speculated that miR-452-5p is involved in metabolic diseases.
In the current study, we aimed to investigate the expression of GAS5 and miR-452-5p in high-glucose (HG)-induced renal tubular cells, the relation of GAS5 and miR-452-5p and the effect of GAS5 overexpression and miR-452-5p interference on the inflammation, oxidative stress and pyroptosis of HG-induced renal tubular cells.
Materials and Methods
Cell Culture and HG Induction
Human renal tubular cells (HK-2) were cultured in DMEM/F12 medium containing 10% fetal bovine serum (FBS), 100 U/mL penicillin and 100 μg/mL streptomycin and incubated in an incubator at 37°C with 5% CO2. HK-2 cells were obtained from American Type Culture Collection (ATCC). In the control group, HK-2 cells were treated with 5.5 mM glucose for 12 hrs, 24 hrs and 48 hrs. In the induction group, HK-2 cells were treated with glucose 30 mM for 12 hrs, 24 hrs and 48 hrs.
Cell Transfection
Transient transfection was performed according to the instructions of Lipofectamine2000 transfer kit. HK-2 cells were, respectively, transfected with pcDNA-NC, pcDNA-GAS5, shRNA-NC, shRNA-GAS5, miR-NC and miR-452-5p inhibitor. miR-452-5p inhibitor and shRNA-NC or miR-452-5p inhibitor and shRNA-GAS5 were, respectively, co-transfected to HG-induced HK-2 cells.
RT-qPCR Analysis
The total RNA was extracted by the conventional Trizol method, and the quality of the extracted RNA was detected. The cDNA was obtained by titanium one-step RT-PCR kit. The synthesized GAS5, NLRP3, caspase1, IL-1β, pro-caspase1, pro-IL-1β, GSDMD-N and miR-452-5p mRNA primers were used for RT-qPCR by SYBR Premix ExTaqTM kit (Invitrogen; Thermo Fisher Scientific, Inc.), and the GAPDH was used as an internal control.
Enzyme-Linked Immunosorbent Assay (ELISA)
Following transfection and HG induction for 48 hrs, the content of TNF-α, IL-6 and MCP-1 in the cell supernatant was detected by commercially available ELISA kits according to the manufacturer’s instructions.
Detection of ROS, MDA and SOD Activity
Following transfection and HG induction for 48 hrs, cells in the DMEM medium were centrifuged at 4000 g for 10 mins at room temperature to obtain the cell supernatant which was also used to measure the content of ROS, MDA and SOD, according to the manufacturer’s protocols of commercial assay kits.
Western Blot Analysis
The whole-cell protein extraction reagent was used to lyse the cells of each group at 4°C, and the supernatant was obtained after cells were centrifuged at 10,000 r/min for 5 mins. The protein concentration was measured by BCA kit. The protein was boiled for degeneration. 35 μg of protein samples was taken from each group and 10% SDS-PAGE gel was applied for electrophoresis. Then, protein was transferred to PVDF membrane by electricity. Subsequently, the PVDF membrane was soaked in 5% skimmed milk to be sealed at 25°C for 1 hr. The primary antibodies were then added to the membrane which was incubated at 4°C overnight. Next, the membrane was incubated against HRP-coupled secondary antibodies at 4°C for 1 hr. Blots were observed using enhanced chemiluminescence reagent (Thermo Fisher Scientifc, Inc.). The primary antibodies include anti-NLRP3, anti-caspase1, anti-IL-1β, anti-pro-caspase1, anti-pro-IL-1β, anti-GSDMD-N and anti-GAPDH.
Immunofluorescence
Cells were intervened by α-synuclein for 24 hrs and washed by PBS three times. After fixation with 4% paraformaldehyde, cells were washed with PBS twice and sealed with goat serum at 25°C for 30 mins. Then, cells were incubated against GSDMD-N in cassette overnight. The next day, cells were incubated against IgG (H+L) highly cross-adsorbed secondary antibody (Alexa Fluor) at 20–37°C for 1 hr in the cassette. Finally, DAPI was added to stain the nucleus, and the slides were sealed with the sealing liquid containing antifluorescence quenching reagent. The images were collected under the microscope.
Dual-Luciferase Reporter Assay
The starBase software (http://starbase.sysu.edu.cn) predicted that GAS5 may be combined with miR-452-5p, which was confirmed by dual-luciferase reporter assay. Briefly, HK-2 cells were co-transfected with WT-GAS5 and miR-NC or miR-452-5p mimic, MT-GAS5 and miR-NC or miR-452-5p mimic using Lipofectamine® 2000 reagent. The luciferase activity was decreased when the GAS5 combined with miR-452-5p.
Statistical Analysis
SPSS 22.0 was used for statistical treatment. All experimental data were expressed as mean ± standard deviation. One-way ANOVA was used for comparison between groups, and pairwise comparison between groups was conducted by Bonferroni t test. P < 0.05 indicated statistically significant difference.
Results
GAS5 Was Decreased in HK2 Cells Induced by HG
The expression of GAS5 in HG-induced HK2 cells was detected by RT-qPCR analysis. As shown in Figure 1, GAS5 expression was gradually decreased in HK2 cells when the induction time of HG was prolonged. However, GAS5 expression in HK2 cells treated with normal glucose was not obviously changed with time.
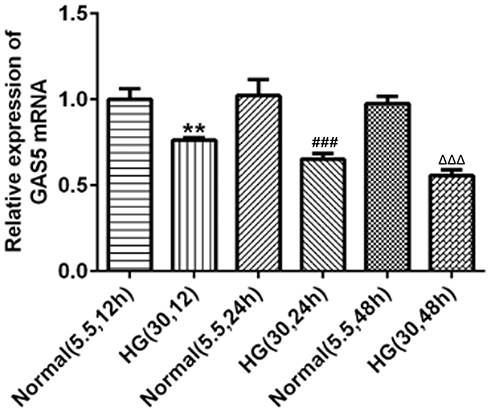 |
Figure 1 GAS5 was decreased in HK2 cells induced by HG. With the time of HG induction prolonged, GAS5 was gradually downregulated in HK2 cells. **P<0.01 vs normal (5.5, 12 hr) group. ###P<0.001 vs normal (5.5, 24 hr) group. ∆∆∆P<0.001 vs normal (5.5, 48 hr) group. |
GAS5 Overexpression Inhibited the Inflammation and Oxidative Stress in HG-Induced HK-2 Cells
The transfection effects of pcDNA-GAS5 were verified by RT-qPCR analysis. The GAS5 expression was upregulated in HK-2 cells transfected with pcDNA-GAS5 (Figure 2A). And, the levels of TNF-α, IL-6 and MCP-1 were increased in HK-2 cells after the treatment of HG, while GAS5 overexpression could effectively downregulate the levels of TNF-α, IL-6 and MCP-1 (Figure 2B). As shown in Figure 2C, the levels of ROS and MDA were increased and the level of SOD was decreased in HG-induced HK-2 cells, while GAS5 overexpression could reverse the levels of ROS, MDA and SOD in HG-induced HK-2 cells. The changes in ROS were also demonstrated by fluorescence images (Figure 2D). Therefore, GAS5 overexpression inhibited the inflammation and oxidative stress in HG-induced HK-2 cells.
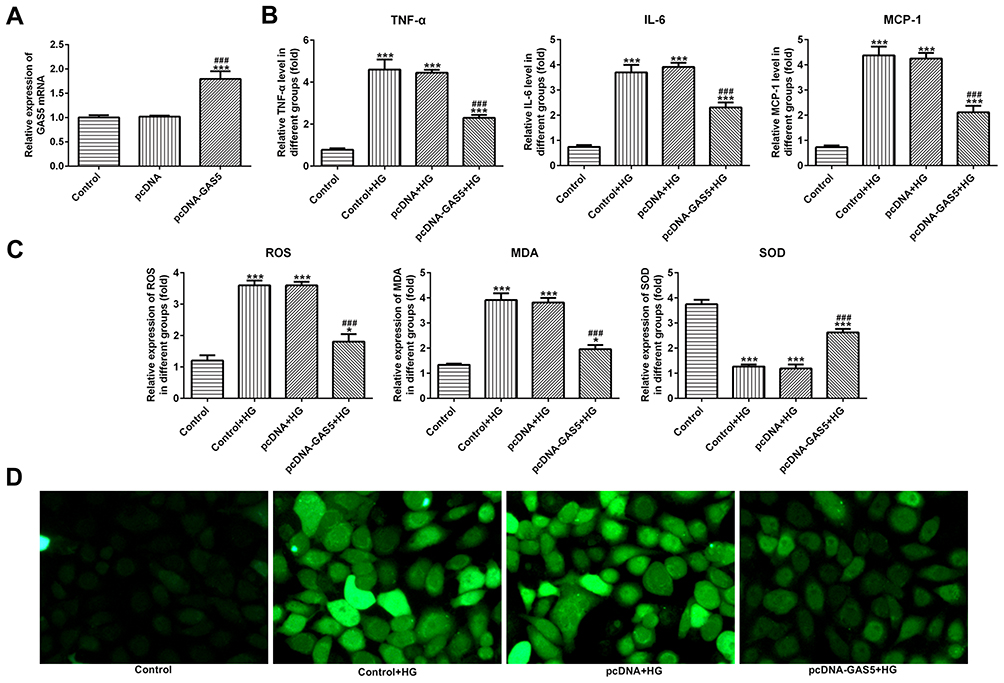 |
Figure 2 GAS5 overexpression inhibited the inflammation and oxidative stress in HG-induced HK-2 cells. (A) GAS5 expression was upregulated in HK-2 cells transfected with pcDNA-GAS5. ***P<0.001 vs control group. ###P<0.001 vs pcDNA group. (B) HG induction upregulated the levels of TNF-α, IL-6 and MCP-1 which decreased the GAS5 overexpression. ***P<0.001 vs control group. ###P<0.001 vs control+HG group. (C) HG induction upregulated the levels of ROS and MDA and downregulated the SOD level which reversed the GAS5 overexpression. *P<0.05 and ***P<0.001 vs control group. ###P<0.001 vs control+HG group. (D) The level of ROS was determined by the images of immunofluorescence. |
GAS5 Overexpression Reduced the Pyroptosis of HG-Induced HK-2 Cells
The expression of NLRP3, cleaved-caspase1, IL-1β and GSDMD-N was upregulated in HG-induced HK-2 cells, and GAS5 overexpression could downregulate the expression of NLRP3, cleaved-caspase1, IL-1β and GSDMD-N (Figure 3A and B). The variation trend of GSDMD-N in these four groups determined by the immunofluorescence method was the same as the results of RT-qPCR analysis and Western blot analysis (Figure 3C). Therefore, GAS5 overexpression reduced the pyroptosis of HG-induced HK-2 cells.
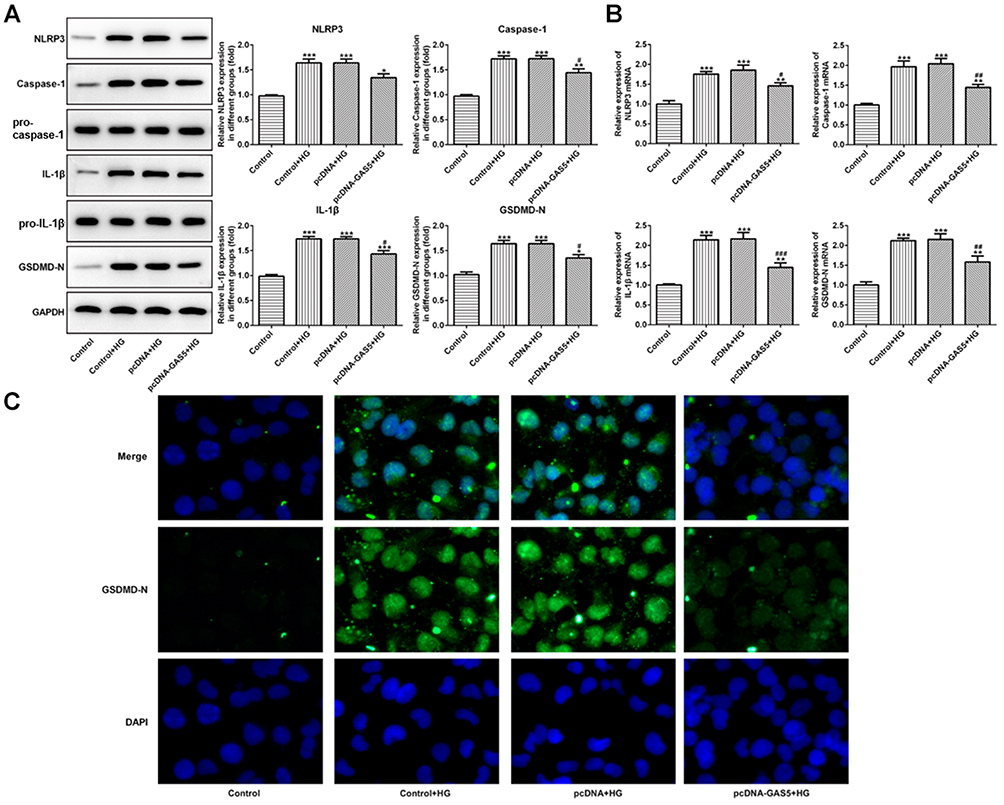 |
Figure 3 GAS5 overexpression reduced the pyroptosis of HG-induced HK-2 cells. (A) HG induction upregulated the protein expression of NLRP3, cleaved-caspase1, IL-1β and GSDMD-N which decreased the GAS5 overexpression. *P<0.05, **P<0.01 and ***P<0.001 vs control group. #P<0.05 vs control+HG group. (B) HG induction upregulated the mRNA expression of NLRP3, cleaved-caspase1, IL-1β and GSDMD-N which decreased theGAS5 overexpression. **P<0.01 and ***P<0.001 vs control group. #P<0.05, ##P<0.01 and ###P<0.001 vs control+HG group. (C) The expression of GSDMD-N was determined by the images of immunofluorescence. |
GAS5 Directly Targets miR-452-5p
StarBase software (http://starbase.sysu.edu.cn) predicted that GAS5 directly targeted miR-452-5p, which was verified by a dual-luciferase reporter system (Figure 4A). HK-2 cells were co-transfected with luciferase reporter plasmids containing the 3′-UTR of wild-type GAS5, or mutated GAS5 and miR-452-5p. As shown in Figure 4B, the co-transfection of miR-452-5p mimics and wild-type GAS5 weakened the luciferase activity of the wild-type GAS5 reporter. These results suggested that GAS5 might be a direct functional target of miR-452-5p in HK-2 cells. As shown in Figure 4C, miR-452-5p expression was upregulated in HK-2 cells treated with HG. After HG-induced HK-2 cells were transfected with pcDNA-GAS5, the expression of miR-452-5p was decreased in HG-induced HK-2 cells.
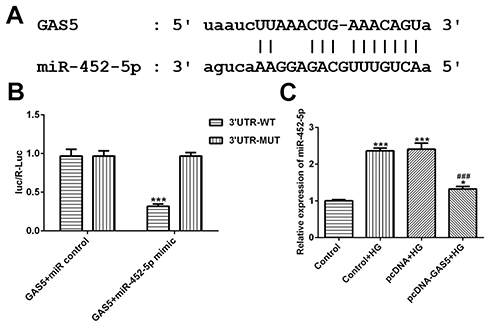 |
Figure 4 GAS5 directly targets miR-452-5p. (A) The putative target sequence for GAS5 on the 3ʹ-UTR of miR-452-5p. (B) Fluorescence activity was decreased when GAS5 combined with 3ʹ-UTR of miR-452-5p. ***P<0.001 vs E2F2+miR-NC group. (C) HG induction up-regulated the miR-452-5p expression and GAS5 overexpression decreased miR-452-5p expression in HG-induced HK-2 cells. *P<0.05 and ***P<0.001 vs control group. ###P<0.001 vs control+HG group. |
miR-452-5p Interference Suppressed the Inflammation and Oxidative Stress in HG-Induced HK-2 Cells
The results of RT-qPCR analysis indicated that the expression of GAS5 was downregulated in HK-2 cells transfected with shRNA-GAS5-1 and shRNA-GAS5-2. The GAS5 expression in HK-2 cells transfected with shRNA-GAS5-1 was lowest, so shRNA-GAS5-1 was selected for the next experiment (Figure 5A). As shown in Figure 5B, miRNA-452-5p expression was increased in HG-induced HK-2 cells, and miRNA-452-5p expression was downregulated in HG-induced HK-2 cells transfected with miRNA-452-5p inhibitor. As shown in Figure 5C, silencing of miRNA-452-5p decreased the levels of TNF-α, IL-6 and MCP-1 in HG-induced HK-2 cells and silencing of GAS5 could alleviate the effect of miRNA-452-5p on the levels of TNF-α, IL-6 and MCP-1. As shown in Figure 5D, the levels of ROS and MDA were decreased and the SOD level was increased when miRNA-452-5p expression was downregulated in HG-induced HK-2 cells. Similarly, GAS5 interference reversed the effects of miRNA-452-5p inhibitor on the levels of ROS, MDA and SOD. Therefore, miR-452-5p interference suppressed the inflammation and oxidative stress in HG-induced HK-2 cells, which could be reversed by the silencing of GAS5.
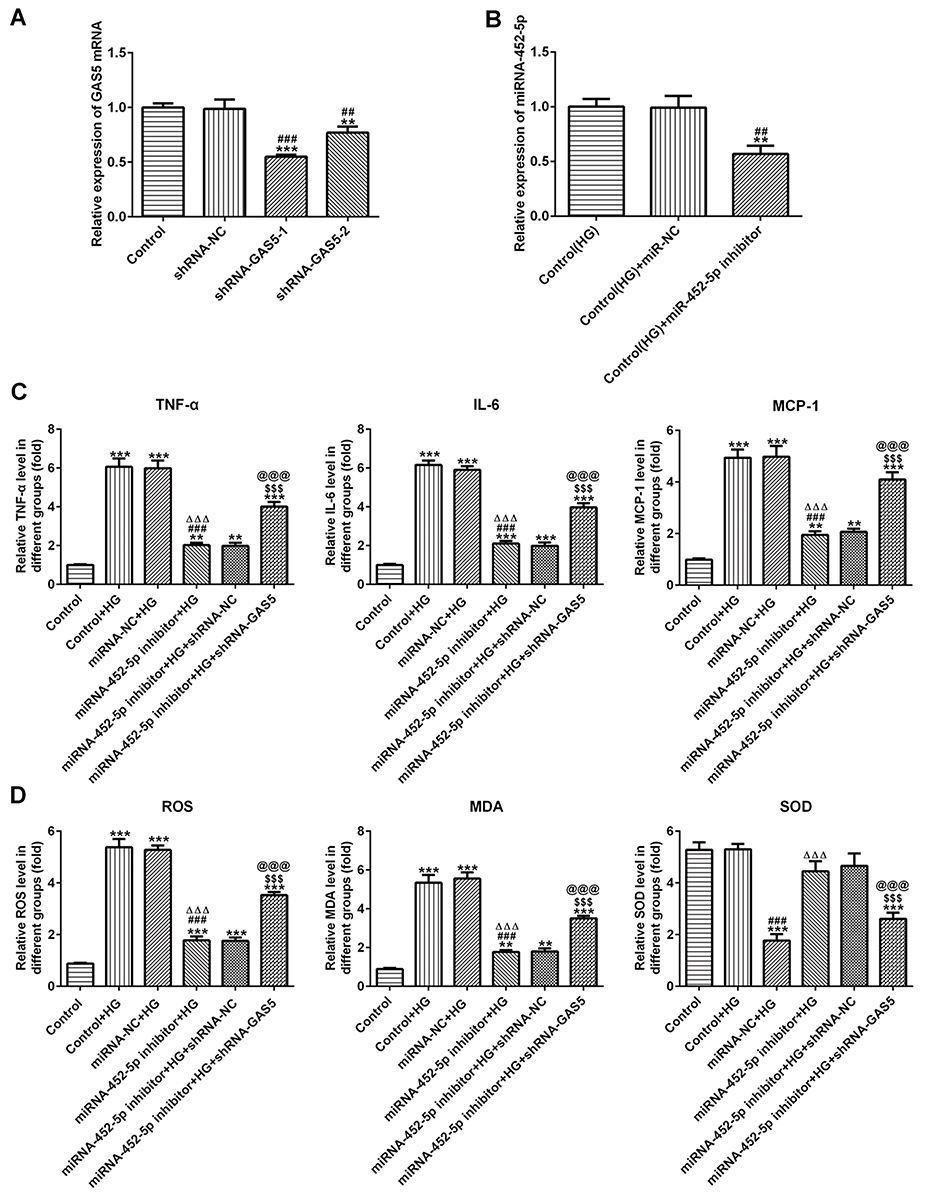 |
Figure 5 miR-452-5p interference suppressed the inflammation and oxidative stress in HG-induced HK-2 cells. (A) GAS5 expression was decreased when HK-2 cells transfected with shRNA-GAS5. **P<0.01 and ***P<0.001 vs control group. ##P<0.01 and ###P<0.001 vs shRNA-NC group. (B) miR-452-5p expression was decreased when HG-induced HK-2 cells transfected with miR-452-5p inhibitor. **P<0.01 vs control (HG) group. ##P<0.01 vs control (HG) + miR-NC group. (C) miR-452-5p interference suppressed the levels of TNF-α, IL-6 and MCP-1 in HG-induced HK-2 cells while reversed by GAS5 inhibition. **P<0.01 and ***P<0.001 vs control group. ###P<0.001 vs control+HG group. ∆∆∆P<0.001 vs miRNA-NC+HG group. $$$P<0.001 vs miR-452-5p inhibitor+HG group. @@@P<0.001 vs miR-452-5p inhibitor+HG+shRNA-NC group. (D) miR-452-5p interference downregulated the levels of ROS and MDA and upregulated the SOD level in HG-induced HK-2 cells, which was reversed by GAS5 inhibition. **P<0.01 and ***P<0.001 vs control group. ###P<0.001 vs control+HG group. ∆∆∆P<0.001 vs miRNA-NC+HG group. $$$P<0.001 vs miR-452-5p inhibitor+HG group. @@@P<0.001 vs miR-452-5p inhibitor+HG+shRNA-NC group. |
miR-452-5p Interference Suppressed the Pyroptosis of HG-Induced HK-2 Cells
After HG-induced HK-2 cells were transfected with miRNA-452-5p inhibitor, the original elevated expression of NLRP3, cleaved-caspase1, IL-1β and GSDMD-N in HG-induced HK-2 cells was downregulated. GAS5 interference effectively enhances the expression of NLRP3, cleaved-caspase1, IL-1β and GSDMD-N, but this is still lower than that in HK-2 cells treated by HG only (Figure 6A and B). The results of immunofluorescence showed a similar change trend of GSDMD-N as the above results (Figure 6C). Therefore, miR-452-5p interference suppressed the pyroptosis of HG-induced HK-2 cells, and GAS5 interference weakened the inhibition of the pyroptosis of HG-induced HK-2 cells.
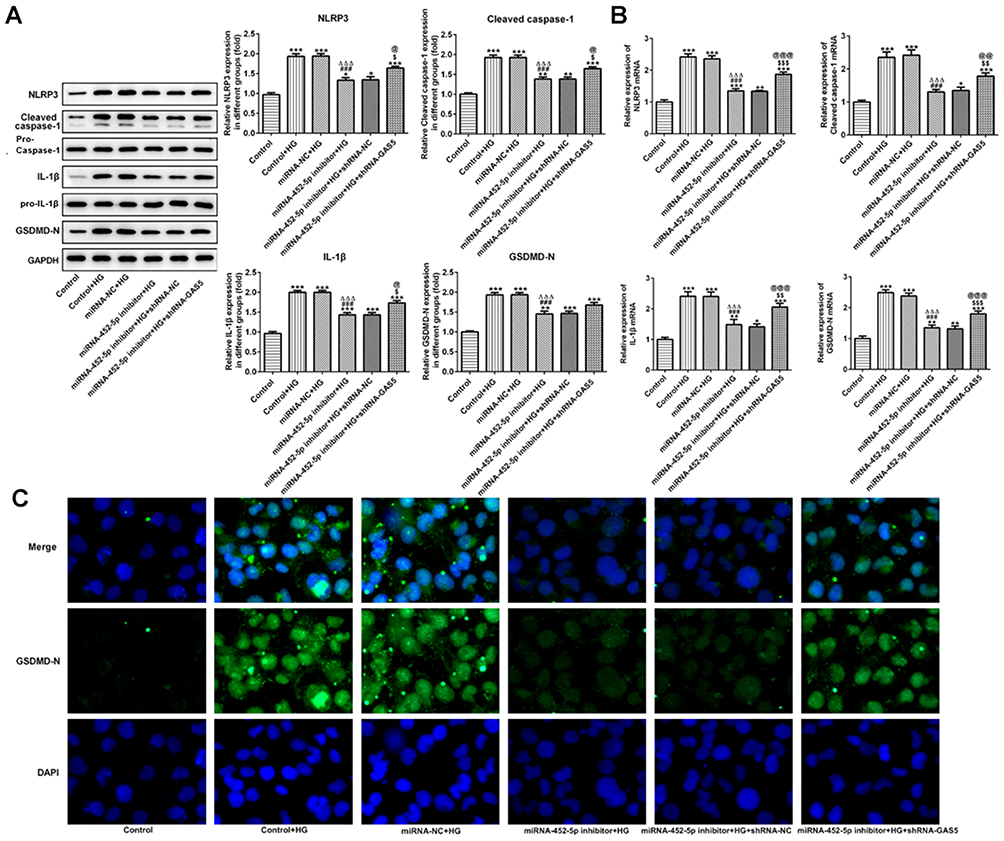 |
Figure 6 miR-452-5p interference suppressed the pyroptosis of HG-induced HK-2 cells. (A) miR-452-5p interference downregulated the protein expression of NLRP3, cleaved-caspase1, IL-1β and GSDMD-N in HG-induced HK-2 cells, which was reversed by GAS5 inhibition. *P<0.05, **P<0.01 and ***P<0.001 vs control group. ###P<0.001 vs control+HG group. ∆∆∆P<0.001 vs miRNA-NC+HG group. $P<0.05 vs miR-452-5p inhibitor+HG group. @P<0.05 vs miR-452-5p inhibitor+HG+shRNA-NC group. (B) miR-452-5p interference downregulated the mRNA expression of NLRP3, cleaved-caspase1, IL-1β and GSDMD-N in HG-induced HK-2 cells, which was reversed by GAS5 inhibition. *P<0.05, **P<0.01 and ***P<0.001 vs control group. ###P<0.001 vs control+HG group. ∆∆∆P<0.001 vs miRNA-NC+HG group. $$P<0.01 and $$$P<0.001 vs miR-452-5p inhibitor+HG group. @@P<0.01 and @@@P<0.001 vs miR-452-5p inhibitor+HG+shRNA-NC group. (C) The expression of GSDMD-N was determined by the images of immunofluorescence. |
Discussion
In the present study, we explored the role of GAS5 in the inflammation, oxidative stress and pyroptosis of HG-induced HK-2 cells by regulating the expression of miR-452-5p. The results of this experiment showed that GAS5 was downregulated and miR-452-5p was up-regulated obviously in the HG-induced HK-2 cells. miR-452-5p was demonstrated to be a potential target of GAS5. GAS5 overexpression inhibited the inflammation, oxidative stress and pyroptosis of HG-induced HK-2 cells by downregulating the expression of miR-452-5p.
It has also been reported that GAS5 can regulate the inflammation, oxidative stress and apoptosis in some diseases. For instance, Wang et al16 indicated that GAS5 interference weakened the apoptosis and inflammatory injury in the mouse model of middle cerebral artery occlusion (MCAO). Chen et al17 found that silencing of GAS5 promoted cell viability, cell cycle and oxidative stress in malignant melanoma (MM) cells. In addition, GAS5 interference increased inflammation and reduced pyroptosis, thereby promoting the proliferation of ovarian cancer cells and reducing apoptosis.13 Therefore, the expression of GAS5 was various in different diseases, and changing the expression of GAS5 could alleviate or deteriorate the progression of diseases. The present study indicated that GAS5 overexpression could alleviate the inflammation, oxidative stress and pyroptosis of HG-induced HK-2 cells.
We already know that miR-452-5p is related to gestational diabetes. Whether miR-452-5p can regulate the HG-induced HK-2 cells effectively still remains unknown. At present, miR-452-5p is studied in various cancers.18–20 Liu et al21 demonstrated that miR-452 was upregulated in tissues and cells of clear-cell renal-cell carcinoma (ccRCC) and miR-452 overexpression presented a poor prognosis of ccRCC. miR-452 promoted cell proliferation and invasion of ccRCC cells. Zhai et al22 found that miR-452-5p interference increased the migration and invasion of renal cell carcinoma (RCC) in vitro and in vivo. In this study, we found that miR-452-5p was increased in HG-induced HK-2 cells, and silencing of miR-452-5p could effectively suppress the inflammation, oxidative stress and pyroptosis of HG-induced HK-2 cells.
NLRP3 is a typical representative of NOD-like receptor protein family. NLRP3 can form a protein complex in the cytoplasm and sense a variety of cellular signaling mechanisms related to immunity and death and participate in cell function regulation.23 NLRP3 is the platform for activation of caspase1, and NLRP3 activation can crack the pro-caspase1 into enzyme-active caspase1, thereby promoting the maturation of the precursor of IL-1β and the secretion of active IL-1β. Activated IL-1β induces the expression of itself and other proinflammatory factors, such as IL-6, TNF-α and chemokines such as MCP-1, leading to a persistent inflammatory cascade to damage the tissues.24–26 In this study, the expression of NLRP3 was increased in HG-induced HK-2 cells, and the expression of IL-6, TNF-α, MCP-1, caspase1 and IL-1β was also increased. Pyroptosis is a proinflammatory and procedural cell death and closely related to the occurrence and development of various diseases and tissue injuries.27 Pyroptosis can be induced by activation of NLRP3 multiprotein complex inflammasome.28 GSDMD is a cytoplasmic protein encoded by the GSDMD gene of the gasdermin family and is widely expressed in different cells and tissues. GSDMD protein can independently mediate the release of inflammatory mediators such as IL-1β and the breakdown of cell membranes.29 The toxic N-terminal of GSDMD has lipid-binding capacity and anchors on the biofilm during pyrogenesis and forms protein pores through the oligomerization of monomers. In this study, GSDMD-N expression was increased in HG-induced HK-2 cells to promote pyrogenesis.
In conclusion, the data of the current study proved the decreased GAS5 expression and increased miR-452-5p expression in HG-induced HK-2 cells. GAS5 directly targets miR-452-5p and GAS5 overexpression downregulated the miR-452-5p expression in HG-induced HK-2 cells. Therefore, GAS5 overexpression inhibited the inflammation, oxidative stress and pyroptosis of HG-induced HK-2 cells by suppressing the expression of miR-452-5p, which provides a new sight for the treatment of DN.
Disclosure
The authors declare they have no competing interests.
References
1. Yu X, Limin W, Jiang H, et al. Prevalence and control of diabetes in Chinese adults. J Am Med Assoc. 2013;310(9):948–958. doi:10.1001/jama.2013.168118
2. Long J, Badal SS, Ye Z, et al. Long noncoding RNA Tug1 regulates mitochondrial bioenergetics in diabetic nephropathy. J Clin Invest. 2016;126(11):4205–4218. doi:10.1172/JCI87927
3. Madhusudhan T, Wang H, Dong W, et al. Defective podocyte insulin signalling through p85-XBP1 promotes ATF6-dependent maladaptive ER-stress response in diabetic nephropathy. Nat Commun. 2015;6:6496. doi:10.1038/ncomms7496
4. Zhang L, Long J, Jiang W, et al. Trends in chronic kidney disease in China. N Engl J Med. 2016;375(9):905–906. doi:10.1056/NEJMc1602469
5. Zhang S, Wang WD, Ma J, Sheng L, Zhang DM, Chen XG. Coumarin glycosides from Hydrangea paniculata slow down the progression of diabetic nephropathy by targeting Nrf2 anti-oxidation and smad2/3-mediated profibrosis. Phytomedicine. 2019;57:385–395. doi:10.1016/j.phymed.2018.12.045
6. Zhang S, Yang JZ, Li HY, et al. Skimmin, a coumarin, suppresses the streptozotocin-induced diabetic nephropathy in wistar rats. Eur J Pharmacol. 2012;692(1–3):78–83. doi:10.1016/j.ejphar.2012.05.017
7. Aboudehen K, Farahani S, Kanchwala M, et al. Long noncoding RNA Hoxb3os is dysregulated in autosomal dominant polycystic kidney disease and regulates mTOR signaling. J Biol Chem. 2018;293(24):
8. Zhang XX, Shang J, Wang XY, et al. Microarray analysis reveals long non-coding RNA SOX2OT as a novel candidate regulator in diabetic nephropathy. Mol Med Rep. 2018;18(6):5058–5068. doi:10.3892/mmr.2018.9534
9. Shang J, Wang S, Jiang YM, et al. Identification of key lncRNAs contributing to diabetic nephropathy by gene co-expression network analysis. Sci Rep. 2019;9. doi:10.1038/s41598-019-39298-9
10. Gao JJ, Wang WS, Wang FL, Guo CH. LncRNA-NR_033515 promotes proliferation, fibrogenesis and epithelial-to-mesenchymal transition by targeting miR-743b-5p in diabetic nephropathy. Biomed Pharmacother. 2018;106:543–552. doi:10.1016/j.biopha.2018.06.104
11. Zha FF, Qu XL, Tang B, et al. Long non-coding RNA MEG3 promotes fibrosis and inflammatory response in diabetic nephropathy via miR-181a/Egr-1/TLR4 axis. Aging-US. 2019;11(11):3716–3730. doi:10.18632/aging.v11i11
12. Ma J, Zhao N, Du LK, Wang Y. Downregulation of lncRNA NEAT1 inhibits mouse mesangial cell proliferation, fibrosis, and inflammation but promotes apoptosis in diabetic nephropathy. Int J Clin Exp Pathol. 2019;12(4):1174–1183.
13. Li J, Yang C, Li Y, Chen A, Li L, You Z. LncRNA GAS5 suppresses ovarian cancer by inducing inflammasome formation. Biosci Rep. 2017;38(2):BSR20171150. doi:10.1042/BSR20171150
14. Carter G, Miladinovic B, Patel AA. Circulating long noncoding RNA GAS5 levels are correlated to prevalence of type 2 diabetes mellitus. BBA Clin. 2015;4:102–107. doi:10.1016/j.bbacli.2015.09.001
15. Tryggestad JB, Vishwanath A, Jiang S, et al. Influence of gestational diabetes mellitus on human umbilical vein endothelial cell miRNA. Clin Sci. 2016;130(21):1955. doi:10.1042/CS20160305
16. Wang LJ, Niu YL, He GR, Wang JP. Down-regulation of lncRNA GAS5 attenuates neuronal cell injury through regulating miR-9/FOXO3 axis in cerebral ischemic stroke. RSC Adv. 2019;9(28):16158–16166. doi:10.1039/C9RA01544B
17. Chen L, Yang HX, Yi ZH, et al. LncRNA GAS5 regulates redox balance and dysregulates the cell cycle and apoptosis in malignant melanoma cells. J Cancer Res Clin Oncol. 2019;145(3):637–652. doi:10.1007/s00432-018-2820-4
18. Gao L, Gan XN, Ye ZH, Liang L, Chen G, Qin XG. MiR-452-5p may serve as an oncogene in colorectal cancer through targeting CDKN1B: a study based on bioinformatics analysis and dual-luciferase reporter assay. Int J Clin Exp Med. 2019;12(3):2151–2166.
19. Li TT, Jian XY, He H, et al. MiR-452 promotes an aggressive colorectal cancer phenotype by regulating a Wnt/beta-catenin positive feedback loop. J Exp Clin Cancer Res. 2018;37. doi:10.1186/s13046-018-0879-z
20. Dong X, Yang ZL, Zhang J. Decreased miR-452 expression in human cervical cancer and its prognostic significance. Eur J Gynaecol Oncol. 2018;39(1):27–31.
21. Liu F, Guo LH, Xin GD, Wang ZX. miR-452 promotes cell metastasis and the epithelial to mesenchymal by targeting SOX7 in clear-cell renal-cell carcinoma. J Cell Biochem. 2019;120(5):8401–8408. doi:10.1002/jcb.v120.5
22. Zhai W, Li SY, Zhang J, et al. Sunitinib-suppressed miR-452-5p facilitates renal cancer cell invasion and metastasis through modulating SMAD4/SMAD7 signals. Mol Cancer. 2018;17. doi:10.1186/s12943-018-0906-x
23. Sutterwala FS, Ogura Y, Zamboni DS, Roy CR, Flavell RA. NALP3: a key player in caspase-1 activation. J Endotoxin Res. 2006;12(4):251–256. doi:10.1177/09680519060120040701
24. Lee J, Giordano S, Zhang J. Autophagy, mitochondria and oxidative stress: cross-talk and redox signalling. Biochem J. 2012;441:523–540. doi:10.1042/BJ20111451
25. Harris J, Hartman M, Roche C, et al. Autophagy controls IL-1beta secretion by targeting pro-IL-1beta for degradation. J Biol Chem. 2011;286(11):9587–9597. doi:10.1074/jbc.M110.202911
26. Rongbin Z, Yazdi AS, Philippe M, Jürg T. A role for mitochondria in NLRP3 inflammasome activation. Nature. 2011;469(7329):221. doi:10.1038/nature09663
27. Gilad D, Galloway NLK, Xin G, et al. Cell death by pyroptosis drives CD4 T-cell depletion in HIV-1 infection. Nature. 2014;505(7484):509. doi:10.1038/nature12940
28. Bergsbaken T, Fink S, Cookson B. Pyroptosis: host cell death and inflammation. Nat Rev Microbiol. 2009;7(2):99–109. doi:10.1038/nrmicro2070
29. He W-T, Wan H, Hu L, et al. Gasdermin D is an executor of pyroptosis and required for interleukin-1β secretion. Cell Res. 2015;25(12):1285–1298. doi:10.1038/cr.2015.139
 © 2019 The Author(s). This work is published and licensed by Dove Medical Press Limited. The full terms of this license are available at https://www.dovepress.com/terms.php and incorporate the Creative Commons Attribution - Non Commercial (unported, v3.0) License.
By accessing the work you hereby accept the Terms. Non-commercial uses of the work are permitted without any further permission from Dove Medical Press Limited, provided the work is properly attributed. For permission for commercial use of this work, please see paragraphs 4.2 and 5 of our Terms.
© 2019 The Author(s). This work is published and licensed by Dove Medical Press Limited. The full terms of this license are available at https://www.dovepress.com/terms.php and incorporate the Creative Commons Attribution - Non Commercial (unported, v3.0) License.
By accessing the work you hereby accept the Terms. Non-commercial uses of the work are permitted without any further permission from Dove Medical Press Limited, provided the work is properly attributed. For permission for commercial use of this work, please see paragraphs 4.2 and 5 of our Terms.