")
Back to Journals » Cancer Management and Research » Volume 11
lncRNA CADM1-AS1 inhibits cell-cycle progression and invasion via PTEN/AKT/GSK-3β axis in hepatocellular carcinoma
Authors Wang F, Qi X, Li Z, Jin S, Xie Y, Zhong H
Received 10 December 2018
Accepted for publication 24 March 2019
Published 30 April 2019 Volume 2019:11 Pages 3813—3828
DOI https://doi.org/10.2147/CMAR.S197673
Checked for plagiarism Yes
Review by Single anonymous peer review
Peer reviewer comments 3
Editor who approved publication: Dr Ahmet Emre Eşkazan
Fan Wang,1 Xun Qi,1,2 Zixuan Li,1,2 Shiqi Jin,1 Yang Xie,1 Hongshan Zhong1,2
1Department of Radiology, First Hospital of China Medical University, Shenyang 110001, Liaoning, People’s Republic of China; 2First Hospital of China Medical University, Key Laboratory of Imaging Diagnosis and Interventional Radiology of Liaoning Province, Shenyang, Liaoning, 110001, People’s Republic of China
Purpose: CADM1-AS1 (cell adhesion molecule 1 antisense RNA 1, long non-coding RNA), was firstly characterized in renal clear cell carcinoma, and exhibits a tumor suppressor role. However, its clinical relevance and exact effects in hepatocellular carcinoma (HCC) remain unknown. Therefore, in this study, we aimed to assess the clinical significance and function of CADM1-AS1 in HCC.
Methods: We detected CADM1-AS1 expression in liver cancer tissue samples and cell lines, and analyzed the association between CADM1-AS1 expression and clinical parameters in 90 liver cancer patients. Moreover, we conducted gain-of-function and loss-of-function studies in liver cancer cell to explore the biological function and molecular mechanism of CADM1-AS1.
Results: CADM1-AS1 expression was reduced in HCC. Clinical data showed that this downregulation was associated with advanced tumor stage, high TNM stage and reduced survival in HCC patients. CADM1-AS1 overexpression inhibited HCC cells proliferation, migration and invasion, while inducing G0/G1 phase arrest. Meanwhile, we revealed that CADM1-AS1 inhibited the phosphorylation of AKT and GSK-3β. Furthermore, our study showed that CADM1-AS1 decreased the cell cycle associated proteins expression of cyclinD, cyclinE, CDK2 CDK4, CDK6, and enhanced the levels of p15, p21 and p27. More importantly, SC79, a specific activator for AKT;, apparently attenuated the effects of CADM1-AS1 on above cell-cycle associated proteins, confirming that CADM1-AS1 inhibited cell cycles through the AKT signaling pathway. And we also found the CADM1-AS1 has antitumor effect in vivo by a xenograft HCC mouse model. In conclusion, the present findings show that the CADM1-AS1 inhibits proliferation of HCC by inhibiting AKT/GSK-3β signaling pathway, then upregulate p15, p21, p27 expression and downregulate cyclin, CDK expression to inhibit the G0/G1 to S phase transition both in vitro and in vivo.
Conclusion: CADM1-AS1 functions as a tumor-suppressive lncRNA. This study reveals a molecular pathway involving PTEN/AKT/GSK-3β which regulates HCC cell-cycle progression.
Keywords: long non-coding RNA, CADM1-AS1, proliferation, cell cycle, AKT/GSK-3β, hepatocellular carcinoma
Introduction
As one of the most common cancers in the world, hepatocellular carcinoma (HCC) has characteristics of high morbidity and mortality.1–3 It is primarily induced by long-term liver injury caused by viral hepatitis, autoimmune hepatitis, toxin exposure, excessive alcohol consumption and inherited metabolic diseases.4 Currently, potentially curative treatments for HCC include liver resection and transplantation, but the 5-year postoperative survival rate remains low.5,6 Poor prognosis in HCC is largely due to occult metastasis and easy recurrence after operation.7 Liver injury caused by these risk factors could produce progressive inflammation, which led to a vicious cycle of necrosis, regeneration, and chromosome instability.8 Therefore, it is imperative to explore the specific mechanisms underlying HCC pathogenesis, which could help identify new biomarkers and develop novel therapeutic strategies for HCC.
It is estimated up to 70% of the genome is transcribed into RNA but not translated into proteins, and only up to 2% of human genome codes for a protein.9 lncRNAs, a class of ncRNAs with more than 200 nucleotides in length and limited protein-coding potential, affect various cellular functions and are associated with a variety of biological processes and diseases.10 Increasing evidence links dysregulation of lncRNAs to diverse malignancies, such as lung, gastric and breast cancers.11–13 Moreover, multiple lncRNAs have been reported as oncogenic drivers or tumor suppressors in HCC via modulation of cell proliferation, apoptosis, autophagy, invasion, metastasis and cell-cycle progression through various pathways.14,15 Assessing cell-cycle regulators constitutes one of the most important approaches to understanding the molecular mechanisms involved in HCC and to identifying diagnostic markers for the early detection and targeted treatment of HCC.
Previous studies have confirmed that reduced expression of CADM1-AS1 (RNA176206|ENST00000546273) is associated with poor prognosis in patients with clear cell renal cell carcinoma.16 CADM1 encodes a cellular adhesion molecule and act as a tumor suppressor, and it is down-regulated in many solid tumors.17 However, the expression of CADM1-AS1 in HCC is unknown, and no detailed mechanism has been reported to date.
In this work, we assessed the clinical significance of CADM1-AS1 in HCC patients. Then by using gain- and loss-of-function analyses in HCC cells, we demonstrated that CADM1-AS1 inhibited proliferation and invasion in HCC cells. Further mechanistic analysis show that the PTEN/AKT/GSK-3β axis was involved in this study. We also investigated the antitumor effect of CADM1-AS1 in vivo by a xenograft HCC mouse model.
Materials and methods
Cell lines and culture
Human HCC HepG2, BEL-7702 and Huh-7 cell lines as well as the normal liver LO2 cell line were purchased from the Chinese Academy of Sciences (Shanghai, China). Cells were cultured in Dulbecco’s modified eagle’s medium (DMEM, Gibco) supplemented with 10% fetal bovine serum (FBS, Gibco), antibiotics (100 µg/mL streptomycin and 100 U/mL penicillin, Gibco) and cultured in an incubator at 37 °C with 5% CO2 and saturated humidity. The medium was changed every 1–2 days, after cells reached confluency, cells were detached with 0.25% trypsin (Gibco) and subcultured.
Tissue microarray
A set of primary HCC tissue microarrays (TMA) (HLivH180Su14), containing 90 pairs of HCC specimens and corresponding adjacent non-cancerous tissues, was purchased from Shanghai Outdo Biotech Co. Ltd. (Shanghai, China) and detailed pathologic information with survival prognosis of patients were examined by in situ hybridization staining. None of the patients received pre-operative chemotherapy or radiotherapy. Clinical characteristics, including age, gender, T stage, histological grade and TNM stage, are described in Table 1. This research was approved by the Research Ethics Committee of China Medical University and the 1964 Helsinki declaration and later amendments.
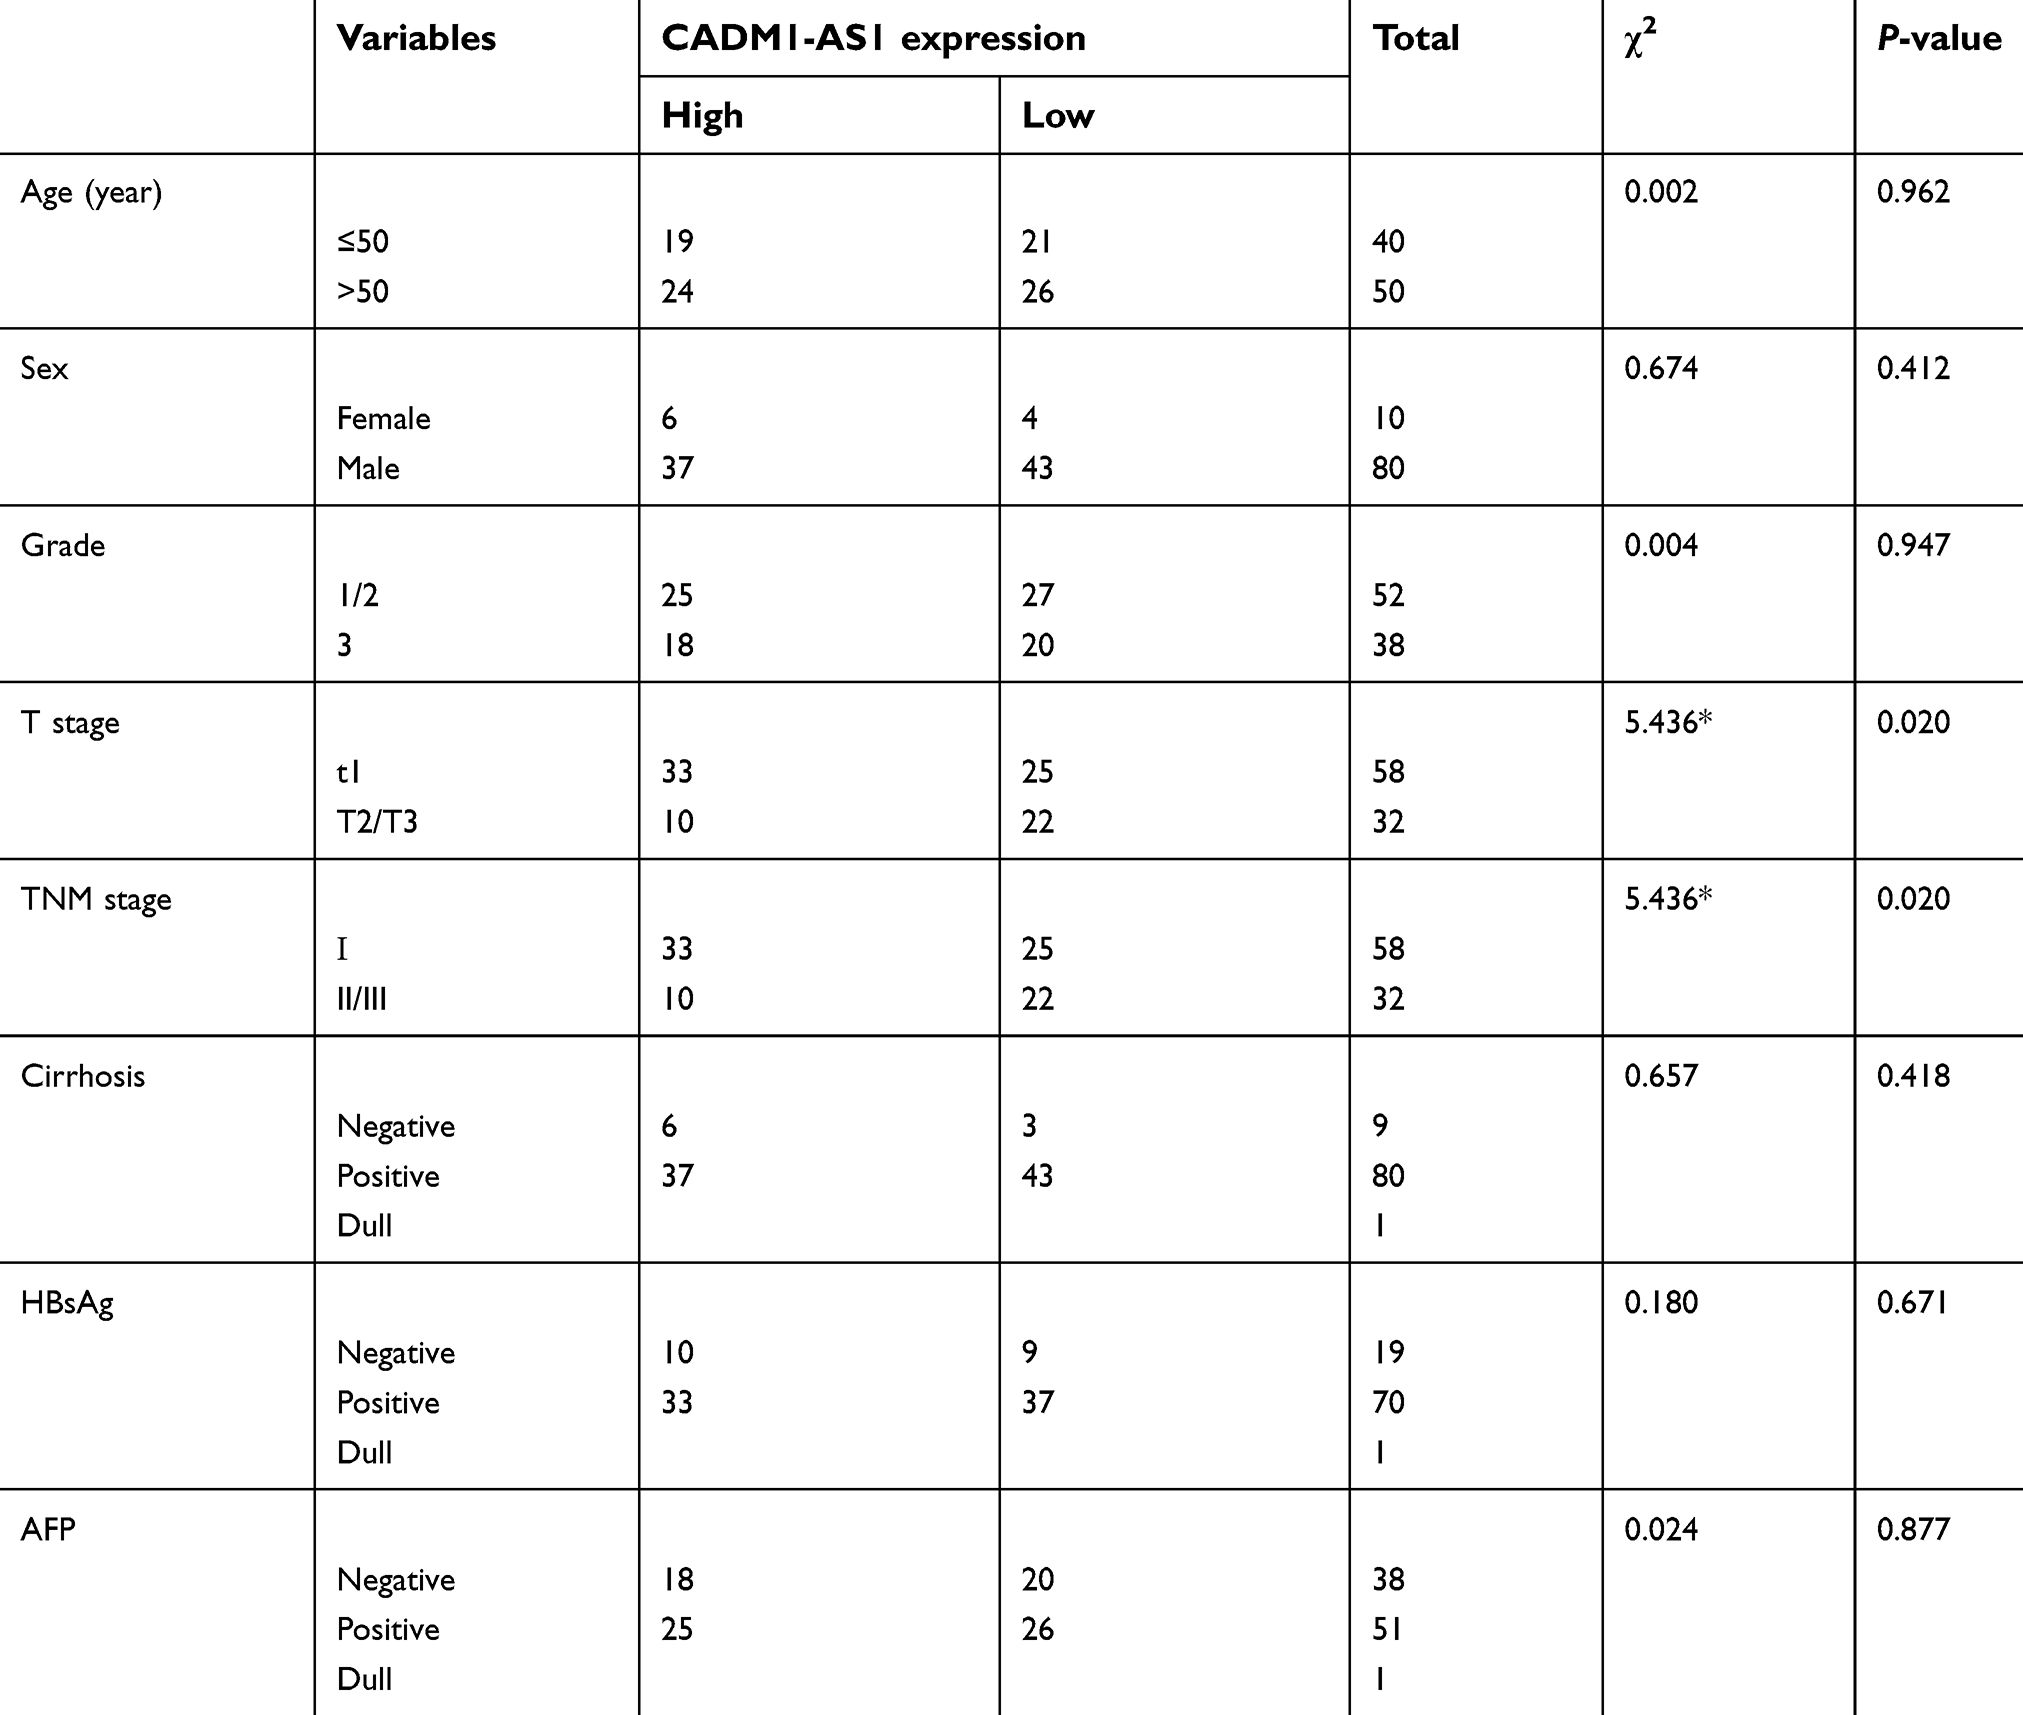 | Table 1 Associations of clinicopathological characteristics with CADM1-AS1 expression in hepatocellular carcinoma |
In situ hybridization
To assess the expression pattern of CADM1-AS1 in HCC, in situ hybridization was performed with double Digoxigenin-labeled probes (Exiqon, Vedbaek, Denmark) according to the manufacturer’s instruction. Briefly, HCC tissue samples were sectioned at 5 μm and deparaffinized, then treated with proteinase-K (5 μg/ml) for 2 min at 37 °C. Slides were prehybridizated with the 1 × ISH buffer (Exiqon) and the samples were hybridized with digoxigenin-labeled probes at 50 °C for 1 h. Next, the slides were incubated with anti-digoxigenin antibody (Roche Diagnostics, IN) at 4 °C overnight. The probe sequence for CADM1-AS1 was 5ʹ-TCAGCCATAGTGCATAGCTACT-3′. Staining intensity was scored as 0 (negative), 1 (weak), 2 (medium) and 3 (strong). The staining extent was scored as 0 (10%), 1 (11–25%), 2 (26–50%), 3 (51–75%) and 4 (76–100%). These two subscores were then multiplied to obtain a final staining index. Low CADM1-AS1 expression was defined as a staining index of ≤3, whereas high CADM1-AS1 was >3 as described in our previous study.
Transfection of siRNA
Two small interfering RNAs (siRNA1 and siRNA2) for CADM1-AS1 silencing and a non-targeting (NT) siRNA were obtained from GenePharma (Shanghai, China). The sequences were as follows: siRNA1, Sense 5ʹ-rGrUrArCrCrUrCrCrUrGrCrCrUrUrUrGrUrCrArArGrCrCAA-3ʹand antisense 5ʹ-rUrUrGrGrCrUrUrGrArCrArArArGrGrCrArGrGrArGrGrUrArCrArA-3ʹ; siRNA2, sense 5ʹ-rGrArCrCrUrArUrCrGrArGrArArCrUrGrArGrArGrCrGrACA-3ʹ and antisense 5ʹ-rUrGrUrCrGrCrUrCrUrCrArGrUrUrCrUrCrGArUrArGrGrUrCrArG-3ʹ. The cells (2×10⁵/ml) seeded in 6-well plates overnight were mixed gently with 5 μg siRNA and 10 μl of Lipofectamine 3000 (Invitrogen, USA) in 250 μl opti-MEM (Gibco) and incubated at 37 °C for 24 h. Then, the medium was replaced with fresh complete medium, and the cells were incubated for a further 24 h.
Overexpression of CADM1-AS1 in HepG2 cells
CADM1-AS1 overexpression lentiviral vector (LV-CADM1-AS1) and an empty control lentiviral vector (LV-control) were purchased from GeneChem (Shanghai, China). A total of 108 titer lentiviruses were obtained. Next, HepG2 and BEL-7402 cells were incubated with lentivirus concentrations equivalent to the target cell infection index (HepG2/BEL-7402, MOI=50) for 12 h. Then, the medium was replaced with fresh complete medium, and the cells were incubated for a further 48 h. The cells were subsequently analyzed under an inverted fluorescence microscope (Nikon ECLIPSE, Shanghai, China), and the transfection efficiency was expressed as percentage of GFP-positive cells detected on a GFP fluorescence module.
Real time quantitative PCR
Total RNA was extracted from tumor tissues or cultured cells with TRIzol reagent (Thermo Fisher Scientific, Inc.) and reverse transcribed into cDNA with a PrimeScript RT Master Mix Perfect Real Time kit (Takara, Dalian, China). Subsequently, qRT-PCR was performed with the SYBR Premix Ex Taq kit (Takara, Dalian, China). GAPDH was used for normalization. The relative levels of each gene were derived by the 2−∆∆Ct method. Primers were: CADM1-AS1, Forward 5′-TGACAAAGGCAGGAGGTA-3′ and reverse 5′-GCACTATGGCTGAGGAAA-3′; CADM1, Forward 5′-ATGGCGAGTGTAGTGCTGC-3′ and reverse 5′-GATCACTGTCACGTCTTTCGT-3′; GAPDH, forward 5′-GAAGGTGAAGGTCGGAGT-3′ and reverse 5′-GAAGATGGTGAGGGATTTC-3′.
Cell counting Kit-8 (CCK-8) assay
HCC cells in logarithmic growth phase were inoculated into a 96-well plate at 4000 cells/well. Five replicates were set for each group. After transfection for 48 h, in every well, 90 µl of medium with 10% FBS and 10 µl of CCK-8 (Solarbio, Shanghai, China) were added simultaneously. The plate was placed in an incubator with 5% CO2 at 37 °C for 2 h, and absorbance was obtained on a microplate reader (Thermo-Fisher Scientific) at 450 nm. Absorbance values were also detected after 24, 48 and 72 h of culture, respectively.
EdU proliferation assay
According to the Click-iT®EdU Imaging Kits (Keygen, Jiangsu, China). After transfection for 48 h, the 5‐Ethynyl‐2′‐deoxy-uridine (EdU) medium was added to 24-well plates at 37 °C. After washing twice with PBS, the cells were fixed by glycine and penetrant (0.5% Triton X-100 PBS). Then, Apollo dyeing reaction solution was added in cells to stain for 30 min without light. Penetrant was added to cells. Hoechst 33342 solution was added to stain cells. Cells and Hoechst 33342 solution were co-incubated for 30 min, then photographed with a fluorescence microscopy. The percentage of EdU-positive cells was defined as the proliferation rate.
Colony-formation assay
For colony formation, logarithmic growth phase transfected HCC cells were collected and trypsinized into single cells. In six-well plates, 1000 cells were inoculated per well. After two weeks incubation at 37 °C in 5% CO2, cell clones that had formed from individual cells were directly observed by eye, then culture medium was removed and the remaining cells were washed three times with PBS. The cells were fixed with 4% paraformaldehyde for 30 min and stained with 0.1% crystal violet (Meilunbio, Dalian, China) for 20 min at room temperature. Following staining, dishes were placed on a transparent grid and the number of clone cells was counted using a inverted microscope (Nikon ECLIPSE, Shanghai, China).
Wound healing assay
Scratch test was performed to evaluate the viability of cell migration. Briefly, Each well of a six-well plate was seeded with 2×10⁵ cells. After transfection, the cells were cultured for 48 h. After obtaining the cells with a merger rate of 90%. The resulting cell monolayers were scratched with a 200 µl pipette tip, followed by three washes with PBS to remove exfoliated cells, then replacing culture medium with fresh serum‐free DMEM, and last putting all cells into an incubator containing 5% CO2 to culture at 37 °C. Wounds were observed at 0 h and 48 h, respectively, A light microscope was taken advantage to measure cell migration viability and obtain the images at 100× magnification. The Image J software was used to measure the scratch areas, and percentages of scratch closure were derived.
Transwell assays
Transwell plates containing 8.0-μm pore membranes (Corning Costar Corp, NY, USA) were used to assess the migratory and invasive abilities of treated cells. Briefly, A total 2×10⁵ cells in suspension were plated in the upper chambers of transwell plates in 200 µl serum-free DMEM medium, and 600 µl DMEM medium with 10% FBS (FBS, Gibco) was added to the lower chamber. After 12 h of incubation at 37 °C with 5% CO2, the non-through cells were removed from the upper surface of the membrane with a cotton-tipped swab, and the through cells were fixed with 4% paraformaldehyde (PFA), then stained with 1% crystal violet for 20 min. In cell invasion assay, transwell membranes were pre-coated with Matrigel (BD Biosciences, CA, USA) and diluted with 10% BSA in a ratio of 1:6. A total 50 µl solution was added to each well of the upper chamber. Each cell group was allocated a total of 3 chambers, placed in a 24-well plate and incubated at 37 °C with 5% CO2 for 4 h before cell seeding to solidify the gel; the remaining procedure was performed as indicated above. Cells on the lower surface of the membrane were imaged and counted at 100× magnification under a microscope (Nikon ECLIPSE, Shanghai, China), 5 fields of the stained cells per sample were counted .
Cell cycle assay
The BD PI/RNase Staining Buffer kit (BD Biosciences) was used for the experiment. After transfection, cells were serum-starved to synchronize the cell cycle. Cells were then collected, washed in phosphate-buffered saline (PBS) and fixed in 70% ice-cold ethanol overnight at 4 °C. After fixing, cells were rehydrated with pre-cooled PBS, they were stained with propidium iodide (PI)/RNase buffer for assay with standard procedures according to the DNA Staining Protocol for Flow Cytometry. The cell‐cycle phase distribution was determined with a FACScan (BD Biosciences) instrument and analysed with the flowjo software. The percentage of cells in G0/G1, S, and G2/M phase were counted and compared.
Western blotting
After transfection, total protein from tumor tissues or cells were lysed by RIPA buffer (Keygen, Jiangsu, China). The lysates were boiled at 100 °C for 5 min. About 50 µg of total protein were loaded into 10% SDS-PAGE gel and protein bands were transferred onto nitrocellulose membranes (Bio-Rad Laboratories Inc.). The membranes were blocked with 5% non-fat milk in 1 × TBST for 2 h at room temperature, and sequentially incubated with primary antibodies at 4 °C overnight. Then, the membrane was washed with 1 × TBST for 3 times, and incubated with secondary antibodies at 37 ºC for 2 h. Finally, visualization was performed with ECL reagents (Bio-Rad Laboratories Inc.), followed by detection on a Bio-Rad Gel imaging system. Data were semi-quantified with the Image lab software. Primary antibodies targeting p15 (1:1000, #ab53034), p21 (1:1000, #ab109520), p27 (1:1000, #ab32034), PTEN (1:5000, #ab170941), p-AKT (1:4000, S473, #ab81283), p-AKT (1:500, T308, #ab38449), GSK-3β (1:2500, #ab32391), p-GSK-3β (1:5000, S9, #ab75814) were obtained from Abcam (Cambridge, MA, UK). Primary antibodies against CDK2 (1:1000, #2546), CDK4 (1:1000, #12790), CDK6 (1:1000, #3136), cyclinE (1:1000, #4129), cyclinD (1:1000, #2978) and AKT (1:1000, #4691 s) were purchased from Cell Signaling Technology (Danvers, MA, USA). The specific AKT inhibitor SC79 (Abcam, #ab146428). GAPDH (1:5000, #10494-1-AP, proteintech) antibody was used as the reference control.
In vivo tumorigenicity
All animal procedures were performed in accordance with the Guide for the Care and Use of Laboratory Animals (NIH publications Nos. 80-23, revised 1996) and the Institutional Ethical Guidelines for Animal Experiments developed by China Medical University. Mice were housed in laminar airflow cabinets under pathogen-free conditions. Two groups of 5 male nude mice (4–5 weeks old; 15–23 g) were subcutaneously injected with HepG2 cells (5×10⁶ in 200 µl) stably transfected with LV-CADM1-AS1 or LV-NC. Tumor volumes were measured every 7 days. Five weeks after implantation, all mice were sacrificed under anesthesia, and tumor weights and volumes were determined. Tumor volumes were calculated as V =1/2 (width2 × length). Tumor tissues were harvested and assessed by immunocytochemistry and Western blotting.
Immunohistochemical studies
Tissue samples were embedded in paraffin and cut into 5 µm sections, which were deparaffinized in xylene, rehydrated through graded ethanol, quenched for endogenous peroxidase activity in 3% hydrogen peroxide, and processed for antigen retrieval by microwave heating for 7 min in 10 mM citrate buffer (pH 6.0) The sections were then sequentially incubated with primary antibodies against CDK2, CDK4, CDK6, cyclinD, cyclinE, p15, p21 and p27 overnight at 4–8 °C respectively, and appropriate secondary antibodies for 1 h. Finally, the sections were stained with 3,3-diaminobenzidine tetrahydrochloride, and imaged under a microscope. Data were analyzed with the ImageJ software.
Statistical analysis
Data were shown as mean and standard deviation (SD), analyzed using GraphPad Prism 6.0 Software (GraphPad Inc., San Diego, CA, USA). Each triplicate experiment was repeated at least three times. Student’s t-test was used to compare group pairs, whereas one-way analysis of variance (ANOVA) was used for multiple groups, followed by least significant difference post hoc test. Overall survival curves were protracted using the Kaplan-Meier method and estimated by the log-rank test. P<0.05 was considered to indicate a statistically significant difference.
Results
CADM1-AS1 is downregulated in HCC
In situ hybridization (ISH) was applied to evaluate CADM1-AS1 expression in HCC tissue. TMAs, which contained 90 pairs of HCC specimens and corresponding adjacent noncancerous tissues and detailed pathologic information with survival prognosis of patients were examined by ISH staining. The frequency of positive staining of CADM1-AS1 was significantly lower in cancerous tissues (43/89; 48.31%) than that in non-cancerous tissues (84/89; 93.33%; P<0.001) (Figure 1A). In addition, CADM1-AS1 was intensively stained in the cytoplasm of HCC cells, ISH staining of CADM1-AS1 in representative samples of HCC and normal liver tissues was shown (Figure 1B).
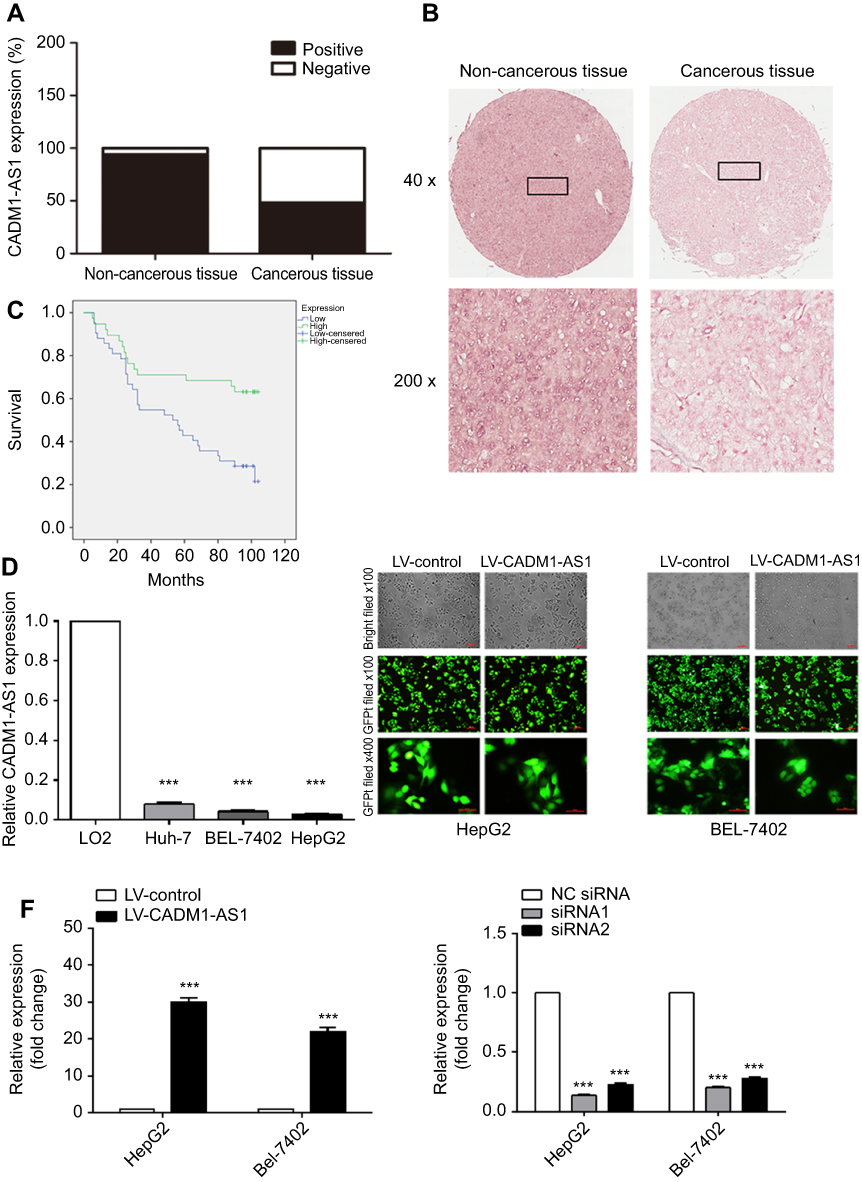 | Figure 1 CADM1-AS1 expression and transfection efficiency in HCC cell line. (A) CADM1-AS1 expression in cancerous and non-cancerous tissues, determined in ISH (n=90). (B) Representative images for ISH detecting CADM1-AS1 expression in cancerous and non-cancerous tissues. (C) Kaplan-Meier survival analysis of overall survival in HCC patients based on CADM1-AS1 expression. Differences were assessed by the log-rank test (n=90). (D) Levels of CADM1-AS1 in HCC (HepG2, BEL-7402 and Huh-7) and normal hepatocyte (LO2) cell lines, detected by qRT-PCR. (E) Lentivirus transfection efficiency and cell morphology were observed under an inverted fluorescence microscope using bright and GFP field channels (x100 and x400 magnification). (F) RT-qPCR were performed to detect the expression levels of CADM1-AS1, with GAPDH as a reference control. Representative images from experiments performed three times are shown (***P<0.001). Abbreviations: HCC, hepatocellular carcinoma; ISH, In situ hybridization; GFP, Green Fluorescent Protein; RT-qPCR, real-time quantitative PCR; CADM1-AS1, cell adhesion molecule 1 antisense RNA 1. |
Analysis by Pearson Chi-Square test indicated that low expression of CADM1-AS1 was correlated with high T stage (P=0.020) and advanced TNM stage (P=0.020, Table 1). Kaplan-Meier analysis was used to evaluate the correlation between elevated CADM1-AS1 and overall survival in HCC patients. The result suggested that high CADM1-AS1 expression was positively correlated with overall survival in HCC patients (P<0.01, Figure 1C). Multivariate Cox regression analysis also demonstrated that CADM1-AS1 overexpression (HR,0.368; P=0.003) and tumor grade (HR,2.077; P=0.013; Table 2) was an independent prognostic factor for overall survival of patients with HCC.
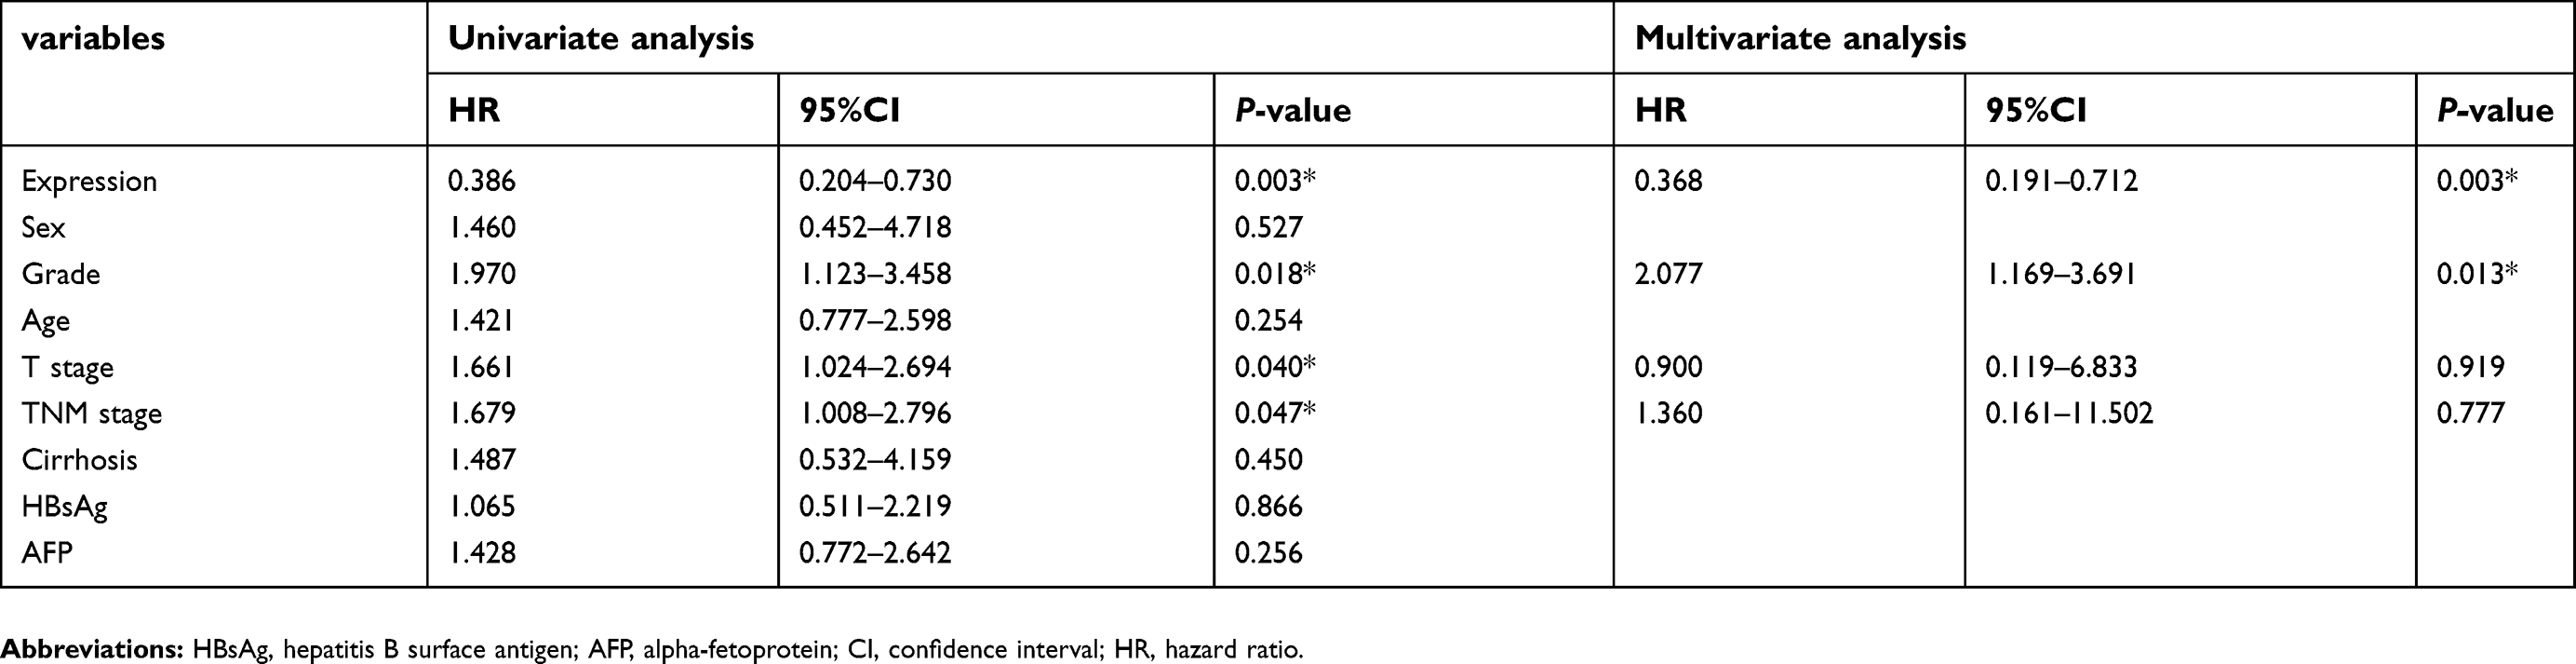 | Table 2 Univariate and multivariate analyses of factors associated with overall survival in patients with hepatocellular carcinoma |
Construction of CADM1-AS1 over-expressing and knockdown HCC cell lines
Next, the expression levels of CADM1-AS1 in the HCC HepG2, BEL-7402 and Huh-7 cell lines as well as in the normal human liver LO2 cell line were measured by qRT-PCR. The expression of CADM1-AS1 was significantly reduced in HCC cell lines compared with LO2 cell line (P<0.001, Figure 1D). For further study,we used HepG2 and BEL-7402 cell lines for CADM1-AS1 over-expressing and knockdown experiments. Then, HepG2 and BEL-7402 cells transfected with lentivirus were analyzed for green fluorescent protein (GFP) expression at x100 and x400 magnification. All cell groups exhibited high viability and transfection efficiency more than 90%. (Figure 1E).
Transfection with LV-CADM1-AS1 resulted in significantly increased in CADM1-AS1 levels compared with the LV-control group (P<0.001). Transfection with CADM1-AS1 siRNA1 and siRNA2 resulted in significantly decreased in CADM1-AS1 levels compared with the NC siRNA group (P<0.001, Figure 1F).
Effect of CADM1-AS1 expression on cell proliferation
The significantly low expression of CADM1-AS1 in HCC tissues prompted us to assess its biological role in HCC cells. The CCK-8 assay, EDU staining and colony formation assay were performed to evaluate the viability of cell proliferation ability.
The CCK-8 assay showed that overexpression of CADM1-AS1 for 24 h, 48 h and 72 h prominently suppressed the proliferation ability of HepG2 and BEL-7402 cells compared with the LV-control group (P<0.05). Meanwhile, CADM1-AS1 knockdown promoted HepG2 and BEL-7402 cell proliferation ability compared with the NC siRNA group (P<0.05, Figure 2A).
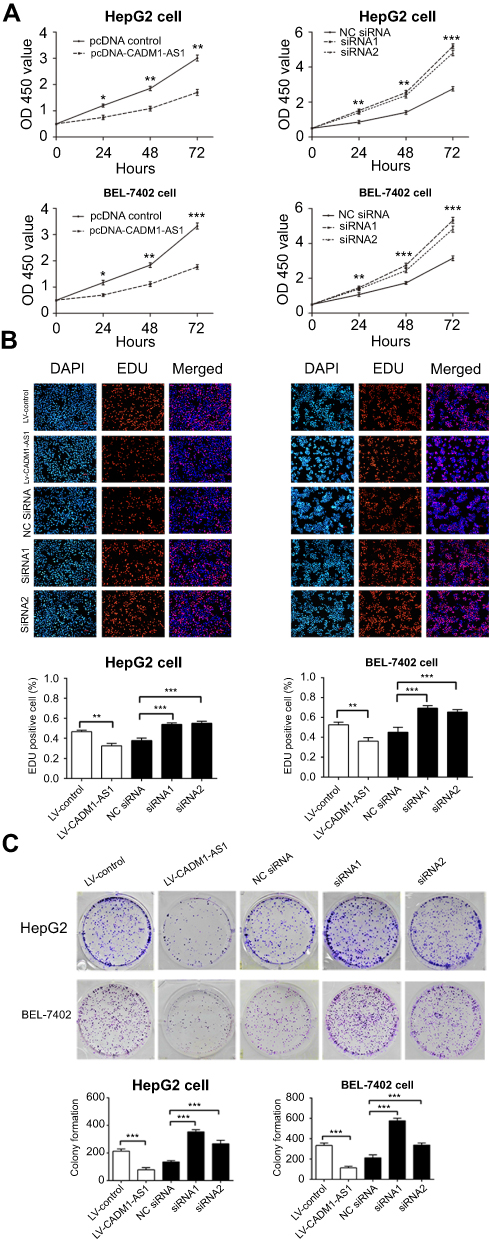 | Figure 2 Effects of CADM1-AS1 on HCC cell proliferation in vitro. (A) Growth curves for HepG2 and BEL-7402 cells after transfection were determined by the CCK-8 assay. (B) The EDU assay was performed to determine the proliferation ability after transfection. (C) Colony formation assay was performed to assess the colony forming ability after transfection. Representative images from experiments performed three times are shown (*P<0.05; **P<0.01; ***P<0.001). Abbreviations: CADM1-AS1, cell adhesion molecule 1 antisense RNA 1; HCC, hepatocellular carcinoma; CCK-8, Cell Counting Kit-8; EDU, 5‐Ethynyl‐2′‐deoxy-uridine. |
The EdU assay results revealed that a obvious decrease in the number of EdU-positive cells of HepG2 and BEL-7402 cells by immunofluorescent (IF) detection in CADM1-AS1 overexpressing group compared with the LV-control group. Meanwhile, CADM1-AS1 knockdown increased the number of EdU-positive cells of HepG2 and BEL-7402 cells compared with the NC siRNA group (P<0.05, Figure 2B).
Consistently, the colony formation assay results showed that overexpression of CADM1-AS1 in HepG2 and BEL-7402 cells inhibited their colony formation abilities, and the number of cloned cells declined compared with the LV-control group. Opposite results were obtained after CADM1-AS1 silencing, abilities of colony formation and the number of cloned cells increased when compared with the NC siRNA group in HepG2 and BEL-7402 cells (P<0.05, Figure 2C).
Taken together, the above findings indicated that CADM1-AS1 expression was negatively correlated with the proliferation of HCC cells.
Effect of CADM1-AS1 expression on cell invasion and migration
Transwell assays were performed to assess the effects of CADM1-AS1 on invasion and migration in HepG2 and BEL-7402 cells. In cell invasion assay, significantly less cells were found in the LV-CADM1-AS1 group compared with the LV-control group. By contrast, significantly more cells invaded in the CADM1-AS1 siRNA1 and siRNA2 groups compared with the NC siRNA group (P<0.05, Figure 3A). Similar results were obtained in cell migration assay (P<0.05, Figure 3B).
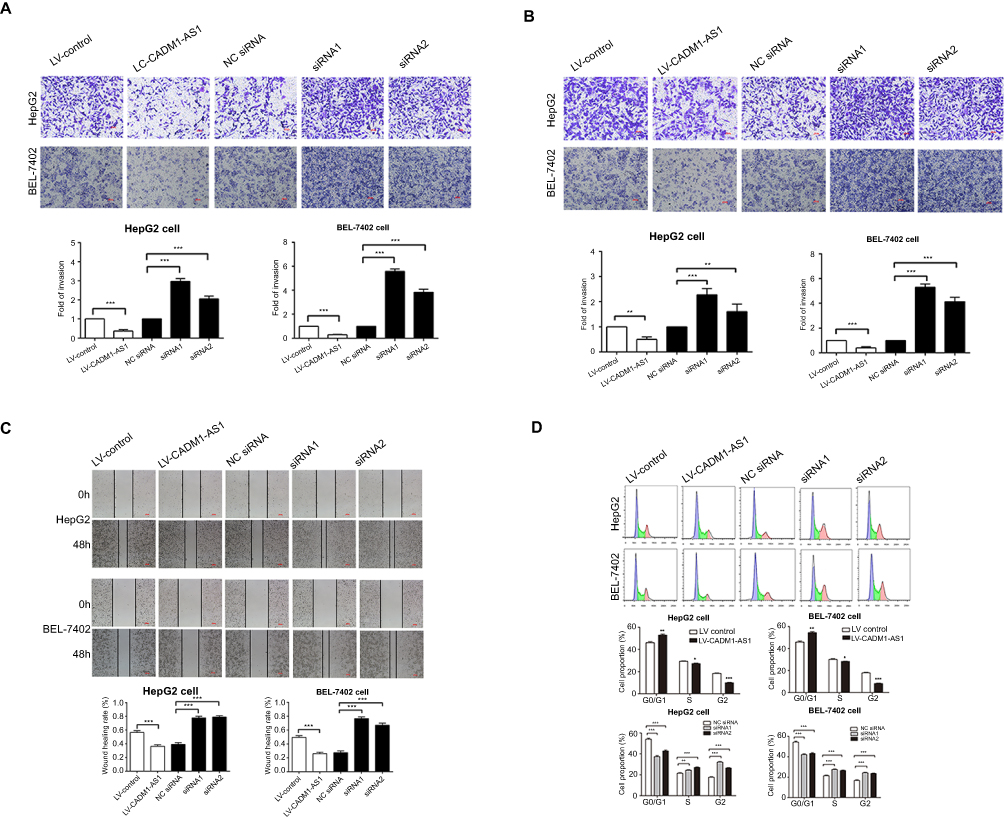 | Figure 3 Effects of CADM1-AS1 on migration, invasion and cell-cycle on HCC cells in vitro. (A) Transwell invasion assay was performed to determine the invasive ability. (B) Transwell migration assay was performed to determine the migratory ability. (C) The scratch-wound assay was performed to detect the migratory ability. (D) Cell cycle progression was evaluated by flow cytometry. Representative images from experiments performed three times are shown (*P<0.05; **P<0.01; ***P<0.001). Abbreviations: CADM1-AS1, cell adhesion molecule 1 antisense RNA 1; HCC, hepatocellular carcinoma. |
A scratch-wound assay was performed to further verify the effect of CADM1-AS1 on the migratory ability of HepG2 and BEL-7402 cells. In this assay, the LV-CADM1-AS1 group exhibited significantly slower wound closure compared with the LV-control group. Meanwhile, the CADM1-AS1 siRNA1 and siRNA2 groups exhibited significantly faster wound closure compared with the NC siRNA group (P<0.05, Figure 3C).
Taken together, these results demonstrated that CADM1-AS1 inhibited cell invasion and migration in HCC cells.
Effect of CADM1-AS1 expression on cell cycle distribution
To determine whether the effect of CADM1-AS1 on HepG2 and BEL-7402 cell growth was attributable to cell-cycle arrest, cell-cycle distribution was analyzed by flow cytometry. The percentages of G0/G1-phase cells in HepG2 (44±1.15% vs 53±1.32%) and BEL-7402 (42±0.76% vs 55±1.12%) cells transfected with LV-CADM1-AS1 showed overt cell cycle arrest than that in the LV-control group. Meanwhile, knockdown of CADM1-AS1 promoted the percentages of G0/G1-phase cells in HepG2 (37.3±0.75%, 42±1.16% vs 54±1.39%) and BEL-7402 cells (41.8±1.22%, 43.1±1.17% vs 54.2±1.36%) compared with the NC siRNA group (P<0.05, Figure 3D). The above findings indicated that CADM1-AS1 inhibited the cell cycle progression of HCC cells.
CADM1-AS1 regulates the AKT/GSK-3β signaling pathway
Numerous studies have confirmed that PTEN and the downstream AKT signaling pathway play a notable role in regulating cell growth. However, whether CADM1-AS1 affects the PTEN and AKT/GSK-3β pathway was unknown. Western blotting analysis revealed that overexpression of CADM1-AS1 significantly increased PTEN expression in HepG2 and BEL-7402 cells, on the contrast, AKT and GSK-3β phosphorylation, which is regulated by PTEN, was significantly decreased than those in LV-control group, while changes in the levels of total AKT and GSK-3β were not significant (P>0.05). After treatment with an AKT pathway activator SC79, the decrease of AKT and GSK-3β phosphorylation was inconspicuous.
Meanwhile, knockdown of CADM1-AS1 in HepG2 and BEL-7402 cells by CADM1-AS1 siRNA1 and siRNA2 significantly decreased PTEN expression and increased AKT and GSK-3β phosphorylation than those in NC siRNA group (P<0.05, Figure 4C and D), while changes in the levels of total AKT and GSK-3β were not significant (P>0.05).
 | Figure 4 Mechanism of CADM1-AS1 on the AKT/GSK-3β signaling pathway and HCC cell-cycle progression in vitro. PTEN, total AKT, total GSK-3β, p-AKT and p-GSK-3β levels were examined by Western blot in HepG2 cell after transfection. GAPDH was used as the loading control. PTEN, total AKT, total GSK-3β, p-AKT and p-GSK-3β levels were examined by Western blot in BEL-7402 cell after transfection. GAPDH was used as the loading control. P15, P21, P27, CDK2, CDK4, CDK6, cyclinD and cyclinE protein levels were determined in HepG2 cells after transfection. P15, P21, P27, CDK2, CDK4, CDK6, cyclinD and cyclinE protein levels were determined in BEL-7402 cells after transfection. Representative images from experiments performed three times are shown (*P<0.05; **P<0.01; ***P<0.001).Abbreviations: CADM1-AS1, cell adhesion molecule 1 antisense RNA 1; HCC, hepatocellular carcinom. |
These results show that CADM1-AS1 can promote the PTEN expression, while inhibit the phosphorylation of AKT and GSK-3β.
CADM1-AS1 regulates cell-cycle associated proteins expression in HepG2 and BEL-7402 cells
Next, to assess the mechanism of CADM1-AS1 on cell cycle, the levels of several cell cycle regulators were determined. After CADM1-AS1 overexpression, the levels of p15, p21 and p27 were increased, while the levels of CDK2, CDK4, CDK6, cyclinD and cyclinE were reduced in comparison with the LV-control group. After treatment with SC79, this trend was obviously weakened (P<0.05), the results confirmed that the AKT pathway is associated with cell cycle associated proteins, and promotes cell cycle progression. When knockdown of CADM1-AS1 by siRNAs, the expression levels of CDK2, CDK4, CDK6, cyclinD and cyclinE were significantly increased, while the expression levels of p15, p21 and p27 were reduced compared with the NC siRNA group (P<0.001, Figure 4A and B). These results demonstrated that CADM1-AS1 suppresses cell cycle by inhibiting the expression levels of CDK2, CDK4, CDK6, cyclinD, cyclinE and promoting the expression levels of p15, p21 and p27 in HCC cells.
CADM1-AS1 enhances tumor growth in vivo
To further assess the functional role of CADM1-AS1 in vivo, we established a xenograft HCC mouse model, in which the male nude mice were subcutaneously injected with HepG2 cells harboring CADM1-AS1 overexpression (LV-CADM1-AS1) and empty control (LV-control) lentiviral vectors, respectively. Tumor volumes were measured every 7 days after injection. The results showed that xenografts produced from CADM1-AS1 overexpressing cells grew slower than the control group, with smaller final tumor volumes and lower weights than the control group (P<0.05, Figure 5A).
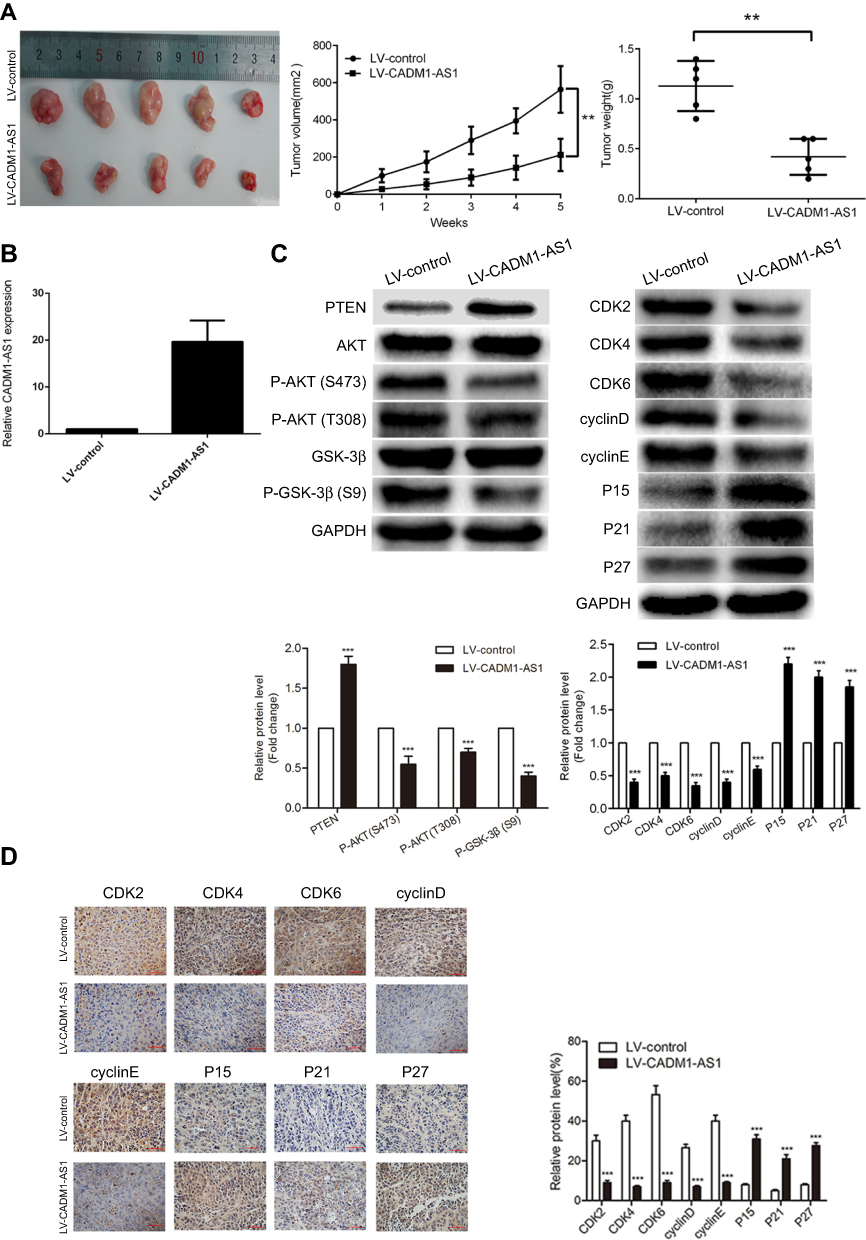 | Figure 5 CADM1-AS1 overexpression suppresses HepG2 cell growth in vivo. (A) Tumor volumes and weighs of Xenograft tissues. (B) The expression of CADM1-AS1 was detected by qRT-PCR in xenograft tumor tissues. GAPDH was used as a loading control. (C) PTEN/AKT/GSK-3β signaling pathway and cell cycle regulators protein levels were examined by Western blotting in xenograft tumor tissues. GAPDH was used as a loading control. (D) Representative IHC staining images of P15, P21, P27, CDK2, CDK4, CDK6, cyclinD and cyclinE expression levels in xenograft tumor tissues Representative images from experiments performed three times are shown ( **P<0.01; ***P<0.001). Abbreviations: CADM1-AS1, cell adhesion molecule 1 antisense RNA 1; RT-qPCR, real-time quantitative PCR; IHC, immunohistochemical. |
As expected, qRT-PCR analysis revealed that CADM1-AS1 expression was obviously increased in tumor tissues from the LV-CADM1-AS1 group compared with the LV-control group (P<0.05, Figure 5B). Further Western blotting and immunohistochemical analyses of xenograft tumors showed remarkably reduced AKT phosphorylation, GSK-3β phosphorylation, CDK2, CDK4, CDK6, cyclinD and cyclinE levels and obviously increased PTEN, p15, p21 and p27 amounts in LV-CADM1-AS1 tumor tissues compared with LV-control tumor tissues (P<0.05, Figure 5C and D). Taken together, these data showed similar expression patterns as described above for the HCC cell lines and confirmed that CADM1-AS1 inhibited the tumorigenesis of HCC in vivo.
Discussion
Liver cancer is a malignancy with a dismal prognosis.18 The clinical outcome of HCC is usually poor, primarily because of advanced stage and metastasis at the time of diagnosis in most cases.19,20 Long non-coding RNAs (lncRNAs) have been recognized as biomarkers and potential therapeutic targets in multiple diseases including cancer. Although thousands of lncRNAs within the human genome have been identified, less than 1% of these lncRNAs have been functionally characterized in the past decades.21 To date, increasing studies have highlighted that lncRNAs make up a large portion of the transcripts of the genome, and they play fundamental roles in carcinogenesis through the regulation of tumor proliferation or metastasis.22 The relationship between lncRNAs deregulation and cancer progression has become one of the focuses of cancer studies. Accumulating evidence suggests that numerous lncRNAs are involved in liver cancer tumorigenesis and progression.23,24 lncRNAs function as key regulators of cell proliferation, apoptosis, cell cycle progression, migration and invasion in HCC. For instance, knockdown of GHET1 blocks cell proliferation, and induces cell cycle arrest and cell apoptosis in HCC.25 Increased NNT-AS1 expression promotes cell proliferation and cell cycle progression, and decreases cell apoptosis in HCC.26 Previous studies showed that CADM1-AS1 is associated with poor prognosis in patients with clear cell renal cell carcinomas.16 However, the potential role of CADM1-AS1 in liver cancer has not been reported.
This study demonstrated that CADM1-AS1 was lowly expressed in HCC tissue specimens and cell lines. An analysis of different clinicopathological characteristics showed that low CADM1-AS1 expression was closely associated with high T stage, advanced TNM stage and poor prognosis of HCC patients. In addition, elevated CADM1-AS1 was closely correlated with prolonged survival time in HCC patients. Multivariate Cox regression analysis also demonstrated that CADM1-AS1 overexpression and tumor grade was an independent prognostic factor for overall survival of patients with HCC. These data indicated that CADM1-AS1 acts as a tumor suppressor gene in the progression of HCC.
To assess the biological functions of CADM1-AS1, loss- and gain-of-function experiments were performed. The results showed that CADM1-AS1 inhibited cell proliferation, migration, invasion, induced G0/G1 phase arrest. A subcutaneous tumor model in nude mice indicated that CADM1-AS1 overexpression inhibited HCC tumor growth in vivo. Taken together, these results demonstrated the tumor-suppressing role of CADM1-AS1 in HCC.
In this study, we mainly studied the proliferation of HCC cells induced by CADM1-AS1 and its mechanism. The experiment that HCC cells with CADM1-AS1 reduce migration and invasion capacities aims to further confirm that CADM1-AS1 is a tumor suppressor. The mechanism of CADM1-AS1 reduce migration and invasion capacities will be conducted in the future.
Accumulating evidence suggests that abnormal activation of the AKT signaling pathway is involved in cell growth, cell cycle progression and cell survival.27,28 Uncontrolled activation of the AKT pathway can accelerate cell cycle progression.29–32 AKT/GSK-3β was reported to be constitutively active in various tumor types.33,34 Numerous studies showed that PTEN is upstream of AKT/GSK-3β and participates in the development of many cancers.35,36 Consequently, inactivating the AKT signaling pathway may constitute an exciting target for developing innovative HCC treatment. In this study, our results revealed that overexpression of CADM1-AS1 increased PTEN expression, and decreased AKT and GSK-3β phosphorylation both in vitro and in vivo, and these effects were attenuated by the AKT pathway activator SC79.
More recently, emerging evidence has indicated that the lncRNA- miRNA- mRNA network plays a key role in regulating cancer proliferation.37–39 These studies suggest that lncRNA- miRNA- mRNA interaction serves a crucial function in cancer growth and metastasis.40,41 Extensive studies have indicated that PTEN is associated with a wide spectrum of tumors. In the present study, we revealed the interaction between CADM1-AS1 and PTEN for the first time: CADM1-AS1 has a positive regulatory effect on PTEN. It inspired us to investigate which micRNA could regulate CADM1-AS1 and PTEN via direct targeting. I will verify this relationship in the future experiment.
Inactivation or inhibition of the AKT pathway can cause cell cycle arrest and is associated with a variety of cell cycle-related proteins42 Cell cycle arrest can be triggered by various stimulating factors, and may result in cell division blockage, cell death, and/or apoptosis.43–45 In cancer, cell cycle deregulation prevents cell differentiation and causes abnormal cell growth.46–48 More than 90% of human cancers have alterations of cyclin-dependent protein kinases, (CDKs), and cyclin dependent kinase inhibitor (CDKIs), which are mostly related to the G1 phase.49 Transition from G0/G1 to S phase is responsible for the initiation and completion of DNA replication. The present data confirmed that CADM1-AS1 had inhibitory effects on HCC cell growth in vitro and in nude mouse xenografts. In addition, Flow Cytometry showed that CADM1-AS1 induced significant G0/G1-phase accumulation in HCC cells. To further explore the molecular basis, the expression levels of proteins involved in cell cycle regulation were assessed. p21 and p27 are a kind of Cyclin-dependent Kinase Inhibitor (CKI) which could inhibit the kinase activity of the cyclinE/CDK2 complexes.50,51 In cell cycle regulation, the cyclinE/CDK2 complexes regulate cell cycle progression through late G1 and entry into S phase.52 The results of this study revealed that CADM1-AS1 could upregulate the levels of p21 and p27,while downregulate the levels of cyclinE, CDK2. Early in the G1 phase, the formation of cyclinD, CDK4 and CDK6 complexes drives the start of cell cycle.53 However, p15 can delay the progression of G1 phase by inhibiting the activity of cyclinD/CDK4/CDK6 complexes.54 The results showed that CADM1-AS1 upregulated the levels of p15, while downregulated the levels of cyclinD1, CDK4 and CDK6. In conclusion, CADM1-AS1 caused G0/G1 phase arrest, through p15 - cyclinD/CDK4/CDK6, p21/p27 - cyclinE/CDK2 pathways. Activated AKT is sufficient to promote cell proliferation via inhibition of p21 and p27 by direct phosphorylation, as well as inactivating glycogen synthase kinase-3 beta (GSK-3β), which strongly degrades cyclinD.55 These findings suggested that CADM1-AS1 suppresses AKT and GSK-3β phosphorylation, which results in P21, P27 and P15 upregulation as well as cyclinD, cyclinE, CDK2, CDK4 and CDK6 downregulation, inducing G0/G1 arrest and subsequently inhibiting HCC progression.
Conclusion
We firstly demonstrated that CADM1-AS1 is downregulated in HCC tissues, this downregulation was associated with advanced tumor stage, high TNM stage and reduced survival, CADM1-AS1 was an independent prognostic factor for overall survival of patients with HCC. Its overexpression suppresses growth and metastasis invasion, and induces G0/G1 phase arrest in HCC cells by regulating PTEN/AKT/GSK-3β signaling and cell cycle proteins both in vivo and in vitro. These findings not only provide new insights into the mechanisms responsible for HCC progression, but also suggest that CADM1-AS1 may be a novel prognostic marker and potential therapeutic target for HCC.
Acknowledgments
This work was supported by grants from the National Natural Science Foundation of China (No. 81571778, No. 81501564 and No. 81630053)
Disclosure
The authors declare no potential conflicts of interest in this work.
References
1. Chedid MF, Kruel CRP, Pinto MA, et al. Hepatocellular carcinoma: diagnosis and operative management. Arq Bras Cir Dig. 2017;30(4):272–278. doi:10.1590/0102-6720201700040011
2. Xie DY, Ren ZG, Zhou J, Fan J, Gao Q. Critical appraisal of Chinese 2017 guideline on the management of hepatocellular carcinoma. Hepatobiliary Surg Nutr. 2017;6(6):387–396. doi:10.21037/hbsn.2017.11.01
3. Forner A, Reig M, Bruix J. Hepatocellular carcinoma. Lancet. 2018;391(10127):1301–1314. doi:10.1016/S0140-6736(18)30010-2
4. Cao D, Cai C, Ye M, et al. Differential metabonomic profiles of primary hepatocellular carcinoma tumors from alcoholic liver disease, HBV-infected, and HCV-infected cirrhotic patients. Oncotarget. 2017;8(32):53313–53325. doi:10.18632/oncotarget.18397
5. Befeler AS, Di Bisceglie AM. Hepatocellular carcinoma: diagnosis and treatment. Gastroenterology. 2002;122(6):1609–1619.
6. Forner A, Hessheimer AJ, Isabel Real M, Bruix J. Treatment of hepatocellular carcinoma. Crit Rev Oncol Hematol. 2006;60(2):89–98. doi:10.1016/j.critrevonc.2006.06.001
7. Xia L, Huang W, Tian D, et al. Overexpression of forkhead box C1 promotes tumor metastasis and indicates poor prognosis in hepatocellular carcinoma. Hepatology. 2013;57(2):610–624. doi:10.1002/hep.26029
8. Rapisarda V, Loreto C, Malaguarnera M, et al. Hepatocellular carcinoma and the risk of occupational exposure. World J Hepatol. 2016;8(13):573–590. doi:10.4254/wjh.v8.i13.573
9. Gutschner T, Diederichs S. The hallmarks of cancer: a long non-coding RNA point of view. RNA Biology. 2012;9(6):703–719. doi:10.4161/rna.20481
10. Mercer TR, Dinger ME, Mattick JS. Long non-coding RNAs: insights into functions. Nat Rev Genet. 2009;10(3):155–159. doi:10.1038/nrg2521
11. Gutschner T, Hammerle M, Eissmann M, et al. The noncoding RNA MALAT1 is a critical regulator of the metastasis phenotype of lung cancer cells. Cancer Res. 2013;73(3):1180–1189. doi:10.1158/0008-5472.CAN-12-2850
12. Mourtada-Maarabouni M, Pickard MR, Hedge VL, Farzaneh F, Williams GT. GAS5, a non-protein-coding RNA, controls apoptosis and is downregulated in breast cancer. Oncogene. 2009;28(2):195–208. doi:10.1038/onc.2008.373
13. Schmidt LH, Spieker T, Koschmieder S, et al. The long noncoding MALAT-1 RNA indicates a poor prognosis in non-small cell lung cancer and induces migration and tumor growth. J Thorac Oncol. 2011;6(12):1984–1992. doi:10.1097/JTO.0b013e3182307eac
14. Qiu L, Tang Q, Li G, Chen K. Long non-coding RNAs as biomarkers and therapeutic targets: recent insights into hepatocellular carcinoma. Life Sci. 2017;191:273–282. doi:10.1016/j.lfs.2017.10.007
15. Mehra M, Chauhan R. Long noncoding RNAs as a key player in hepatocellular carcinoma. Biomark Cancer. 2017;9:1179299x17737301. doi:10.1177/1179299X17737301
16. Yao J, Chen Y, Wang Y, et al. Decreased expression of a novel lncRNA CADM1-AS1 is associated with poor prognosis in patients with clear cell renal cell carcinomas. Int J Clin Exp Pathol. 2014;7(6):2758–2767.
17. Murakami Y. Involvement of a cell adhesion molecule, TSLC1/IGSF4, in human oncogenesis. Cancer Science. 2005;96(9):543–552. doi:10.1111/j.1349-7006.2005.00089.x
18. Cheng Z, Li X, Ding J. Characteristics of liver cancer stem cells and clinical correlations. Cancer Lett. 2016;379(2):230–238. doi:10.1016/j.canlet.2015.07.041
19. Fu X, Zhu X, Qin F, et al. Linc00210 drives Wnt/beta-catenin signaling activation and liver tumor progression through CTNNBIP1-dependent manner. Mol Cancer. 2018;17(1):73. doi:10.1186/s12943-018-0783-3
20. Yang B, Li M, Tang W, et al. Dynamic network biomarker indicates pulmonary metastasis at the tipping point of hepatocellular carcinoma. Nat Commun. 2018;9(1):678. doi:10.1038/s41467-018-03024-2
21. Ponting CP, Oliver PL, Reik W. Evolution and functions of long noncoding RNAs. Cell. 2009;136(4):0–641. doi:10.1016/j.cell.2009.02.006
22. Guerrieri F. Long non-coding RNAs era in liver cancer. World Journal of Hepatology. 2015;7(16):1971–1973. doi:10.4254/wjh.v7.i16.1971
23. Xiao ZD, Han L, Lee H, et al. Energy stress-induced lncRNA FILNC1 represses c-Myc-mediated energy metabolism and inhibits renal tumor development. Nature Communications. 2017;8(1):783. doi:10.1038/s41467-017-00902-z
24. Zhan Y, Li Y, Guan B, et al. Long non-coding RNA HNF1A-AS1 promotes proliferation and suppresses apoptosis of bladder cancer cells through upregulating Bcl-2. Oncotarget. 2017;8(44):76656–76665. doi:10.18632/oncotarget.20795
25. Jin L, He Y, Tang S, Huang S. LncRNA GHET1 predicts poor prognosis in hepatocellular carcinoma and promotes cell proliferation by silencing KLF2. J Cell Physiol. 2018;233(6):4726–4734. doi:10.1002/jcp.26257
26. Lu YB, Jiang Q, Yang MY, Zhou JX, Zhang Q. Long noncoding RNA NNT-AS1 promotes hepatocellular carcinoma progression and metastasis through miR-363/CDK6 axis. Oncotarget. 2017;8(51):88804–88814. doi:10.18632/oncotarget.21321
27. Yu J, Wang X, Lu Q, et al. Extracellular 5‘-nucleotidase (CD73) promotes human breast cancer cells growth through AKT/GSK-3beta/beta-catenin/cyclinD1 signaling pathway. Int J Cancer. 2018;142(5):959–967. doi:10.1002/ijc.31112
28. Wang J, Li XM, Bai Z, Chi BX, Wei Y, Chen X. Curcumol induces cell cycle arrest in colon cancer cells via reactive oxygen species and Akt/GSK3beta/cyclin D1 pathway. J Ethnopharmacol. 2018;210:1–9. doi:10.1016/j.jep.2017.06.037
29. Chang F, Lee JT, Navolanic PM, et al. Involvement of PI3K/Akt pathway in cell cycle progression, apoptosis, and neoplastic transformation: a target for cancer chemotherapy. Leukemia. 2003;17(3):590–603. doi:10.1038/sj.leu.2402824
30. Lee SH, Pyo CW, Hahm DH, Kim J, Choi SY. Iron-saturated lactoferrin stimulates cell cycle progression through PI3K/Akt pathway. Mol Cells. 2009;28(1):37–42. doi:10.1007/s10059-009-0102-3
31. Lu Y, Liu S, Zhang S, et al. Tissue inhibitor of metalloproteinase-1 promotes NIH3T3 fibroblast proliferation by activating p-Akt and cell cycle progression. Mol Cells. 2011;31(3):225–230. doi:10.1007/s10059-011-0023-9
32. Zhang Z, Gao N, He H, Huang C, Luo J, Shi X. Vanadate activated Akt and promoted S phase entry. Mol Cell Biochem. 2004;255(1–2):227–237.
33. Zheng Z, Zhao F, Zhu D, et al. Long non-coding RNA LUCAT1 promotes proliferation and invasion in clear cell renal cell carcinoma through AKT/GSK-3beta signaling pathway. Cell Physiol Biochem. 2018;48(3):891–904. doi:10.1159/000491957
34. Liu Y, Huang Y, Zhang J, et al. TIMMDC1 knockdown inhibits growth and metastasis of gastric cancer cells through metabolic inhibition and AKT/GSK3beta/beta-catenin signaling pathway. Int J Biol Sci. 2018;14(10):1256–1267. doi:10.7150/ijbs.27100
35. Li J, Gong X, Jiang R, et al. Fisetin inhibited growth and metastasis of triple-negative breast cancer by reversing epithelial-to-mesenchymal transition via PTEN/Akt/GSK3beta signal pathway. Front Pharmacol. 2018;9:772. doi:10.3389/fphar.2018.00772
36. Zhou F, Xue M, Qin D, et al. HIV-1 Tat promotes Kaposi‘s sarcoma-associated herpesvirus (KSHV) vIL-6-induced angiogenesis and tumorigenesis by regulating PI3K/PTEN/AKT/GSK-3beta signaling pathway. PLoS One. 2013;8(1):e53145. doi:10.1371/journal.pone.0053145
37. Kartha RV, Subramanian S. Competing endogenous RNAs (ceRNAs): new entrants to the intricacies of gene regulation. Frontiers in Genetics. 2014;5:8.
38. Jiao C, Song Z, Chen J, et al. lncRNA-UCA1 enhances cell proliferation through functioning as a ceRNA of Sox4 in esophageal cancer. Oncology Reports. 2016;36(5):2960–2966. doi:10.3892/or.2016.5121
39. Xiao Y, Jiao C, Lin Y, et al. lncRNA UCA1 contributes to imatinib resistance by acting as a ceRNA against miR-16 in chronic myeloid leukemia cells. DNA and Cell Biology. 2017;36(1):18–25. doi:10.1089/dna.2016.3533
40. Lv J, Fan HX, Zhao XP, et al. Long non-coding RNA Unigene56159 promotes epithelial-mesenchymal transition by acting as a ceRNA of miR-140-5p in hepatocellular carcinoma cells. Cancer Lett. 2016;382(2):166–175. doi:10.1016/j.canlet.2016.08.029
41. Zhang K, Li Q, Kang X, Wang Y, Wang S. Identification and functional characterization of lncRNAs acting as ceRNA involved in the malignant progression of glioblastoma multiforme. Oncology Reports. 2016;36(5):2911–2925. doi:10.3892/or.2016.5070
42. Xu X, Zhang Y, Qu D, Jiang T, Li S. Osthole induces G2/M arrest and apoptosis in lung cancer A549 cells by modulating PI3K/Akt pathway. J Exp Clin Cancer Res. 2011;30:33. doi:10.1186/1756-9966-30-24
43. Chen J, Zeng J, Xin M, Huang W, Chen X. Formononetin induces cell cycle arrest of human breast cancer cells via IGF1/PI3K/Akt pathways in vitro and in vivo. Horm Metab Res. 2011;43(10):681–686. doi:10.1055/s-0031-1286306
44. Zhong G, Li H, Shan T, Zhang N. CSN5 silencing inhibits invasion and arrests cell cycle progression in human colorectal cancer SW480 and LS174T cells in vitro. Int J Clin Exp Pathol. 2015;8(3):2809–2815.
45. Zhang HS, Cao EH, Qin JF. Homocysteine induces cell cycle G1 arrest in endothelial cells through the PI3K/Akt/FOXO signaling pathway. Pharmacology. 2005;74(2):57–64. doi:10.1159/000083684
46. Afshari CA, Barrett JC. Cell cycle controls: potential targets for chemical carcinogens? Environ Health Perspect. 1993;101(Suppl 5):9–14. doi:10.1289/ehp.93101s59
47. Wu CD, Chou HW, Kuo YS, et al. Nucleolin antisense oligodeoxynucleotides induce apoptosis and may be used as a potential drug for nasopharyngeal carcinoma therapy. Oncol Rep. 2012;27(1):94–100. doi:10.3892/or.2011.1476
48. Massague J. G1 cell-cycle control and cancer. Nature. 2004;432(7015):298–306. doi:10.1038/nature03094
49. Bonelli P, Tuccillo FM, Borrelli A, Schiattarella A, Buonaguro FM. CDK/CCN and CDKI alterations for cancer prognosis and therapeutic predictivity. Biomed Res Int. 2014;2014:361020. doi:10.1155/2014/361020
50. Orlando S, Gallastegui E, Besson A, et al. p27Kip1and p21Cip1collaborate in the regulation of transcription by recruiting cyclin–cdk complexes on the promoters of target genes. Nucleic Acids Research. 2015;43(14):6860–6873. doi:10.1093/nar/gkv593
51. Guangan H, Zahid H, Huang Z, et al. Induction of p21 by p53 following DNA damage inhibits both Cdk4 and Cdk2 activities. Oncogene. 2005;24:2929–2943. doi:10.1038/sj.onc.1208474
52. Charles JS. G1 phase progression: cycling on cue. Cell. 1994;79:551–555.
53. Gu X, Xu ZY, Zhu LY, Wang LF, Li K, Pei Q. Dual control of Shuanghuang Shengbai granule on upstream and downstream signal modulators of CyclinD-CDK4/6 signaling pathway of cell cycle in Lewis-bearing mice with cyclophosphamide-induced myelosuppression. Onco Targets Ther. 2013;6:199–209. doi:10.2147/OTT.S37407
54. Serrano M, Hannon GJ, Beach D. A new regulatory motif in cell-cycle control causing specific inhibition of cyclin D/CDK4. Nature. 1993;366(6456):704–707. doi:10.1038/366704a0
55. Liao K, Li J, Wang Z. Dihydroartemisinin inhibits cell proliferation via AKT/GSK3beta/cyclinD1 pathway and induces apoptosis in A549 lung cancer cells. Int J Clin Exp Pathol. 2014;7(12):8684–8691.
 © 2019 The Author(s). This work is published and licensed by Dove Medical Press Limited. The full terms of this license are available at https://www.dovepress.com/terms.php and incorporate the Creative Commons Attribution - Non Commercial (unported, v3.0) License.
By accessing the work you hereby accept the Terms. Non-commercial uses of the work are permitted without any further permission from Dove Medical Press Limited, provided the work is properly attributed. For permission for commercial use of this work, please see paragraphs 4.2 and 5 of our Terms.
© 2019 The Author(s). This work is published and licensed by Dove Medical Press Limited. The full terms of this license are available at https://www.dovepress.com/terms.php and incorporate the Creative Commons Attribution - Non Commercial (unported, v3.0) License.
By accessing the work you hereby accept the Terms. Non-commercial uses of the work are permitted without any further permission from Dove Medical Press Limited, provided the work is properly attributed. For permission for commercial use of this work, please see paragraphs 4.2 and 5 of our Terms.