")
Back to Journals » International Journal of Nanomedicine » Volume 11
Liver-targeting Resibufogenin-loaded poly(lactic-co-glycolic acid)-D-α-tocopheryl polyethylene glycol 1000 succinate nanoparticles for liver cancer therapy
Authors Chu Q, Xu H, Gao M, Guan X, Liu H, Deng S, Huo X, Liu K, Tian Y, Ma X
Received 1 August 2015
Accepted for publication 6 December 2015
Published 27 January 2016 Volume 2016:11 Pages 449—463
DOI https://doi.org/10.2147/IJN.S93541
Checked for plagiarism Yes
Review by Single anonymous peer review
Peer reviewer comments 4
Editor who approved publication: Professor Lei Yang
Qiuchen Chu,1,* Hong Xu,2,* Meng Gao,1 Xin Guan,1 Hongyan Liu,1 Sa Deng,1 Xiaokui Huo,1 Kexin Liu,1 Yan Tian,1 Xiaochi Ma1
1College of Pharmacy, 2College of Basic Medical Sciences, Dalian Medical University, Dalian, People’s Republic of China
*These authors contributed equally to this work
Abstract: Liver cancer remains a major problem around the world. Resibufogenin (RBG) is a major bioactive compound that was isolated from Chansu (also called toad venom or toad poison), which is a popular traditional Chinese medicine that is obtained from the skin secretions of giant toads. RBG has strong antitumor effects, but its poor aqueous solubility and its cardiotoxicity have limited its clinical use. The aim of this study was to formulate RBG-loaded poly(lactic-co-glycolic acid) (PLGA)-D-α-tocopheryl polyethylene glycol 1000 succinate nanoparticle (RPTN) to enhance the treatment of liver cancer. RPTN, RBG-loaded PLGA nanoparticle (RPN), and RBG/coumarin-6-loaded PLGA-D-α-tocopheryl polyethylene glycol 1000 succinate nanoparticle (RCPTN) were prepared. The cellular uptake of RCPTN by HepG2 and HCa-F cells was analyzed using confocal laser scanning microscopy. Apoptosis was induced in HepG2 cells by RPTN, RBG solution (RS), and 5-fluorouracil solution (used as the negative controls), as assayed using flow cytometry. LD50 (median lethal dose) values were determined for RS and RPTN, and the liver-targeting properties were determined for RCPTN in intravenously injected mice. A pharmacokinetic study was conducted in rats, and the in vivo therapeutic effects of RPTN, RPN, and RS were examined in a mouse tumor model. The results showed that RCPTN simultaneously delivered both coumarin-6 and RBG into HepG2 and HCa-F cells. The ratio of apoptotic cells was increased in the RPTN group. The LD50 for RPTN was 2.02-fold higher than the value for RS. Compared to RS, RPTN and RPN both showed a significant difference in vivo not only in the pharmacodynamic study but also in anticancer efficacy, and RPTN performed much better than RPN. The detection indexes for drug concentration and fluorescence inversion microscopy images both demonstrated that RCPTN was much better at targeting the liver than RS. The liver-targeting RPTN, which displayed enhanced pharmacological effects and decreased toxicity for the loaded drug RBG, is therefore a promising intravenous dosage form that may be useful in the treatment of liver cancer.
Keywords: Resibufogenin, PLGA-TPGS, nanoparticles, liver cancer, HepG2 cells, HCa-F cells
Introduction
Liver cancer is one of the most prevalent and lethal malignant tumors in patients around the world, and it is closely associated with infection by the hepatitis B virus and the hepatitis C virus.1 Currently, the normal treatment of liver cancer is surgical resection, but not all patients are operable after a diagnosis has been confirmed.2 Moreover, the size of the tumor and its position in relation to large vessels and the gallbladder, in addition to the presence of liver dysfunctions caused by liver cirrhosis, contribute to the limited application of surgical resection in a clinical setting. In addition, the resection rate is low because there is a high postoperative recurrence rate. Currently, radio frequency ablation is another emerging means of treating liver cancer.3,4 Despite its advantages, including its minimally invasive nature and a lower rate of complications, the presence of residual tumors after radio frequency ablation remains the most frequent cause of relapses for this treatment option. Currently, chemotherapy remains the main and usually applied therapeutic method, but most chemotherapeutic drugs have low selectivity for targeting tumor tissues, and this usually results in serious side effects. Therefore, a treatment that targets liver cancer and confers higher bioavailability, improved target specificity, and fewer adverse effects is urgently needed.5
Traditional Chinese medicines have been widely used as clinical therapies for thousands of years, especially in the People’s Republic of China, Japan, Korea, and other Asian countries. Chansu, which is also called toad venom or toad poison, is a popular traditional Chinese medicine that is obtained from the skin secretions of giant toads, including Bufo bufo gargarizans Cantor and B. melsanostictus Schneider. In the People’s Republic of China, Chansu is widely used to treat various cancers, including leukemia, hepatoma, lung carcinoma, and gastrointestinal and breast cancers.6,7 Resibufogenin (RBG) is a major bioactive compound that was isolated from Chansu. RBG is a major compound in Chansu in the Chinese Pharmacopoeia.8 Previous in vitro and in vivo studies have suggested that RBG has strong antitumor effects, with half maximal inhibitory concentration (IC50) values of 1–50 nM against various malignant tumors, such as human hepatocellular carcinoma cells (Bel7402) and human cervical carcinoma cells (HeLa).9–11 It has also been reported that RBG shows toxicological activities by controlling potassium rectifier currents and inhibiting the activity of Na+-K+ ATPase and membrane depolarization,12,13 which contribute to its cardiotoxic effects. Additionally, its poor aqueous solubility has so far limited its clinical use. Therefore, it is important to establish a new dosing form of RBG to enhance its pharmacological effects and decrease its cardiotoxicity.
Over the last 2 decades, biodegradable nanoparticles (NPs) have been increasingly recognized as one of the most promising drug delivery systems for poorly water-soluble anticancer drugs because they can be used to target drug delivery, control drug release, and sustain drug activities on the lesion. NPs have also been shown to reduce systemic side effects and to show facilitated extravasation into the tumor and a strong ability to cross a variety of physiological barriers.14,15 Poly(lactic-co-glycolic acid) (PLGA), which has been approved for drug delivery applications by the Food and Drug Administration,16 is a biodegradable, biocompatible, and non-immunogenic polymer matrix of NPs, and its degradation is nontoxic in nature.17 D-α-Tocopheryl polyethylene glycol 1000 succinate (TPGS), which shows high emulsification efficiency in preparations of NPs, is an excellent emulsifier with many potential applications, eg, as a solubilizer or an enhancer of the bioavailability and absorption of hydrophobic drugs.18
In this paper, poly(lactic-co-glycolic acid)-D-α-tocopheryl polyethylene glycol 1000 succinate (PLGA-TPGS), which was synthesized using PLGA and TPGS, was used as a polymer matrix for NPs. The synthetic process used and the 1H NMR spectrum of PLGA-TPGS can be found in our previous reports.19,20 In a previous report, PLGA-TPGS was used as a polymer matrix of NPs20 with the aim of refining its passive targeting properties by controlling the particle size and surface charge. Additionally, TPGS increased the aqueous solubility of hydrophobic drugs and reduced P-glycoprotein (P-gp)-mediated multiple drug resistance in cancer cells.21 Because PLGA-TPGS NPs have advantages, including better encapsulation efficiency (EE), drug loading (DL), and sustained drug release,19 they may enhance the activity and active time of RBG in the targeted organ, the liver, while reducing its aggregation and toxic effects in nontargeted organs, thereby enhancing the activities of RBG against hepatocellular carcinoma. Therefore, the purpose of the present study was to formulate RBG-loaded PLGA-TPGS nanoparticles (RPTNs) and to characterize their size, surface charge, size distribution, EE, DL, and in vitro drug release profiles. We investigated the cellular uptake of the RPTN, its inhibitory effects, and cellular apoptosis in the human liver cancer cell line HepG2. We also studied cellular uptake in the ascitic hepatocarcinoma cell strain, which exhibits high metastasis potential in the lymphatic system (HCa-F cells), and the in vivo therapeutic effect of the RPTN on HCa-F cells in solid tumor-bearing mice. We used 5-fluorouracil as the negative control drug because it is a chemotherapy drug that is commonly used for the treatment of hepatic carcinoma, and it can be injected via an intravenous route, which coincided with the delivery method chosen for the NPs. The liver-targeting profiles of drug-loaded NPs in mice were evaluated by analyzing the drug concentration in the plasma, liver, heart, spleen, lungs, and kidneys by using reverse-phase high-performance liquid chromatography (RP-HPLC) and by observing fluorescence markers in frozen slices using fluorescence inversion microscopy.
Materials and methods
Materials
RBG was provided by Dr Xiaochi Ma, and its purity was determined to be 99% by high-performance liquid chromatography (HPLC) diode array detector analysis. PLGA-TPGS molecular weight (MW: 21–22 kD) was prepared and contributed by Dr Lin Mei at the Academy of Life Sciences, Tsinghua University (Beijing, People’s Republic of China). TPGS, PLGA (50:50, MW: 40–75 kD), sodium dodecyl sulfate, ethyl acetate, polyethylene glycol 400 (PEG400), coumarin-6 (C6, purity 99%), and 3,8-diamino-5- [3-(diethylmethylammonium) propyl]-6-phenylphenanthridinium diiodide (PI) were purchased from Sigma-Aldrich (St Louis, MO, USA). Methanol and acetic acid were purchased from Tedia (HPLC grade; Fairfield, OH, USA). The 4-[3-(4-iodophenyl)-2-(4-nitrophenyl)-2H-5-tetrazolio]-1,3-benzen-sulfonate (WST-1) was obtained from Roche Applied Sciences (Basel, Switzerland). The 4,6-diamidino-2-phenylindole dihydrochloride (DAPI) was purchased from Fluka (Buche, Switzerland). For all other commercial chemicals and reagents used, the highest available quality was obtained. HepG2 cells were purchased from the Chinese Academy of Medical Sciences Cell Center. HCa-F cells were contributed by the Morphological Lab of Dalian Medical University (Dalian, People’s Republic of China).
Preparation of RPN and RPTN
RPTNs were prepared using the ultrasonic emulsification-solvent evaporation method.22 Eight milliliters of ethyl acetate organic phase was combined with a given amount of RBG, and 100 mg PLGA-TPGS was dissolved into it. It was then slowly poured into 120 mL of 0.03% (w/v) TPGS-purified aqueous phase in an ice bath while being sonicated at 100 W. After the mixture was sonicated in the ice bath for another 2 minutes at 100 W, the resulting oil-in-water single emulsion was then continuously stirred in the ice bath overnight at room temperature to remove the excess ethyl acetate. The NPs were collected by centrifugation at 20,000 rpm using a high-speed refrigerated centrifuge (Sorvall Evolution RC; Kendro Laboratory Products, Asheville, NC, USA) for 15 minutes and then washed several times with deionized water to make sure that no unloaded drug or surfactant remained. The NPs were then dispersed in 5 mL of purified water, lyophilized for 24 hours, and stored at 4°C until used for further analyses. Empty PLGA-TPGS nanoparticles (EPTNs) were prepared without any drug using the same protocol. RBG-loaded PLGA nanoparticles (RPNs) were also prepared using the same methods described earlier but using PLGA instead of PLGA-TPGS as the polymer. In addition, RBG/C6-loaded PLGA-TPGS nanoparticles (RCPTNs) to which C6 was added as a fluorescent marker were also prepared, as previously described, by adding a given amount of RBG, C6, and 100 mg PLGA-TPGS.
Characterization of NPs
Surface morphology
The surface morphologies of RPTN, RCPTN, and RPN were analyzed using transmission electron microscopy (TEM; testing conditions: accelerating voltage, 120 kV; JEM-2000EX; Japan Electron Optics Laboratory Co. Ltd, Tokyo, Japan) and scanning electron microscopy (SEM; testing conditions: accelerating voltage, 10 kV; SS 550; Shimadzu, Tokyo, Japan). To prepare samples for TEM, a small quantity of NP suspensions was placed onto copper grids covered with nitrocellulose membranes. One drop of 2.5% phosphotungstic acid was added to the surface of the copper grids. After 3 minutes of staining, any extra liquid was removed, and the copper grids were air-dried at room temperature and then loaded into TEM for imaging.23 To prepare samples for SEM, the NP-loaded surface was coated with a thin layer of gold before measurements were performed.
Size, size distribution, and surface charge
The particle sizes (including size distributions) and zeta potentials of RPTN, RCPTN, and RPN were measured using Nano ZS90 light-scattering and laser Doppler anemometry, respectively, in a Zetasizer Nano Analyzer (Zetasizer Nano ZS90; Malvern Instruments Ltd., Malvern, UK). Before the measurements were obtained, ~2 mg of lyophilized NPs was suspended in 3 mL of pure deionized water. All data were acquired as the average of six measurements.
DL, EE, and in vitro drug release
The DL of RPTN, RCPTN, and RPN was analyzed using RP-HPLC (1200 Series; Agilent Technologies, Santa Clara, CA, USA) in a Hypersil C18 column (250×4.6 mm, pore size 5 μm; Thermo, Waltham, MA, USA). The full methods are described in the “Supplementary materials” section. DL was defined as the ratio between the quantity of RBG loaded into the NPs to the quantity of the NPs, and EE was defined as the ratio of the quantity of RBG loaded into the NPs to the total RBG quantity added during the preparation procedure. All preparation procedures were performed in sextuplicate.
The in vitro release of RBG in RPTN, RCPTN, and RPN was also evaluated using the dialysis method,24 as described in the “Supplementary materials” section.
Cellular uptake of NPs
HepG2 is one of the most widely used hepatocellular carcinoma cell lines. Briefly, HepG2 cells were grown in high-glucose Dulbecco’s Modified Eagle’s Medium (Thermo Fisher Scientific, Waltham, MA, USA) supplemented with 10% fetal bovine serum (FBS; Thermo Fisher Scientific) and 1% antibiotics. HCa-F cells were grown in Roswell Park Memorial Institute-1640 (Thermo Fisher Scientific) medium that was similarly supplemented with 10% fetal bovine serum and 1% antibiotics. The cells were maintained in 5% CO2 at 37°C in an incubator.
For qualitative analyses, C6 was added as a fluorescent marker25 to RCPTN to investigate cellular uptake by HepG2 and HCa-F cells. After incubation with 200 μg/mL RCPTN suspensions and a concentration of C6 (formed using RCPTN plus a corresponding 183.2 μg/mL concentration of RBG that was dispersed into the culture medium and then sonicated at 100 W for 1 minute in an ice bath) for 4 hours at 37°C, HepG2 cells and HCa-F cells were washed three times with cold phosphate-buffered saline (PBS) and fixed with 75% ethanol (stored at −20°C) for 10 minutes. After another three washes with cold PBS, the nuclei of HepG2 cells and HCa-F cells were stained using DAPI for 15 minutes and then washed three times with cold PBS. Cellular uptake of RCPTN was observed using a confocal laser scanning microscopy (CLSM) (Leica TCS SP5; Leica Microsystems Co. Ltd., Solms, Germany).
For the quantitative analyses, all of the HepG2 cells and HCa-F cells in each well were collected and dispersed into purified water after they were observed using CLSM. The full methods used for these procedures can be viewed in the “Supplementary materials” section. The cellular uptake efficiency of RBG was determined as the ratio between the quantity of RBG measured after cellular uptake to the total quantity of RBG that was added before cellular uptake, and these analyses were performed in sextuplicate.
Cell apoptosis
Cell apoptosis was analyzed using flow cytometry and Annexin V-FITC Apoptosis Detection Kits (Thermo Fisher Scientific). HepG2 cells were seeded into six-well plates at a density of 2×10⁵ cells/mL. After incubation in 5% CO2 at 37°C for 24 hours, the cells were incubated with RPTN suspensions and RBG solution (RS; the method of the drug treatment was performed as mentioned in the “Supplementary materials” section) at 1.2, 5, and 20 μg/mL equivalent RBG concentrations. 5-Fluorouracil solution (FS) at a 20 μg/mL equivalent commercial fluorouracil concentration was simultaneously used as the positive control. After incubation for 24 hours, the cells were collected and washed three times with cold PBS. Then, the cells were resuspended in binding buffer, and 5 μL Annexin V-fluorescein isothiocyanate and 1 μL PI were added to 100 μL samples from each of the cell suspensions. After incubation for 15 minutes at room temperature, 400 μL binding buffer was added to each sample, and the samples were immediately analyzed using a fluorescence-activated cell sorter (Accuri C6; Genetimes Technology Inc., Shanghai, People’s Republic of China).
The study of in vitro cytotoxicity of the NPs and RS to the HepG2 cells was assessed using WST-1 assays and IC50 values, defined as the drug concentration at which 50% of cancer cell growth was inhibited, are described in the “Supplementary materials” section and was used to verify the NP effects in vitro.
In vivo drug concentrations and freezing slices of RCPTN were used to evaluate liver-targeting properties in mice
Pretreatment of biological samples
The Kunming Mice (Specific Pathogen Free grade) were provided by the Dalian Medical University Laboratory Animal Center (Dalian, People’s Republic of China). All of the animal experiments in this study were approved by the Institutional Animal Care and Use Committee (IACUC) (Dalian Medical University, Dalian, China). The mice were all fed standard laboratory diet and water before sacrifice, and kept in a room with constant temperature (22±1°C) and a dark-light cycle (12 h/12 h). After the drugs were injected (or not injected, in the control group), the mice were administered ether by inhalation and euthanized. The methods used to dispose of biological samples are described in the “Supplementary materials” section.
Drug administration
To ensure that the appropriate dosages of RBG were administered in vivo, the LD50 (median lethal dose) values for RBG were determined in mice according to the methods described in the “Supplementary materials” section. Six-week-old Kunming male mice weighing ~20.9±1.7 g were used for this protocol. They were fasted overnight, and three mice were sacrificed without being administered any drug. The organs (liver, heart, spleen, lungs, and kidneys) of these three mice were isolated and placed at −80°C for 20 minutes and used as the blank control group. Evaluations of the liver-targeting properties of the drug were performed using frozen tissue sections. The rest of the mice were randomly divided into two groups, all of which were administered the drug via an intravenous injection into the tail vein. In the first group (the RCPTN group), 98 mice were administered an RCPTN suspension (formed using RCPTN dispersed into 20% [v/v] PEG400 in normal saline solution that was sonicated at 100 W for 1 minute in an ice bath) at a dosage of 2 mg/kg equivalent to the RBG concentration. In the second group, the RS (20% [v/v] PEG400 in normal saline solution) group, 80 mice were administered an RS at a dosage of 2 mg/kg equivalent to the RBG concentration. After 0.08 (ie, 5 minutes), 0.5, 1, 2, 4, 8, 12, and 24 hours, ten mice from each group were administered ether by inhalation, and blood samples were obtained from the cardiac apex. The mice were then sacrificed, and their organs were isolated (liver, heart, spleen, lungs, and kidneys). The treatment regimens and analytical protocols used to obtain blood samples and organs at different time points were each performed as described earlier. For fluorescence imaging studies performed using freezing slices, three mice from the RCPTN group were sacrificed at 0.5, 1, 2, 4, 8, and 12 hours, and their organs (liver, heart, spleen, lungs, and kidneys) were isolated and placed at −80°C for 20 minutes. The freezing slices were obtained from frozen organs using a freezing microtome (HM500; Microm International GmbH, Walldorf, Germany). Each organ was separated into ten pieces, each of which was cut into ~7 μm thick sections. The fluorescence intensities of the markers analyzed in the freezing slices were observed using a fluorescence inversion microscopy (Olympus IX81; Olympus Corporation, Tokyo, Japan).
The drug concentration of RCPTN used to evaluate its liver-targeting properties in mice was determined mainly using the following detection indices: 1) The targeting index (TI) and the selectivity index (SI), where TI was defined as the ratio of the concentration of RBG in the target organ (ie, liver) of the RCPTN group to its concentration in the RS group, and where SI was defined as the ratio between the concentration of RBG in the target organ (ie, liver) to its concentration in the nontargeted organs in the RCPTN group. TI and SI were calculated at different intervals. 2) The relative targeting efficiency (Re) and the targeting efficiency (Te) were determined as the area under the concentration–time curve (AUC0–24 hours) for different organs in the RCPTN group and the RS group and calculated using the trapezoid method. Re was defined as the ratio of the AUC in the corresponding organs of the RCPTN group to the AUC in the corresponding organs in the RS group. Te was defined as the ratio of the AUC in the target organ (ie, liver) to the AUC in the nontargeted organs in both the RCPTN group and the RS group.
The pharmacokinetic study of RPTN and RPN suspensions and RS that was performed in Sprague Dawley rats is described in the “Supplementary materials” section and was used to verify the NP processes in vivo.
In vivo therapeutic effects study
Six-week-old male mice weighing ~20.8±1.6 g were inoculated intraperitoneally with HCa-F cells, and ascites were formed ~7 days later. After the extracted ascites were washed two times with PBS and adjusted to cell suspensions at a cellular concentration of 2.0–2.3×10⁷ cells/mL, the HCa-F cell suspensions were implanted subcutaneously into the right axilla of the mice at a dose of 0.01 mL/g. The axillary subcutaneous tumor growth in each mouse was frequently monitored, and 1 week later, tumors were observed to have developed in all of the mice. Thus, the subcutaneous tumor mouse model was established. The shortest diameters (a) and the longest diameters (b) of the tumors were measured using a vernier caliper. The mice with the appropriate longest diameters were chosen for the in vivo antitumor study.
When the tumors of the mice reached a longest diameter of ~14–16 mm and a weight of ~36.3±2.1 g, the mice were randomly divided into six groups of eight mice per group: a blank control group (20% [v/v] PEG400 in normal saline solution), an FS (commercial fluorouracil for injection solutions) group, an RS (20% [v/v] PEG400 in normal saline solution) group, an EPTN (EPTN suspensions) group, an RPN (RPN suspensions) group, and an RPTN (RPTN suspensions) group. The last three NP suspensions were formed using EPTN, RPN, and RPTN that were dispersed into 20% (v/v) PEG400 in normal saline solution and sonicated at 100 W for 1 minute in an ice bath. The mice in the RS, RPN, and RPTN group were administered a dose of 2 mg/kg (equivalent to approximately one-tenth of the LD50 value of RS when administered intravenously (iv) in male mice) equivalent to the RBG concentration, while the FS group received a dosage of 2 mg/kg equivalent to the fluorouracil concentration. The mice in the EPTN group were administered the same concentrations of NPs. The mice in all groups were administered the drugs via the tail vein once per day for 7 days. The following detection indexes were introduced to analyze therapeutic effects in vivo: 1) The shortest diameters (a) and the longest diameters (b) of the tumors were measured, and the volumes (V) of the tumors were calculated as V = a2 × b/2 both before and after drug administration.26 2) After 7 days of administration, all of the mice were sacrificed, and the tumors removed and weighed. The tumor growth inhibition rate (IR) was calculated as the ratio of the differential values of the average weight of the tumors in the blank control group minus the average weight of the tumors in the administration group to the average weight of the tumors in the blank control group. 3) Two tumor specimens were randomly selected in each group to be formalin-fixed and paraffin-embedded to obtain sections to use for hematoxylin and eosin (H&E) staining. These sections were then observed under the microscope. Six solid tumors were selected from the RS, RPN, and RPTN groups and weighed. Four times the volume of normal saline was applied to prepare the homogenates to process biological samples according to the methods used to determine the in vivo drug concentration for evaluating liver-targeting properties in the mice. Furthermore, the peak areas of RBG and emodin (internal standard) were determined using HPLC, and the RBG concentration was calculated according to a standard curve equation.
Statistical analysis
All data are expressed as the mean ± standard deviation. The statistical significance of differences was determined using Student’s t-test (SPSS13.0 statistical software, International Business Machines Corporation, Armonk, NY, USA), and the required level for statistical significance was set at P<0.05.
Results
Characterization of drug-loaded NPs
Surface morphology
The TEM images of the RPTN, RCPTN, and RPN prepared in this study are shown in Figure 1A. TEM revealed that the NPs were spherical and regular and that their size distribution was more or less uniform and relatively monodispersed. Furthermore, the sizes observed using TEM were in the range of 100–300 nm, and the results listed in Table 1 were validated using Nano ZS90 light scattering. The SEM images of the RPTN, RCPTN, and RPN shown in Figure 1B demonstrate that the NPs were spherical in shape with smooth surfaces and that the sizes of the NPs also varied across a range of 100–300 nm, which was similar to the results obtained using TEM.
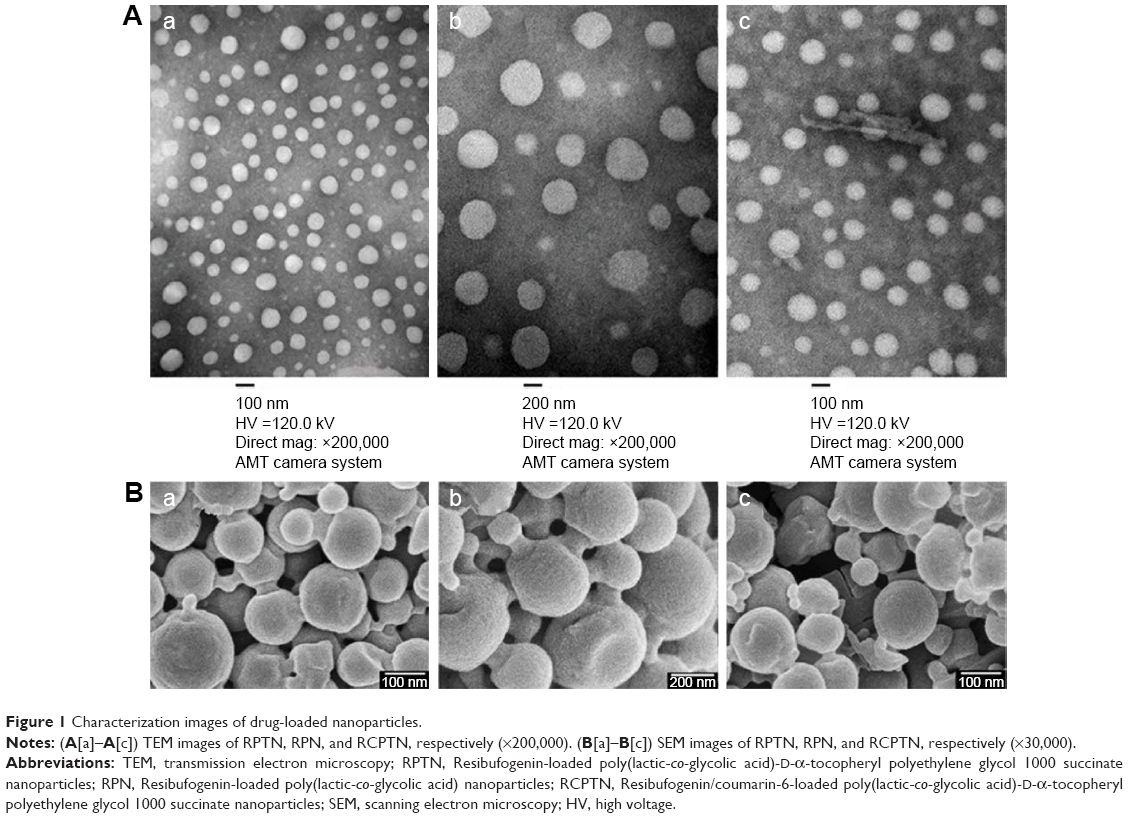 | Figure 1 Characterization images of drug-loaded nanoparticles. |
 | Table 1 Characterization of nanoparticles (n=6, mean ± SD) |
Size, size distribution, and surface charge
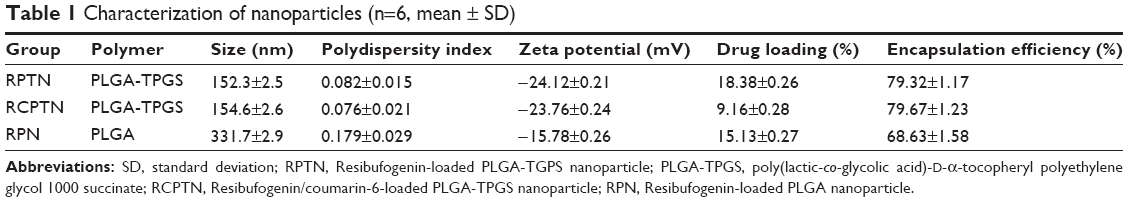
The particle sizes, size distributions, and zeta potentials of the RPTN, RCPTN, and RPN prepared in this study are listed in Table 1. The average particle sizes of the RPTN and RCPTN were 152.3±2.5 (polydispersity index [PDI] =0.082) and 154.6±3.6 nm (PDI =0.076), respectively, and both of these were much smaller than the average particle size of the RPN (331.7±3.1 nm, PDI =0.179). Additionally, the median of the size distributions of the RPTN and RCPTN was much less than that of the RPN, as shown in Figure S1. The RPTN, RCPTN, and RPN had zeta potentials of −24.12±1.31, −23.76±1.42, and −15.78±1.76 mV, respectively, and these are also listed in Table 1.
DL, EE, and in vitro drug release
The DL and EE of the RPTN, RCPTN, and RPN that were prepared in this study are also listed in Table 1. The DL of the RPTN (18.38%±0.33%) was a little higher than that of RPN (15.13%±0.47%) as a result of the fact that TPGS was added to PLGA to synthesize PLGA-TPGS as a polymer for the NPs. The DL of the fluorescent RCPTN was only 9.16%±0.41% because the amount of RBG was halved compared to that for the RPTN during the preparation procedure.
The in vitro accumulative drug release profiles of the RPTN, RCPTN, and RPN that were prepared in this study are shown in Figure 2. Drug release from all the three types of NPs occurred in a biphasic release manner with an initial burst phase followed by a sustained release phase in comparison to raw RBG (with an expeditious release of 98.78% in the first 2 days). As shown in Figure 2, an initial burst phase corresponding to 54.81% and 54.75% for RPTN and RCPTN, respectively, was observed within the first 3 days, while RPN showed an initial burst phase of 48.17%. After 30 days, the accumulative drug release for RPTN and RCPTN reached 86.78% and 85.99%, respectively, which was significantly faster than that for RPN, at 72.35% (approaching ~14.43% increase in drug release, P<0.05).
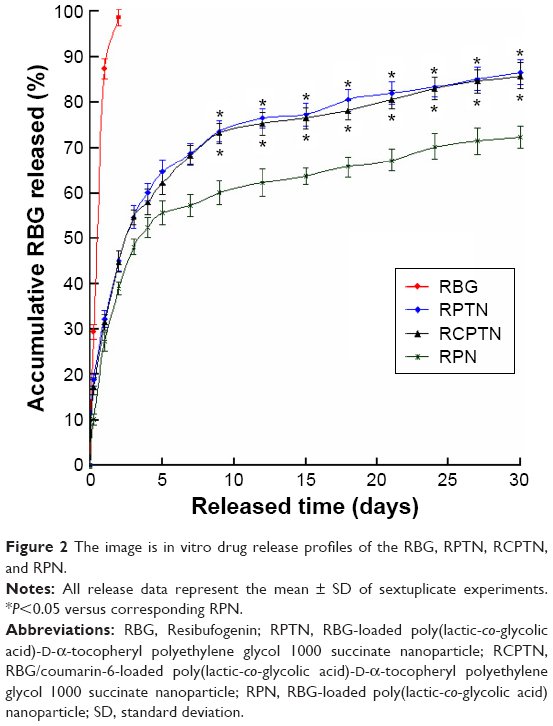 | Figure 2 The image is in vitro drug release profiles of the RBG, RPTN, RCPTN, and RPN. |
Cellular uptake of NPs
Figure 3 shows images obtained using CLSM of HepG2 cells and HCa-F cells after incubation with 200 μg/mL RCPTN for 4 hours at 37°C. As shown in Figure 3, the entire cell in both types of cancer cells, especially the cytoplasm, exhibited strong green fluorescence, indicating that RCPTN had been internalized into the cancer cells both efficiently and rapidly, and the nuclei of the HepG2 cells and HCa-F cells showed blue fluorescence (DAPI; Figure 3A and B). Furthermore, the concentration of RBG that was taken up by the HepG2 cells and HCa-F cells was 112.39±0.89 and 96.30±0.74 μg/mL (n=6), respectively, while the cellular uptake efficiency of RBG in HepG2 cells and HCa-F cells was 61.35%±1.34% and 52.57%±0.98% (n=6), respectively. To determine whether RPTN is uptaken by normal cells in the liver, we also used human hepatic sinusoidal endothelial cells to study the cellular uptake of RCPTN, and the results of these analyses are shown in Figure S2.
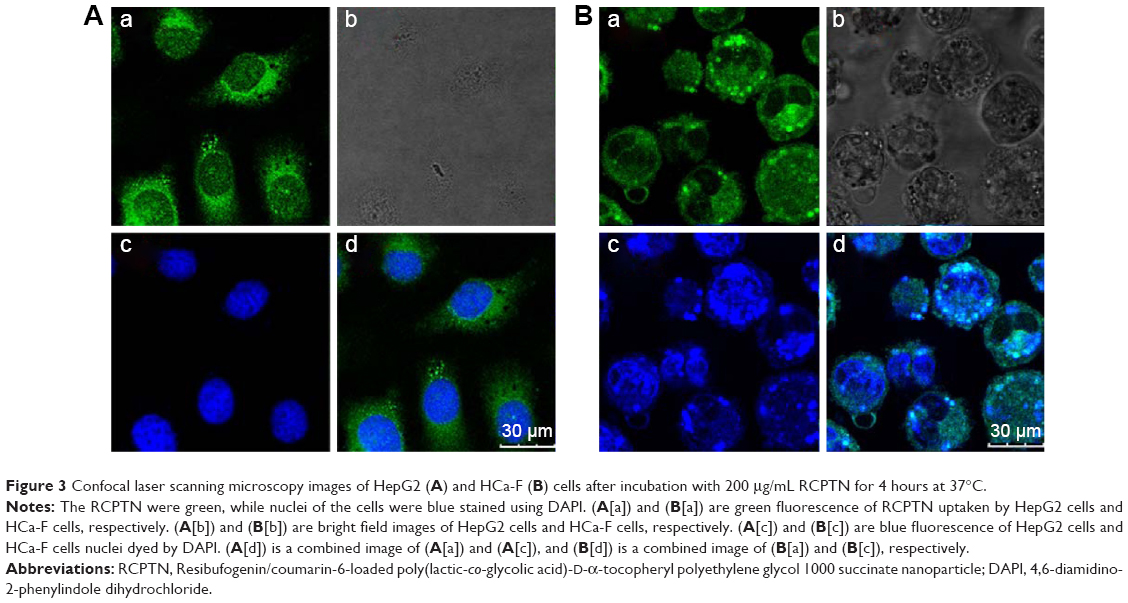 | Figure 3 Confocal laser scanning microscopy images of HepG2 (A) and HCa-F (B) cells after incubation with 200 μg/mL RCPTN for 4 hours at 37°C. |
Cell apoptosis
To determine whether the reduction in HepG2 cell viability was due to apoptosis, Annexin V-fluorescein isothiocyanate/PI double staining flow cytometry was performed. The percentages of apoptotic HepG2 cells that were induced by RPTN, RS, and FS after 24 hours are listed in Table 2. As shown in Table 2, the ratios of apoptotic and necrotic cells in the negative control group were very low, while in the RPTN and RS groups (at 5 and 20 μg/mL), the ratio of apoptotic cells increased as the drug dose increased, exhibiting a dose-dependent effect and a significant difference compared to the FS group (P<0.01). Figure S3 describes the in vitro cell viability of HepG2 cells that were cultured with RPTN, RPN, and RS at the same RBG concentrations, also shown in the “Supplementary materials” section. As listed in Table S1, the IC50 values of RPTN and RPN were both significantly lower than that of FS at 48 and 72 hours. In addition, the LD50 values of RS and RPTN were 18.9 and 38.2 mg/kg, respectively, when administered iv in male mice.
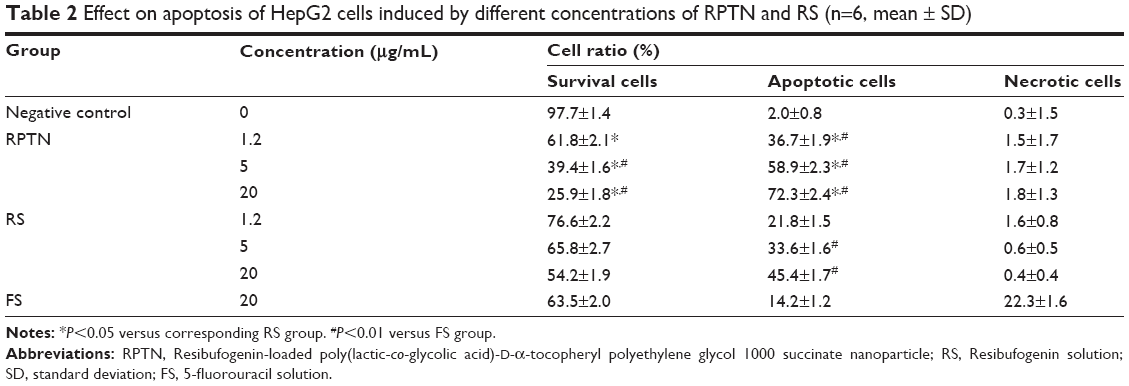 | Table 2 Effect on apoptosis of HepG2 cells induced by different concentrations of RPTN and RS (n=6, mean ± SD) |
In vivo drug concentrations of RBG and detection indexes used to evaluate the liver-targeting properties of RCPTN in mice
After mice were iv administered RCPTN or RS, the concentration of RBG in the plasma and in different organs was simultaneously analyzed using RP-HPLC. The RBG concentration–time column images for plasma and different organs in the RCPTN and RS groups are shown in Figure 4. RCPTN demonstrated a slow release profile for RBG of 8 hours in the plasma and 24 hours in the liver, while the retention for RBG was only ~4 hours in the plasma and 1 hour in the liver for the RS group, indicating that RCPTN may not only prolong the retention time of RBG in the liver and plasma but also significantly enhance the concentration of the drug in the liver.
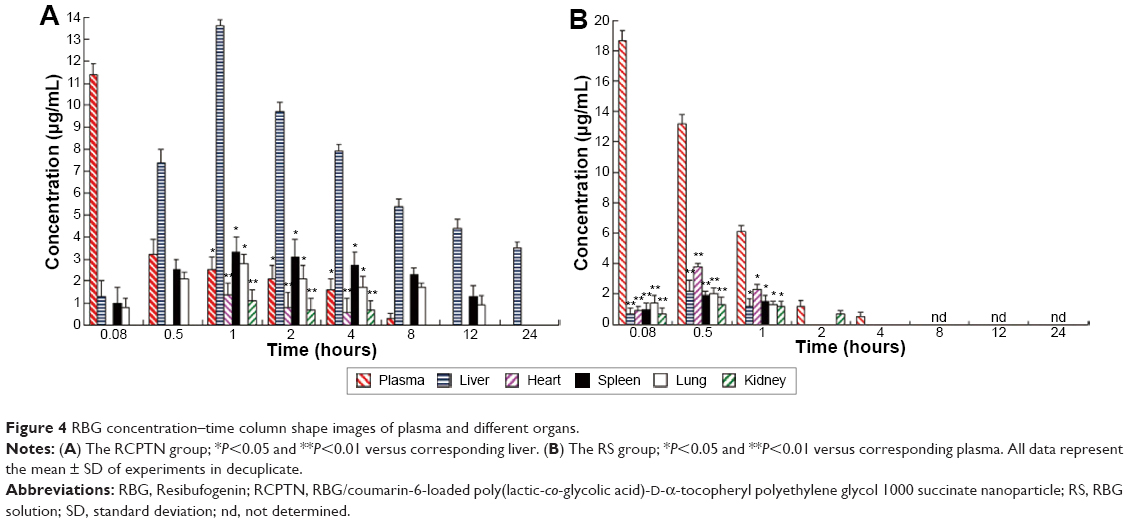 | Figure 4 RBG concentration–time column shape images of plasma and different organs. |
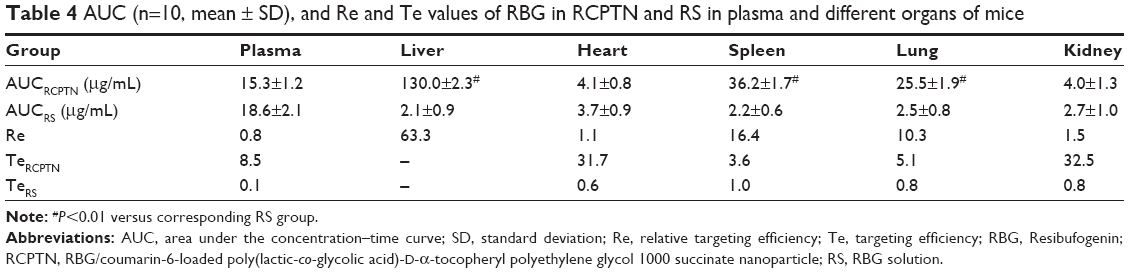
Detection indexes (TI, SI, Re, and Te) were used to evaluate the liver-targeting properties of RCPTN in mice. As shown in Table 3, TI and SI were both >1 at the different time points, except for SI at 0.08 hours, indicating that RCPTN demonstrated good liver-targeting properties. The Re for the liver was much greater than the Re for the plasma and other organs, supporting the desirable liver-targeting properties of RCPTN (Table 4). As listed in Table 4, the Te for the RCPTN group was >3, indicating that the AUC for the liver was more than three times the AUC for the plasma and other organs, while the Te for the RS group was <1, indicating that the AUC for the liver was less than two times the AUC values for the plasma and other organs. Our results demonstrate that RCPTN has excellent liver-targeting properties.
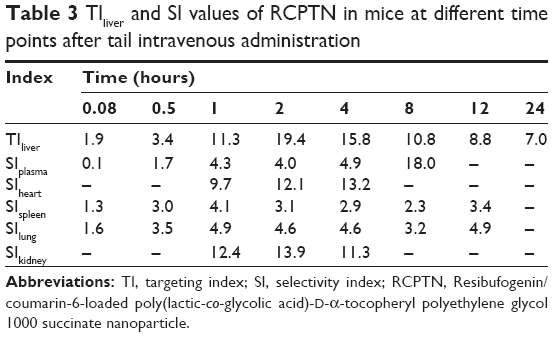 | Table 3 TIliver and SI values of RCPTN in mice at different time points after tail intravenous administration |
 | Table 4 AUC (n=10, mean ± SD), and Re and Te values of RBG in RCPTN and RS in plasma and different organs of mice |
Fluorescence imaging was used to study frozen sections to evaluate the liver-targeting properties of RCPTN in mice
Fluorescence inversion microscopy images (×200) of the organs (liver, heart, spleen, lungs, and kidneys) are shown in frozen sections obtained from mice in the blank control group and the RCPTN group at 0.5, 1, 4, 8, and 12 hours in Figures 5 and S4–S7. The green fluorescence of RCPTN was mostly localized in the liver, followed by the lungs and spleen, and the lowest levels were observed in the heart and kidneys, indicating that the better liver-targeting properties of RCPTN and NPs may reduce their toxic side effects in the heart and kidneys. However, there was a little green fluorescence in the lungs and spleen for the larger-sized particles (>400 nm), and the smaller-sized particles (<50 nm) could potentially be uptaken by macrophages in the lungs and spleen. Moreover, images of all of the organs were taken from freezing slices, and the strongest green fluorescence was observed at 1 hour, followed by 2, 4, 0.5, and 8 hours, and the weakest signal was observed at 12 hours. These results were in agreement with the results for the detection indexes for drug concentrations, and they further indicate that the liver-targeting properties of RCPTN are excellent in mice. RBG-loaded NPs eliminated slowly in rats, the mean retention time of RPTN and RPN was 3.051- and 1.892-fold greater than RS, and at the same time, the half-life time was 3.634- and 2.571-fold greater than RS. The main pharmacokinetic parameters are listed in Table S2.
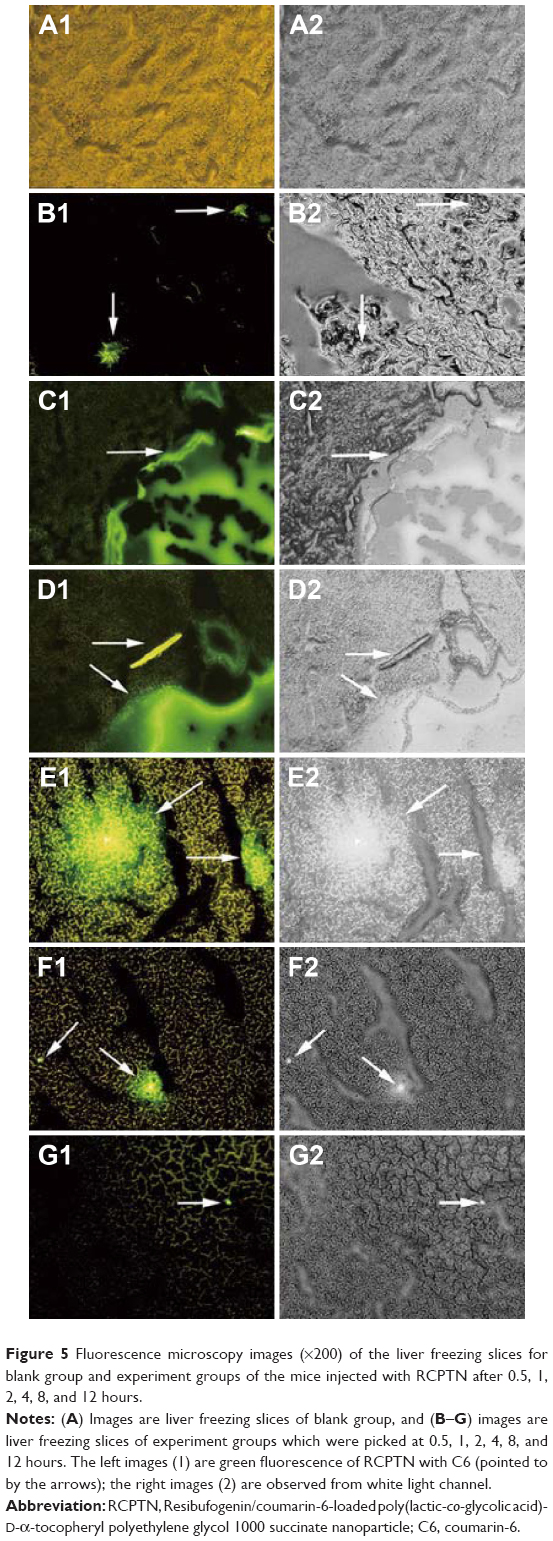 | Figure 5 Fluorescence microscopy images (×200) of the liver freezing slices for blank group and experiment groups of the mice injected with RCPTN after 0.5, 1, 2, 4, 8, and 12 hours. |
Therapeutic effect in vivo
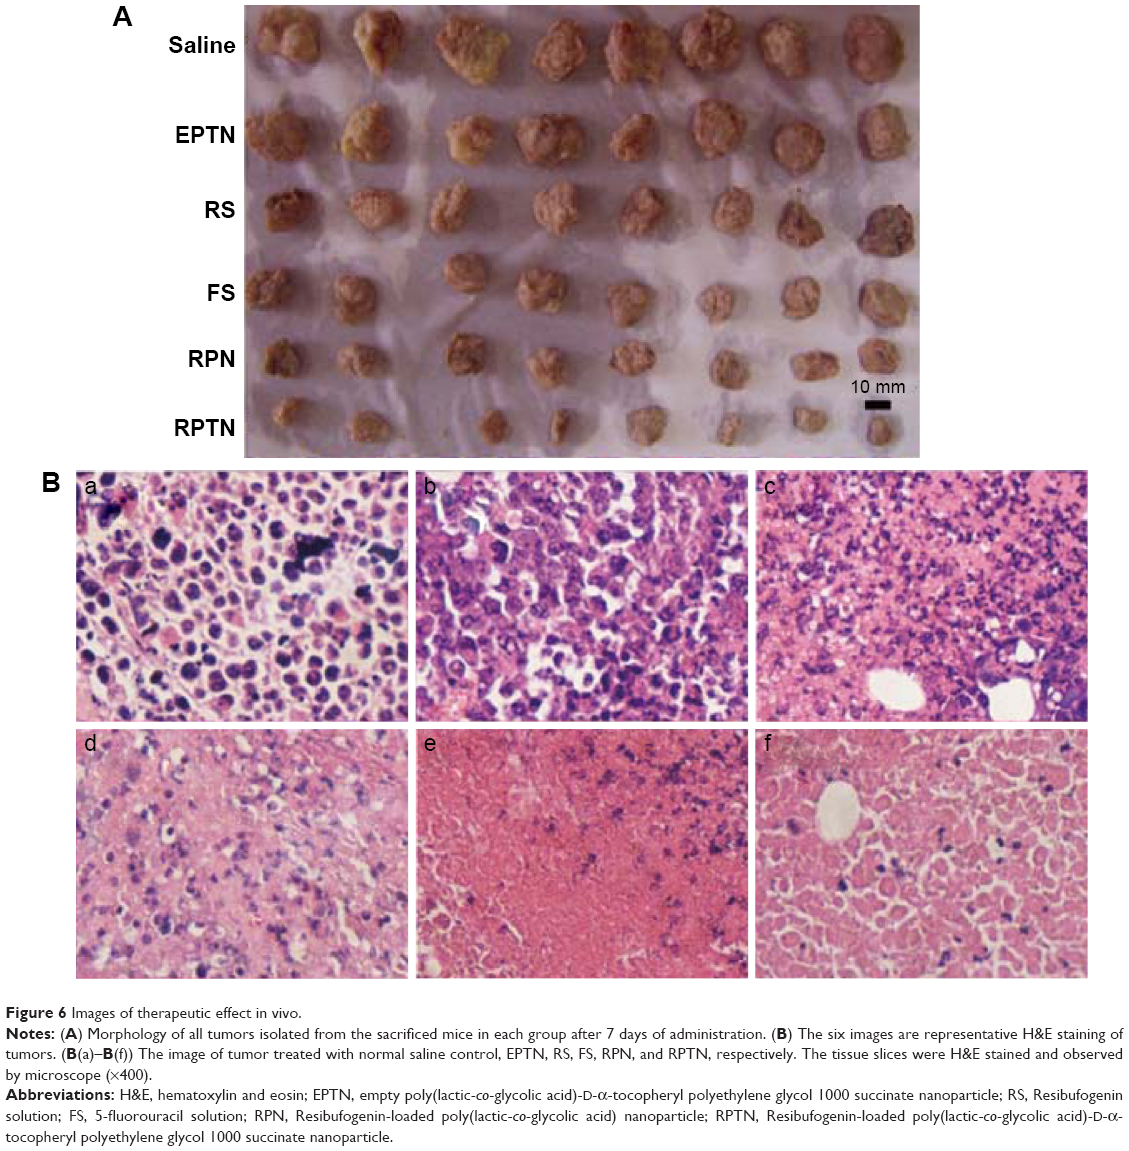
To investigate the therapeutic effects of the preparations in vivo, a solid tumor-bearing mouse model was established in which ascitic hepatocarcinoma cell strain HCa-F cells were implanted subcutaneously into mice. Figure 6A shows the morphology of all of the tumors that were isolated from the sacrificed mice in each group at 7 days after administration. The tumors in the blank control saline group were the largest, while those in the RPTN group were the smallest, indicating efficient inhibition. The tumors in the other groups (the EPTN, RS, FS, and RPN groups) were between the control and RPTN values and gradually decrease in the order listed.
 | Figure 6 Images of therapeutic effect in vivo. |
Incremental tumor volumes and the tumor IRs observed in the various groups at the termination of the experiment are listed in Table 5. Our results demonstrate that at 7 days after administration, the incremental tumor volumes in the mice in the FS, RPN, and RPTN groups were significantly (P<0.05) smaller than the volume in the blank control group (saline), whereas the tumor volume in the RS group was not significantly (P>0.05) different from that of the blank control group. The tumor IR in the RPTN group was 64.93%, which was much higher than the RPN group (51.64%), the FS group (37.19%), and the RS group (31.60%). The tumor IR in the EPTN group was only 2.12%. The weights of the mice in each group increased a small amount over time. The reason for this increase was that the weights of the mice in the negative group increased with the growth of tumors, while the weights of the mice in the experimental groups were increased by normal growth as a result of the effects of the drugs. The weights of the mice had reached ~36.3±2.1 g at the time they were sacrificed. However, a certain amount of error is expected when measuring the longest and shortest diameter of solid tumors because they have irregular shapes and they are often hollow inside. Meanwhile, the RBG per gram in the solid tumors obtained from the RPTN group was significantly higher than the RBG per gram in the RS group and the RPN group (37.87- and 2.06-fold, respectively). The results listed in Table 5 are consistent with the results shown in Figure 6A.
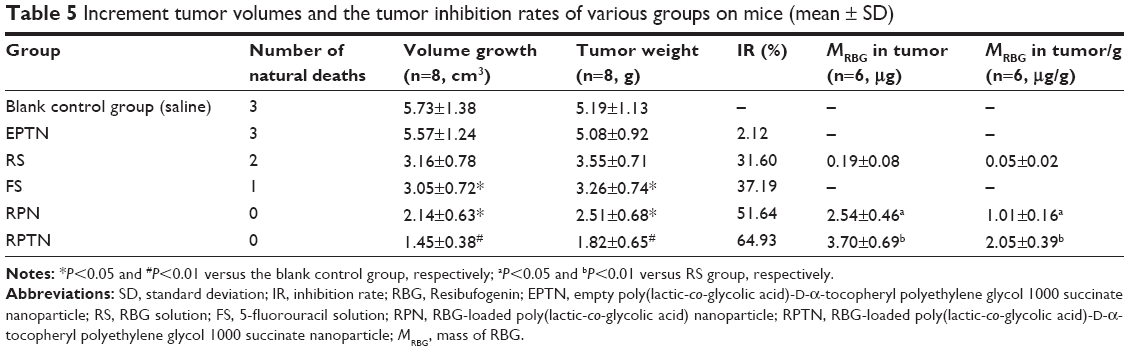 | Table 5 Increment tumor volumes and the tumor inhibition rates of various groups on mice (mean ± SD) |
As shown in Figure 6B, the conditions relating to cell growth and apoptosis in solid tumors in the various groups were analyzed using H&E staining of tumor sections. Figure 6B(a) and B(b) shows tissues obtained from the blank control saline group and the EPTN group, respectively, and show vigorous growth, a dense distribution of tumor cells, and clear cellular structures with single or dual nuclei remaining in the middle. Figure 6B(c) shows tissues obtained from the RS group, in which the number of tumor cells was decreased and only a few cells showed complete sets of the indicated cellular structures. Figure 6B(d) shows tissues obtained from the FS group, in which changes in the number of cells and the types of structures within the cells were clearly observed, indicating necrosis in these tissues and the complete or partial loss of nuclei. Figure 6B(e) shows tissues obtained from the RPN group, in which most of the cells were similar to those shown in Figure 6B(d) and in which necrosis and the decrease in the number of cells are more obvious. Figure 6B(f) shows tissues from the RPTN group, in which almost all of the cells have lost their nuclei and broken up into fragments with fuzzy edges, indicating that RPTN demonstrated effective inhibitory activity against the growth of tumor cells.
Discussion
For the first time, we have shown that RPTN can be successfully prepared using PLGA-TPGS as the polymer matrix. TPGS was also used as an emulsifier to reduce side effects and to enhance DL of RBG. The preparation method was simple and easy to perform, and we obtained a considerable DL of 18.38% and an EE of 79.32%. This may have been due to the higher emulsification efficiency of TPGS compared to other materials, such as polyvinyl alcohol.27 The particle size and surface charge of the NPs played an important role in our evaluation of drug release in vitro and in cellular uptake, cell cytotoxicity, and drug distribution in vivo.28 It has been reported that as the particle size increases, the ability of the particles to permeate through the cell membrane should decrease, with a cutoff at ~500 nm.29,30 The sizes of the NPs prepared in this study were 100–300 nm, which is within the size range that is advantageous for hepatocellular uptake of NPs.31–33 The RPTNs were much smaller, and their surfaces were rougher and more porous than those of the RPN. This could have been caused by a self-emulsifying effect, resulting in a smaller size and narrower particle size distribution for RPTN than RPN when PLGA and TPGS were mixed in the preparations containing RPTN. Moreover, the RPTNs that were freeze-dried with the help of TPGS were more easily and thoroughly dispersed than RPN, and this could have resulted in the RPTN being smaller in size, as listed in Table 1.
Maintaining the sinking condition plays an important role in drug release experiments in vitro for poorly aqueous-soluble drugs such as RBG.34 In this study, the sink condition was guaranteed by the addition of sodium dodecyl sulfate to the release medium PBS and by frequent changes with fresh release medium PBS. A typically biphasic release manner was exhibited for RPTN, RCPTN, and RPN, and the initial burst phase was mainly owing to the drug being weakly bound beneath the peripheral area of the NPs. The sustained release phase was due to the drug being incorporated inside the NPs. The release data for RCPTN were similar to those for RPTN, and for both, we used PLGA-TPGS as the polymer. Moreover, the accumulative drug release profile for RPTN and RCPTN after 30 days was significantly faster than the profile of RPN, and this is likely attributable to the lower molecular weight and higher hydrophilicity of PLGA-TPGS compared to PLGA. The accumulative drug release profile showed that RPN was significantly slower than RPTN and RCPTN. This was because both PLGA and RBG could not be dissolved in water, and both of them were lipophilic. RBG was therefore not easily released from the PLGA material. However, TPGS was an amphiphilic compound, with a part of the molecule in the RPTN and RCPTN preparations (ie, vitamin E) showing lipophilicity and the other part (ie, PEG) showing hydrophilicity. When the PLGA was blended with TPGS, which was used as an NP carrier, the RPTN and RCPTN became more hydrophilic and therefore decomposed more quickly. Because TPGS afforded an aqueous environment and a porous surface, the drug could be released more quickly from the material.35
The internalization of NPs in cancer cells more or less reflects the therapeutic effect of the NPs being analyzed. In the present study, we have, for the first time, used the fluorescent marker C6, which was added with the nonfluorescent drug RBG during the preparation of RCPTN, to visualize cellular uptake of RCPTN. We performed these experiments because C6 has high fluorescence ability, a low leaking rate, and perfect biocompatibility. The green fluorescence of RCPTN was internalized by cancer cells and directly visualized using CLSM, which indicated that RCPTN and C6 were both internalized into cells. At the same time, the cellular uptake efficiency of RBG in HepG2 cells and HCa-F cells was 61.35% and 52.57%, respectively, and the recovery rates were 99.7% and 99.2% (n=6), respectively, indicating that RBG was internalized into cancer cells along with C6. The study of cellular uptake of RCPTN by HepG2 and HCa-F cells revealed that RCPTN was efficiently internalized into cancer cells and that the entrapped drug, RBG, was released from the NPs and allowed to exert its therapeutic effect. These results laid the foundation for further in vitro investigations of the cytotoxicity of RPTN in HepG2 cells. RBG was soluble in ethyl acetate, so RBG was completely dissolved into ethyl acetate after the cells were destroyed using ultrasound. RCPTN was prepared with the main drug RBG and the fluorescent marker C6, both simultaneously entrapped within the NPs. RBG and C6 could therefore be simultaneously internalized into cells, which made it possible to determine the efficiency of cellular uptake of RBG by using quantitative HPLC and by qualitatively observing the strong green fluorescence of C6 in these two kinds of cancer cells at the same time.
Analyses of cell apoptosis are relevant to the occurrence and progress of tumors. With the increase in the amount of research on the regulation of apoptosis genes in tumor cells, RBG has been shown to induce apoptosis in various types of cancer cells.9 However, research on cell apoptosis resulting from RBG formulations has been limited. For the first time, we have completed a series of studies that showed that the ratio of apoptotic HepG2 cells was higher in the RPTN group than in the RS group, mainly as a result of the efficient cellular uptake of RPTN. The NPs were taken up into the cells, and RBG was then slowly released from the NPs to induce its apoptotic effects. However, the mechanism of cell apoptosis induced by RPTN will need further study.
The RCPTN prepared for this study clearly prolonged the retention time of RBG in the liver and plasma and significantly improved the concentration of the drug in the liver. This was attributed to a sustained release effect and the liver-targeting properties of RCPTN. As shown in Figure 4, in the RCPTN group, slow release of RBG over 4 hours was observed in plasma, while RBG was retained for only ~1 hour in plasma in the RS group. However, the retention time for RBG in the liver was 24 hours in the RCPTN group and only 1 hour in the RS group. Moreover, only a small amount of green fluorescence was observed in the lungs and spleen, and this was caused by differences in the sizes of the NPs, which could be uptaken by macrophages in the lungs or spleen. In the future, we could more precisely control the size range of the RCPTNs to decrease their effects on the lungs and spleen.
Fluorescence intensity was analyzed in RCPTN using fluorescence imaging of frozen tissue slices obtained at different time points, and these results were in agreement with the results found in the analyses of detection indexes for drug concentration that were used to evaluate the liver-targeting properties of RCPTN in mice. Both theses methods indicated that NPs accumulated primarily in the liver after ~1 hour and that the drug was slowly induced to be released from the NPs by enzymes to exert its therapeutic effect. The texture of the organ tissues in the RCPTN group was clearly changed compared to the texture of tissues in the blank control group, especially at 1, 2, and 4 hours. It was necessary to make these distinctions using fluorescence microscopy, because under bright field microscopy, some of the organ slices appeared to show fluorescence as a result of the strong green fluorescence of RCPTN. Most of the RCPTN gathered together and emitted a strong green fluorescence signal, and this made it easier to observe the fluorescence in these samples, even under bright field microscopy.
For the first time, RCPTN was prepared and combined with C6, a fluorescent marker, to observe changes in the in vivo biodistribution of the NPs using the frozen slices method, both quantitatively and subjectively. RCPTN was prepared by loading the drug RBG and the fluorescent marker C6, both of which were simultaneously entrapped in the polymer PLGA-TPGS. RBG and C6 therefore gained access to the organs simultaneously, which made it possible to quantitatively determine the concentration of the main drug RBG using the HPLC method and to qualitatively monitor the fluorescence intensity of C6 in different organs in freezing slices at the same time points. Moreover, changes in the concentration of RBG coincided with trends observed in the changes in C6 fluorescence intensity. In this way, the targeting properties of a nonfluorescent drug such as RBG can be evaluated in vivo both quantitatively and qualitatively, and this lays the foundation for future in vivo pharmacodynamic evaluations.
Figure 6A and B shows that the RPTN group had a better inhibitory effect against the growth of tumor cells than the other groups, which is consistent with the data in Table 5. Furthermore, the in vivo study also demonstrated that RPTN maintained and even showed much better pharmacological activity in this formulation of NPs. However, the EPTN group was not significantly different from the blank control group, and this further demonstrated that the synthesized PLGA-TPGS copolymer was biocompatible and nontoxic, in agreement with the results shown in Figure S3 for the in vitro cytotoxicity assays.
Compared to the RS group, both the RPTN and RPN groups showed a significant difference not only in the in vitro cytotoxicity assays but also in in vivo anticancer efficacy at the same dosage of RBG. These results were mainly attributed to the sustained drug release profiles and the higher cellular uptake rates of these NPs. Nevertheless, RPTN displayed much better in vivo anticancer efficacy and higher cytotoxicity in vitro against HepG2 cells than were observed for RPN, and these results were certainly due to the smaller particle size of RPTN, its larger surface electric properties, and its higher level of DL. Importantly, TPGS, which can increase cellular uptake by suppressing P-gp, was synthesized with PLGA to construct a new copolymer, PLGA-TPGS, and this was added to the preparation of RPTN as an emulsifier. Moreover, compared to the FS group, the RPTN group exhibited better effects not only in the in vitro cytotoxicity assays but also in in vivo anticancer efficacy at the same dosage as 5-fluorouracil, and this result was mainly attributed to the same reasons mentioned earlier.
Conclusion
A novel type of RPTN was successfully prepared and used to treat liver cancer both in vitro and in vivo. RPTN, RCPTN, and RPN were prepared using an ultrasonic emulsification-solvent evaporation technique. The particles had a spherical morphology and a negative surface charge, and the sizes of the RPTN and RCPTN were ~150 nm, while the size of the RPN was ~300 nm. All of the NPs exhibited typically biphasic release profiles, and the accumulative drug release of RPTN and RCPTN after 30 days was significantly higher than that of RPN. The study of cellular uptake of RCPTN by HepG2 cells revealed that RCPTN was efficiently internalized into cancer. The WST-1 assay results showed that the synthesized PLGA-TPGS copolymer appears to be biocompatible and nontoxic, and RPTN showed better cytotoxic effects against HepG2 cells than RPN. The ratio of apoptotic HepG2 cells in the RPTN group was higher than the ratio in the RS group, mainly because of the efficient cellular uptake of RPTN. The LD50 value of RPTN was 2.02-fold higher than the value for RS, demonstrating that the NPs reduced the toxicity of RBG. The in vivo biodistribution of RCPTN revealed that it has excellent liver-targeting properties. RPTN had the longest retention time and the highest t1/2(β), but it also had a lower AUC than RPN and RS in rat blood circulation. RPTN exhibited much better in vivo anticancer efficacy than RPN. Thus, RPTN may be an alternative and promising dosage form for the treatment of liver cancer.
Acknowledgments
This work was supported by the Natural Science Foundation of Liaoning Province, People’s Republic of China (No. 2015020308) and the National Natural Science Foundation of China (No. 81473334), Distinguished Professor of Liaoning Province, Liaoning BaiQianWan Talents Program, Outstanding Youth Science and Technology Talents of Dalian (2014J11JH132 and 2015J12JH201), and the Innovation Team of Dalian Medical University. The authors are also grateful for material support provided by Dr Lin Mei, who works at Tsinghua University.
Disclosure
The authors report no conflicts of interest in this work.
References
El-Serag HB. Hepatocellular carcinoma: an epidemiologic view. J Clin Gastroenterol. 2002;35(Suppl 2):S72–S78. | ||
Markus PR. Drug therapy for advanced-stage liver cancer. Liver Cancer. 2014;3:125–131. doi:10.1159/000343868. | ||
Liu J, Qian LX. Therapeutic efficacy comparison of radiofrequency ablation in hepatocellular carcinoma and metastatic liver cancer. Exp Ther Med. 2014;7(4):897–900. doi:10.3892/etm.2014.1505. | ||
Li D, Kang J, Madoff DC. Locally ablative therapies for primary and metastatic liver cancer. Expert Rev Anticancer Ther. 2014;14(8):931–945. doi:10.1586/14737140.2014.911091. | ||
Baek YH, Kim KT, Lee SW, et al. Efficacy of hepatic arterial infusion chemotherapy in advanced hepatocellular carcinoma. World J Gastroenterol. 2012;18(26):3426–3434. doi:wjg.v18.i26.3426. | ||
Zhang DM, Liu JS, Deng LJ, et al. Arenobufagin, a natural bufadienolide from toad venom, induces apoptosis and autophagy in human hepatocellular carcinoma cells through inhibition of PI3K/Akt/mTOR pathway. Carcinogenesis. 2013;34(6):1331–1342. doi:10.1093/carcin/bgt060. | ||
Qiu DZ, Zhang ZJ, Wu WZ, Yang YK. Bufalin, a component in Chansu, inhibits proliferation and invasion of hepatocellular carcinoma cells. BMC Complement Altern Med. 2013;13:185. doi:10.1186/1472-6882-13-185. | ||
The State Pharmacopoeia Commission of People’s Republic of China. Pharmacopoeia of People’s Republic of China, Vol. 1. Beijing: Chemical Industry Press; 2010:360. | ||
Kamano Y, Kotake A, Hashima H, et al. Structure-cytotoxic activity relationship for the toad poison bufadienolides. Bioorg Med Chem. 1998;6(7):1103–1115. doi:10.1016/S0968-0896(98)00067-4. | ||
Ma XC, Xin XL, Liu KX, Han J, Guo DA. Microbial transformation of cinobufagin by Syncephalastrum racemosum. J Nat Prod. 2008;71(7):1268–1270. doi:10.1021/np 800210a. | ||
Li L, Li P, Ye M, Zhong L, Guo D. Cytotoxic Resibufogenin transformation products from cell suspension cultures of Platycodon grandiflorum. Lett Org Chem. 2004;1(2):176–178. doi:10.2174/1570178043488509. | ||
Bick RJ, Poindexter BJ, Sweney RR, Dasgupta A. Effects of Chan Su, a traditional Chinese medicine, on the calcium transients of isolated cardiomyocytes: cardiotoxicity due to more than Na, K-ATPase blocking. Life Sci. 2002;72(6):699–709. doi:10.1016/S0024-3205(02)02302-0. | ||
Xie JT, Dey L, Wu JA, Lowell TK, Yuan CS. Cardiac toxicity of resibufogenin: electrophysiological evidence. Acta Pharmacol Sin. 2001;22(4):289–297. | ||
Wang X, Yang L, Chen ZG, Shin DM. Application of nanotechnology in cancer therapy and imaging. CA Cancer J Clin. 2008;58(2):97–110. doi:10.3322/CA.2007.0003. | ||
Chakraborty M, Jain S, Rani V. Nanotechnology: emerging tool for diagnostics and therapeutics. Appl Biochem Biotechnol. 2011;165(5–6):1178–1187. doi:10.1007/s12010-011-9336-6. | ||
Jain RA. The manufacturing techniques of various drug loaded biodegradable poly(lactide-co-glycolide) (PLGA) devices. Biomaterials. 2000;21(23):2475–2490. doi:10.1016/S0142-9612(00)00115-0. | ||
Zimmer A, Kreuter J. Microspheres and nanoparticles used in ocular delivery systems. Adv Drug Deliv Rev. 1995;16:61–73. doi:10.1016/0169-409X(95)00017-2. | ||
Feng SS, Mei L, Anitha P, Gan CW, Zhou W. Poly(lactide)–vitamin E derivative/montmorillonite nanoparticle formulations for the oral delivery of Docetaxel. Biomaterials. 2009;30:3297–3306. doi:10.1016/j.biomaterials.2009.02.045. | ||
Ma Y, Zheng Y, Liu K, et al. Nanoparticles of poly (lactide-co-glycolide)-d-a-tocopheryl polyethylene glycol 1000 succinate random copolymer for cancer treatment. Nanoscale Res Lett. 2010;5(7):1161–1169. doi:10.1007/s11671-010-9620-3. | ||
Chen HB, Zheng Y, Tian G, et al. Oral delivery of DMAB-modified docetaxel-loaded PLGA-TPGS nanoparticles for cancer chemotherapy. Nanoscale Res Lett. 2011;6(1):4. doi:10.1007/s11671-010-9741-8. | ||
Fischer JR, Harkin KR, Freeman LC. Concurrent administration of water-soluble vitamin E can increase the oral bioavailability of cyclosporine a in healthy dogs. Vet Ther. 2002;3(4):465–473. | ||
Mei L, Zhang Y, Zheng Y, et al. A novel docetaxel-loaded poly (ε-caprolactone)/pluronic F68 nanoparticle overcoming multidrug resistance for breast cancer treatment. Nanoscale Res Lett. 2009;4(12):1530–1539. doi:10.1007/s11671-009-9431-6. | ||
Mukerjee A, Vishwanatha JK. Formulation, characterization and evaluation of curcumin-loaded PLGA nanospheres for cancer therapy. Anticancer Res. 2009;29(10):3867–3876. | ||
Leo E, Cameroni R, Forni F. Dynamic dialysis for the drug release evaluation from doxorubicin-gelatin nanoparticle conjugates. Int J Pharm. 1999;180(1):23–30. doi:10.1016/S0378-5173(98)00401-3. | ||
Win KY, Feng SS. Effects of particle size and surface coating on cellular uptake of polymeric nanoparticles for oral delivery of anticancer drugs. Biomaterials. 2005;26(15):2713–2722. doi:10.1016/j.biomaterials.2004.07.050. | ||
Zhu Z, Li Y, Li X, et al. Paclitaxel-loaded poly (N-vinylpyrrolidone)-b-poly(ε-caprolactone) nanoparticles: preparation and antitumor activity in vivo. J Control Release. 2010;142(3):438–446. doi:10.1016/j.jconrel.2009.11.002. | ||
Feng SS, Zhao L, Zhang Z, et al. Chemotherapeutic engineering: vitamin E TPGS-emulsified nanoparticles of biodegradable polymers realized sustainable paclitaxel chemotherapy for 168 h in vivo. Chem Eng Sci. 2007;62(23):6641–6648. doi:10.1016/j.ces.2007.08.006. | ||
Perrault SD, Walkey C, Jennings T, Fischer HC, Chan WC. Mediating tumor targeting efficiency of nanoparticles through design. Nano Lett. 2009;9(5):1909–1915. doi:10.1021/nl900031y. | ||
Florence AT. Nanoparticle uptake by the oral route: fulfilling its potential? Drug Discov Today Technol. 2005;2(1):75–81. doi:10.1016/j.ddtec.2005.05.019. | ||
Norris DA, Puri N, Sinko PJ. The effect of physical barriers and properties on the oral absorption of particulates. Adv Drug Deliv Rev. 1998;34(2–3):135–154. doi:10.1016/S0169-409X(98)00037-4. | ||
Zhang ZR, He Q. Study on liver targeting and hepatocytes permeable valaciclovir polybutylcyanoacrylate nanoparticles. World J Gastroenterol. 1999;5(4):330–333. | ||
Owens DE 3rd, Peppas NA. Opsonization, biodistribution, and pharmacokinetics of polymeric nanoparticles. Int J Pharm. 2006;307(1):93–102. doi:10.1016/j.ijpharm.2005.10.010. | ||
Cho CS, Kobayashi A, Takei R, Ishihara T, Maruyama A, Akaike T. Receptor-mediated cell modulator delivery to hepatic using nanoparticles coated with carbohydrate-carrying polymers. Biomaterials. 2001;22(1):45–51. | ||
Klose D, Delplace C, Siepmann J. Unintended potential impact of perfect sink conditions on PLGA degradation in microparticles. Int J Pharm. 2011;404(1–2):75–82. doi:10.1016/j.ijpharm.2010.10.054. | ||
Zhu H, Chen H, Zeng X, et al. Co-delivery of chemotherapeutic drugs with vitamin E TPGS by porous PLGA nanoparticles for enhanced chemotherapy against multi-drug resistance. Biomaterials. 2014;35(7):2391–2400. doi:10.1016/j.biomaterials.2013.11.086. |
 © 2016 The Author(s). This work is published and licensed by Dove Medical Press Limited. The full terms of this license are available at https://www.dovepress.com/terms.php and incorporate the Creative Commons Attribution - Non Commercial (unported, v3.0) License.
By accessing the work you hereby accept the Terms. Non-commercial uses of the work are permitted without any further permission from Dove Medical Press Limited, provided the work is properly attributed. For permission for commercial use of this work, please see paragraphs 4.2 and 5 of our Terms.
© 2016 The Author(s). This work is published and licensed by Dove Medical Press Limited. The full terms of this license are available at https://www.dovepress.com/terms.php and incorporate the Creative Commons Attribution - Non Commercial (unported, v3.0) License.
By accessing the work you hereby accept the Terms. Non-commercial uses of the work are permitted without any further permission from Dove Medical Press Limited, provided the work is properly attributed. For permission for commercial use of this work, please see paragraphs 4.2 and 5 of our Terms.