")
Back to Journals » Diabetes, Metabolic Syndrome and Obesity » Volume 15
Lingguizhugan Decoction Targets Intestinal Microbiota and Metabolites to Reduce Insulin Resistance in High-Fat Diet Rats
Authors Ning Y, Gong Y, Zheng T, Xie Y, Yuan S, Ding W
Received 22 April 2022
Accepted for publication 19 July 2022
Published 9 August 2022 Volume 2022:15 Pages 2427—2442
DOI https://doi.org/10.2147/DMSO.S370492
Checked for plagiarism Yes
Review by Single anonymous peer review
Peer reviewer comments 2
Editor who approved publication: Prof. Dr. Antonio Brunetti
Ying Ning,* Yanju Gong,* Tianyan Zheng, Ya Xie, Shiqing Yuan, Weijun Ding
School of Basic Medical Sciences, Chengdu University of Traditional Chinese Medicine, Chengdu, 611137, People’s Republic of China
*These authors contributed equally to this work
Correspondence: Weijun Ding; Shiqing Yuan, Department of Fundamental Medicine, Chengdu University of Traditional Chinese Medicine, 1166 Liutai Road, Chengdu, 611137, People’s Republic of China, Tel + 86-28-61800219, Fax + 86-28-61800225, Email [email protected]; [email protected]
Background: The increasing incidence of obesity and its complications has become a global public health problem. Lingguizhugan decoction (LGZGD) is a representative compound of traditional Chinese medicine (TCM) for metabolic diseases, such as nonalcoholic fatty liver disease, but its role in insulin resistance (IR) treatment is still less known. This study aims to evaluate the therapeutic properties of LGZGD on obesity-induced IR and explore the potential mechanism of LGZGD on gut microbiota and its metabolites in the treatment of IR.
Methods: In this study, we induced an IR model in the form of high-fat diet (HFD) rats gavaged with LGZGD (1.64 g/kg BW) for three weeks. The IR status was measured by biochemical assays and oral glucose tolerance tests. The degrees of damage to liver function and the intestinal barrier were observed by hematoxylin and eosin (H&E) staining and immunohistochemistry. Alterations in intestinal microbiota and metabolites were assessed by 16S rRNA and an untargeted metabolomics platform.
Results: Our results showed that after LGZGD treatment, the body weight, plasma insulin concentration and blood lipids were significantly decreased, and glucose tolerance and hepatic steatosis were ameliorated. In addition, small intestinal villi were restored, and the expression of Occludin was upregulated. The relative abundance of Akkermansia, Faecalibacterium and Phascolarctobacterium in the HFD-LGZG group was upregulated. Obesity-related metabolic pathways, such as bile secretion, biosynthesis of amino acids, phenylalanine metabolism, serotonergic synapse, protein digestion and absorption, taurine and hypotaurine metabolism, and primary bile acid biosynthesis, were changed. After LGZGD intervention, metabolites developed toward the healthy control group. In addition, the expression of bile acid metabolism related genes was also regulated in IR rats.
Conclusion: We showed that LGZGD relieved IR, possibly by regulating the composition of the fecal microbiota and its metabolites. The above studies provide a basis for further study of LGZGD in the treatment of IR and its clinical application.
Keywords: insulin resistance, IR, lingguizhugan decoction, LGZGD, intestinal microbiota, nontargeted metabolomics, high-fat diet, HFD
Introduction
Obesity is a worldwide health issue impacting both developed and developing countries.1 It is a common risk factor for metabolic syndrome, cardiovascular diseases2 and cancers.3 Both insulin synthesis and secretion processes are regulated by glucose levels. However, under pathological conditions such as obesity and type 2 diabetes mellitus (T2DM), persistent gluconeogenesis leads to elevated glucose levels in vivo. The oversecreted insulin maintains blood glucose stability, and the insulin target organs are insensitive to insulin, leading to IR.4 There is currently no effective treatment for primary or hereditary IR, but IR due to obesity can be controlled by medication or lifestyle changes. Metformin, rosiglitazone, sodium-dependent glucose transporter 2 inhibitors,5 and glucagon-like peptide-1 receptor activation drugs6,7 have been widely used to improve IR in T2DM patients. However, adverse effects, including weight gain, hypoglycemia, flatulence, and sometimes diarrhea, were frequently noted.8 Thus, developing a safer and more effective drug becomes imperative.
LGZGD, a representative TCM formula, is composed of Poria, Guizhi, Atractylodes, and Licorice. Key bioactive compounds of LGZGD, such as poria cocos and glycyrorice polysaccharides, have been suggested to have anti-inflammatory, antioxidant and ameliorating metabolic syndrome effects.9,10 Previous studies have shown that LGZGD ameliorates the IR status in the liver through inhibition of IRS-1 Ser307 phosphorylation11 and prevents NAFLD from an HFD by alleviating oxidative stress and activating cholesterol secretion.12 Both NAFLD and IR are metabolic diseases.13 Therefore, we hypothesized that LGZGD also has a therapeutic effect on IR. However, the pathological factors of IR are complex, and relevant publications are lacking. Thus, more technical approaches, such as systems biology, are still needed to elucidate the mechanism of IR regulation by LGZGD.
The homeostasis of the intestinal microbiota is closely related to metabolic health. Dysbiosis of special intestinal bacteria is closely involved in IR.14–16 HFD can lead to dysbiosis in intestinal microbiota. It is known that the disturbance of Proteus, Firmicutes and Bacteroides is closely related to the occurrence of obesity.17 Moreover, a HFD can also damage the integrity of the intestinal mucosa and cause a “leaky intestine”.18 Liu et al observed that LGZGD can alter the structure of the intestinal microbiota and in turn be resistant to HFD-induced obesity in mice.19 The above evidence suggests that the intestinal microbiota may be a therapeutic target of LGZGD for IR.
HFD changed the abundance and characteristics of the metabolites derived from the intestinal microbes in patients and rats. In patients with obesity and/or T2DM, amino acid metabolism, lipid metabolism and bile acid metabolism were globally disrupted; consequently, the serum levels of most amino acids and primary bile acids were increased, and most glycerin phospholipids were decreased.20–22 Therefore, regulating the composition of the intestinal microbiota and its metabolites is the key to the treatment of metabolic diseases. Although there are a few publications that have shown that some effective components of LGZGD can regulate gut microbiota to improve metabolic diseases such as IR, systemic studies of LGZGD to restore dysbiotic intestinal microbiota and relevant metabolites in IR subjects are still lacking.
In this study, HFD was adopted to mimic the human daily diet to induce obesity and lead to IR status. The main purpose of this study was to evaluate the therapeutic properties of LGZGD on obesity-induced IR. The mechanism of LGZGD on IR treatment was also investigated by combined analysis of the microbiome and metabolomics and the expression levels of related biomarkers detected by relevant methods.
Materials and Methods
Reagents
LGZGD was prepared with four Chinese herbal granules listed as follows: Poria cocos (Schw.) Wolf, Cinnamomum cassia Presl, Atractylodes macrocephala and Glycyrrhiza Radix, with a ratio of 12:9:6:6. All herbs were purchased from Beijing Kang-ren-tang Pharmaceutical Co., Ltd., and used following the instructions (see Table S1 for details of all drugs). Dang analysed the components of four herbs in detail.23 On this basis, we selected several key components for high-performance liquid chromatography (HPLC). Methods and results for HPLC for drugs are shown in Figure S1. The HFD (fat 45 kcal%, carbohydrates 35 kcal%, protein 20 kcal%) was purchased from Xiao Shu You Tai Biotechnology Co., Ltd. (Beijing, China). Biochemical kits, such as triglyceride (TG), total cholesterol (TC), and nonesterified fatty acid (NEFA), were purchased from Jiancheng Bioengineering Institute (Nanjing, China), and alanine aminotransferase (ALT) and aspartate aminotransferase (AST) were purchased from Mindray (Shenzhen, China). An insulin enzyme-linked immunosorbent assay (ELISA) kit was obtained from Elabscience Biotechnology (Wuhan, China).
Animal Modelling and LGZGD Treatment
We used 42 male Sprague–Dawley rats (weight: 200–220 g, age: 8 weeks) with animal quality certificate No. SCXK (Hunan) 2019–0,004. All rats were purchased from Hunan Jingda Laboratory Animal Co., Ltd. The animals were kept in a well-ventilated room with constant environmental conditions (temperature: 25 ± 1°C; relative humidity: 60 ± 5%; 12 h light-dark cycle) and provided with food and water ad libitum. After adaptive feeding, rats were randomly divided into four groups: normal diet group (ND, n=12), HFD group (HFD, n=12), HFD with LGZGD low-dose treatment group (HFD-LGZG-L, n=10) and HFD with LGZGD middle-dose treatment group (HFD-LGZG-M, n=12). Rats in the ND group were maintained on standard chow, while both the HFD and HFD-LGZG groups were on a HFD. At the end of the 14th week, blood glucose and body weight were measured, and qualified models were selected (ND, n=8; HFD, n=8; HFD-LGZG-L, n=5; HFD-LGZG-M, n=7). From 15 to 18 weeks, rats in the HFD-LGZG group were orally administered a 1.64 g/kg BW dose of LGZGD, while the HFD group was given the same volume of ddH2O. These dosages were calculated from the equivalent conversion of the body surface area between animals and humans. Body weight was recorded weekly. At the end of the experiment, after 12 h of fasting, an oral glucose tolerance experiment (OGTT) was performed by orally administering 2 g/kg glucose to rats, and the area under the curve was calculated. After the rats were anesthetized with pentobarbital, their serum, liver, ileum, cecal feces, and muscles were collected for follow-up experiments. The animal experiment was approved by the Animal Care and Use Committee, Chengdu University of TCM (approval No. 2021–05). All studies were conducted in accordance with the recommendations of the National Institute of Health Guide for Care and Use of Laboratory Animals.
Biochemical Tests
At the end of LGZGD treatment, all rats were anesthetized, blood samples were collected from the aorta abdominals, and the serum samples were isolated by centrifugation at 3000 rpm for 10 min for subsequent testing. Serum levels of TG, TC, NEFA, AST, and ALT were measured using biochemical kits, and insulin concentrations were detected by an ELISA kit.
Pathological Observation
Hematoxylin and Eosin (H&E) Staining
The liver and ileum tissue samples were fixed in 4% polyformaldehyde and stored at 4 °C overnight, followed by paraffin embedding. Then, each tissue specimen was sliced into 3–5 sections with a thickness of 4 μm and stained with H&E. Pathological features were observed using a Leica microscope.
Oil Red O Staining
The liver samples were fixed in 4% polyformaldehyde, stored at 4 °C overnight, dehydrated in 20% sucrose solution, sliced into 5 μm sections with a freezing microtome, and stained according to the conventional pathological process. The amount of lipid deposition was quantified by measuring the proportion of oil red O staining using color thresholding and measuring the red intensity with Image-Pro plus.
Immunohistochemistry Staining
Liver and ileum sections were blocked with 1% BSA/PBS at RT for 1 h and incubated with antibodies against cluster of differentiation 36 (CD36) (1:500; Proteintech, Wuhan, China) and Occludin (1:100; Abcam, Cambridge, UK), followed by corresponding secondary antibodies at RT for 1 h. A digital scanner and imaging system for tissue slices were applied to collect the scanned files and images on the immunohistochemical slices. Mean optical densities were examined with Image-Pro Plus 5.0. Mean optical density = integrated optical density (sum)/area (sum). Histochemistry scores were determined based on the number of positives within each slice and their staining intensity.
16S rRNA Sequencing
A DNA Stool Kit (MoBio) was used to extract fecal DNA according to the manufacturer’s instructions. For 16S rRNA gene sequencing, separate barcode universal primers and 30 ng of extracted genomic DNA were used for PCR amplification of the V3 and V4 regions (the sequences of the amplified primers are as follows: 515F (5’- GTGYCAGCMGCCGCGGTAA-3’) and 806R (5“-GGACTACHVGGGTWTCTAAT-3”). PCR was performed in triplicate, and the PCR product was purified using a QIAquick PCR purification kit (QIAGEN). Sequencing was performed by a quantitative kit (Kapa Biosystems, KK4824) using an Illumina MiSeq platform for paired-end sequencing. Based on 97% sequence similarity with the Greengenes 13_5 database, the operational taxonomic units (OTUs) were selected through open reference OTU selection. QIIME1.8.0 was used for classification allocation and sparseness, using approximately 80,000 readings per sample.24 The OTUs of each sample were classified and annotated in the Silva reference database (version 138). The Shannon index of the microbial community was calculated by QIIME software (version 1.9.1). R software (version 2.15.3) was used to draw the rank variance curve, and R software was used to analyse the difference between groups of alpha diversity indices. The heatmap was processed by R software. The common and unique OTUs are intuitively explained by a Wien diagram. The unweighted pair group method based on the Bure Curtis difference (principal coordinate analysis based on phylogenetic distance (UPGMA)) was used to determine the difference in beta diversity of bacterial communities in different samples. Lefse software was used for LEfSe analysis, and the filter value of the LDA score was set to 4 by default. The species with significant differences between groups were analysed by R software_ Test inspection and drawing.
Nontargeted Metabolome Analysis
Fecal samples (~100 mg) were frozen individually and ground with liquid nitrogen, and the homogenate was resuspended with prechilled 80% methanol and 0.1% formic acid by vortexing. The samples were incubated on ice for 5 min and then centrifuged at 15,000 g and 4°C for 20 min. The supernatant was diluted to a final concentration containing 53% methanol with LC–MS grade water. The samples were subsequently transferred to a fresh Eppendorf tube and centrifuged at 15,000 g and 4°C for 20 min. Finally, the supernatant was injected into the LC–MS/MS system for further analysis. The Conquer UHPLC system (ThermoFisher) and track rap Q extraction series mass spectrometer (ThermoFisher) were used in positive and negative modes. The original data generated by UHPLC–MS/MS were then processed +by peak pairing, peak selection, and quantification of each metabolite using compound finder 3.1 (CD3.1, ThermoFisher). After analysis, the data were matched to the mzCloud, mzVault, and MassList databases for accurate qualitative and relative quantitative results. The data processing part is based on the Linux operating system (CentOS version 6.6) and R and Python software. Using the KEGG database (https://www.genome.jp/kegg/pathway.html), HMDB database (https://hmdb.ca/metabolites) and lipidmaps database (http://www.lipidmaps.org/), the identified metabolites were annotated. In the multivariate statistical analysis, the metabolomics data processing software metax was used to convert the data, and then principal component analysis (PCA) was carried out to obtain the VIP value of each metabolite. In univariate analysis, the statistical significance (p value) of metabolites between the two groups was calculated based on a t test, and the fold change (FC value) of metabolites between the two groups was calculated. The screening criteria of differential metabolites were VIP > 1, p < 0.05 and FC ≥ 2 or FC ≤ 0.5. The volcano map was drawn with the R package ggplot2. The cluster heatmap was drawn with the R package phatmap, and the metabolite data were normalized with the Z score. A bubble diagram was drawn with the R package ggplot2, and the KEGG database was used to study the functions and metabolic pathways of the metabolites. When x/N > y/N, it is considered that the metabolic pathway is enriched; it is considered to be significantly enriched when p < 0.05.
Total RNA Extraction and Real-Time PCR
Total RNA in the liver was extracted by the column method with foregene (cat. No. re003111/03112/03113) kit, and first-strand cDNA was synthesized by cDNA (cat. No. RT-01022). Quantitative real-time PCR was carried out using
2 × SYBR Green fast qPCR mix (no Rox) (cat. No. QP-01012) was used for analysis on the real-time PCR system. The ΔΔ CT method was used to calculate the relative mRNA expression level, and GAPDH was used as the internal reference gene to normalize the CT value. The primers used were designed and synthesized by the China Qingke company and are listed in Table S2.
Serum Concentration of L-Aspartic Acid
Approximately 50 μL of serum was added to 450 μL of mass spectrometry water, vortexed, and 10 times diluted; 10 times diluted samples were added to 50 μL. Add 200 μL of the precipitate of the mixed internal standard (acetonitrile:methanol = 1:1), vortex mixing, stand on ice for 30 min, centrifuge at 12,000 rpm at 4 °C for 10 min, and take all supernatant for LC–MS analysis. Ultrahigh-performance liquid chromatography-tandem mass spectrometry system ™ Amino acids in Novogene Co., Ltd. (Beijing, China) were quantified using ad uhplc-qtrap 6500 + of ab SCIEX company in Boston, Massachusetts, USA. On an Acquity UPLC Being amide column (2.1 × 100 mm, 1.7 μm), the column was maintained at 50 °C. The mobile phase consisted of 0.1% formic acid in 5 mM ammonium acetate (solvent a) and 0.1% formic acid in acetonitrile (solvent B). The flow rate was 0.30 mL/min. The solvent gradient was set as follows: initial 80% B, 0.5 min; 80–70% B, 2 min; 70–45% B, 4 min; 45–80% B, 6 min; 80% B, 9 min. The concentration series of the standard solution was detected by LC–MS, with the concentration of the standard as the abscissa and the ratio of the standard to the internal standard peak area as the ordinate to investigate the linearity of the standard solution. The linear regression equation of aspartic acid was obtained. The quantitative limit is determined by the signal-to-noise ratio method; that is, the signal measured by the known low concentration sample is compared with the signal measured by the blank sample. Generally, the corresponding concentration when the signal-to-noise ratio is 10:1 (s/N = 10) is taken as the quantitative limit.
Statistical Analysis
Statistical analysis was performed by GraphPad Prism 7. Data were analysed by one-way analysis of variance (ANOVA), followed by Student’s t test. p<0.05 indicates that a significant difference exists between the results. All quantification data are presented as the mean values ± SEMs. The variable importance in the projection (VIP) value of the first principal component model was used to find the differentially expressed metabolites. The threshold levels for determining the differentially expressed metabolites were set as VIP>1, FC>2.0, and p value<0.05.
Results
LGZGD Reduced the Obesity Process in IR Rats
The body weight and the epididymal fat weight of the four groups (ND, HFD, HFD-LGZG-L, HFD-LGZG-M) were compared to observe the effect of LGZGD on obesity in IR rats. The results showed that LGZGD significantly reduced both body weight (Figure 1A and B) and epididymal fat weight (Figure 1C).
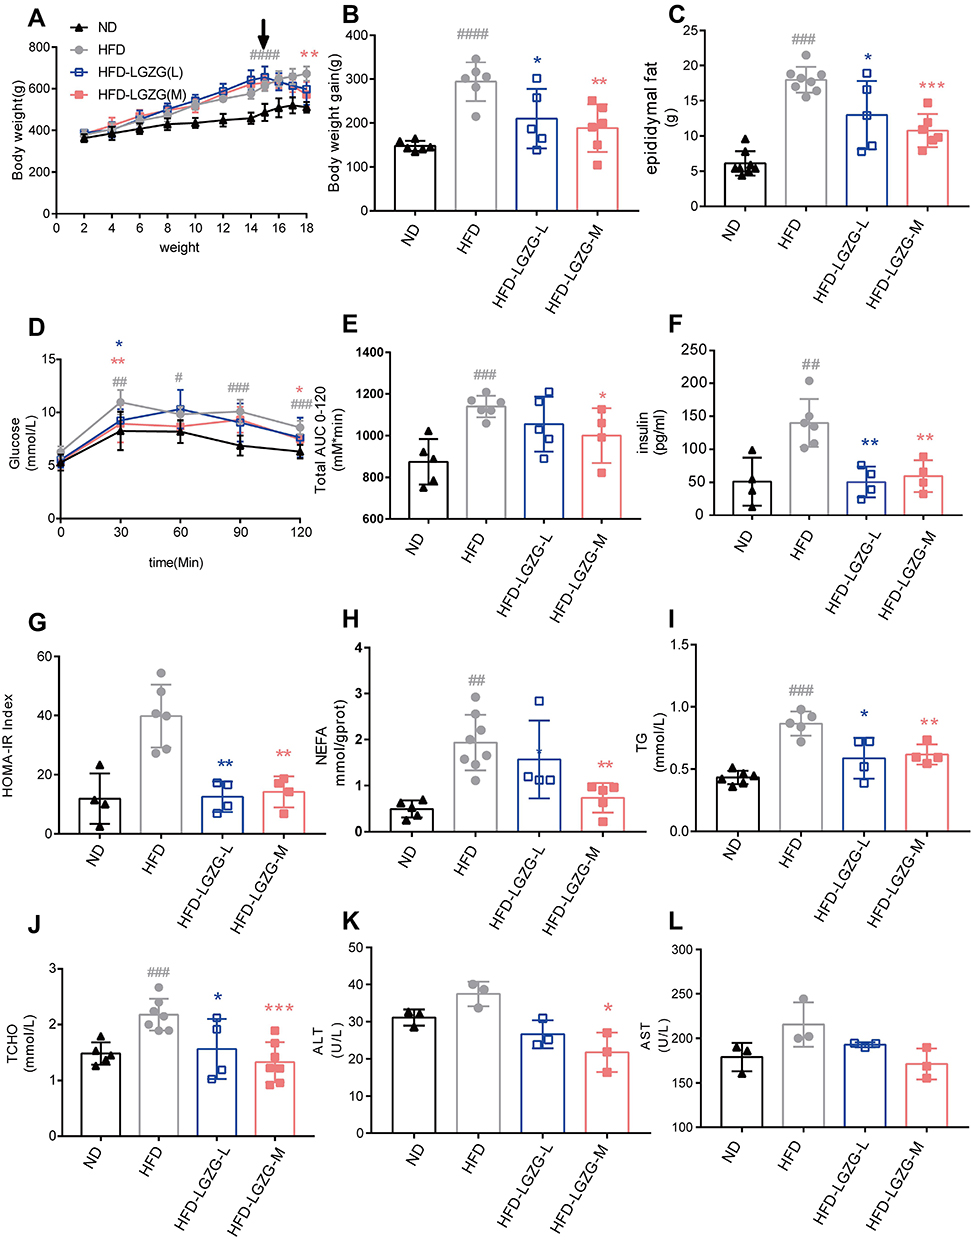 |
Figure 1 LGZGD reduced the obesity process in IR rats. (A) Weekly body weight curves. (B) Bodyweight gain from week 2 to week 18. (C) Weight of the epididymal fat. (D) Blood glucose changes during the OGTT. (E) The area under the OGTT curves. (F) Fasting plasma insulin, (G) HOMA-IR index. (H) NEFA. (I) TG. (J) TC. (K) ALT. (L) AST. Data are expressed as the mean ± SEM (n = 3–8 per group). HFD vs ND, #p<0.05, ##p<0.01, ###p<0.001,####p<0.0001; HFD-LGZG vs HFD, *p<0.05, **p<0.01, ***p<0.001. Abbreviations: ND, normal diet; HFD, high-fat diet; HFD-LGZG-L, HFD with low-dose Lingguizhugan decoction treatment; HFD-LGZG-M, HFD with middle-dose Lingguizhugan decoction treatment. |
After LGZGD treatment, the blood glucose of the OGTT was decreased at 30 min and 120 min, while the area under the OGTT curves was also decreased significantly (Figure 1D and E). Compared with the HFD group, the serum insulin contents of HFD-LGZG-L and HFD-LGZG-M animals were decreased (Figure 1F), and the HOMA-IR index was decreased (Figure 1G). Moreover, the liver NEFA, plasma TG, TC, ALT and AST contents were also decreased (Figure 1H-L). These data illustrated that LGZGD could effectively prevent obesity and rescue IR and lipid metabolism disorders in IR rats, as expected. Middle-dose LGZGD is a clinically effective dose, showing a better therapeutic effect. Therefore, we used the medium-dose group as a representative to conduct the follow-up experiment.
LGZGD Attenuated Hepatic Steatosis in IR Rats
As shown in Figure 2A, compared with the ND group, the liver cells in the HFD group were significantly enlarged and showed obvious lipid droplets, and the hepatic sinusoid between the cells disappeared. After LGZGD intervention, the swelling within liver cells was relieved, and fat droplets decreased. Meanwhile, oil red O staining also proved the reduction of hepatic fat droplets (Figure 2B and D). The expression of CD36 in the liver was also enhanced after LGZGD intervention (Figure 2C and E).
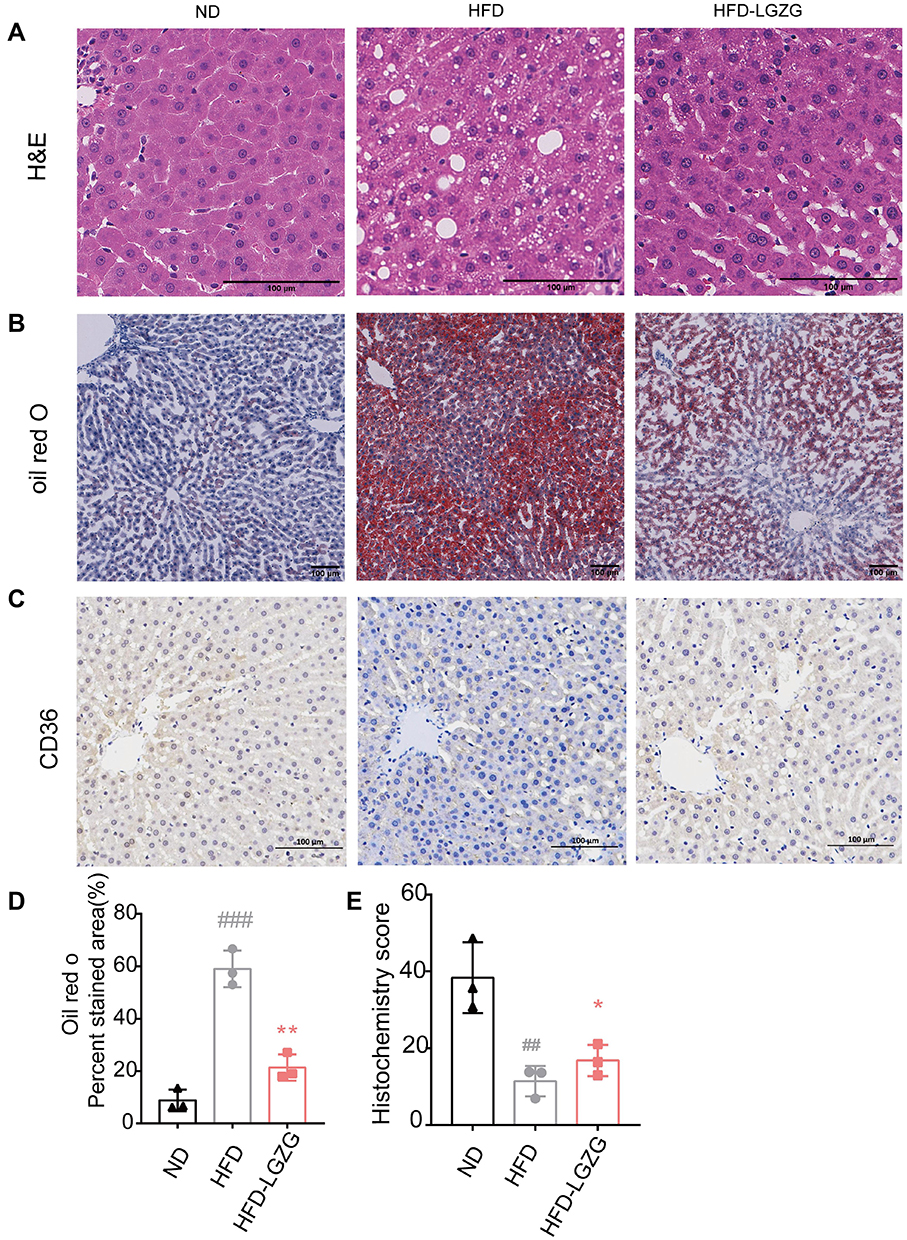 |
Figure 2 LGZGD attenuated hepatic steatosis in IR rats. (A) Representative images of liver H&E staining (scale bar, 100 μm). (B&D) Representative images (B) and quantification (D) of liver oil red O staining (scale bar, 100 μm). (C and E) Immunohistochemistry staining (C) and optical density (OD) quantification (E) of liver for CD36 (scale bar, 100 μm). Data are expressed as the mean ± SEM (n =3 per group). HFD vs ND, ##p<0.01, ###p<0.001; HFD-LGZG vs HFD, *p<0.05, **p<0.01. In the present test, HFD-LGZG is HFD-LGZG-M. |
LGZGD Ameliorated the Intestinal Barriers of IR Rats
H&E staining showed that compared with the ND group, the morphology of the small intestinal villi of the HFD group was fragmentary. The number of small intestinal villi was reduced, and the crypt depth was shallower. LGZGD repaired these histological injuries (Figure 3A, C and D), suggesting that LGZGD could reduce damage to the intestinal barrier. In addition, the expression of the intestinal tight junction protein Occludin showed a downwards trend in the HFD group compared with the ND group, while the Occludin protein expression of the HFD-LGZG group was significantly higher than that of the HFD group (Figure 3B and E).
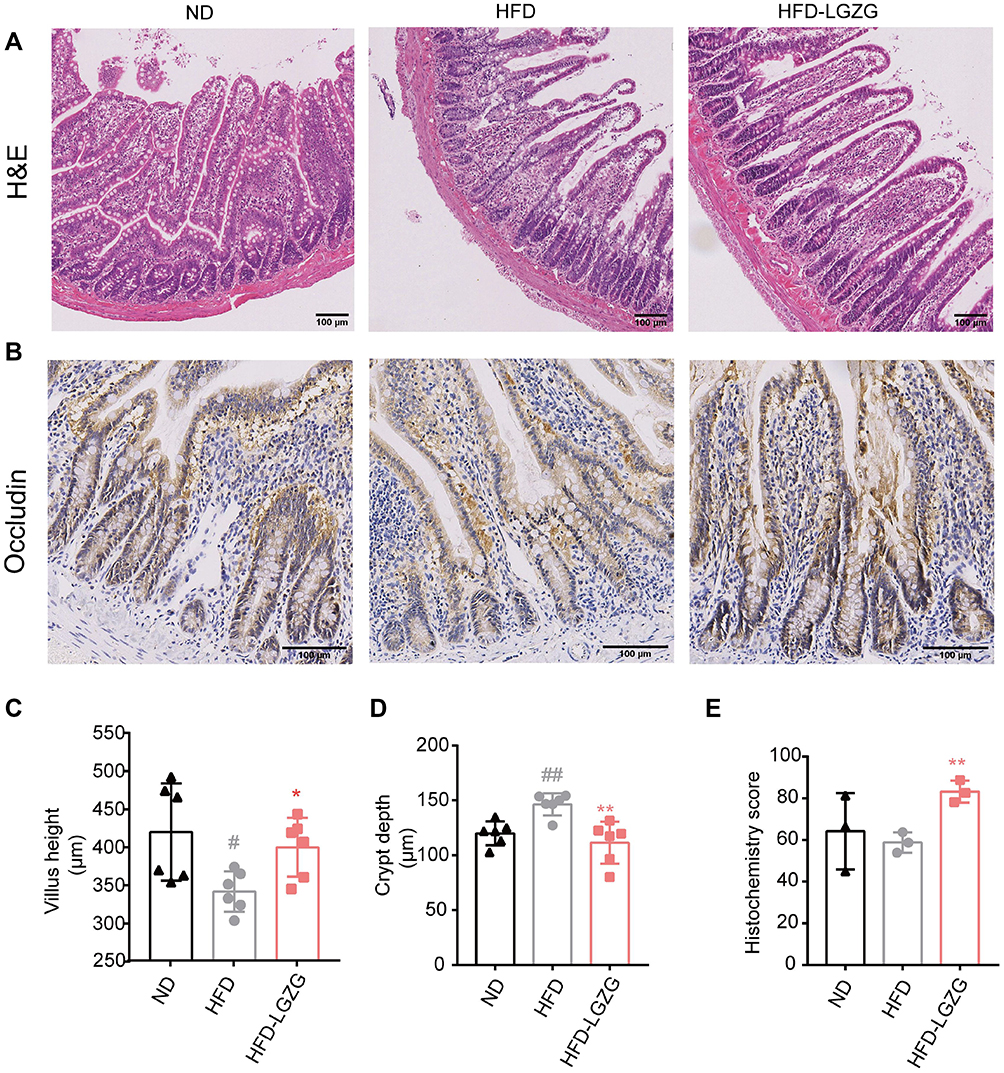 |
Figure 3 LGZGD ameliorated the integrity of the intestinal barrier in IR rats. (A) Representative images of ileum H&E staining (scale bar, 100 μm). (B&C) The quantification of villus height (B) and crypt depth (C) of the ileum. (D and E) Immunohistochemistry staining (D)and optical density (OD) quantification (E) of occludin in the ileum (scale bar, 100 μm). Data are expressed as the mean ± SEM (n = 3 per group). HFD vs ND, #p<0.05, ##p<0.01; HFD-LGZG vs HFD, *p<0.05, **p<0.01. In the present test, HFD-LGZG is HFD-LGZG-M. |
LGZGD Restored the Dysbiotic Intestional Microbiota of IR Rats
After testing and treatment, the community diversity of species and intestinal microbiota (Alpha diversity) showed no difference between the HFD-LGZG and the HFD groups (p>0.05). (Figure 4A). Based on the Venn diagram, the difference in the composition of the microbiota between different groups can be seen more (Figure 4B). Based on weighted UniFrac and unweighted UniFrac distances, principal coordinates analysis (PCoA) further shows the clustering of different groups. The more widely divided the different groups were, the greater the difference (Figure 4C and D). Then, we found that the composition of the intestinal flora of HFD-LGZG and HFD rats was different at the phylum and genus levels. The proportion of the Firmicutes/Bacteroides group was 45.5% higher than that of the HFD group. After LGZGD intervention, the proportion decreased by 13.2% compared with the HFD group, with the same trend as the ND group. In addition, the proportion of Verrucomicrobiota gate increased. We analysed the relative abundance of the intestinal flora at the genus level. The yellow color represents the higher relative abundance of the genus. A total of 35 significantly different genera were identified. It is worth noting that the abundance of Akkermansia, Ruminococcus torques, Erysipelatoclostridium, Faecalitalea and Phascolarctobacterium increased in the HFD-LGZG group, while the abundance of Collinsella decreased (Figure 4F).
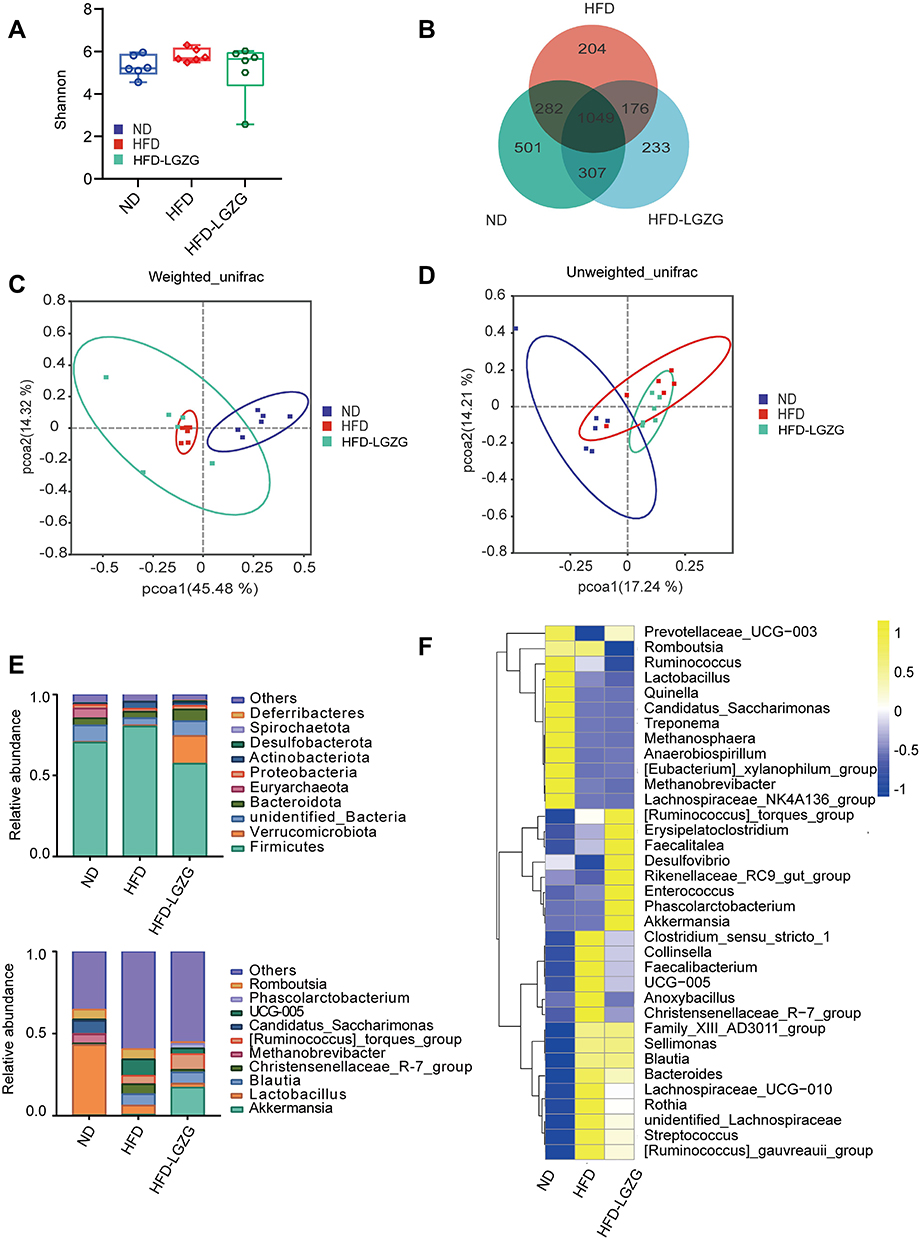 |
Figure 4 LGZGD restored the dysbiotic fecal microbiota of IR Rats. (A) Alpha diversity of gut microbiota in different groups. (B) Venn diagram showing OTU distribution. (C and D) Weighted UniFrac and unweighted UniFrac distance PCoA. (E) The abundances of gut microbiota constituents at the phylum level and genus level. (F) The relative abundance (pair values) of the microbial genus is shown in a yellow to blue color code (high to low abundance). (n = 6 per group). HFD vs ND, **p <0.01; HFD-LGZG vs ND, **p < 0.01. In the present test, HFD-LGZG is HFD-LGZG-M. |
Based on the local density approximation (LDA) score, the biomarkers with significant differences between the two groups were listed, and the microbial communities that play an important role in each group were identified through the clade figure In the HFD group, Coriobacteriaceae, Lachnospiraceae, and Peptostreptococcaceae were the main bacteria, while in the HFD-LGZG group, it was mainly Erysipelotrichaceae (Figure 5A and B).
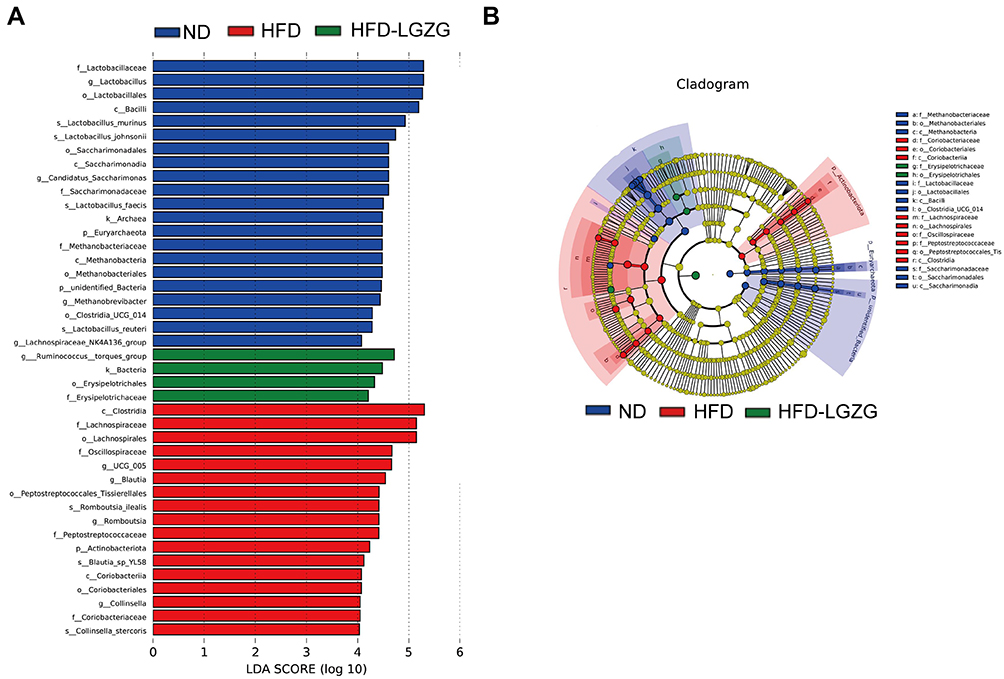 |
Figure 5 LGZGD regulates the abundance of gut microbial biomarkers in IR rats. (A and B) Histogram and branching plots of LDA value distribution of biomarkers between ND, HFD groups and HFD-LGZG groups, listing the LDA score threshold> 4, indicating higher relative abundance of the corresponding groups, with blue, green and red bars representing significantly increased in ND, HFD and HFD-LGZG groups, respectively, generated by linear discrimination analysis effect size (LEFSe) analysis, showing differences in bacterial abundance. (n = 6 per group). In the present test, HFD-LGZG is HFD-LGZG-M. |
LGZGD Improved Glucose and Related Metabolism in IR Rats
As shown in Figure 6A, the results of the principal component analysis (PCA) showed that the three groups had obvious differences in metabolite clusters. Venn diagrams showed the similarities and differences in metabolites between different groups (Figure 6B). Volcano map analysis showed that LGZGD treatment resulted in significant changes in metabolites. The HFD group had 444 metabolites upregulated and 407 downregulated compared to the ND group (VIP>1, p<0.05). The HFD-LGZG group had 108 upregulated and 407 downregulated metabolites compared to the HFD group (VIP>1, p<0.05) (Figure 6C and D). The difference in metabolites showed that the metabolites with obvious changes mainly accumulated in pathways related to nutrition and energy metabolism, such as bile secretion, biosynthesis of amino acids, phenylalanine metabolism, serotonergic synapse, protein digestion and absorption, taurine and hypotaurine metabolism, and primary bile acid biosynthesis (Figure 6E). Compared with the ND group, glycocholic acid, taurocholic acid, taurine, L-phenylalanine, serotonin, L-tyrosine, N-acetyl-D-alloisoleucine, N-acetyl-α-D-glucosamine, arachidonic acid, L-carnitine, etc., increased in the HFD group. After LGZGD treatment, these metabolites related to obesity were downregulated. In addition, it is worth noting that metabolites such as inosin, xanthohumol, wampetin, berberine, formononetin, and protoporphyrin IX, which are related to improving sugar metabolism and protein synthesis, were upregulated25–27 (Figure 6F).
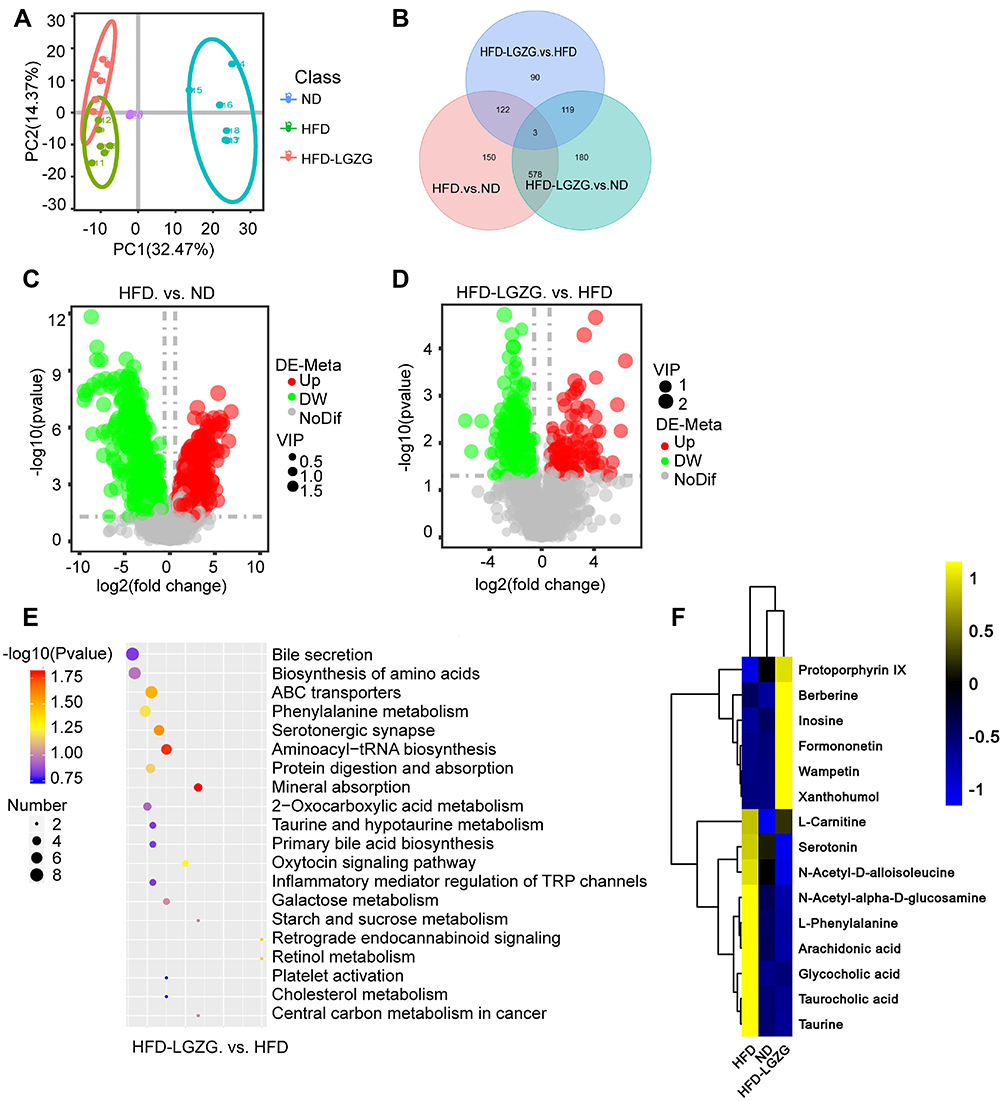 |
Figure 6 LGZGD altered the colon metabolic profile in IR rats. (A) PCA. Each dot represents an individual rat. (B) Venn diagram. (C and D) Volcano map. (E) Bubble plots of the p values of the metabolic pathways associated with the different metabolites, and the corresponding p values are smaller when the bubbles are larger or darker. (F) Heatmap of the differential metabolites in the ND, HFD and HFD-LGZG groups (VIP > 1, p < 0.05). (n = 6 per group). In the present test, HFD-LGZG is HFD-LGZG-M. |
LGZGD Rescued the Metabolic Dysfunction of Bile Acids in IR Rats
We verified the bile acid metabolic pathway found in part 3.5. As shown in Figure 7A, cholesterol 7, a gene related to bile acid synthesis α-hydroxylase (CYP7A1), 7-alpha-hydroxyholest-4-en-3-one, 12 alpha-hydroxylase (CYP8B1), bile acid transport-related gene Takeda G protein-coupled bile acid receptor (TGR5) and multidrug resistance-related protein 2/3 (MRP2/3) were upregulated after LGZGD intervention. We also detected the content of aspartic acid in serum and found that compared with the HFD group, the HFD-LGZG group had an upwards trend (Figure 7B).
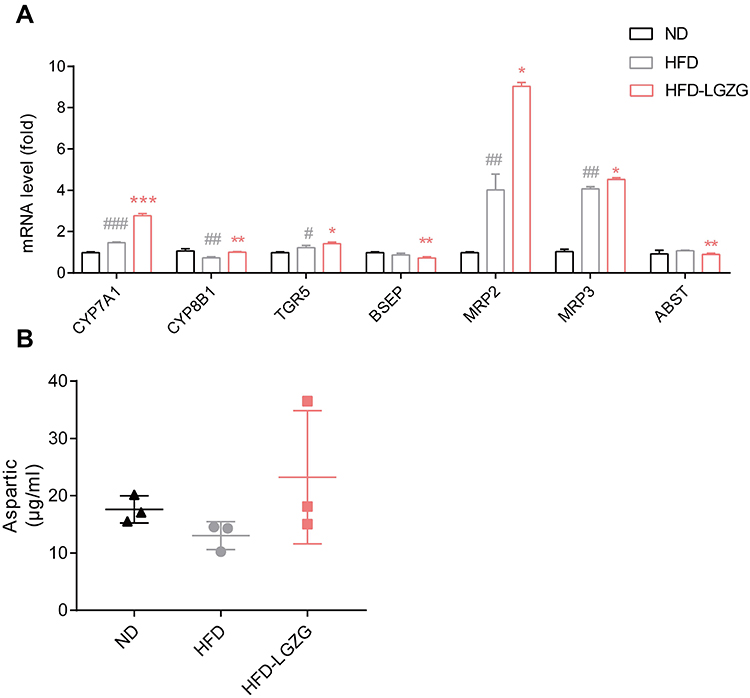 |
Figure 7 Effect of LGZGD on hepatic bile acid metabolism dysfunction in IR rats. (A) mRNA expression of bile acid synthesis and transport genes in the liver. (B) The concentration of aspartic acid in serum. HFD vs ND, #p < 0.05, ##p < 0.01, ###p < 0.001; HFD-LGZG vs HFD, *p < 0.05, **p <0.01. (n=3 per group). In the present test, HFD-LGZG is HFD-LGZG-M. |
Discussion
In this experiment, we found that LGZGD was beneficial for improving the negative effects of IR, including overweight, impaired glucose tolerance, hyperlipidemia and hepatic steatosis. We first discovered that LGZGD ameliorated the intestinal microbiota as well as the metabolomics of IR rats, thereby bringing them into a healthier state. What is interesting is that this change was conducive to the integrity of the intestinal barrier, which is related to certain bacterial species and metabolites.
Accumulating studies have shown that the intestinal flora is causally related to a variety of diseases, especially metabolic diseases.28–30 Moreover, studies have shown that the transplantation of fecal bacteria from lean volunteers to obese patients can improve metabolism and increase insulin sensitivity.31 In this study, we found that after LGZGD treatment, the relative abundance of beneficial species, particularly Akkermansia, Faecalitalea, and Phascolarctobacterium, increased, while the relative abundance of Collinsella decreased. Akkermansia is a popular bacteria studied in recent years. It has been shown to reduce liver dysfunction and improve the intestinal barrier by ameliorating IR.32 Recent studies have found that Akkermansia improves mouse homeostasis by inducing GLP-1 secretion33 and maintains intestinal barrier integrity by attenuating oxidative stress-induced apoptosis.34,35 Enrichment of Ruminococcus torques can improve obesity caused by HFD, which is a hypoxia inducible factor 2 α (HIF-2 α) downstream targeted flora. Researchers have found that specific knockout of HIF-2α can inhibit HFD-induced obesity, which may be achieved by enriching Ruminococcus torques and then promoting white fat thermogenesis through the bile acid fat TGR5 signaling pathway. Therefore, Ruminococcus torques plays an important role in improving obesity.36 Faecalitalea can ferment D-glucose, sucrose, D-mannose and raffinose, and the final product of metabolism is butyric acid, which can promote the secretion of postprandial insulin and improve the insulin response of diabetic patients.37 Phascolarctobacterium is the main bacteria consuming succinate and plays an important role in reducing inflammation and maintaining intestinal homeostasis.38 However, the abundance of Collinsella aerofaciens was positively correlated with the concentrations of serum triglycerides and total cholesterol. These structural changes in the intestinal microbiota indicate the beneficial regulation of LGZGD treatment for IR. Additionally, after LGZGD treatment, the main biomarker Erysipelotrichaceae was differentially expressed. It is negatively related to body weight.39
A range of metabolites produced by intestinal microbes involved in energy and glucose homeostasis can lead to alterations in host metabolism.40 Below, we focus on several key pathways mined from metabolomics data. Primary and secondary bile acids can stimulate the farnesoid X receptor and GPCR-19 to regulate glucose metabolism.41 Conjugated primary bile acids (glucocholic acid, taurine, etc.) were positively associated with T2DM risk,42 which is consistent with our observations. Metabolites of the serotonergic synapse pathway, especially arachidonic acid, are highly associated with the development of T2DM.43 Branched amino acids (BCAAs) can inhibit insulin signaling by stimulating the mammalian target of rapamycin, which leads to IR.44 We observed increased fecal BCAA (N-acetyl-D-alloisoleucine) in the HFD group, with a decreased isoleucine concentration following LGZGD intervention. The products of the above metabolic pathways increased in the HFD group in this experiment, but the content of the above metabolites decreased significantly after LGZGD treatment. Some beneficial metabolites, such as inosine, xanthohumol, wampetin, berberine, formononetin, and protoporphyrin IX, were upregulated after LGZGD therapy. Inosine is a purine metabolite. It can not only be used as a source of physiological energy but also has a wide range of anti-inflammatory and immunomodulatory activities, including inhibiting the production of pro-inflammatory factors, chemokines and anti-inflammatory cytokines. Inosine production may be related to the increased abundance of Akkermansia, which is consistent with our previous findings. In addition, inosine also passes through the adenosine 2A receptor (A2AR)/PPAR γ signaling pathway and plays a beneficial role in intestinal function, suggesting that inosine is a PPAR γ effective agonist.45 Xanthohumol is a flavonoid compound that can suppress the PPAR γ signaling pathway in the liver, thereby helping to block lipid accumulation or hepatic steatosis.46 Wampetin and berberine are alkaloids that have been shown to relieve T2DM by acting as anti-inflammatory agents and upregulating probiotics.25,47 Formononetin can influence protein synthesis and metabolism via the EGFR/PI3K/ATK pathway.48 Protoporphyrin IX can inhibit T2DM-associated hyperglycemia and obesity.49
Bile acids are cholesterol-derived molecules secreted by the liver, stored in the gallbladder and transported to the intestine. The gut microbiota processes bile acids and then transports them back to the liver. Bile acid transport is closely regulated by gene networks, mainly including the following pathways: bile acid synthesis-related genes CYP7A1, CYP8B1, TGR5, bile salt outlet pump (BSEP), MRP2/3, bile salt reflux regulation gene apical sodium-dependent bile salt transporter (ASBT), ileal bile acid-binding protein (IBABP), organic solute transporter β (OST β), Na+/taurocholate cotransporter polypeptide (NTCP) and organic anion cotransporter polypeptide (OATP).50 When the intestinal flora shifts or grows abnormally, the conversion of primary bile acids to secondary bile acids is blocked, which further leads to disordered intestinal flora. This poor circulation will lead to abnormalities in the metabolic signaling pathway and then aggravate the disorder of energy metabolism. In this experiment, we mainly detected CYP7A1, CYP8B1, TGR5, BSEP, MRP2/3 and ABST genes. CYP7A1 is the rate-limiting enzyme for the decomposition of cholesterol into bile acids. It is involved in the mechanism of reducing liver steatosis and blood lipids.51 Some studies have found that the content of secondary bile acids in the hypothalamus of obese mice is significantly reduced. When a TGR5 agonist is given, the sympathetic nervous system is activated, which can reduce obesity and promote energy balance;52 TGR5 is involved in the inhibition of dietary secondary bile acids in obesity. Other studies have shown that activating the bile acid receptor TGR5 can increase the energy consumption of brown adipose tissue, enhance liver lipid metabolism, and ultimately improve diet and gene-induced metabolic syndrome.53 MRP2/3 can reduce intrahepatic cholestasis and reduce the toxicity of bile acids to the cell membrane. We observed that after LGZGD intervention, the expression of CYP7A1, CYP8B1, TGR5 and MRP2/3 increased, suggesting that LGZGD can regulate the metabolic pathway of bile acids. Other studies have shown that the increase in Akkermansia in the intestine can increase the content of L-aspartic acid in mouse feces, liver and plasma. L-aspartic acid is a nonessential amino acid that can regulate nitrogen metabolism, nucleic acid synthesis and the Krebs cycle. It is used in the clinical treatment of acute and chronic liver diseases and liver cirrhosis. The L-aspartic acid level is negatively correlated with the liver TG level, and Yong Rao et al proved that L-aspartic acid is also related to the bile acid metabolic pathway.50 However, in this study, although an upwards trend of L-aspartic acid was observed, there was no significant difference, which may be related to the small sample size and short intervention time.
In addition, an increase in bacteria producing SCFAs was observed after LGZGD therapy, but no increase in SCFA content was observed in nontarget metabolomics analysis. The discrepant results need to be further evaluated by recruiting targeted metabolomics, and the causal bacterial species and metabolites should be verified in future experiments. According to the opinions of the reviewers, the next step of this study was to establish an antibiotic group to further verify the regulatory effect of LGZGD on intestinal flora.
Conclusion
This work showed that LGZGD can alleviate IR, particularly by reducing body weight, improving lipid metabolism, increasing glucose tolerance, protecting the intestinal barrier, and regulating the intestinal microbiota and relevant metabolites to promote healthy development.
Acknowledgments
We are grateful to the staff of the Experimental Center of Integrated Chinese and Western Medicine at Chengdu University of Traditional Chinese Medicine (Chengdu, China).
Author Contributions
All authors made a significant contribution to the work reported, whether that is in the conception, study design, execution, acquisition of data, analysis and interpretation, or in all these areas; took part in drafting, revising or critically reviewing the article; gave final approval of the version to be published; have agreed on the journal to which the article has been submitted; and agree to be accountable for all aspects of the work.
Funding
The work is supported by the National Natural Science Foundation of China [grant number 81273899], the Science & Technology Department of Sichuan Province [grant number 2021YJ0154] and the Xinglin Talent Promotion Plan “Young Scholars” Foundation of Chengdu University of Traditional Chinese Medicine [grant number 030054069].
Disclosure
The authors declare that the research was conducted in the absence of any commercial or financial relationships that could be construed as a potential conflict of interest.
References
1. Sonnenburg JL, Backhed F. Diet-microbiota interactions as moderators of human metabolism. Nature. 2016;535(7610):56–64.
2. Luo J, Huang L, Wang A, et al. Resistin-Induced Endoplasmic Reticulum Stress Contributes to the Impairment of Insulin Signaling in Endothelium. Front Pharmacol. 2018;9:1226.
3. Majchrzak M, Brzecka A, Daroszewski C, et al. Increased Pain Sensitivity in Obese Patients After Lung Cancer Surgery. Front Pharmacol. 2019;10:626.
4. Saeedi P, Petersohn I, Salpea P, et al. Global and regional diabetes prevalence estimates for 2019 and projections for 2030 and 2045: results from the International Diabetes Federation Diabetes Atlas, 9(th) edition. Diabetes Res Clin Pract. 2019;157:107843.
5. DeFronzo RA, Ferrannini E, Groop L, et al. Type 2 diabetes mellitus. Nat Rev Dis Primers. 2015;1:15019.
6. Martel J, Ojcius DM, Chang CJ, et al. Anti-obesogenic and antidiabetic effects of plants and mushrooms. Nat Rev Endocrinol. 2017;13(3):149–160.
7. Kerru N, Singh-Pillay A, Awolade P, Singh P. Current anti-diabetic agents and their molecular targets: a review. Eur J Med Chem. 2018;152:436–488.
8. Wu Q, Wu S, Cheng Y, et al. Sargassum fusiforme fucoidan modifies gut microbiota and intestinal metabolites during alleviation of hyperglycemia in type 2 diabetic mice. Food Funct. 2021;12(8):3572.
9. Zhang H, Ta N, Chen P, Wang H. Erchen Decoction and Linguizhugan Decoction Ameliorate Hepatic Insulin Resistance by Inhibiting IRS-1Ser307 Phosphorylation In Vivo and In Vitro. Evid-Based Compl Alt. 2017;2017:1–11.
10. Guo Y, Li J, Wang Y, et al. Yinchen Linggui Zhugan Decoction Ameliorates Nonalcoholic Fatty Liver Disease in Rats by Regulating the Nrf2/ARE Signaling Pathway. Evid-Based Compl Alt. 2017;2017:1–11.
11. Zhang H, Ta N, Chen P, Wang H. Erchen Decoction and Linguizhugan Decoction Ameliorate Hepatic Insulin Resistance by Inhibiting IRS-1Ser307 Phosphorylation In Vivo and In Vitro. Evid Based Complement Alternat Med. 2017;2017:1589871.
12. Yang L, Lin W, Nugent CA, et al. Lingguizhugan Decoction Protects against High-Fat-Diet-Induced Nonalcoholic Fatty Liver Disease by Alleviating Oxidative Stress and Activating Cholesterol Secretion. Int J Genomics. 2017;2017:2790864.
13. Perry RJ, Samuel VT, Petersen KF, Shulman GI. The role of hepatic lipids in hepatic insulin resistance and type 2 diabetes. Nature. 2014;510(7503):84–91.
14. Quinn RA, Melnik AV, Vrbanac A, et al. Global chemical effects of the microbiome include new bile-acid conjugations. Nature. 2020;579(7797):123–129.
15. Chaudhari SN, Luo JN, Harris DA, et al. A microbial metabolite remodels the gut-liver axis following bariatric surgery. Cell Host Microbe. 2021;29(3):408–424.
16. Liu TC, Kern JT, Jain U, et al. Western diet induces Paneth cell defects through microbiome alterations and farnesoid X receptor and type I interferon activation. Cell Host Microbe. 2021;29(6):988–1001.
17. Larsen N, Vogensen FK, van den Berg FW, et al. Gut microbiota in human adults with type 2 diabetes differs from non-diabetic adults. PLoS One. 2010;5(2):e9085.
18. Rahman K, Desai C, Iyer SS, et al. Loss of Junctional Adhesion Molecule A Promotes Severe Steatohepatitis in Mice on a Diet High in Saturated Fat, Fructose, and Cholesterol. Gastroenterology. 2016;151(4):733–746.
19. Liu MT, Huang YJ, Zhang TY, Tan LB, Lu XF, Qin J. Lingguizhugan decoction attenuates diet-induced obesity and hepatosteatosis via gut microbiota. World J Gastroenterol. 2019;25(27):3590–3606.
20. Zhao L, Lou H, Peng Y, Chen S, Zhang Y, Li X. Comprehensive relationships between gut microbiome and faecal metabolome in individuals with type 2 diabetes and its complications. Endocrine. 2019;66(3):526–537.
21. Lai M, Liu Y, Ronnett GV, et al. Amino acid and lipid metabolism in post-gestational diabetes and progression to type 2 diabetes: a metabolic profiling study. Plos Med. 2020;17(5):e1003112.
22. Li D, Cui Y, Wang X, Liu F, Li X. Apple Polyphenol Extract Improves High-Fat Diet-Induced Hepatic Steatosis by Regulating Bile Acid Synthesis and Gut Microbiota in C57BL/6 Male Mice. J Agric Food Chem. 2021;69(24):6829–6841.
23. Dang Y, Hao S, Zhou W, Zhang L, Ji G. The traditional Chinese formulae Ling-gui-zhu-gan decoction alleviated non-alcoholic fatty liver disease via inhibiting PPP1R3C mediated molecules. BMC Complement Altern Med. 2019;19(1):8.
24. Huang L, Duan C, Xia X, et al. Commensal microbe-derived propionic acid mediates juvenile social isolation-induced social deficits and anxiety-like behaviors. Brain Res Bull. 2021;166:161–171.
25. Shen DY, Kuo PC, Huang SC, et al. Constituents from the leaves of Clausena lansium and their anti-inflammatory activity. J Nat Med. 2017;71(1):96–104.
26. Yuan J, Peng G, Xiao G, et al. Xanthohumol suppresses glioblastoma via modulation of Hexokinase 2 -mediated glycolysis. J Cancer. 2020;11(14):4047–4058.
27. Tay KC, Tan LT, Chan CK, et al. Formononetin: a Review of Its Anticancer Potentials and Mechanisms. Front Pharmacol. 2019;10:820.
28. Zhang L, Zhou W, Zhan L, et al. Fecal microbiota transplantation alters the susceptibility of obese rats to type 2 diabetes mellitus. Aging. 2020;12(17):17480–17502.
29. Wu J, Wang K, Wang X, Pang Y, Jiang C. The role of the gut microbiome and its metabolites in metabolic diseases. Protein Cell. 2021;12(5):360–373.
30. Hernandez-Ceballos W, Cordova-Gallardo J, Mendez-Sanchez N. Gut Microbiota in Metabolic-associated Fatty Liver Disease and in Other Chronic Metabolic Diseases. J Clin Transl Hepatol. 2021;9(2):227–238.
31. Mocanu V, Zhang Z, Deehan EC, et al. Fecal microbial transplantation and fiber supplementation in patients with severe obesity and metabolic syndrome: a randomized double-blind, placebo-controlled Phase 2 trial. Nat Med. 2021;27(7):1272–1279.
32. Shin NR, Lee JC, Lee HY, et al. An increase in the Akkermansia spp. population induced by metformin treatment improves glucose homeostasis in diet-induced obese mice. Gut. 2014;63(5):727–735.
33. Yoon HS, Cho CH, Yun MS, et al. Akkermansia muciniphila secretes a glucagon-like peptide-1-inducing protein that improves glucose homeostasis and ameliorates metabolic disease in mice. Nat Microbiol. 2021;6(5):563–573.
34. Rao Y, Kuang Z, Li C, et al. Gut Akkermansia muciniphila ameliorates metabolic dysfunction-associated fatty liver disease by regulating the metabolism of L-aspartate via gut-liver axis. Gut Microbes. 2021;13(1):1–19.
35. Jin Z, Sun Y, Yang T, et al. Nanocapsule-mediated sustained H2 release in the gut ameliorates metabolic dysfunction-associated fatty liver disease. Biomaterials. 2021;276:121030.
36. Wu Q, Liang X, Wang K, et al. Intestinal hypoxia-inducible factor 2alpha regulates lactate levels to shape the gut microbiome and alter thermogenesis. Cell Metab. 2021;33(10):1988–2003.
37. Sanna S, van Zuydam NR, Mahajan A, et al. Causal relationships among the gut microbiome, short-chain fatty acids and metabolic diseases. Nat Genet. 2019;51(4):600–605.
38. Nagao-Kitamoto H, Leslie JL, Kitamoto S, et al. Interleukin-22-mediated host glycosylation prevents Clostridioides difficile infection by modulating the metabolic activity of the gut microbiota. Nat Med. 2020;26(4):608–617.
39. Ma Q, Li Y, Wang J, et al. Investigation of gut microbiome changes in type 1 diabetic mellitus rats based on high-throughput sequencing. Biomed Pharmacother. 2020;124:109873.
40. Li R, Huang X, Liang X, Su M, Lai KP, Chen J. Integrated omics analysis reveals the alteration of gut microbe-metabolites in obese adults. Brief Bioinform. 2021;22(3):548.
41. Zhuang P, Li H, Jia W, et al. Eicosapentaenoic and docosahexaenoic acids attenuate hyperglycemia through the microbiome-gut-organs axis in db/db mice. Microbiome. 2021;9(1):185.
42. Lu J, Wang S, Li M, et al. Association of Serum Bile Acids Profile and Pathway Dysregulation With the Risk of Developing Diabetes Among Normoglycemic Chinese Adults: findings From the 4C Study. Diabetes Care. 2021;44(2):499–510.
43. Zhuang P, Shou Q, Lu Y, et al. Arachidonic acid sex-dependently affects obesity through linking gut microbiota-driven inflammation to hypothalamus-adipose-liver axis. Biochim Biophys Acta Mol Basis Dis. 2017;1863(11):2715–2726.
44. Zhou M, Shao J, Wu CY, et al. Targeting BCAA Catabolism to Treat Obesity-Associated Insulin Resistance. Diabetes. 2019;68(9):1730–1746.
45. Li D, Feng Y, Tian M, Ji J, Hu X, Chen F. Gut microbiota-derived inosine from dietary barley leaf supplementation attenuates colitis through PPARgamma signaling activation. Microbiome. 2021;9(1):83.
46. Zhang Y, Bobe G, Miranda CL, et al. Tetrahydroxanthohumol, a xanthohumol derivative, attenuates high-fat diet-induced hepatic steatosis by antagonizing PPARgamma. Elife. 2021;10.
47. Xu X, Gao Z, Yang F, et al. Antidiabetic Effects of Gegen Qinlian Decoction via the Gut Microbiota Are Attributable to Its Key Ingredient Berberine. Genomics Proteomics Bioinformatics. 2020;18(6):721–736.
48. Liu Q, Zhang J, Han X, et al. Huiyang Shengji decoction promotes wound healing in diabetic mice by activating the EGFR/PI3K/ATK pathway. Chin Med. 2021;16(1):111.
49. McDonnell C, Leanez S, Pol O. The Inhibitory Effects of Cobalt Protoporphyrin IX and Cannabinoid 2 Receptor Agonists in Type 2 Diabetic Mice. Int J Mol Sci. 2017;18(11):87.
50. Rao Y, Kuang Z, Li C, et al. Gut Akkermansia muciniphila ameliorates metabolic dysfunction-associated fatty liver disease by regulating the metabolism of L-aspartate via gut-liver axis. Gut Microbes. 2021;13(1):1927619–1927633.
51. Hamada Y, Goto M, Nishimura G, et al. The alpha-glucosidase inhibitor miglitol increases hepatic CYP7A1 activity in association with altered short-chain fatty acid production in the gut of obese diabetic mice. Metabol Open. 2020;5:100024.
52. Castellanos-Jankiewicz A, Guzman-Quevedo O, Fenelon VS, et al. Hypothalamic bile acid-TGR5 signaling protects from obesity. Cell Metab. 2021;33(7):1483–1492.
53. Guo J, Han X, Tan H, Huang W, You Y, Zhan J. Blueberry Extract Improves Obesity through Regulation of the Gut Microbiota and Bile Acids via Pathways Involving FXR and TGR5. iScience. 2019;19:676–690.
 © 2022 The Author(s). This work is published and licensed by Dove Medical Press Limited. The full terms of this license are available at https://www.dovepress.com/terms.php and incorporate the Creative Commons Attribution - Non Commercial (unported, v3.0) License.
By accessing the work you hereby accept the Terms. Non-commercial uses of the work are permitted without any further permission from Dove Medical Press Limited, provided the work is properly attributed. For permission for commercial use of this work, please see paragraphs 4.2 and 5 of our Terms.
© 2022 The Author(s). This work is published and licensed by Dove Medical Press Limited. The full terms of this license are available at https://www.dovepress.com/terms.php and incorporate the Creative Commons Attribution - Non Commercial (unported, v3.0) License.
By accessing the work you hereby accept the Terms. Non-commercial uses of the work are permitted without any further permission from Dove Medical Press Limited, provided the work is properly attributed. For permission for commercial use of this work, please see paragraphs 4.2 and 5 of our Terms.