")
Back to Journals » Cancer Management and Research » Volume 10
LINE-1 ORF-1p enhances the transcription factor activity of pregnenolone X receptor and promotes sorafenib resistance in hepatocellular carcinoma cells
Authors Chen Y , Zeng Q, Liu X, Fu J, Zeng Z, Zhao Z, Liu Z, Bai W, Dong Z, Liu H, Lu X, Zhu Y, Lu Y
Received 1 June 2018
Accepted for publication 2 August 2018
Published 10 October 2018 Volume 2018:10 Pages 4421—4438
DOI https://doi.org/10.2147/CMAR.S176088
Checked for plagiarism Yes
Review by Single anonymous peer review
Peer reviewer comments 2
Editor who approved publication: Professor Raphael Catane
Yan Chen,1,2,* Qinglei Zeng,3,* Xiufang Liu,4 Junliang Fu,1 Zhen Zeng,1 Zhiqin Zhao,1 Ze Liu,1 Wenlin Bai,1 Zheng Dong,1 Hongjin Liu,1 Xiaoxia Lu,1 Yunfeng Zhu,2,5 Yinying Lu1
1Comprehensive Liver Cancer Center, Beijing 302 Hospital, Beijing 100039, P.R. China; 2College of Life Sciences and Bio-Engineering, Beijing Jiaotong University, Beijing 100044, P.R. China; 3Department of Infectious Disease, The First Affiliated Hospital of Zhengzhou University, Zheng Zhou 450052, Henan Province, P.R. China; 4Department of Oncology, Chinese PLA 251 Hospital, Zhangjiakou 075000, P.R. China; 5Cancer Center in Division of Internal Medicine, Chinese PLA General Hospital, Beijing 100853, P.R. China
*These authors contributed equally to this work
Background: LINE-1 ORF-1p is encoded by the human pro-oncogene LINE-1. Our previous work showed that LINE-1 ORF-1p could enhance the resistance of hepatocellular carcinoma (HCC) cells to antitumor agents. However, the mechanisms involved in LINE-1 ORF-1p-mediated drug resistance remain largely unknown.
Materials and methods: The endogenous mRNA level of LINE-1 ORF-1p in clinical HCC specimens was examined using quantitative PCR (qPCR). The prognosis of HCC patients was assessed using time to progression and overall survival. The transcription factor activity of pregnenolone X receptor (PXR) was examined using luciferase gene reporter assays, qPCR, chromatin immunoprecipitation assays and cellular subfraction assays. Protein interaction between LINE-1 ORF-1p and PXR was detected by co-immunoprecipitation. The effect of LINE-1 ORF-1p on sorafenib resistance in HCC cells was studied using in vitro and in vivo models.
Results: A high level of LINE-1 ORF-1p in clinical specimens was related to poor prognosis in patients who received sorafenib treatment. LINE-1 ORF-1p increased the transcription factor activity of PXR by interacting with PXR and enhancing its cytoplasmic/nuclear translocation, and recruiting PXR to its downstream gene promoter, in turn enhancing the expression of the sorafenib resistance-related genes, CYP3A4 and mdr-1. LINE-1 ORF-1p enhanced the resistance to and clearance of sorafenib in HCC cells.
Conclusion: LINE-1 ORF-1p enhances the transcription factor activation of PXR and promotes the clearance of and resistance to sorafenib in HCC cells.
Keywords: LINE-1 ORF-1p, sorafenib resistance, pregnenolone X receptor, hepatocellular carcinoma, transcription factor activation
Introduction
LINE-1, which is an important component of the human genome, was initially characterized by its retrotransposon process and has been shown to participate in the development and progression of several human cancers via epigenetic regulation.1,2 The LINE-1 gene encodes two proteins: LINE-1 ORF-1p and LINE-1 ORF-2p.3 Previous research has often focused on LINE-1 ORF-2p-mediated retrotransposition and previous studies have considered LINE-1 ORF-1p to be a molecular chaperon of LINE-1 ORF-2p.4 However, in cancers such as breast cancer or hepatocellular carcinoma (HCC), the expression level of LINE-1 ORF-1p is higher than that of LINE-1 ORF-2p, and LINE-1 ORF-1p itself also likely has important functions.5,6 Therefore, the role and biological function of LINE-1 ORF-1p are not clearly understood. Our previous work showed that LINE-1 ORF-1p could promote the survival of HCC cells and induce drug resistance-related gene expression, but the regulatory mechanism of LINE-1 ORF-1p in multidrug resistance in HCC cells is largely unknown.7
Although the recent application of the molecular targeted agent sorafenib improved the survival of patients suffering from advanced HCC, the effects of sorafenib are far from satisfactory: >50% of the patients were initially sorafenib resistant; only 26%–43% of the patients were sensitive to sorafenib, and they may develop sorafenib resistance during treatment.8 Our previous work reported on a novel endogenous sorafenib resistance mechanism, whereby the pregnenolone X receptor (PXR) nuclear receptor can be activated by interacting with sorafenib, which induces the expression of the downstream sorafenib resistance-related genes CYP3A4 and mdr-1.9 Therefore, we postulate that LINE-1 ORF-1p plays a role in sorafenib treatment failure and correlates with PXR-mediated sorafenib resistance.
In the current study, we show that LINE-1 ORF-1p interacts with PXR. LINE-1 ORF-1p increased PXR transcription factor activity by enhancing the cytoplasmic/nuclear translocation of PXR and the recruitment of PXR to the CYP3A4 promoter or enhancer region. LINE-1 ORF-1p may also promote the clearance of sorafenib in HCC cells. Therefore, we conclude that LINE-1 ORF-1p could be a therapeutic target for overcoming sorafenib resistance in HCC.
Materials and methods
Patients and quantitative PCR (qPCR)
The collection of clinical specimens was with the informed consent of patients, and all experimental protocols were approved by the ethics committee of No. 302nd hospital, Chinese People’s Liberation Army. A total of 52 HCC cases were included and described in our previous work (Table S1).9 Patients whose tissues were used in this research provided written informed consent and had been described in our previous work.9 Total RNA sample from HCC patients or cell lines was extracted using a PARISTM Kit (Thermo Fisher Scientific, Waltham, MA, USA) and reverse transcribed by Multiscribe™ Reverse Transcriptase (Thermo Fisher Scientific). qPCR (real-time PCR) was performed following the methods described in Ma et al10 and Ji et al.11 Primers used in qPCR are listed in Table S2.
Plasmids
The expression of siRNA vectors of LINE-1 ORF-1p has been described in our previous work.12,13 Expression vectors of PXR were purchased from Vigene Corporation (Jinan, P.R. China). PXR-response luciferase reporters (XREM-Luc or PXRE-Luc) have been described in our previous work.9 To construct PXR truncated mutants, the truncated FLAG-PXR-NTD (N-terminal domain, residues 1–40), FLAG-PXR-DBD (DNA-binding domain, residues 41–110), FLAG-PXR-HD (hinge domain, residues 1–140) and FLAG-PXR-LBD (ligand-binding domain, residues 141–434) sequences were amplified and cloned into the pcDNA3.0-FLAG vector. All of the expression vectors were confirmed by DNA sequencing.
Cell culture and agents
MHCC97-H cell, a highly aggressive HCC cell line, was purchased from Type Culture Collection of the Chinese Academy of Sciences (Shanghai, P.R. China), a type culture resource of the Chinese government.14,15 MHCC87-H cells were maintained under recommended culture conditions described in our previous work.14,15 LM-3, another highly aggressive HCC cell line, was a gift from Dr Yingshi Zhang in Department of Pharmacy, General Hospital of Shenyang Military Area Command, Shenyang, P.R. China. Molecular targeted agents sorafenib (Cat. No. S7397), rifampicin (Cat. No. S1764) and ketoconazole (Cat. No. S1353) were purchased from Selleck Corporation (Houston, TX, USA). For cell survival examination, sorafenib was dissolved in dimethyl sulfoxide and diluted in DMEM with a final concentration of 1%. Cells were treated with indicated concentrations (10, 3, 1, 0.3, 0.1, 0.03 and 0.01 μmol/L) of sorafenib for indicated time points. Next, cells were harvested for MTT experiments according to manufacturer’s instructions (Amresco, Cleveland, OH, USA). The inhibition rate of sorafenib was calculated as (OD 490 control group − OD 490 nm administration group)/(OD 490 nm control group). For sorafenib clearance experiments, sorafenib (2 mg) was dissolved in 10 µL dimethyl sulfoxide, 50 µL polyethylene glycol 400 and 30 µL Tween 80. Then, the sorafenib solution was carefully diluted with physiological saline to 1 mL total volume. The final concentration of sorafenib in this solution was 2 mg/mL, and this sorafenib-containing solution was named as Sor-Sol.
Luciferase assay
MHCC97-H cells were cultured in phenol red-free DMEM supplemented with 1% charcoal/dextran-treated FBS (Hyclone, Waltham, MA, USA) and seeded into 24-well plates (Corning Incorporated, Corning, NY, USA). Next, the cells were transfected with PXR-responsive Luciferase reporters (XREM-Luc or PXRE-Luc), treated with indicated concentration of rifampicin and analyzed for luciferase or β-galactosidase activities following methods described previously.16–19
Antibodies and Western blot
Antibodies against LINE-1 ORF-1p, PXR, CYP 3A4, P-gp, LaminA/C and β-actin were obtained from Santa Cruz Biotechnology (Dallas, TX, USA) and are described in our previous work.9,20 Western blot was performed following the protocol described previously.9,20 Protein level was identified by antibodies.
Co-immunoprecipitation
The MHCC97-H cells were transfected with indicated expression plasmids and harvested and lysed in the immunoprecipitation (IP) buffer. The co-immunoprecipitation (Co-IP) analysis was performed with anti-FLAG antibodies (Sigma-Aldrich, St Louis, MO, USA) and then detected by the immunoblotting (IB) assay.21,22
Subcellular fractionation
All animal experiment protocols were approved by the Institutional Animal Care and Use Committee of the 302nd hospital, Chinese PLA, and all animal studies were performed and carried out in accordance with the UK Animals (Scientific Procedures) Act, 1986 and associated guidelines. All experiments were performed after obtaining written confirmation from the Institutional Animal Care and Use Committee of the 302nd hospital, Chinese PLA. The subcellular location of PXR or LINE-1 ORF-1p was examined by subcellular fractionation assays.23,24 MHCC97-H cells, which were transfected with vectors or treated with agents, were then homogenized using a Dounce homogenizer, and the homogenate was centrifuged at 366× g for 10 minutes at 4°C to separate nuclear fraction. Next, the supernatant was centrifuged again at 13,201× g for 15 minutes at 4°C, and the final supernatant was the cytoplasmic fraction. Next, Western blot was performed. β-Actin was chosen as the cytoplasmic indicator, and Lamin A/C was used as the nuclear indicator.
Clearance of sorafenib
To examine whether LINE-1 ORF-1p overexpression could accelerate the clearance of sorafenib in MHCC-97H cells, the clearance curve and half-life (t1/2 values) of sorafenib were determined. For cell-based examination, MHCC97-H cells (1×10⁸–2×10⁸), which were transfected with control or LINE-1 ORF-1p, were cultured with IC50 concentration of sorafenib for 12 hours. Then, the cells were harvested at indicated time points. The remaining sorafenib in MHCC97-H cells was extracted by acetonitrile and quantitated by liquid chromatography–mass spectrometry/mass spectrometry (LC-MS/MS) using the methods described in Feng et al9 and Wu et al.25
For subcutaneous tumor experiments, MHCC97-H cells were injected into nude mice to form subcutaneous tumors as mentioned earlier. Sor-Sol was injected into HCC subcutaneous tumors (20 µL per tumor). At indicated time points, tumor tissues were harvested, and the remaining sorafenib in the tissues was extracted by acetonitrile. The amount of sorafenib was measured by LC-MS/MS.9,25
Transwell assay (in vitro migration and invasion)
MHCC97-H cells, which were transfected by empty vectors, LINE-1 ORF-1p vectors, control siRNA or LINE-1 ORF-1p siRNA, were treated with the IC50 concentration of sorafenib for 48 hours. Then, the cells were analyzed by Transwell assays following the methods described in Xiong et al,26 Wu et al27 and Zheng et al.28
Antitumor activity of sorafenib in MHCC97-H cells in vivo
All animal experiment protocols were approved by the Institutional Animal Care and Use Committee of the 302nd hospital, Chinese PLA and all animal studies were performed and carried out in accordance with the UK Animals (Scientific Procedures) Act, 1986 and associated guidelines. MHCC97-H or LM-3 cells, which were transfected with plasmids, were injected into nude mice to form subcutaneous tumors following the methods mentioned earlier. Seven to ten days after injection, the mice received solvent control or 2 mg/kg oral sorafenib (every 2 days) treatment. After 3 weeks of treatment, all mice were sacrificed, and the final volume and the weight of tumors were measured.29,30
Next, MHCC97-H or LM-3 cells were transfected with plasmids and were directly inoculated into the mice’s liver via hepatic portal vein injection (5×10⁵ cells per animal). After 5–10 days, the mice received solvent control or 2 mg/kg oral sorafenib (every two days) treatment. After 3 weeks of treatment, all mice were sacrificed and the final volume and the weight of tumors were measured. After 3 weeks of treatment, all mice were examined by positron emission tomography/computed tomography (PET/CT) scanner (Philips Corp., Holland, The Netherlands) as described by Xu et al31 and Zhang et al.32 After PET/CT analysis, animals were harvested and the nodules formed by HCC cells in nude mice’s liver were identified by obtaining photographs of the liver. The amount of nodules was quantitatively analyzed by measuring radioactivation31,32 or the area of nodules following the methods adopted by Xie et al.33
Statistical analysis
Statistical analysis was carried out by Bonferroni’s correction with or without two-way ANOVA using SPSS statistical software (SPSS 19.0; IBM Corporation, Armonk, NY, USA). The IC50 value/concentration of sorafenib in MHCC97-H cells or the half-life (t1/2 value) of sorafenib was calculated by the Origin software (Origin 6.1; OriginLab Corporation, Northampton, MA, USA). P-value of <0.05 was considered statistically significant.
Results
High endogenous LINE-1 ORF-1p expression is associated with poor sorafenib therapy outcomes for patients with advanced HCC
First, we examined endogenous LINE-1 ORF-1p mRNA levels in clinical specimens from advanced HCC patients who received sorafenib treatment, through qPCR experiments (fold changes in LINE-1 mRNA levels compared with β-actin). Based on the median expression value (0.0009), we divided patients into two groups: a LINE-1 ORF-1p low group (0.00001–0.0009) and a LINE-1 ORF-1p high group (0.0009–0.0024), as shown in Figure 1A and B and Tables S3 and S4. The data indicate that patients in the LINE-1 ORF-1p high group had a poorer prognosis compared with those in the LINE-1 ORF-1p low group (Table 1; Figure 1C and D). The median time to progression (TTP) of patients in the LINE-1 ORF-1p high group (8.0 months; 95% CI: 6.8–10.6 months) was significantly lower than that of patients in the PXR-low group (11.0 months; 95% CI: 9.1–12.0 months; log-rank P=0.0002), and the median overall survival (10.0 months; 95% CI: 6.1–13.8 months) in the LINE-1 ORF-1p high group was lesser than that in the LINE-1 ORF-1p low group (14.0 months; 95% CI: 11.4–16.3 months; log-rank P=0.0381). Moreover, the overall response rate (complete remission [CR]+partial remission [PR]) and the disease control rate (CR+PR+stable disease [SD]) in the LINE-1 ORF-1p high group (CR+PR, 4.17%; CR+PR+SD, 10.71%) were much lower than those in the LINE-1 ORF-1p low group (CR+PR, 16.67%; CR+PR+SD, 32.14%), as shown in Table 1. Therefore, high endogenous LINE-1 ORF-1p expression is associated with poor sorafenib therapy outcomes in patients with advanced HCC.
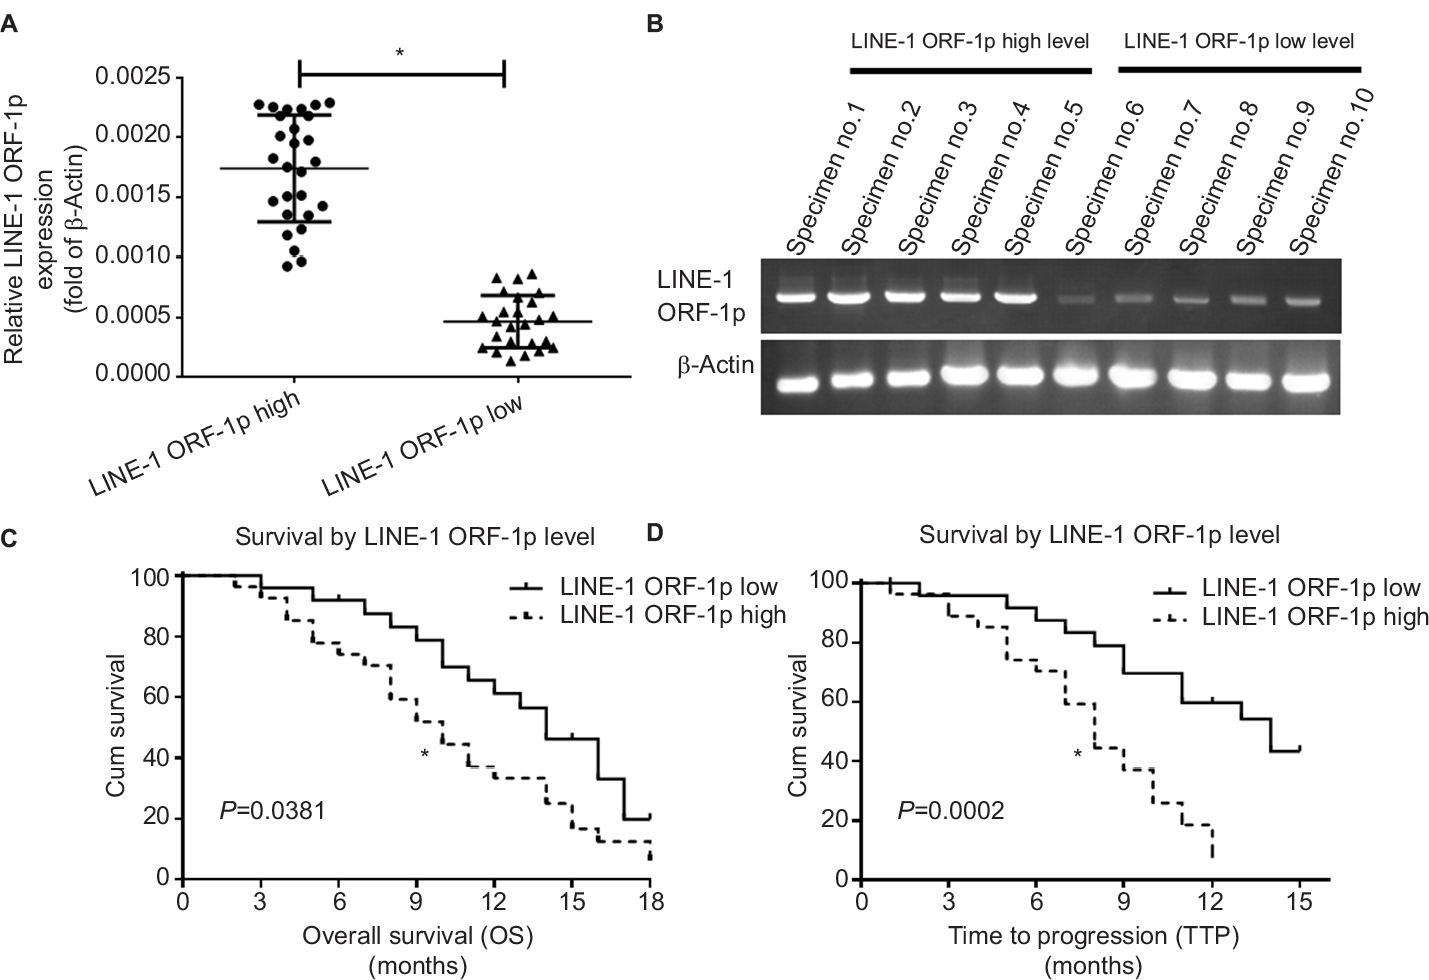 | Figure 1 Endogenous LINE-1 ORF-1p mRNA levels in advanced HCC clinical specimens in relation to the prognosis of patients who received sorafenib treatment. Notes: (A and B) Endogenous mRNA expression of LINE-1 ORF-1p was identified using qPCR for relative RNA levels (A) or representative DNA electrophoresis bands from ten representative specimens (five high and five low) (B). (C) The OS and (D) TTP of patients who received sorafenib are shown. (C and D) Significant differences in the survival analysis were assessed using the Kaplan–Meier and log-rank tests. *P<0.05. Abbreviations: Cum, cumulative; HCC, hepatocellular carcinoma; OS, overall survival; qPCR, quantitative PCR; TTP, time to progression. |
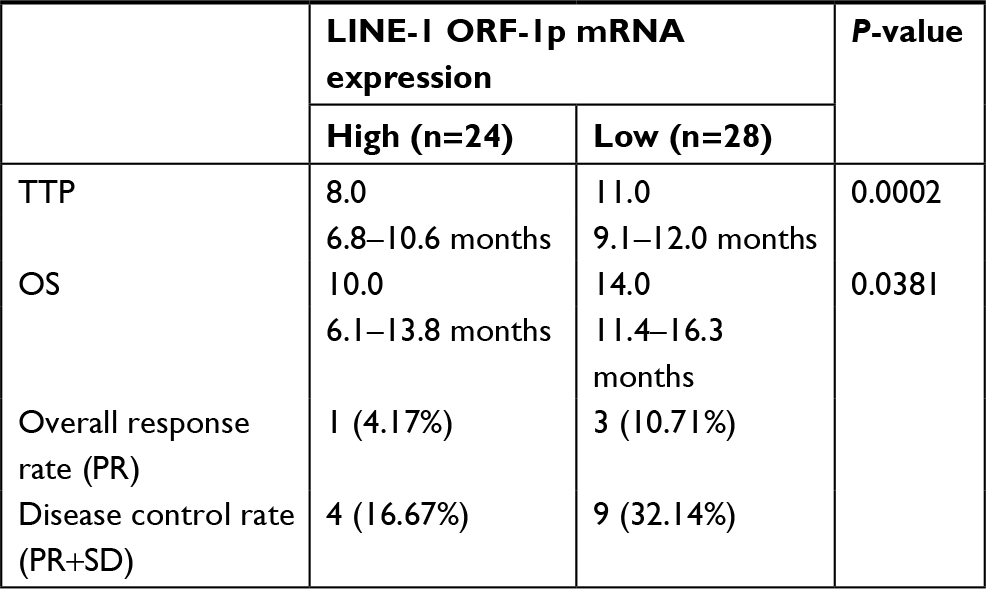 | Table 1 LINE-1 ORF-1p expression and clinical outcome of sorafenib treatment Abbreviations: CR, complete remission; OS, overall survival; PR, partial remission; SD, stable disease; TTP, time to progression. |
LINE-1 ORF-1p enhances the transcription factor activity of PXR in a ligand-dependent manner
To define the role of LINE-1 ORF-1p in regulating PXR activation, luciferase assays were performed. PXR could be activated by its ligand rifampicin; without rifampicin, PXR did not show any transcription factor activity (Figure 2). Upon rifampicin induction, LINE-1 ORF-1p overexpression enhanced the luciferase activity of the PXR responding reporters PXRE-Luc (Figure 2A) and XREM-Luc (Figure 2B), whereas knockdown of LINE-1 ORF-1p by siRNA decreased PXRE-Luc or XREM-Luc activity in the presence of rifampicin (Figure 2C and D). Therefore, LINE-1 ORF-1p enhances ligand-induced PXR transcription factor activity.
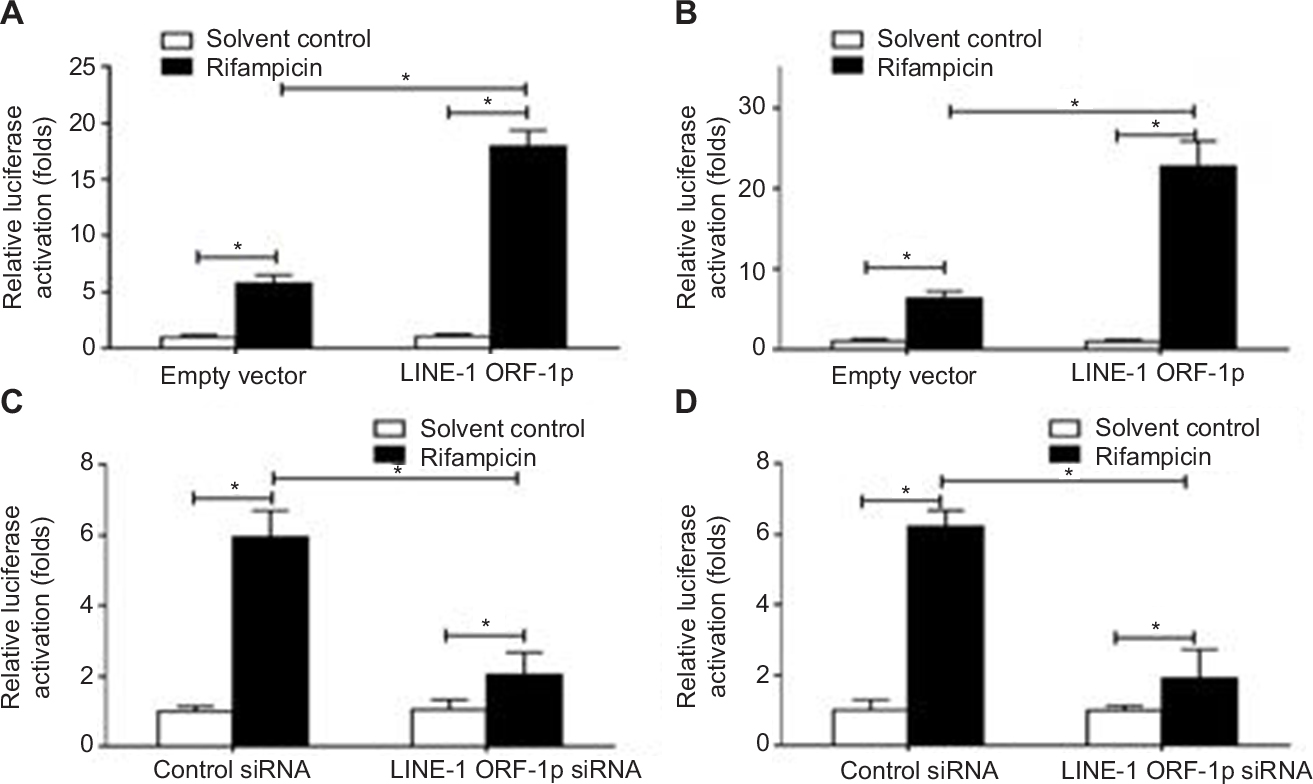 | Figure 2 LINE-1 ORF-1p enhanced the transcription factor activation of PXR in HCC cells. Notes: (A and B) MHCC97-H cells were co-transfected with empty vector and LINE-1 ORF-1p vectors, PXRE-Luc (A) or XREM-Luc (B). (C and D) MHCC97-H cells were co-transfected with control siRNA and LINE-1 ORF-1p siRNA, PXRE-Luc (C) or XREM-Luc (D). Cells were harvested for luciferase analysis. *P<0.05. Abbreviations: HCC, hepatocellular carcinoma; PXR, pregnenolone X receptor. |
LINE-1 ORF-1p increases the expression of PXR downstream genes
To confirm the effect of LINE-1 ORF-1p on PXR, qPCR and Western blot assays were performed. The results showed that overexpression of LINE-1 ORF-1p enhanced the mRNA levels of two PXR downstream genes, CYP3A4 and mdr-1 (Figure 3A and B), whereas knockdown of LINE-1 ORF-1p decreased the mRNA levels of CYP3A4 and mdr-1 (Figure 3C and D).
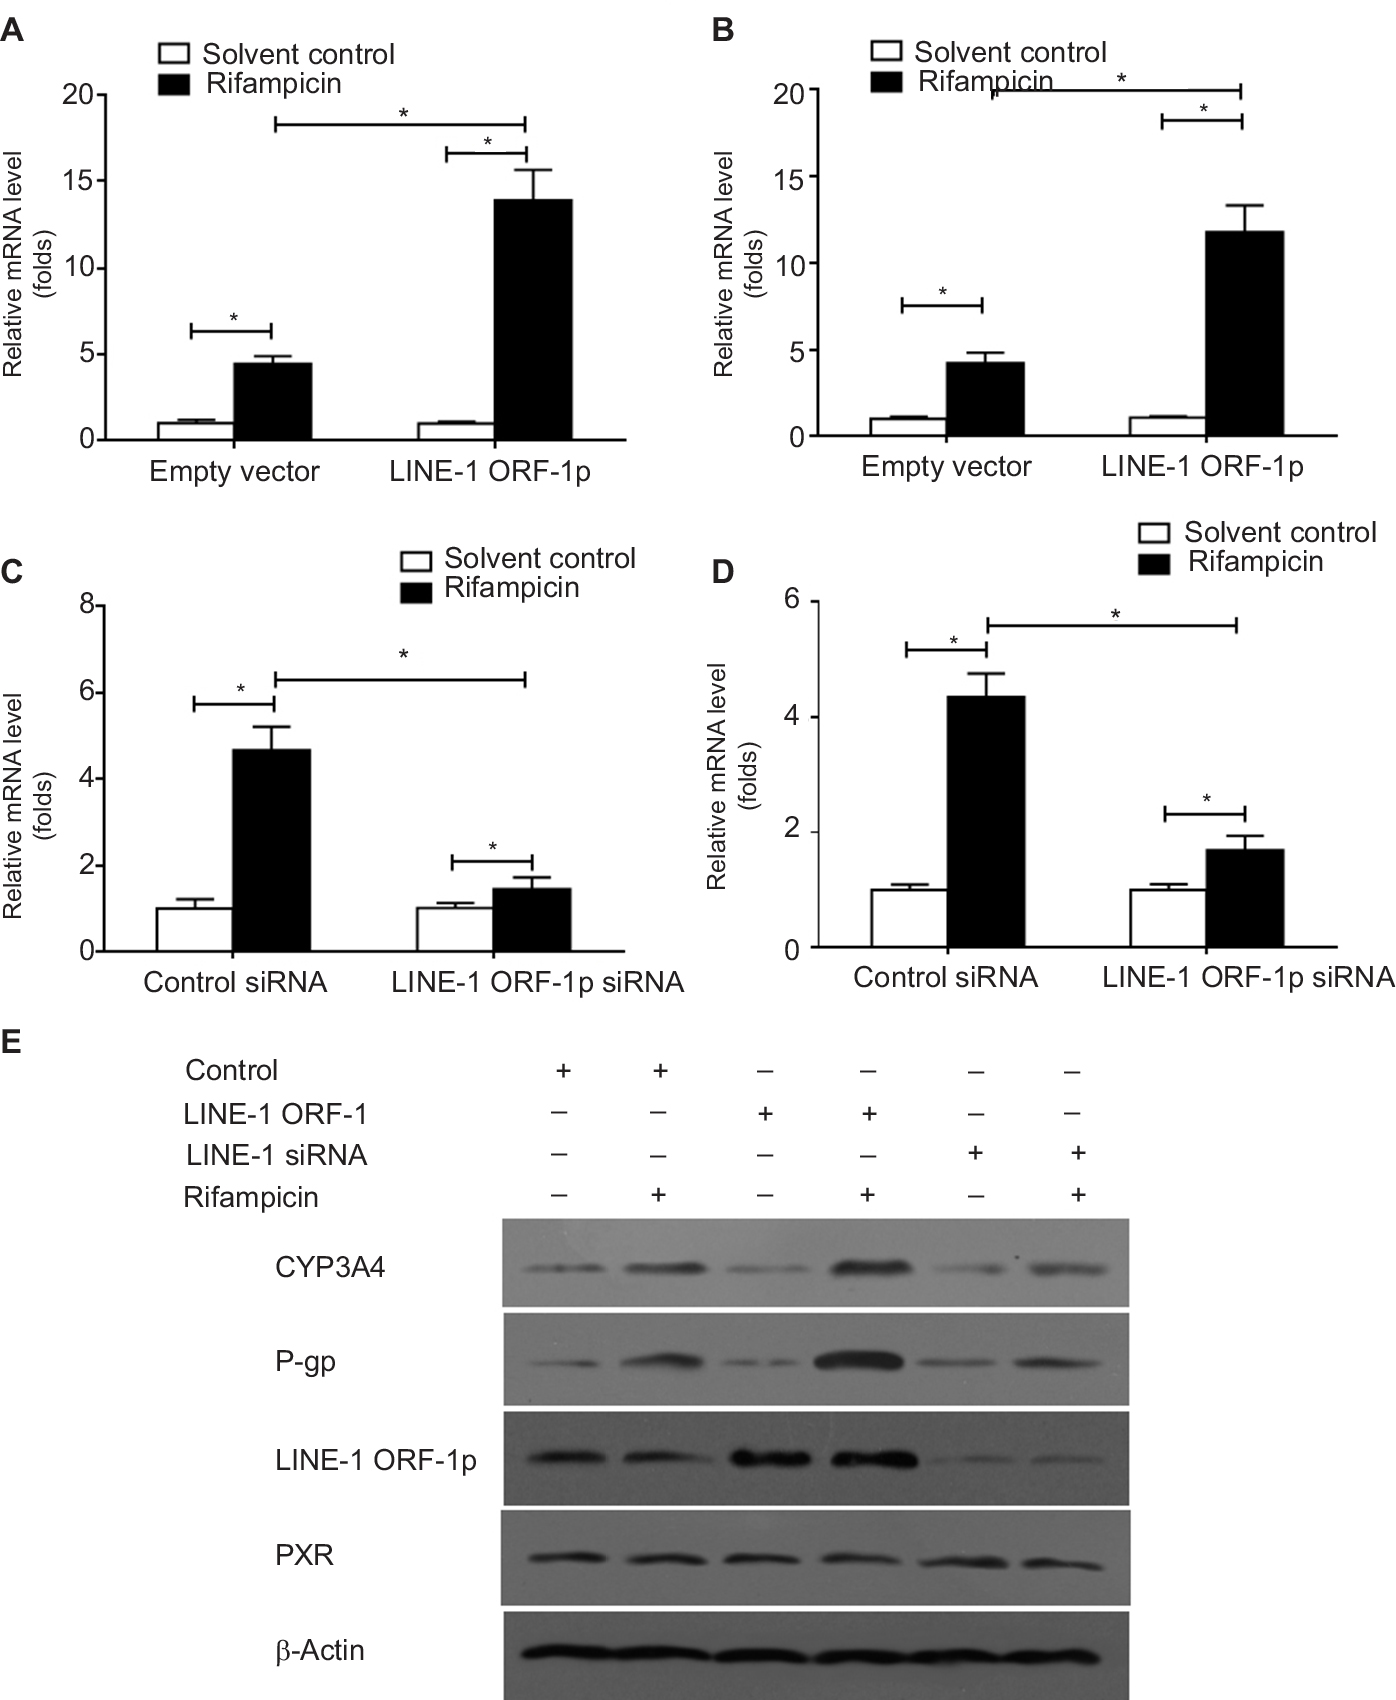 | Figure 3 LINE-1 ORF-1p enhanced the expression of PXR downstream genes in HCC cells. Notes: (A and B) MHCC97-H cells were transfected with an empty vector or LINE-1 ORF-1p vectors. (C and D) MHCC97-H cells were transfected with control siRNA or LINE-1 ORF-1p siRNA. Cells were harvested for qPCR analysis. Relative mRNA levels for CYP3A4 (CYP/CYP450 group 3A type 4) (A and C) or MDR-1 (multidrug resistance) (D) were determined through qPCR. (E) MHCC97-H cells were transfected with an empty vector, LINE-1 ORF-1p, control siRNA or LINE-1 ORF-1p vectors. The protein level of LINE-1 ORF-1p, PXR, CYP3A4 or P-gp was identified through Western blotting. *P<0.05. Abbreviations: HCC, hepatocellular carcinoma; PXR, pregnenolone X receptor; qPCR, quantitative PCR. |
Moreover, the protein expression of CYP3A4 and P-gp (encoded by the mdr-1 gene) was examined. As shown in Figure 3E, LINE-1 ORF-1p overexpression enhanced the expression of CYP3A4 and P-gp induced by rifampicin. Silencing of LINE-1 ORF-1p via its siRNA decreased the expression of CYP3A4 and P-gp induced by rifampicin. Therefore, LINE-1 ORF-1p increased the expression of PXR downstream genes in a ligand-dependent manner.
LINE-1 ORF-1p interacts with PXR
Next, we examined the interaction between PXR and LINE-1 ORF-1p. MHCC97-H cells were co-transfected with FLAG-LINE-1 ORF-1p, FLAG empty vectors, HA-PXR or HA empty vectors. Cells were harvested after 24 hours for Co-IP and IB assays. FLAG-LINE-1 ORF-1p interacted with HA-PXR in the presence of rifampicin (Figure 4A). Moreover, FLAG-PXR also interacted with HA-LINE-1 ORF-1p (Figure 4B).
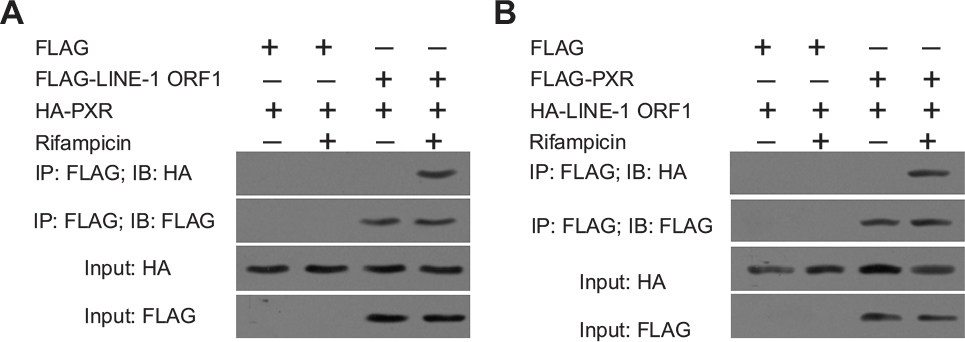 | Figure 4 LINE-1 ORF-1p could interact with PXR. MHCC97-H cells were transfected with FLAG, FLAG-LINE-1 ORF-1p or HA, HA-PXR vectors. Notes: (A) MHCC97-H cells were transfected with FLAG, FLAG-PXR or HA, HA-LINE-1 ORF-1p vectors. (B) Cells were cultured without or with rifampicin at 10 µM. The IP analysis was performed using an anti-FLAG antibody, and the IB analysis was performed using an anti-HA antibody. Abbreviations: IB, immunoblotting; IP, immunoprecipitation; PXR, pregnenolone X receptor. |
To identify the binding regions in PXR and LINE-1 ORF-1p, MHCC97-H cells were transfected with FLAG-tagged truncated PXR fragments and a HA-LINE-1 ORF-1p vector. Then, cells were harvested for Co-IP experiments. Figure 5A demonstrates that LINE-1 ORF-1p interacted with the PXR LBD in a ligand-dependent manner. Moreover, we examined which domain of LINE-1 ORF-1p interacted with PXR. As shown in Figure 5B, PXR interacted with the coiled-coil (C–C) domain (1–160 region) of LINE-1 ORF-1p. These results suggest that the LINE-1 ORF-1p C–C domain interacts with the PXR LBD domain.
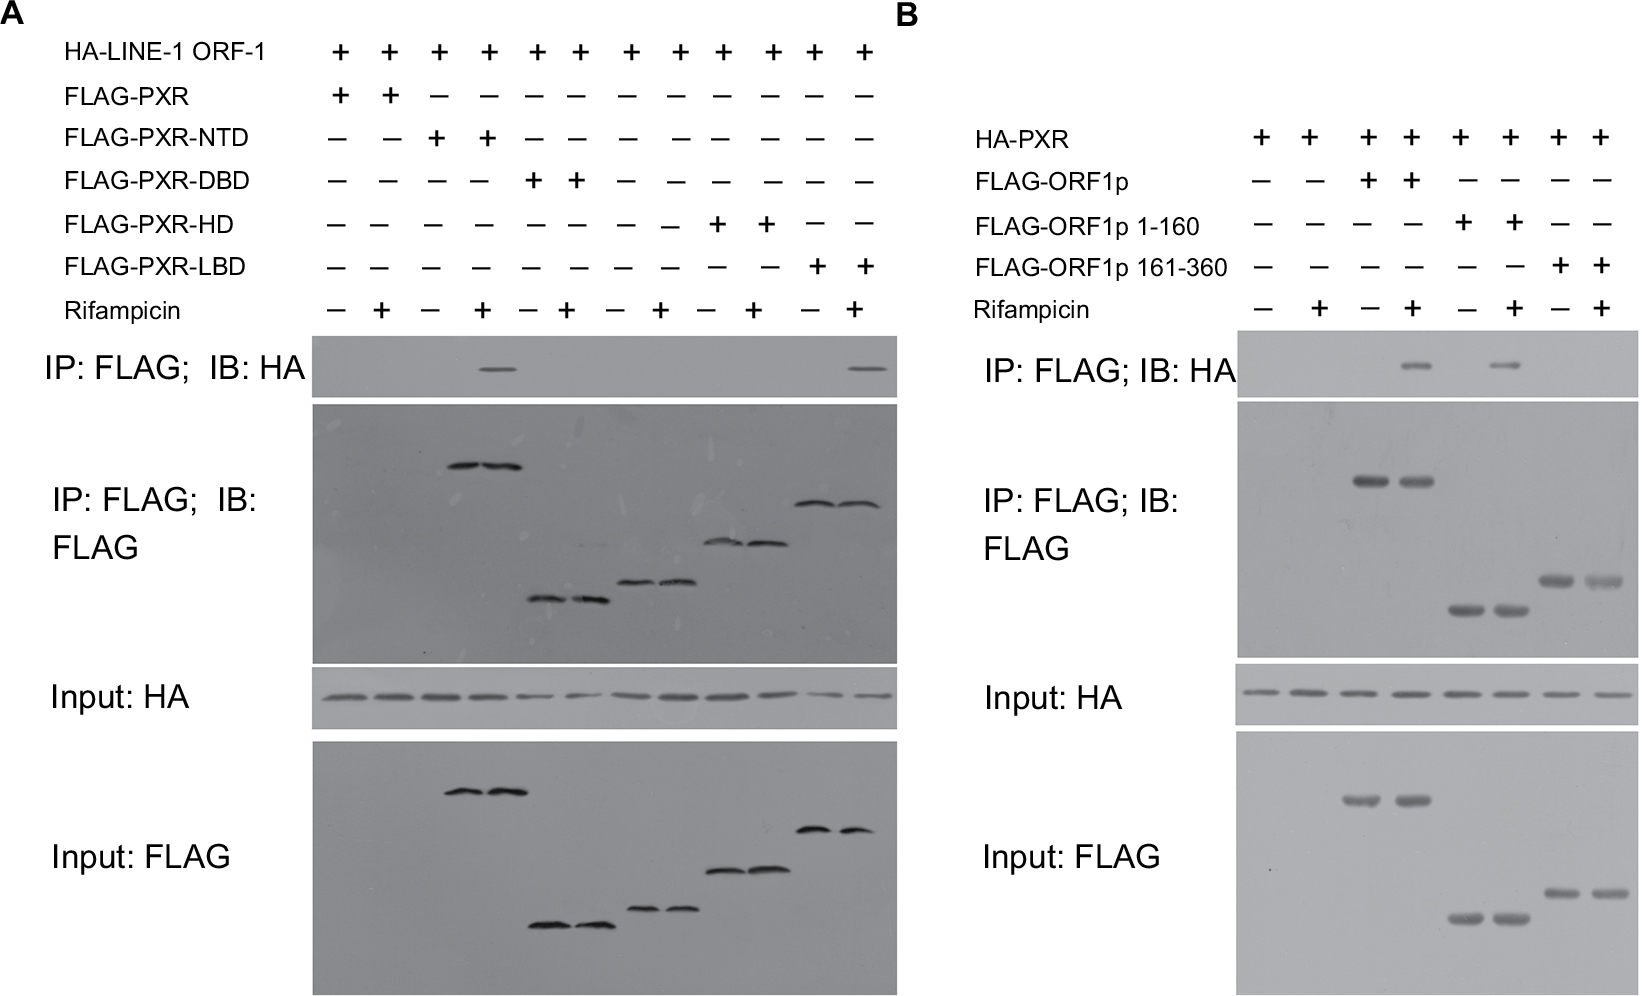 | Figure 5 The LINE-1 ORF-1p C–C domain can interact with the PXR LBD. Notes: (A) MHCC97-H cells were transfected with full-length FLAG-PXR or truncated mutants of PXR and HA-tagged LINE-1 ORF1-p. (B) MHCC97-H cells, which were transfected with full-length FLAG-LINE-1 ORF-1p or truncated mutants of LINE-1 ORF-1p and HA-tagged PXR, were lysed and immunoprecipitated with an anti-FLAG antibody. IB analysis was then performed using an anti-HA antibody. Abbreviations: IB, immunoblotting; IP, immunoprecipitation; LBD, ligand-binding domain; PXR, pregnenolone X receptor. |
LINE-1 ORF-1p enhances the nuclear accumulation of PXR
To further examine the effect of LINE-1 ORF-1p on PXR, the nuclear accumulation of PXR was assessed. As shown in Figure 6, PXR was distributed in both the nucleus and cytoplasm of MHCC97-H cells in the quiescent state and could translocate from the cytoplasm to the nucleus in the presence of rifampicin. Overexpression of LINE-1 ORF-1p enhanced the accumulation of PXR in the nucleus, whereas knockdown of LINE-1 ORF-1p attenuated PXR nuclear accumulation (Figure 6A and B). Therefore, LINE-1 ORF-1p could modulate the transcription factor activity of PXR through cytoplasmic/nuclear translocation.
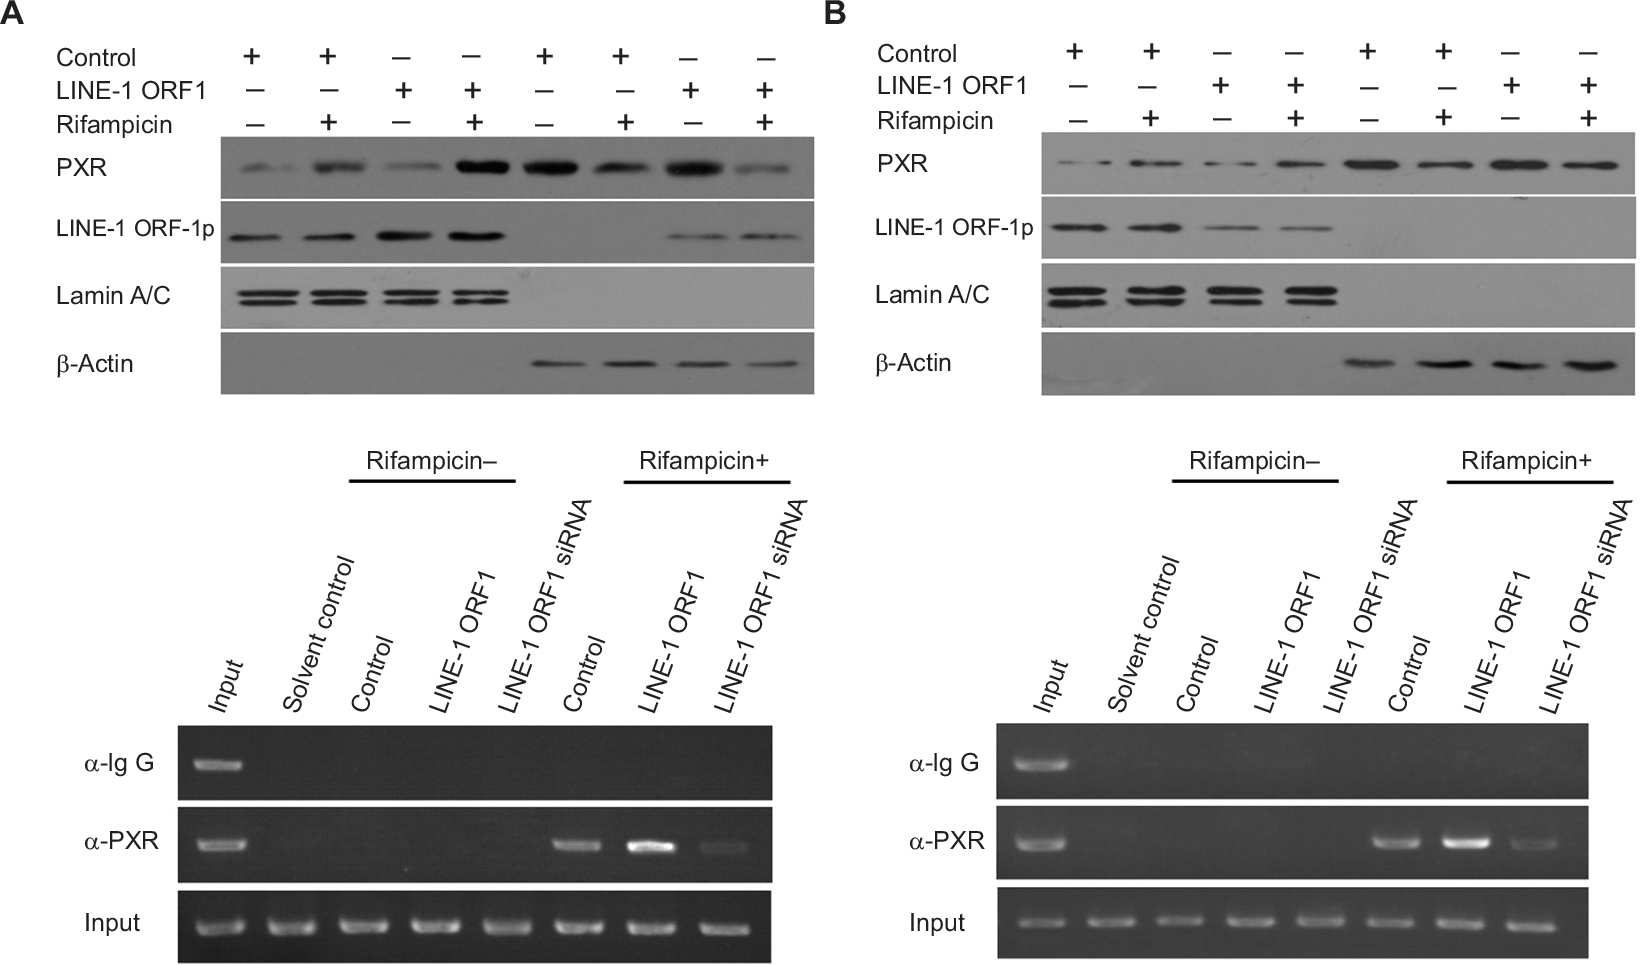 | Figure 6 The effect of LINE-1 ORF-1p on PXR cytoplasmic/nuclear translocation and recruitment to the promoter or enhancer region of CYP3A4. Notes: MHCC97-H cells were transfected with an empty vector, the expression vector for LINE-1 ORF-1p (A and C), control siRNA or the siRNA for LINE-1 ORF-1p (B and D) and treated with or without 10 μmol/L rifampicin. (A and B) Cells were fractionated into cytoplasmic fractions and nuclear fractions. The fractions were probed using anti-LINE-1 ORF-1p and anti-PXR antibodies. Lamin A/C was chosen as the nuclear marker and ß-actin as the cytoplasmic marker. (C and D) Cells were harvested for ChIP experiments. Immunoprecipitated DNA was PCR amplified using primers that were consistent with the PXR binding sites in the CYP3A4 promoter or enhancer region. Abbreviations: ChIP, chromatin immunoprecipitation; PXR, pregnenolone X receptor. |
LINE-1 ORF-1p enhances the recruitment of PXR to CYP3A4 gene promoter or enhancer regions
The recruitment of PXR to CYP3A4 gene promoter (PXRE, −362/+52) or enhancer (XREM, −7,836/–7,208) regions was detected through a chomatin IP (ChIP) assay. As shown in Figure 6C and D, PXR could be recruited to CYP3A4 gene promoter (Figure 6C) and enhancer (Figure 6D) regions in the presence of rifampicin. Overexpression of LINE-1 ORF-1p enhanced the binding of PXR to the promoter/enhancer regions. Silencing of LINE-1 ORF-1p via its siRNA attenuated the recruitment of PXR to CYP3A4 gene promoter (Figure 6C) or enhancer (Figure 6D) regions. These results suggest that LINE-1 ORF-1p can modulate the recruitment of PXR to its downstream gene promoter or enhancer region.
LINE-1 ORF-1p accelerates the clearance of sorafenib in MHCC97-H cells
MHCC97-H cells transfected with LINE-1 ORF-1p-expressing plasmids or LINE-1 ORF-1p siRNA plasmids were treated with 1 μmol/L sorafenib (the IC50 dose of sorafenib) for 12 hours. Then, we started the measurement of sorafenib levels in MHCC97-H cells. Cells were harvested at indicated time points (start point: 12 hours after sorafenib treatment), and LC-MS/MS assays were performed. As shown in Figure 7A, sorafenib was almost completely cleared within 24 hours in cultured MHCC97-H cells. The half-life (t1/2 value) of sorafenib is 11.52±0.38 hours. Overexpression of LINE-1 ORF-1p promoted the clearance of sorafenib in MHCC97-H cells and the half-life decreased to 6.32±0.29 hours. To study the role of LINE-1 ORF-1p in sorafenib clearance in vivo, MHCC97-H subcutaneous tumors were treated with sorafenib solution via intratumoral injection, and the sorafenib remaining in tumor tissues was assessed at each time point. As shown in Figure 7B, sorafenib was almost completely cleared from tumor tissues at 48 hours, with a half-life (t1/2 value) of 20.37±0.75 hours. Overexpression of LINE-1 ORF-1p promoted the clearance of sorafenib in HCC tumors and decreased the half-life (t1/2 value) of sorafenib to 13.25±0.63 hours.
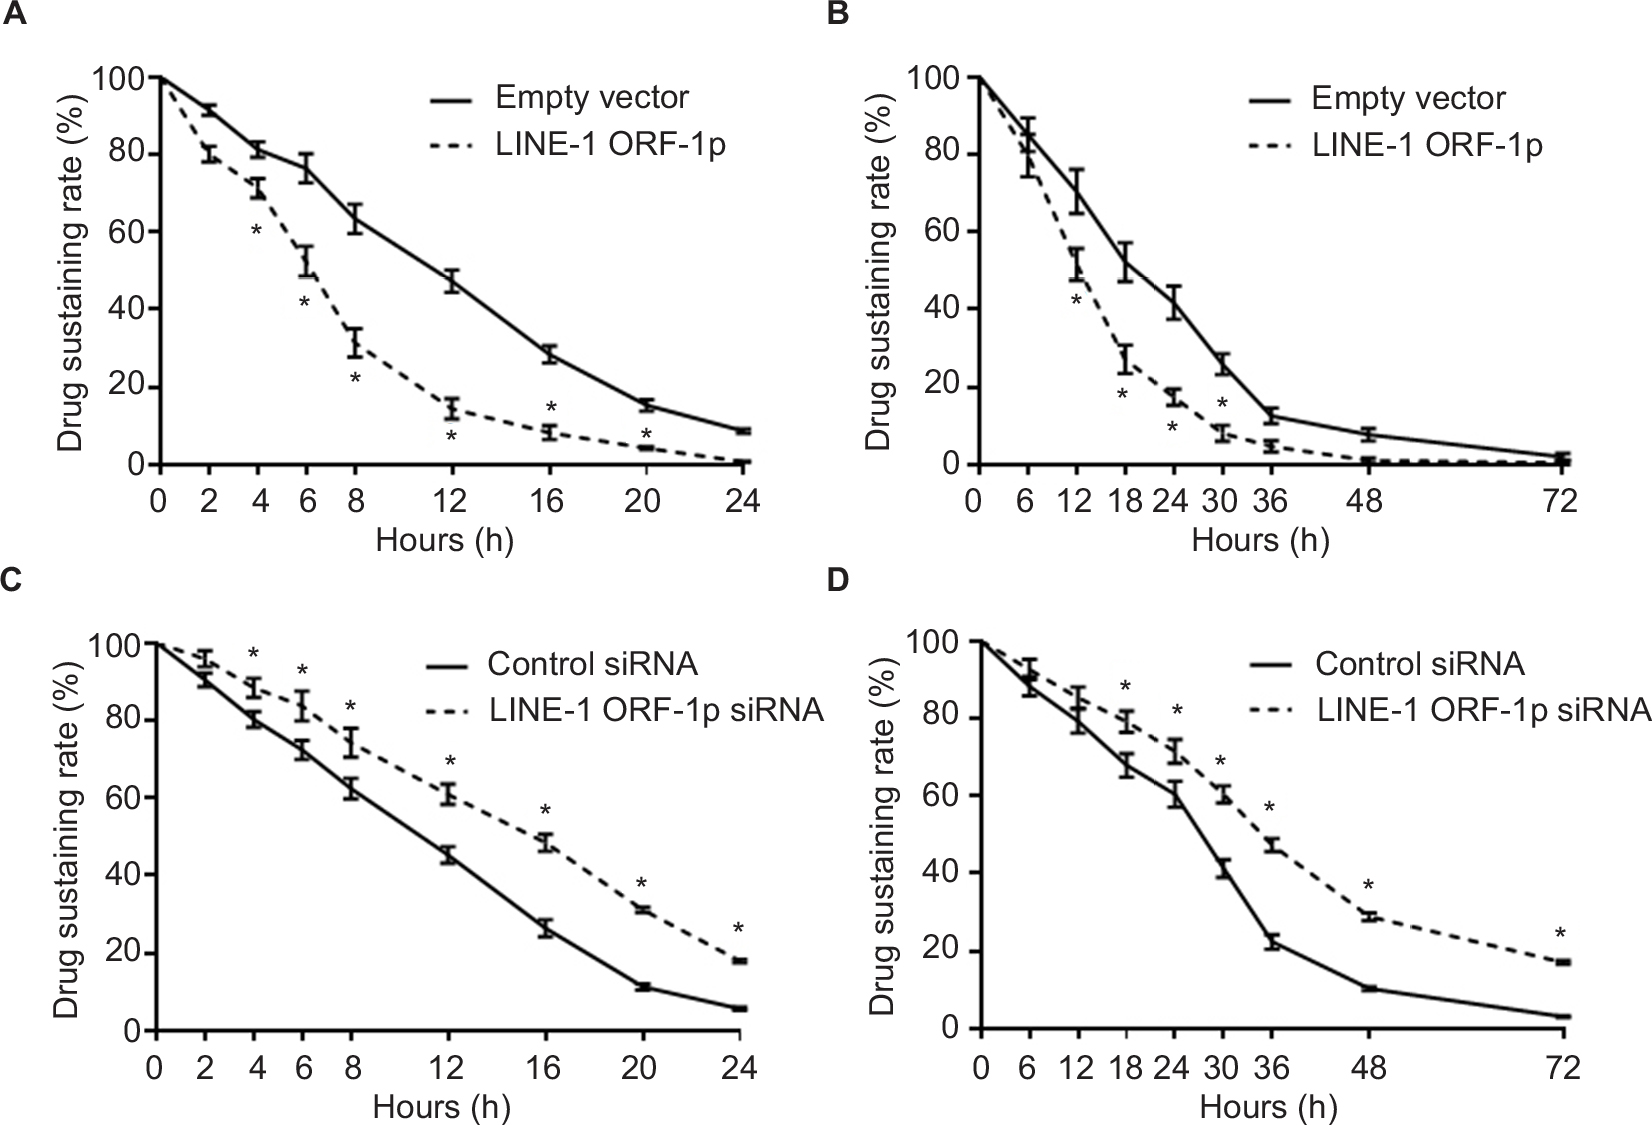 | Figure 7 LINE-1 ORF-1p promotes the metabolism or clearance of sorafenib in MHCC97-H cells. Notes: (A and B) MHCC97-H cells were transfected with an empty vector or LINE-1 ORF-1p. (C and D) MHCC97-H cells were transfected with control siRNA or LINE-1 ORF-1p siRNA. Then, cells were treated using the IC50 concentration of sorafenib for 12 hours (A and C) and harvested at the indicated time points. (B and D) MHCC97-H cells were injected into nude mice to form subcutaneous tumors. Sorafenib solution was injected into the tumors and tumor tissues were harvested at the indicated time points. Cell or tumor tissue samples were analyzed using LC-MS/MS to measure the remaining sorafenib. The concentration curve is shown as mean±SD. *P<0.05. Abbreviation: LC-MS/MS, liquid chromatography–mass spectrometry/mass spectrometry. |
Next, the effect of the knockdown of LINE-1 ORF-1p expression on the clearance of sorafenib in MHCC97-H cells was examined. As shown in Figure 7C, knockdown of LINE-1 ORF-1p expression decelerated the clearance of sorafenib in cultured MHCC97-H cells and the sorafenib half-life (t1/2 value) increased from 11.08±0.35 to 15.27±0.42 hours. Knockdown of LINE-1 ORF-1p also decelerated the clearance of sorafenib in MHCC97-H subcutaneous tumors (Figure 7D) and the sorafenib half-life (t1/2 value) increased from 26.26±0.70 to 36.43±1.44 hours. Therefore, LINE-1 ORF-1p participates in the clearance of sorafenib in MHCC97-H cells.
LINE-1 ORF-1p decreases the antitumor effect of sorafenib in vitro
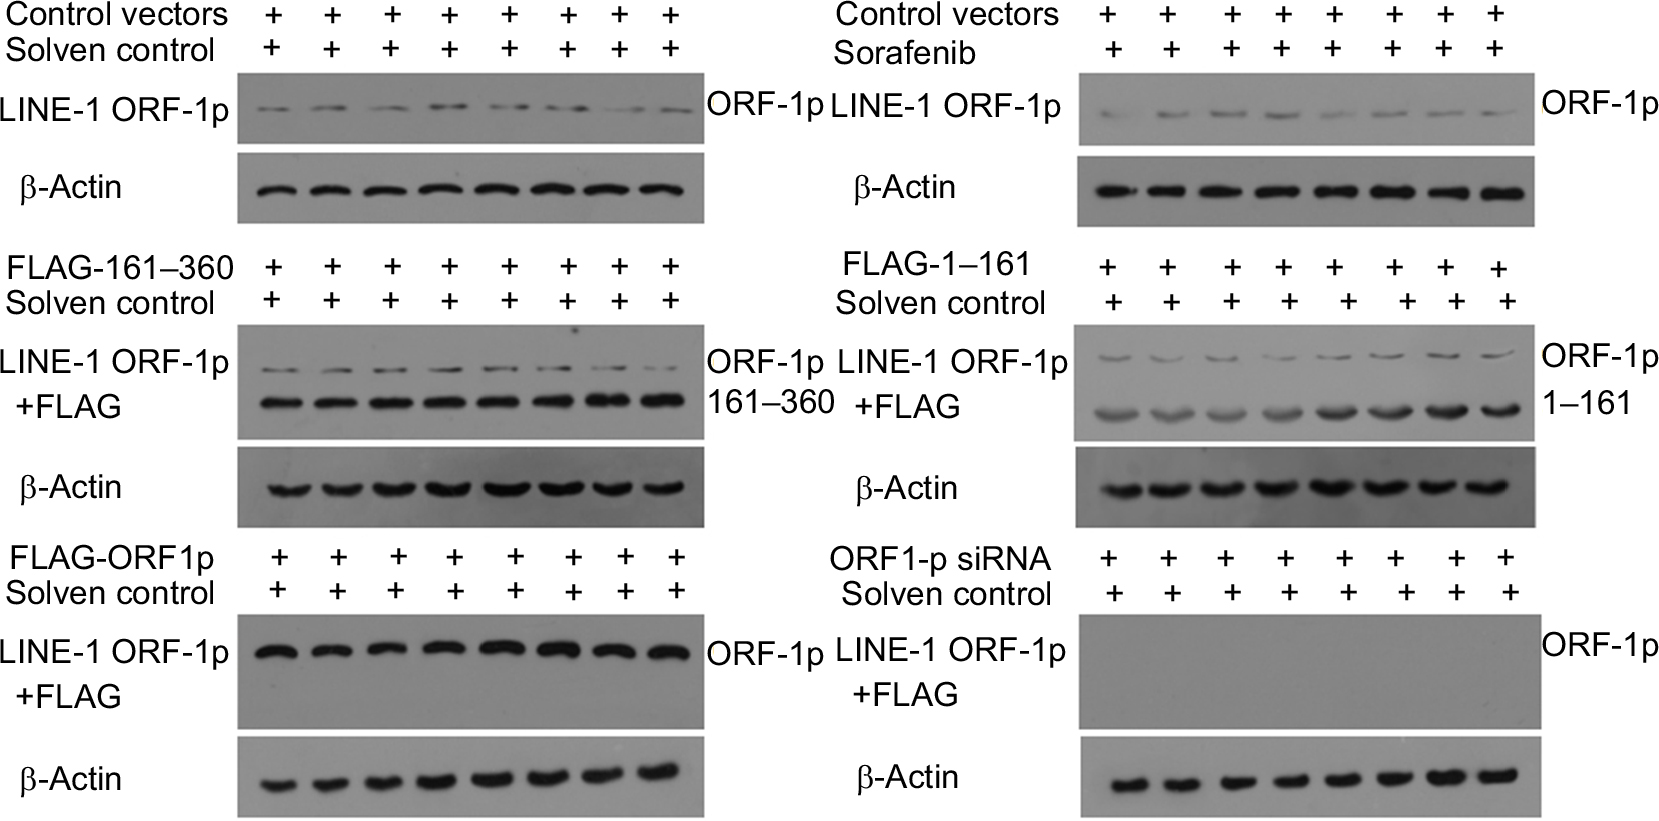
To examine whether LINE-1 ORF-1p modulates the antitumor effect of sorafenib, MTT assays were performed. Overexpression of LINE-1 ORF-1p enhanced the resistance of MHCC97-H cells to sorafenib, whereby the IC50 value of sorafenib increased from 1.08±0.12 to 6.91±0.36 μmol/L, indicating a 6.4-fold increase in sorafenib resistance (Table 2). Moreover, knockdown of LINE-1 ORF-1p significantly enhanced the antitumor effect of sorafenib in MHCC97-H cells with the IC50 decreasing from 1.08±0.12 to 0.14±0.05 µmol/L (Table 2). Next, to study the specificity of the effect of LINE-1 ORF-1p, truncated LINE-1 ORF-1p vectors were used. As shown in Table 2, the LINE-1 ORF-1p C–C domain (1–160) could enhance the resistance of MHCC97-H cells to sorafenib, whereas the RNA recognition motif/carboxyl-terminal domain (RRM/CTD; residues 161–360) could not.
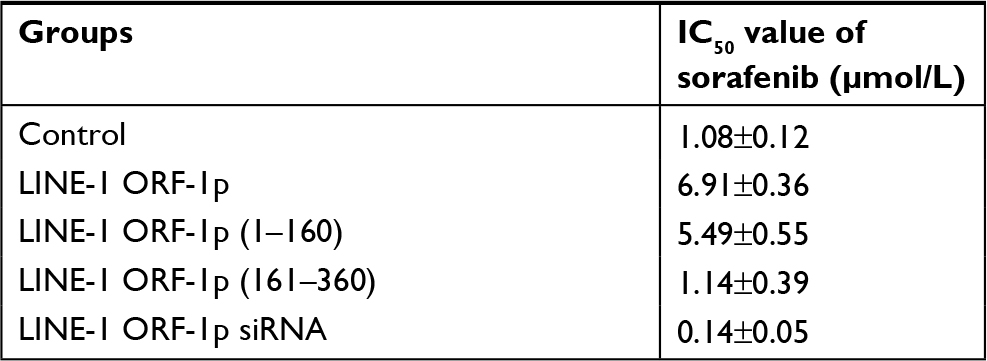 | Table 2 Effect of LINE-1 ORF-1p on sorafenib’s antitumor activity |
To further examine the effect of LINE-1 ORF-1p on sorafenib resistance, a Transwell assay was performed. As shown in Figure 8, sorafenib significantly inhibited the in vitro invasion (Figure 8A) or migration (Figure 8B) of MHCC97-H cells. Overexpression of LINE-1 ORF-1p or the C–C domain of LINE-1 ORF-1p decreased the antitumor effect of sorafenib in inhibiting MHCC97-H cell invasion (Figure 8A) and migration (Figure 8B) in vitro. Taken together, these results indicate that LINE-1 ORF-1p could decrease the in vitro antitumor effect of sorafenib in MHCC97-H cells.
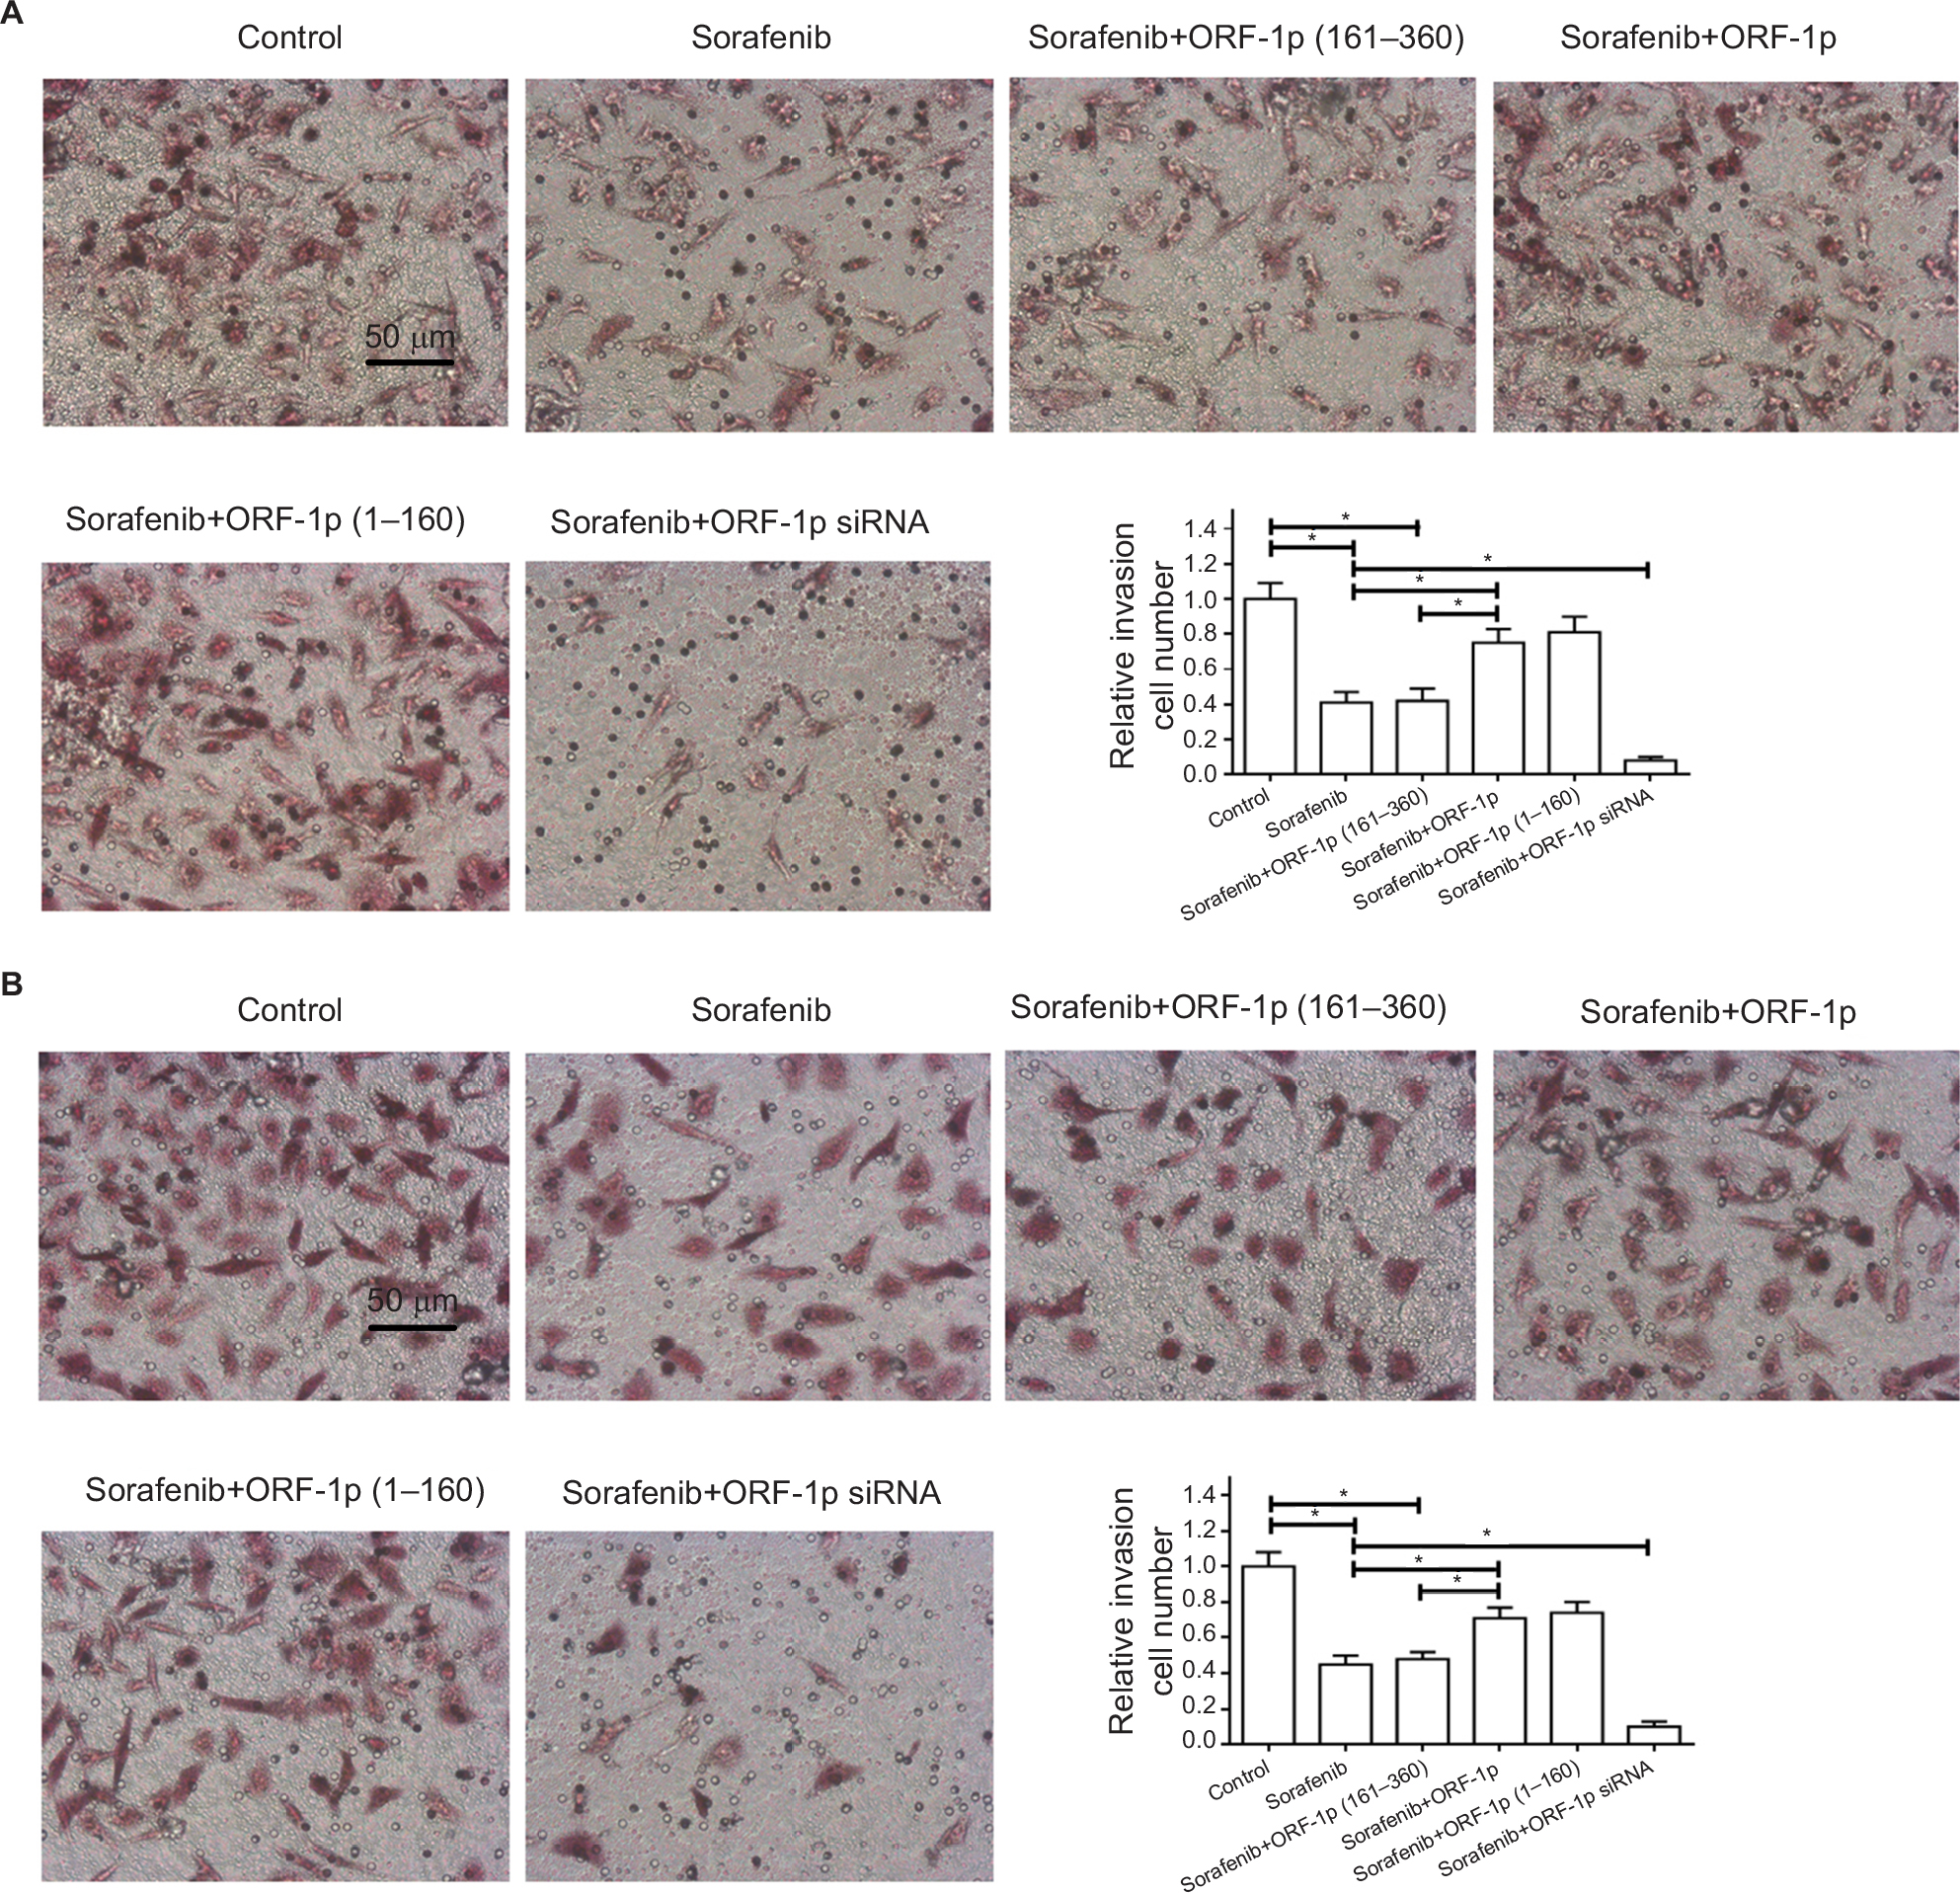 | Figure 8 LINE-1 ORF-1p decreased the antitumor effect of sorafenib in inhibiting MHCC97-H cell invasion or migration in vitro. Notes: MHCC97-H cells were transfected with an empty vector, a full-length LINE-1 ORF-1p vector, LINE-1 ORF-1p 1–160 residues, control siRNA or LINE-1 ORF-1p siRNA vectors. Cells were treated using the IC50 concentration of sorafenib for 48 hours and then harvested for in vitro invasion (A) or in vitro migration (B) tests. The results are shown as representative photographs or mean±SD. *P<0.05. |
LINE-1 ORF-1p decreases the antitumor effect of sorafenib in vivo
The antitumor activation of sorafenib was examined in vivo in both a subcutaneous tumor model and an intrahepatic tumor model. For the subcutaneous tumor experiments, MHCC97-H cells transfected with control or LINE-1 ORF-1p-expressing plasmids were subcutaneously injected into nude mice to establish tumors. Overexpression of LINE-1 ORF-1p or the C–C domain of LINE-1 ORF-1p decreased the antitumor effect of sorafenib, whereas transfection with the RRM/CTD domains of LINE-1 ORF-1p did not have this effect. Moreover, silencing of LINE-1 ORF-1p expression enhanced the antitumor effect of sorafenib (Figure 9A–C). To confirm these results, the expression of LINE-1 ORF-1p, the C–C domain of LINE-1 ORF-1p or the RRM/CTD domains was assessed in subcutaneous tumor tissues through Western blotting (Figure S1).
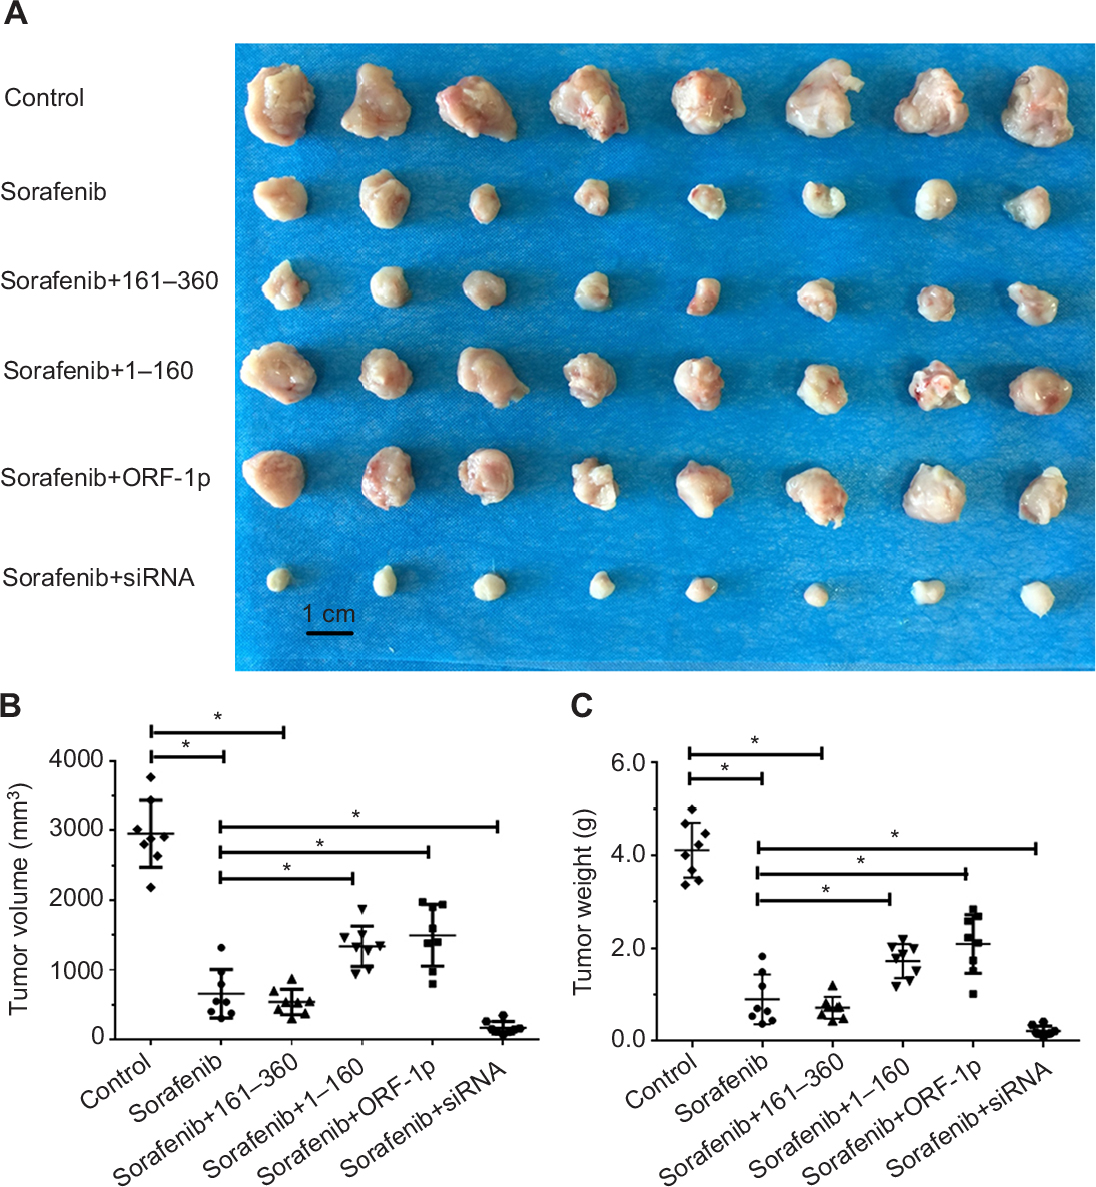 | Figure 9 LINE-1 ORF-1p decreased the antitumor effect of sorafenib in inhibiting MHCC97-H cell subcutaneous growth in vivo. Notes: MHCC97-H cells, which were transfected with empty vector, a full-length LINE-1 ORF-1p vector, LINE-1 ORF-1p 1–160 residues, control siRNA or LINE-1 ORF-1p siRNA vectors, were seeded into nude mice to form subcutaneous tumors. The mice received sorafenib. (A) The results are shown as representative photographs of tumors, (B) tumor volumes or (C) tumor weight. *P<0.05. |
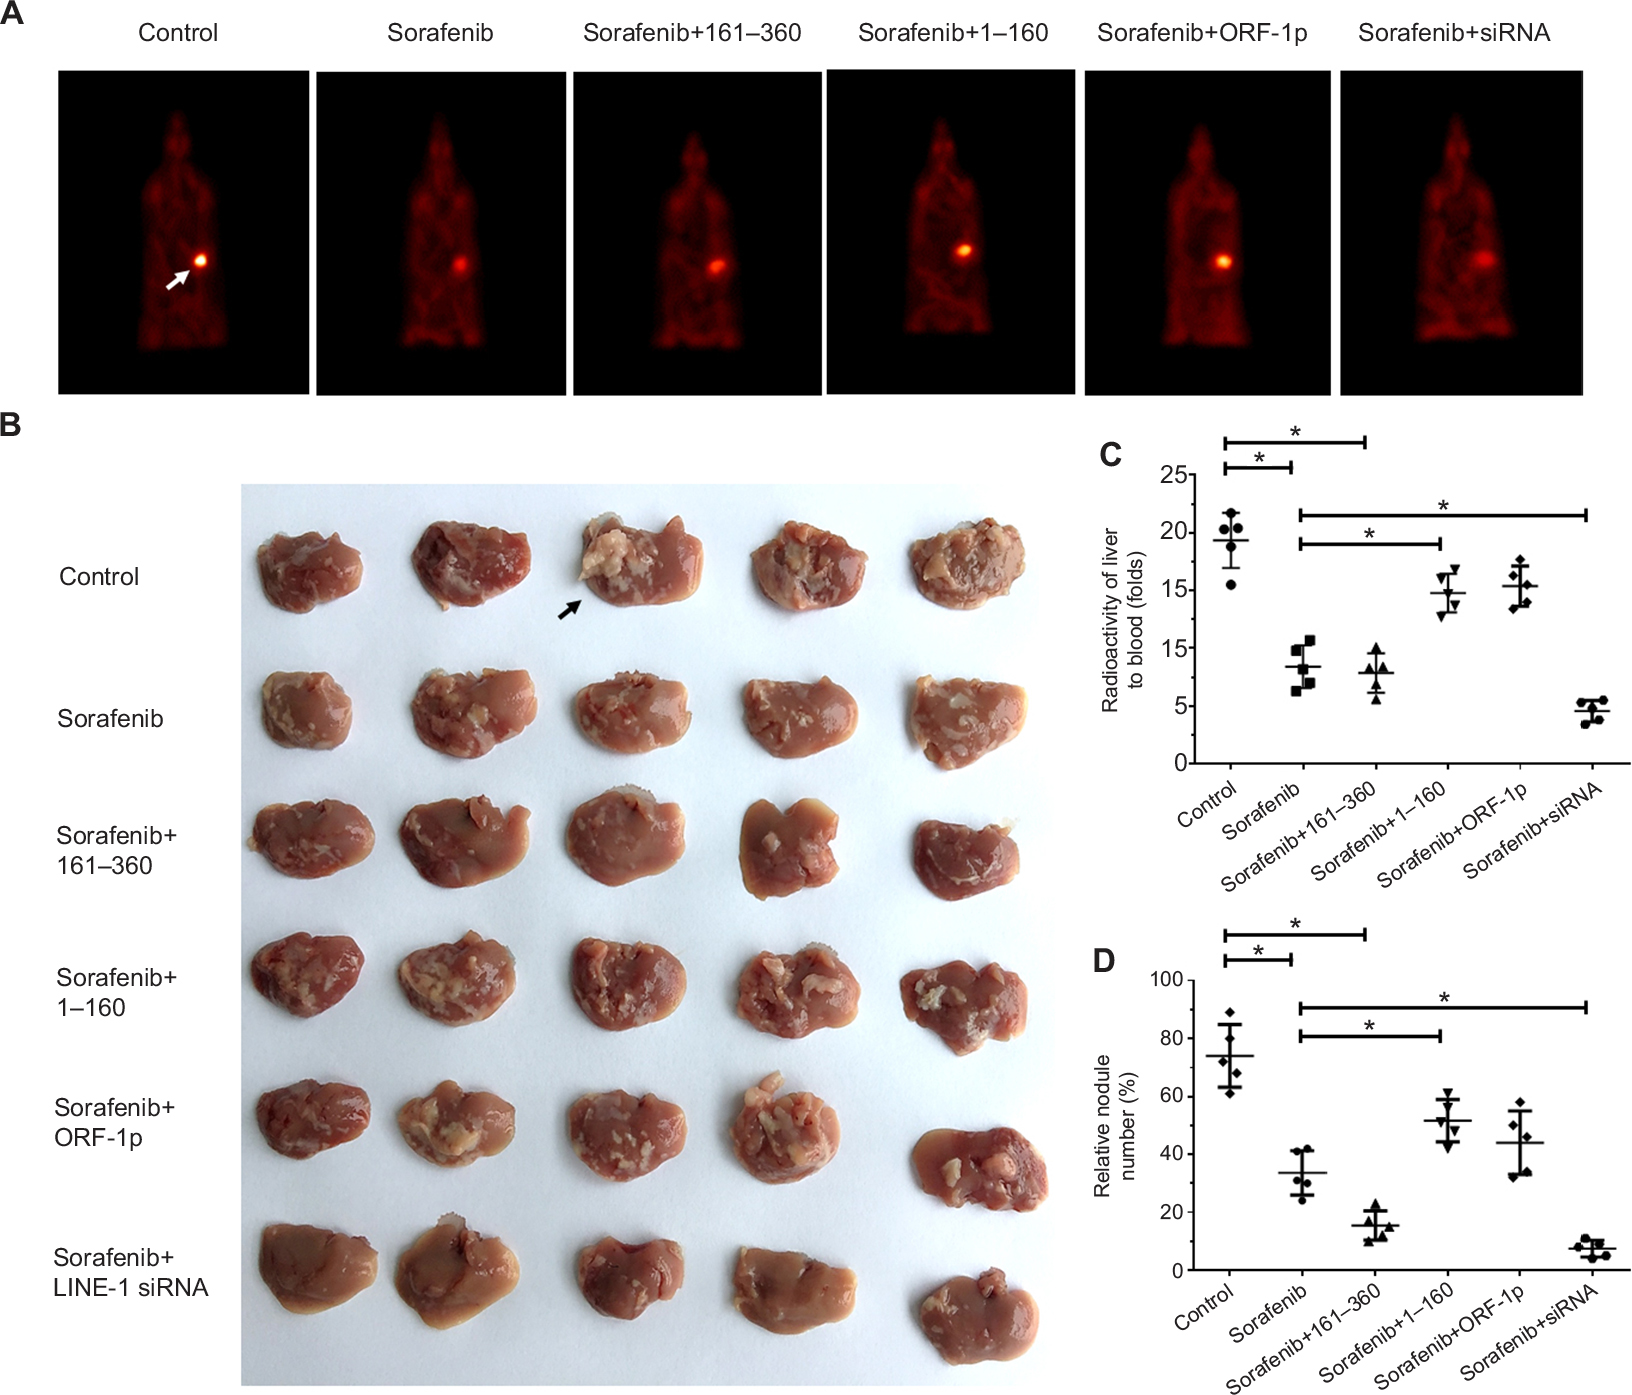
To assess the intrahepatic growth of MHCC97-H cells, MHCC97-H cells were injected into nude mouse livers via the hepatic portal vein. As shown in Figure 10, MHCC97-H cells formed multiple and diffuse nodules in the liver, and sorafenib treatment attenuated the expansion of MHCC97-H cells in nude mouse livers. Overexpression of LINE-1 ORF-1p or the C–C domain of LINE-1 ORF-1p, but not the RRM/CTD domains of LINE-1 ORF-1p, attenuated the antitumor effect of sorafenib on the intrahepatic growth of MHCC-97H cells, while silencing of LINE-1 ORF-1p had the opposite effect. Moreover, similar results were obtained in LM-3 cell subcutaneous tumor experiments (Figure 11) or intrahepatic tumor experiments (Figure 12), and these results confirmed the LINE-1 ORF-1p in vivo results. Therefore, both the in vitro and in vivo data indicated that LINE-1 ORF-1p reduced the antitumor effect of sorafenib in HCC cells.
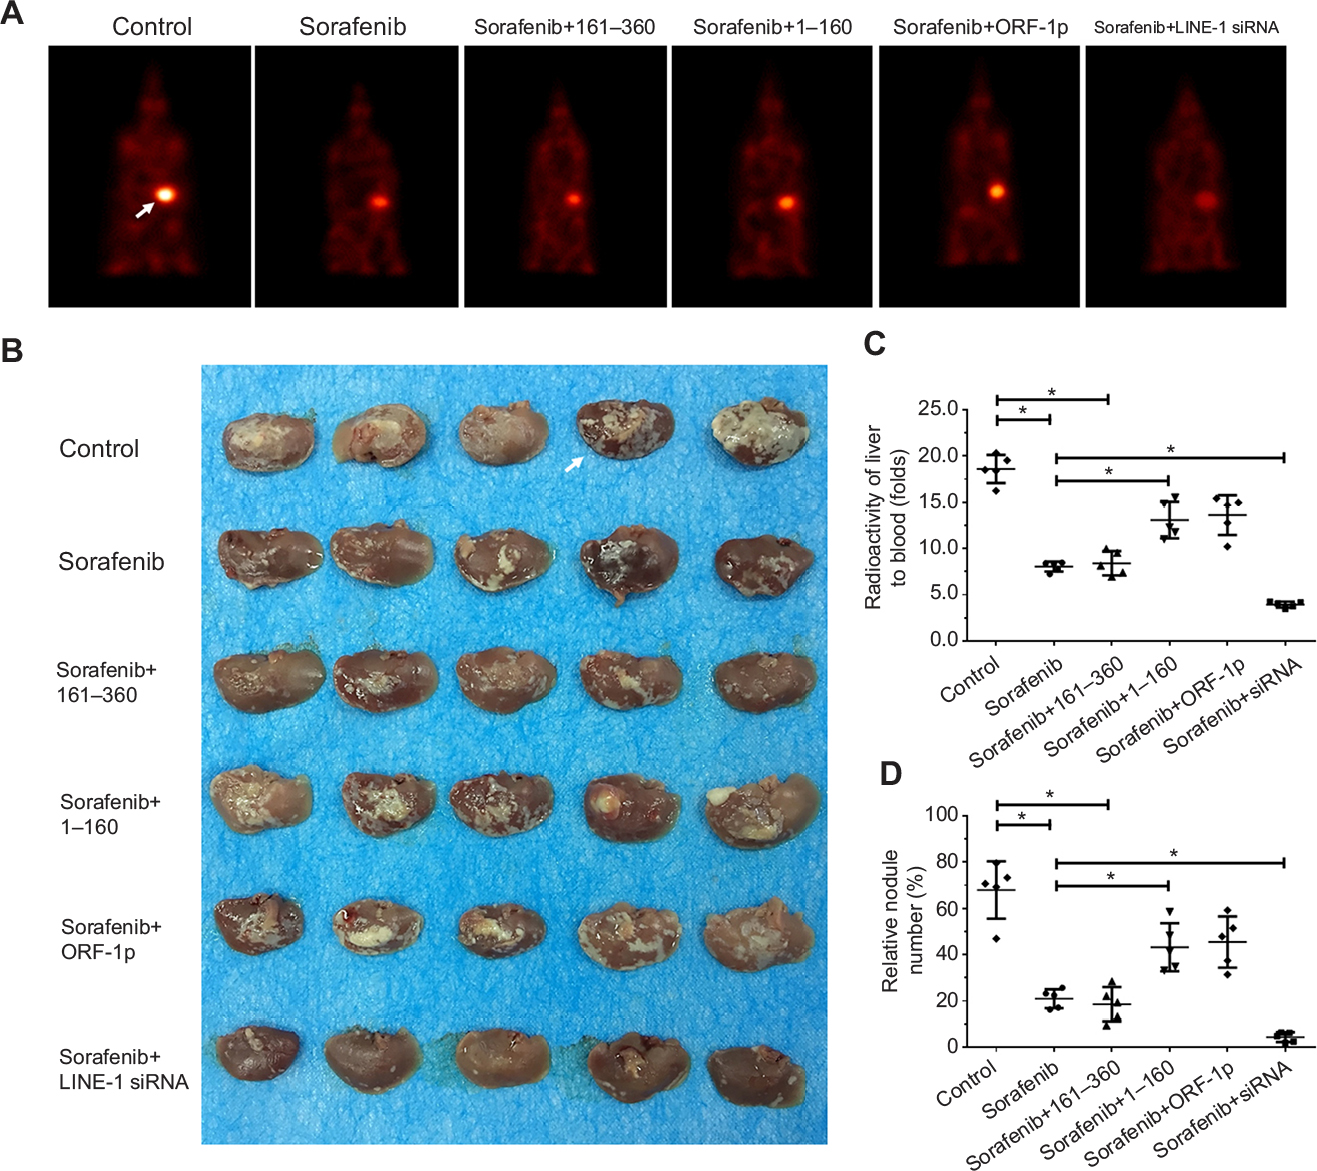 | Figure 10 LINE-1 ORF-1p decreased the antitumor effect of sorafenib in inhibiting MHCC97-H cell intrahepatic growth in vivo. Notes: (A) MHCC97-H cells, which were transfected with an empty vector, a full length LINE-1 ORF-1p vector, LINE-1 ORF-1p 1–160 residues, control siRNA or LINE-1 ORF-1p siRNA vectors were seeded into nude mouse livers via the hepatic portal vein to form intrahepatic tumors. The mice received sorafenib and were screened using PET/CT. (B) The results are shown as representative photographs of livers with nodules formed by MHCC97-H cells, (C) the radioactivation of liver to blood or (D) the relative nodule area. *P<0.05. Abbreviation: PET/CT, positron emission tomography/computed tomography. |
 | Figure 11 LINE-1 ORF-1p decreased the antitumor effect of sorafenib in inhibiting LM-3 cell subcutaneous growth in vivo. Notes: LM-3 cells, which were transfected with an empty vector, a full-length LINE-1 ORF-1p vector, LINE-1 ORF-1p 1–160 residues, control siRNA or LINE-1 ORF-1p siRNA vectors, were seeded into nude mice to form subcutaneous tumors. The mice received sorafenib. (A) The results are shown as representative photographs of tumors, (B) tumor volumes or (C) tumor weight. *P<0.05. |
 | Figure 12 LINE-1 ORF-1p decreased the antitumor effect of sorafenib in inhibiting LM-3 cell intrahepatic growth in vivo. Notes: LM-3 cells, which were transfected with an empty vector, a full-length LINE-1 ORF-1p vector, LINE-1 ORF-1p 1–160 residues, control siRNA or LINE-1 ORF-1p siRNA vectors, were seeded into nude mouse livers via the hepatic portal vein to form intrahepatic tumors. (A) The mice received sorafenib and were screened using PET/CT. (B) The results are shown as representative photographs of livers with nodules formed by LM-3 cells, (C) the radioactivation of liver to blood or (D) the relative nodule area. *P<0.05. Abbreviation: PET/CT, positron emission tomography/computed tomography. |
Discussion
HCC is one of the most common malignancies in P.R. China, which has been attributed to a high hepatitis virus infection rate (hepatitis B virus or hepatitis C virus).34–38 The prognosis of patients suffering from advanced HCC is poor because of multidrug resistance, which makes patients insensitive to cytotoxic chemotherapies.34–38 Unfortunately, most patients suffer from advanced HCC even at their initial diagnosis and are not suitable for a liver transplant or surgical treatment.39,40 Patients with advanced HCC could benefit from systemic chemotherapies and molecular targeting therapies, such as the first-line agent sorafenib and regorafenib, a newly approved molecular targeted agent for the treatment of advanced HCC produced by Bayer Corporation (Leverkusen, Germany). However, only 26%–43% of the patients are initially sensitive to sorafenib, and some patients with good initial responses can develop resistance to sorafenib as the therapy progresses. Until now, the exact mechanisms underlying sorafenib resistance in advanced HCC remained unclear. Our previous work described a potential mechanism underlying the metabolism-dependent elimination of sorafenib mediated by the PXR signaling pathway. PXR is a member of the nuclear receptor family.9 It functions as a key transcription factor to mediate the expression of metabolizing and detoxifying enzymes, including Phase I (such as cytochrome P450) and Phase II drug-metabolizing enzymes.41 These enzymes can also function as drug resistance regulators that induce drug resistance or losses in drug efficiency by metabolizing and detoxifying chemotherapeutics during treatment.42–46 To further establish the role of PXR in sorafenib resistance, the current study revealed that LINE-1 ORF-1p could interact with PXR and function as a PXR coregulator.
LINE-1, an autonomous retrotransposon, is an important component of human genome and constitutes ~17% of human genome.47,48 LINE-1 codes for two proteins: LINe-1 ORF-1p and LINE-1 ORF-2p, and active LINE-1 proteins participate in cancer progression through multiple mechanisms.47,48 Physiologically, LINE-1 ORF-1p was considered to be a molecular chaperon that interacts with its homologue protein LINE-1 ORF-2p to form a ribonucleoprotein during the retrotransposition process.49,50 Moreover, LINE-1 ORF-1p can also function as an important regulator in tumor cell proliferation.49,50 Our previous work showed that LINE-1 ORF-1p could enhance the resistance of HCC cells to antitumor drugs and enhance cell function.7 In the present work, our results showed that high levels of LINE-1 ORF-1p in tumor samples are related to poor prognosis in HCC patients who received sorafenib treatment. LINE-1 ORF-1p consists of three domains, the C–C domain (residues 1–160), the RRM domain and the CTD domain (residues 161–360).12,13 The RRM and CTD domains mediate the binding of LINE-1 ORF-1p to nucleic acids.12,13 Here, we found that the LINE-1 ORF-1p C–C domain interacts with the PXR LBD, which is responsible for the ligand binding. This finding is consistent with the finding that LINE-1 ORF-1p enhanced the transcription factor activation of PXR and the expression of PXR downstream genes in a ligand-dependent manner. Overexpression of LINE-1 ORF-1p accelerated the metabolism and clearance of sorafenib in cultured MHCC97-H cells or tumor tissues. In vitro or in vivo assay results indicated that the overexpression of LINE-1 ORF-1p or the LINE-1 ORF-1p C–C domain, but not RRM/CTD, enhanced the resistance of MHCC97-H cells to sorafenib.
Conclusion
LINE-1 ORF-1p interacted with PXR and enhanced the transcription factor activation of PXR. It also promoted the metabolism and clearance of sorafenib in HCC cells and enhanced sorafenib resistance in HCC cells. Therefore, LINE-1 ORF-1p is a promising molecular candidate for gene targeting therapy to overcome drug resistance in HCC.
Acknowledgments
We thank Dr Xiaojie Xu in Department of Medical Molecular Biology, Beijing Institute of Biotechnology, Collaborative Innovation Center for Cancer Medicine, Beijing 100850, P.R. China for the advice given to us and assistance in this study. This work was supported in part by the National Natural Science Foundation of China (No. 81502133, 81572462, 81372248), the Capital Health Research and Development of Special (No. 2016-2-5031) and the Key Scientific and Technological Research Foundation of National Special-purpose Program (No. 2017ZX10203204-007-002 or 2018ZX10723204-007-002).
Author contributions
All authors made substantial contributions to the design and conception, and acquisition, analysis or interpretation of data. The authors took part in either drafting or revising the manuscript. At the same time, authors gave final approval of the version to be published and agree to be accountable for all aspects of the work in ensuring that questions related to the accuracy or integrity of any part of the work are appropriately investigated and resolved.
Disclosure
The authors report no conflicts of interest in this work.
References
Douville C, Springer S, Kinde I, et al. Detection of aneuploidy in patients with cancer through amplification of long interspersed nucleotide elements (LINEs). Proc Natl Acad Sci U S A. 2018;115(8):1871–1876. | ||
Liu N, Lee CH, Swigut T, et al. Selective silencing of euchromatic L1s revealed by genome-wide screens for L1 regulators. Nature. 2018;553(7687):228–232. | ||
Han Y, Xu J, Kim J, Wu X, Gu J. LINE-1 methylation in peripheral blood leukocytes and clinical characteristics and prognosis of prostate cancer patients. Oncotarget. 2017;8(55):94020–94027. | ||
Ohka F, Natsume A, Motomura K, et al. The global DNA methylation surrogate LINE-1 methylation is correlated with MGMT promoter methylation and is a better prognostic factor for glioma. PLoS One. 2011;6(8):e23332. | ||
Xia Z, Cochrane DR, Anglesio MS, et al. LINE-1 retrotransposon-mediated DNA transductions in endometriosis associated ovarian cancers. Gynecol Oncol. 2017;147:642–647. | ||
Sokolowski M, Chynces M, deHaro D, Christian CM, Belancio VP. Truncated ORF1 proteins can suppress LINE-1 retrotransposition in trans. Nucleic Acids Res. 2017;45(9):5294–5308. | ||
Feng F, Lu YY, Zhang F, et al. Long interspersed nuclear element ORF-1 protein promotes proliferation and resistance to chemotherapy in hepatocellular carcinoma. World J Gastroenterol. 2013;19(7):1068–1078. | ||
Zhu YJ, Zheng B, Wang HY, Chen L. New knowledge of the mechanisms of sorafenib resistance in liver cancer. Acta Pharmacol Sin. 2017;38(5):614–622. | ||
Feng F, Jiang Q, Cao S, et al. Pregnane X receptor mediates sorafenib resistance in advanced hepatocellular carcinoma. Biochim Biophys Acta. 2018;1862(4):1017–1030. | ||
Ma D, Jia H, Qin M, et al. MiR-122 Induces radiosensitization in non-small cell lung cancer cell line. Int J Mol Sci. 2015;16(9):22137–22150. | ||
Ji Q, Xu X, Li L, et al. miR-216a inhibits osteosarcoma cell proliferation, invasion and metastasis by targeting CDK14. Cell Death Dis. 2017;8(10):e3103. | ||
Lu Y, Feng F, Yang Y, et al. LINE-1 ORF-1p functions as a novel androgen receptor co-activator and promotes the growth of human prostatic carcinoma cells. Cell Signal. 2013;25(2):479–489. | ||
Yang Q, Feng F, Zhang F, et al. LINE-1 ORF-1p functions as a novel HGF/ETS-1 signaling pathway co-activator and promotes the growth of MDA-MB-231 cell. Cell Signal. 2013;25(12):2652–2660. | ||
Chen Y, Feng F, Gao X, et al. MiRNA153 reduces effects of chemotherapeutic agents or small molecular kinase inhibitor in HCC cells. Curr Cancer Drug Targets. 2015;15(3):176–187. | ||
Yang YP, Qu JH, Chang XJ, et al. High intratumoral metastasis-associated in colon cancer-1 expression predicts poor outcomes of cryoablation therapy for advanced hepatocellular carcinoma. J Transl Med. 2013;11:41. | ||
Yuan B, Cheng L, Chiang HC, et al. A phosphotyrosine switch determines the antitumor activity of ERβ. J Clin Invest. 2014;124(8):3378–3390. | ||
Cao P, Feng F, Dong G, et al. Estrogen receptor α enhances the transcriptional activity of ETS-1 and promotes the proliferation, migration and invasion of neuroblastoma cell in a ligand dependent manner. BMC Cancer. 2015;15:491. | ||
Lin J, Ding L, Jin R, et al. Four and a half LIM domains 1 (FHL1) and receptor interacting protein of 140kDa (RIP140) interact and cooperate in estrogen signaling. Int J Biochem Cell Biol. 2009;41(7):1613–1618. | ||
Ma H, Yao Y, Wang C, et al. Transcription factor activity of estrogen receptor α activation upon nonylphenol or bisphenol A treatment enhances the in vitro proliferation, invasion, and migration of neuroblastoma cells. Onco Targets Ther. 2016;9:3451–3463. | ||
Dong Z, Qi R, Guo X, et al. MiR-223 modulates hepatocellular carcinoma cell proliferation through promoting apoptosis via the Rab1-mediated mTOR activation. Biochem Biophys Res Commun. 2017;483(1):630–637. | ||
Zhu M, Li M, Zhang F, et al. FBI-1 enhances ETS-1 signaling activity and promotes proliferation of human colorectal carcinoma cells. PLoS One. 2014;9(5):e98041. | ||
Ren H, Ren B, Zhang J, et al. Androgen enhances the activity of ETS-1 and promotes the proliferation of HCC cells. Oncotarget. 2017;8(65):109271–109288. | ||
Zhang Y, Zeng D, Cao J, et al. Interaction of quindoline derivative with telomeric repeat-containing RNA induces telomeric DNA-damage response in cancer cells through inhibition of telomeric repeat factor 2. Biochim Biophys Acta. 2017;1861(12):3246–3256. | ||
Liu ZC, Ning F, Wang HF, et al. Epidermal growth factor and tumor necrosis factor α cooperatively promote the motility of hepatocellular carcinoma cell lines via synergistic induction of fibronectin by NF-κB/p65. Biochim Biophys Acta. 1861;2017:2568–2582. | ||
Wu M, Zhao G, Zhuang X, et al. Triclosan treatment decreased the antitumor effect of sorafenib on hepatocellular carcinoma cells. Onco Targets Ther. 2018;11:2945–2954. | ||
Xiong S, Klausen C, Cheng JC, Leung PCK. TGFβ1 induces endometrial cancer cell adhesion and migration by up-regulating integrin αvβ3 via SMAD-independent MEK-ERK1/2 signaling. Cell Signal. 2017;34:92–101. | ||
Wu X, Li Z, Shen Y. The small molecule CS1 inhibits mitosis and sister chromatid resolution in HeLa cells. Biochim Biophys Acta. 2018;1862(5):1134–1147. | ||
Zheng B, Geng L, Zeng L, Liu F, Huang Q. AKT2 contributes to increase ovarian cancer cell migration and invasion through the AKT2-PKM2-STAT3/NF-κB axis. Cell Signal. 2018;45:122–131. | ||
Jia H, Yang Q, Wang T, et al. Rhamnetin induces sensitization of hepatocellular carcinoma cells to a small molecular kinase inhibitor or chemotherapeutic agents. Biochim Biophys Acta. 2016;1860(7):1417–1430. | ||
An L, Li DD, Chu HX, et al. Terfenadine combined with epirubicin impedes the chemo-resistant human non-small cell lung cancer both in vitro and in vivo through EMT and Notch reversal. Pharmacol Res. 2017;124:105–115. | ||
Xu X, Fan Z, Liang C, et al. A signature motif in LIM proteins mediates binding to checkpoint proteins and increases tumour radiosensitivity. Nat Commun. 2017;8:14059. | ||
Zhang Y, Li D, Jiang Q, et al. Novel ADAM-17 inhibitor ZLDI-8 enhances the in vitro and in vivo chemotherapeutic effects of sorafenib on hepatocellular carcinoma cells. Cell Death Dis. 2018;9(7):743. | ||
Xie H, Tian S, Yu H, et al. A new apatinib microcrystal formulation enhances the effect of radiofrequency ablation treatment on hepatocellular carcinoma. Onco Targets Ther. 2018;11:3257–3265. | ||
Kim DW, Talati C, Kim R. Hepatocellular carcinoma (HCC): beyond sorafenib-chemotherapy. J Gastrointest Oncol. 2017;8(2):256–265. | ||
Hou J, Hong Z, Feng F, et al. A novel chemotherapeutic sensitivity-testing system based on collagen gel droplet embedded 3D-culture methods for hepatocellular carcinoma. BMC Cancer. 2017;17(1):729. | ||
Feng F, Jiang Q, Jia H, et al. Which is the best combination of TACE and sorafenib for advanced hepatocellular carcinoma treatment? A systematic review and network meta-analysis. Pharmacol Res. 2018;135:89–101. | ||
Yang Y, Ye YC, Chen Y, et al. Crosstalk between hepatic tumor cells and macrophages via Wnt/β-catenin signaling promotes M2-like macrophage polarization and reinforces tumor malignant behaviors. Cell Death Dis. 2018;9(8):793. | ||
Shao Z, Li Y, Dai W, et al. ETS-1 induces sorafenib-resistance in hepatocellular carcinoma cells via regulating transcription factor activity of PXR. Pharmacol Res. 2018;135:188–200. | ||
Rajyaguru DJ, Borgert AJ, Smith AL, et al. Radiofrequency ablation versus stereotactic body radiotherapy for localized hepatocellular carcinoma in nonsurgically managed patients: analysis of the National Cancer Database. J Clin Oncol. 2018;36(6):600–608. | ||
Li F, Li N, Sang J, et al. Highly elevated soluble Tim-3 levels correlate with increased hepatocellular carcinoma risk and poor survival of hepatocellular carcinoma patients in chronic hepatitis B virus infection. Cancer Manag Res. 2018;10:941–951. | ||
Zhao J, Bai Z, Feng F, et al. Cross-talk between EPAS-1/HIF-2α and PXR signaling pathway regulates multi-drug resistance of stomach cancer cell. Int J Biochem Cell Biol. 2016;72:73–88. | ||
Kuczynski EA, Lee CR, Man S, Chen E, Kerbel RS. Effects of sorafenib dose on acquired reversible resistance and toxicity in hepatocellular carcinoma. Cancer Res. 2015;75(12):2510–2519. | ||
Edginton AN, Zimmerman EI, Vasilyeva A, Baker SD, Panetta JC. Sorafenib metabolism, transport, and enterohepatic recycling: physiologically based modeling and simulation in mice. Cancer Chemother Pharmacol. 2016;77(5):1039–1052. | ||
Ingersoll MA, Chou YW, Lin JS, et al. p66Shc regulates migration of castration-resistant prostate cancer cells. Cell Signal. 2018;46:1–14. | ||
Marquet P, Albano L, Woillard JB, et al. Comparative clinical trial of the variability factors of the exposure indices used for the drug monitoring of two tacrolimus formulations in kidney transplant recipients. Pharmacol Res. 2018;129:84–94. | ||
Wang J, Gan C, Sparidans RW, et al. P-glycoprotein (MDR1/ABCB1) and breast cancer resistance protein (BCRP/ABCG2) affect brain accumulation and intestinal disposition of encorafenib in mice. Pharmacol Res. 2018;129:414–423. | ||
Amselem J, Vigouroux M, Oberhaensli S, et al. Evolution of the EKA family of powdery mildew avirulence-effector genes from the ORF 1 of a LINE retrotransposon. BMC Genomics. 2015;16:917. | ||
Cook PR, Jones CE, Furano AV. Phosphorylation of ORF1p is required for L1 retrotransposition. Proc Natl Acad Sci U S A. 2015;112(14):4298–4303. | ||
Horn AV, Klawitter S, Held U, et al. Human LINE-1 restriction by APOBEC3C is deaminase independent and mediated by an ORF1p interaction that affects LINE reverse transcriptase activity. Nucleic Acids Res. 2014;42(1):396–416. | ||
Zhu Y, Feng F, Yu J, et al. L1-ORF1p, a Smad4 interaction protein, promotes proliferation of HepG2 cells and tumorigenesis in mice. DNA Cell Biol. 2013;32(9):531–540. |
Supplementary materials
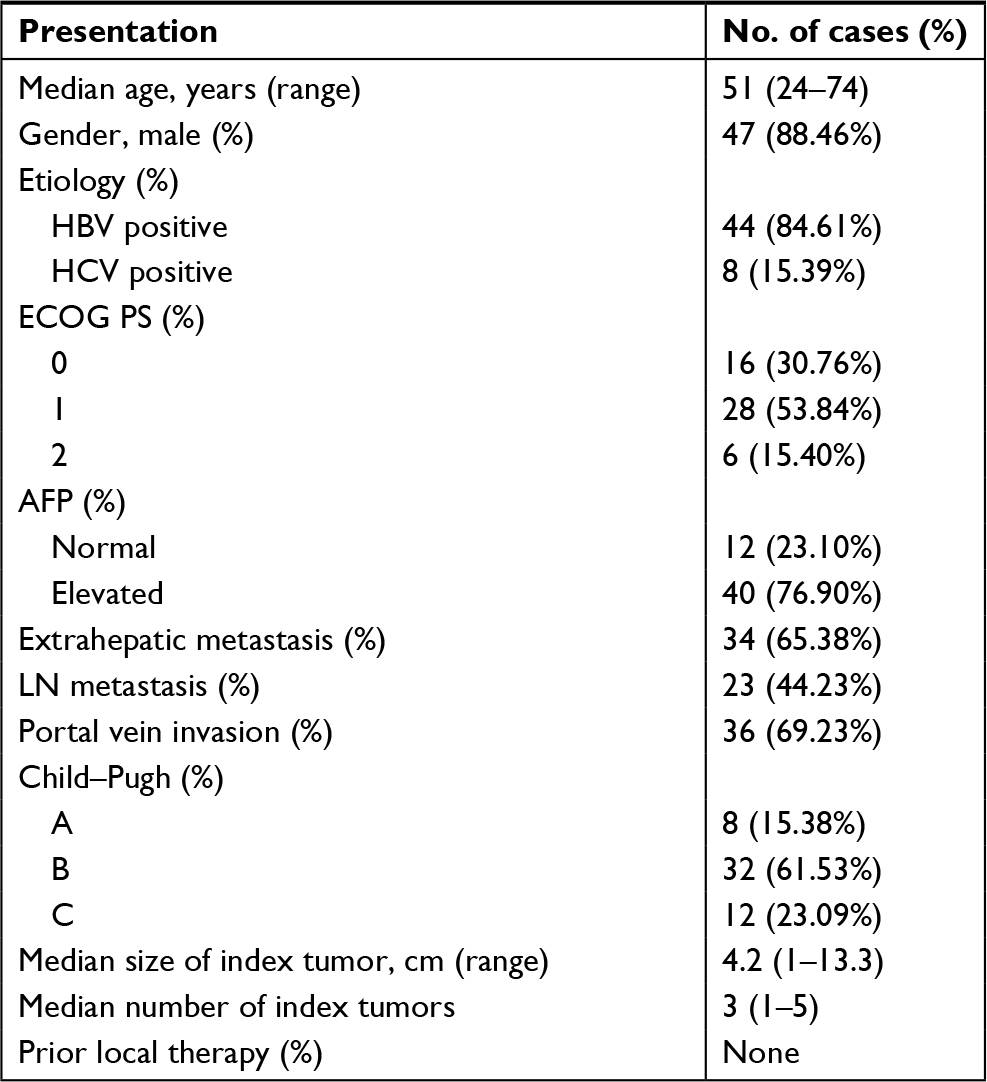 | Table S1 Baseline clinical data of 52 patients with advanced HCC Abbreviations: ECOG PS, Eastern Cooperative Oncology Group performance status; HBV, hepatitis B virus; HCC, hepatocellular carcinoma; HCV, hepatitis C virus; LN, lymph node. |
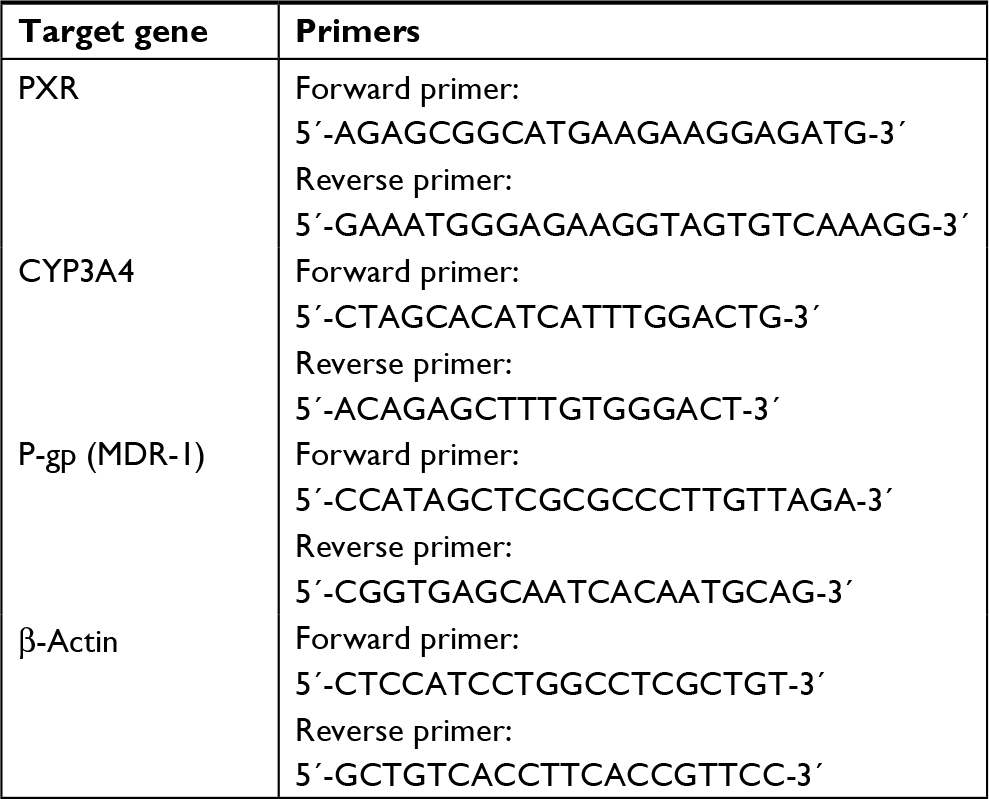 | Table S2 Real-time PCR primers |
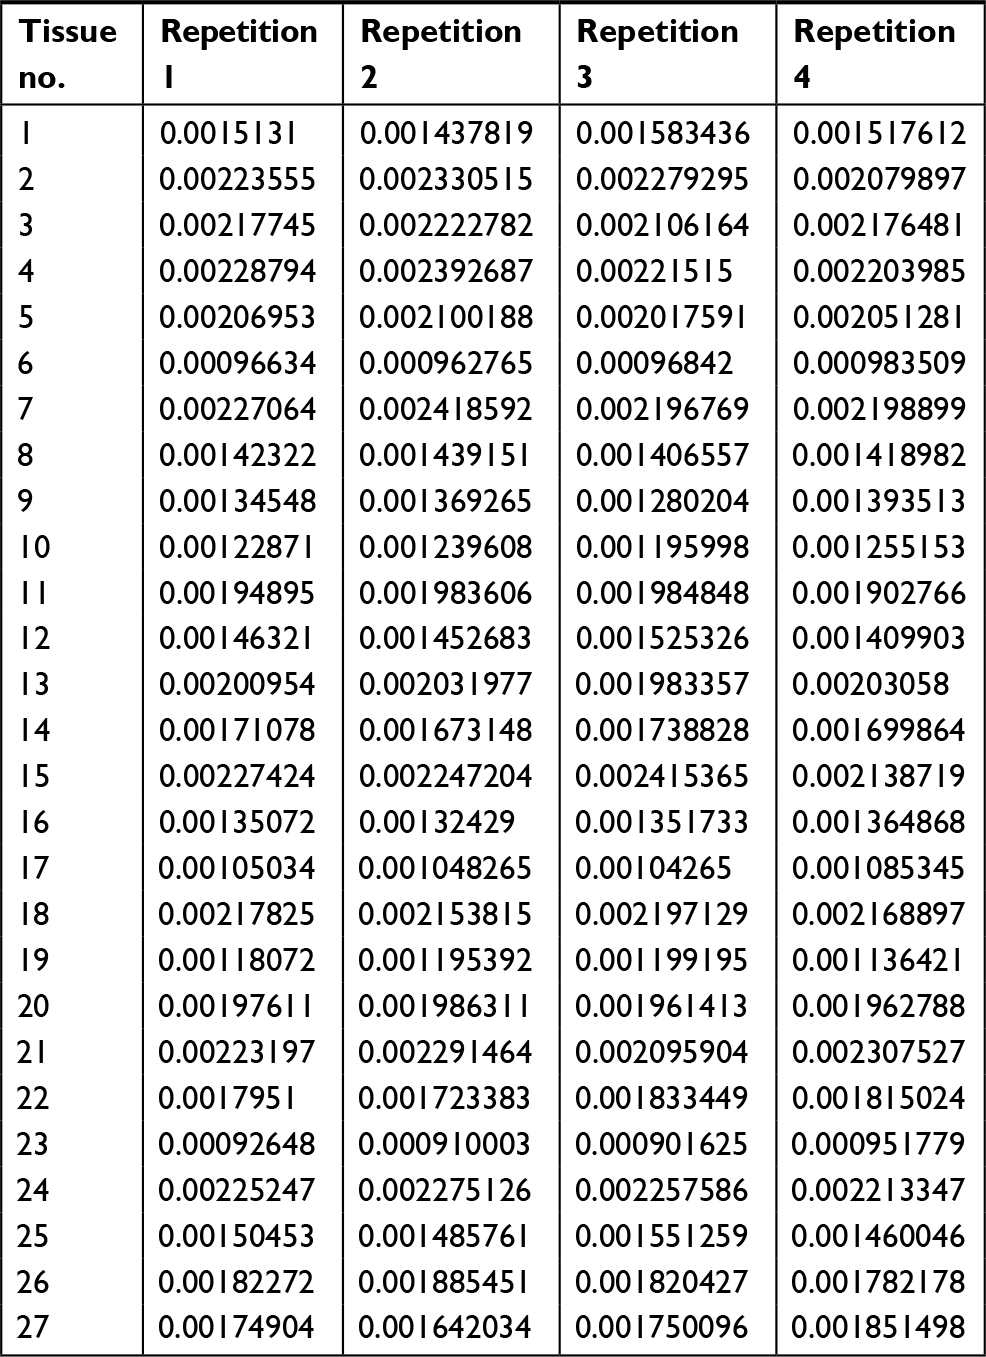 | Table S3 The mRNA level of LINE-1 ORF-1p in LINE-1 ORF-1p high-group HCC tissues by real-time PCR Abbreviation: HCC, hepatocellular carcinoma. |
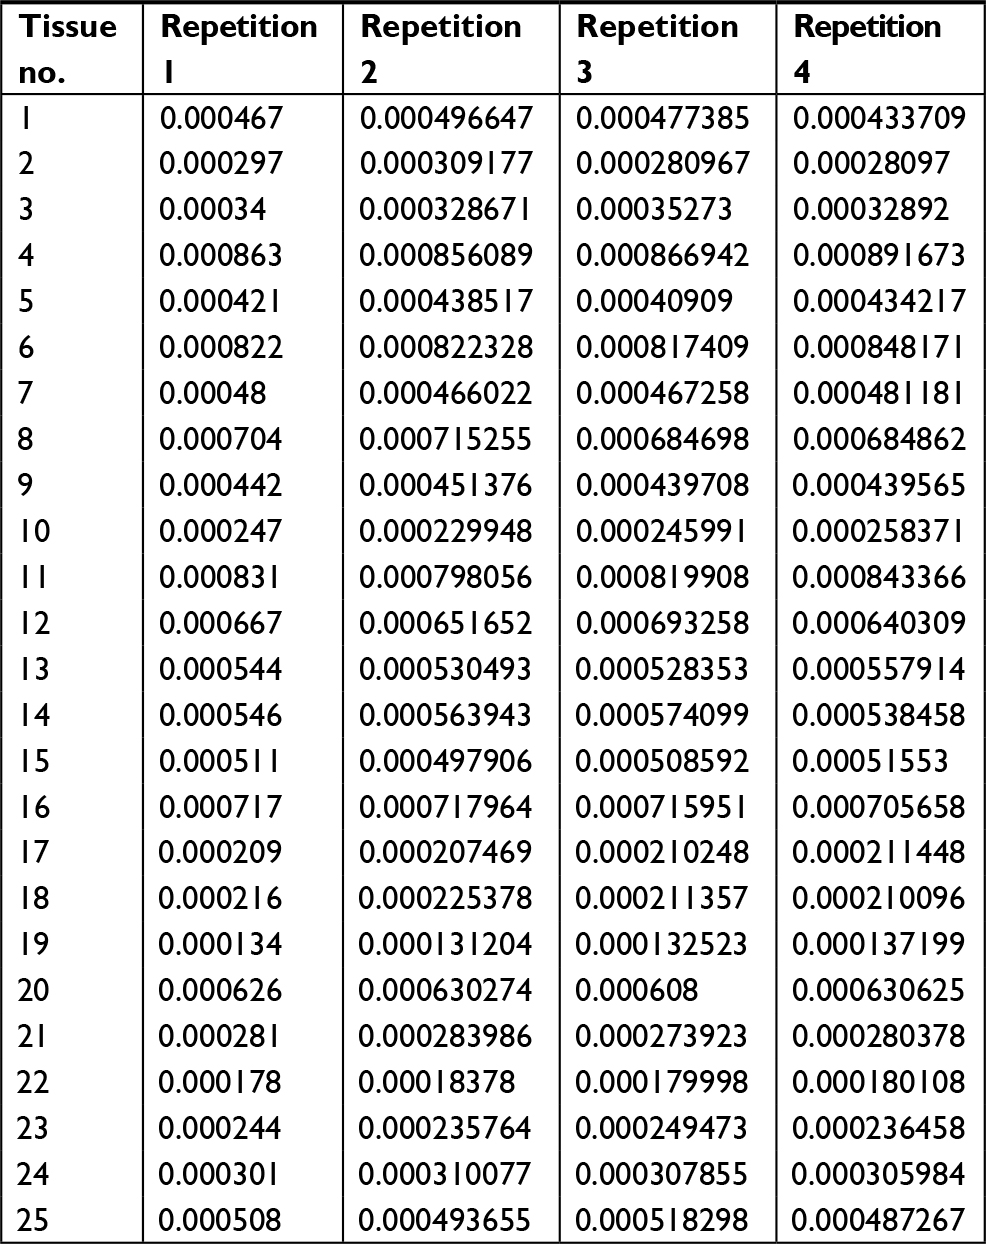 | Table S4 The mRNA level of LINE-1 ORF-1p in LINE-1 ORF-1p low-group HCC tissues by real-time PCR Abbreviation: HCC, hepatocellular carcinoma. |
 | Figure S1 The expression of LINE-1 ORF-1p in subcutaneous tumors. Notes: MHCC97-H cells, which were transfected with empty vector, full-length LINE-1 ORF-1p, LINE-1 ORF-1p 1–160 residues, control siRNA or LINE-1 ORF-1p siRNA vectors, were seeded into nude mice to form subcutaneous tumors. Mice were treated with sorafenib and the tumor tissues were harvested with antiLINE-1 ORF-1p or FLAG antibodies. |
 © 2018 The Author(s). This work is published and licensed by Dove Medical Press Limited. The full terms of this license are available at https://www.dovepress.com/terms.php and incorporate the Creative Commons Attribution - Non Commercial (unported, v3.0) License.
By accessing the work you hereby accept the Terms. Non-commercial uses of the work are permitted without any further permission from Dove Medical Press Limited, provided the work is properly attributed. For permission for commercial use of this work, please see paragraphs 4.2 and 5 of our Terms.
© 2018 The Author(s). This work is published and licensed by Dove Medical Press Limited. The full terms of this license are available at https://www.dovepress.com/terms.php and incorporate the Creative Commons Attribution - Non Commercial (unported, v3.0) License.
By accessing the work you hereby accept the Terms. Non-commercial uses of the work are permitted without any further permission from Dove Medical Press Limited, provided the work is properly attributed. For permission for commercial use of this work, please see paragraphs 4.2 and 5 of our Terms.