")
Back to Journals » Neuropsychiatric Disease and Treatment » Volume 17
LINC00839 Regulates Proliferation, Migration, Invasion, Apoptosis and Glycolysis in Neuroblastoma Cells Through miR-338-3p/GLUT1 Axis
Received 3 March 2021
Accepted for publication 27 May 2021
Published 21 June 2021 Volume 2021:17 Pages 2027—2040
DOI https://doi.org/10.2147/NDT.S309467
Checked for plagiarism Yes
Review by Single anonymous peer review
Peer reviewer comments 2
Editor who approved publication: Dr Taro Kishi
Lixia Yang, Liangyan Pei, Jilong Yi
Department of Neurology, The First People’s Hospital of Jingmen Affiliated to Hubei Minzu University, Jingmen, 434000, People’s Republic of China
Correspondence: Jilong Yi
Department of Neurology, The First People’s Hospital of Jingmen Affiliated to Hubei Minzu University, No.168 Xiangshan Avenue, Jingmen, 434000, People’s Republic of China
Email [email protected]
Background: Long noncoding RNAs (lncRNAs) are related to the development and treatment of neuroblastoma. The lncRNA LINC00839 is dysregulated in neuroblastoma, while its function and mechanism in neuroblastoma development remain largely unclear.
Methods: The tumor and adjacent noncancerous tissues were collected from 48 neuroblastoma patients. LINC00839, glucose transporter 1 (GLUT1) and microRNA-338-3p (miR-338-3p) abundances were examined via quantitative reverse transcription polymerase chain reaction or Western blot. Cell proliferation, apoptosis, migration, invasion and glycolysis were assessed via Cell Counting Kit-8, colony formation, flow cytometry, wound healing, transwell, glucose uptake and lactate production. The target relationship of miR-338-3p and LINC00839 or GLUT1 was tested via dual-luciferase reporter analysis and RNA immunoprecipitation. The function of LINC00839 on neuroblastoma cell growth in vivo was tested via a xenograft model.
Results: LINC00839 and GLUT1 abundances were increased in neuroblastoma tissues and cell lines. The high expression of LINC00839 and GLUT1 indicated the lower overall survival. LINC00839 interference constrained neuroblastoma cell proliferation, migration, invasion and glycolysis, and facilitated apoptosis. GLUT1 overexpression or miR-338-3p knockdown could mitigate the influence of LINC00839 silence on neuroblastoma cell processes. LINC00839 could regulate GLUT1 expression via miR-338-3p. LINC00839 knockdown reduced neuroblastoma cell growth in xenograft model.
Conclusion: LINC00839 silence repressed neuroblastoma cell proliferation, migration, invasion and glycolysis and promoted apoptosis via regulating miR-338-3p/GLUT1 axis.
Keywords: neuroblastoma, LINC00839, GLUT1, miR-338-3p
Introduction
Neuroblastoma is a common malignant tumor in childhood.1 Neuroblastoma is the peripheral sympathetic nervous system cancer usually found in the adrenal medulla.2 Improvements have been gained on the treatment of neuroblastoma, but the outcome of patients remains poor with a low long-term survival (<50%).3 Thus, it is necessary to explore novel strategy for treatment of neuroblastoma.
Long noncoding RNAs (lncRNAs) are a group of >200-nucleotide RNAs without capacity of encoding proteins, which are implicated in the development of human cancers.4 Moreover, the dysregulated lncRNAs are related to the progression and treatment of neuroblastoma.5 For instance, lncRNA distal-less homeobox 6 antisense 1 (DLX6-AS1) could promote neuroblastoma cell proliferation, migration and invasion via modulating microRNA-107 and brain-derived neurotrophic factor (BDNF).6 Furthermore, linc01105 could facilitate neuroblastoma cell proliferation, migration and invasion via regulating microRNA-6769b-5p and vascular endothelial growth factor A (VEGFA).7 An emerging evidence suggests that LINC00839 is a high-risk lncRNA in neuroblastoma, and it indicates a bad prognosis of patients.8 Nevertheless, the function and mechanism of LINC00839 in neuroblastoma development are poorly understood.
MicroRNAs (miRNAs) are a class of non-protein coding RNAs with ~22 nucleotides, which play important roles in childhood cancers, including neuroblastoma.9,10 Previous studies report miR-338-3p might exhibit a tumor-suppressive effect via repressing cancer cell growth, metastasis and glycolysis in multiple cancers, such as hepatocellular carcinoma and glioma.11,12 Furthermore, miR-338-3p represses cell proliferation, migration and invasion in neuroblastoma via regulating Phosphatidylinositol-3,4,5-trisphosphate-dependent Rac exchange factor 2a (PREX2a) and phosphate and tensin homolog detected on chromosome 10 (PTEN).13 Nevertheless, whether miR-338-3p is relevant to LINC00839-mediated regulation in neuroblastoma is uncertain.
Glycolysis is a key process associated with tumorigenesis in cancers, including neuroblastoma.14,15 Glucose transporter 1 (GLUT1) is an important upstream protein of glycolysis, which participates in cancer energy metabolism.16 Previous evidences suggest that GLUT1 could promote cancer development via facilitating cell proliferation, migration and glycolysis.17,18 Moreover, GLUT1 is reported to be associated with the malignancy of neuroblastoma.19 However, whether GLUT1 is regulated via LINC00839 in neuroblastoma remains unclear.
In this research, we explored LINC00839 level in neuroblastoma tissues and cells. Moreover, we analyzed the function of LINC00839 in neuroblastoma cell development. Additionally, we explored whether it was associated with the regulatory axis of miR-338-3p/GLUT1.
Materials and Methods
Patient Tissue Collection
The matched tumor and adjacent noncancerous tissues were harvested from 48 neuroblastoma patients in the First People’s Hospital of Jingmen Affiliated to Hubei Minzu University between 2011 and 2015. All tissues were maintained at −80°C. Based on a 5-year follow-up, the overall survival of patients was analyzed. All patients signed the written informed consent. The research was performed under the approval of the ethics committee of the First People’s Hospital of Jingmen Affiliated to Hubei Minzu University and in line with the guidelines of the Helsinki Declaration.
Cell Culture
Human neuroblastoma cell lines (IMR-32 and SK-N-SH) and human embryonic kidney 293 (HEK293) cells were provided via Procell (Wuhan, China) and maintained in DMEM (Procell) plus 10% fetal bovine serum (Procell) and 1% penicillin/streptomycin (Beyotime, Shanghai, China) at 37°C and 5% CO2.
Quantitative Reverse Transcription Polymerase Chain Reaction (qRT-PCR)
Total RNA was extracted using Trizol (Applygen, Beijing, China) based on the procedures in previous study.20 The RNA in cytoplasm or nucleus was extracted with the Cytoplasmic & Nuclear RNA Purification kit (Norgen Biotek, Thorold, Canada) following the instruction of the manufacturer. 800 ng RNA was applied to cDNA synthesis through the specific reverse transcription kit (Thermo Fisher, Waltham, MA, USA). The synthesized cDNA was mixed with SYBR (Solarbio, Beijing, China) and specific primers (GenScript, Nanjing, China) for qRT-PCR with the following amplification protocol: 95oC for 5 min, 40 cycles of 95oC for 20 s, and 60oC for 1 min. The primer sequences were shown as: LINC00839 (sense, 5ʹ-GCCCATACGGACCTACTGC-3ʹ; antisense, 5ʹ-CAATCTGGGCCTGAACTGTG-3ʹ), GLUT1 (sense, 5ʹ-GTGACAAGACACCCGAGGAG-3ʹ; antisense, 5ʹ-CCTGGAGCCGTTAAGTCCTG-3ʹ), miR-338-3p (sense, 5ʹ-GCCGAGTCCAGCATCAGTGCATT-3ʹ; antisense, 5ʹ-CAGTGCGTGTCGTGGAGT-3ʹ), 18S rRNA (sense, 5ʹ-CAGCCACCCGAGATTGAGCA-3ʹ; antisense, 5ʹ-TAGTAGCGACGGGCGGTGTG-3ʹ), U6 (sense, 5ʹ-ATTGGAACGATACAGAGAAGATT-3ʹ; antisense, 5ʹ-GGAACGCTTCACGAATTTG-3ʹ), and β-actin (sense, 5ʹ-ATAGCACAGCCTGGATAGCAACGTAC-3ʹ; antisense, 5ʹ-CACCTTCTACAATGAGCTGCGTGTG-3ʹ). Using U6 or β-actin as housekeeping gene, the relative RNA expression was calculated via 2−ΔΔCt method.21 Every sample was prepared in quadruplicate, and this experiment was conducted 3 times.
Western Blot
After treatment of RIPA buffer (Solarbio) with 1% protease inhibitor, total protein was extracted after centrifugation. The protein concentration was detected via a BCA kit (Sigma, St. Louis, MO, USA). The protein samples (20 μg) were separated via SDS-PAGE and transferred onto polyvinylidene fluoride membranes (Solarbio). Following blocking in 5% non-fat milk, the membranes were interacted with antibody for GLUT1 (Cat. No. 21829-1-AP, 1:1000 dilution, Proteintech, Rosemont, IL, USA) or β-actin (Cat. No. 20536-1-AP, 1:3000 dilution, Proteintech) overnight and IgG conjugated via HRP (Cat. No. SA00001-2, 1:10,000 dilution, Proteintech) for 2 h. β-actin was employed as a reference. The blots were visualized by ECL reagent (Thermo Fisher), and then analyzed via Image J software (NIH, Bethesda, MD, USA). The relative protein expression was normalized to the control group. Each sample was provided in quadruplicate, and this experiment was performed 3 times.
Cell Transfection
The GLUT1 (NM_006516.4) overexpression vector (oe-GLUT1) was generated via cloning GLUT1sequence into pcDNA3.1 vector (Thermo Fisher), and the pcDNA3.1 vector alone served as negative control (Vector). The shRNA for LINC00839 (sh-LINC00839-1/-2), miR-338-3p mimic, miR-338-3p inhibitor, and their negative controls (sh-NC, miR-NC or anti-NC) were generated via Ribobio (Guangzhou, China). IMR-32 and SK-N-SH cells were transfected with the above-mentioned vectors (600 ng) or oligonucleotides (20 nM). The transfection efficacy was analyzed via qRT-PCR or Western blot after 24 h post-transfection.
Cell Counting Kit-8 (CCK-8) and Colony Formation Analyses
Cell proliferation was detected via CCK-8 and colony formation analyses. 1×10⁴ IMR-32 and SK-N-SH cells were placed into 96-well plates in quadruplicate, and incubated for 24, 48 or 72 h, followed via interacting with 10 μL CCK-8 reagent (Beyotime) for 3 h. The optical density (OD) value was examined through a microplate reader (Molecular Devices, San Jose, CA, USA) with a wavelength of 450 nm. This experiment was conducted 3 times.
For colony formation analysis, IMR-32 and SK-N-SH cells were added into 12-well plates, and then maintained for 10 days. The colony was fixed and dyed with 0.2% crystal violet (Beyotime), followed via an observation under a microscope (Olympus, Tokyo, Japan). This experiment was performed 3 times with 4 replicates.
Flow Cytometry
Cell apoptosis was examined with Annexin V-FITC apoptosis kit (Sigma). 2×10⁵ IMR-32 and SK-N-SH cells were added in 6-well plates with 4 replicates and then incubated for 72 h. Subsequently, cells were harvested and interacted with Annexin V binding buffer. Next, cells were dyed with Annexin V-FITC and Propidium Iodide, followed via detection of a flow cytometer (Agilent, Hangzhou, China). The apoptotic rate of cells represented the ratio of cells in right lower and upper quadrants. The experiments were carried out 3 times.
Wound Healing Analysis
The migrated ability of IMR-32 and SK-N-SH cells was analyzed via wound healing analysis. 1×10⁵ IMR-32 and SK-N-SH cells were seeded into 12-well plates in quadruplicate. When reaching >95% confluence, a straight scratch was made using a 200 μL pipette tip. After 24 h, cells were observed. The wound was photographed under a microscope (magnification ×100) at 0 and 24 h. The migrated ability was revealed via the wound healing rate. This experiment was repeated 3 times.
Transwell Analysis
The transwell chamber (BD, Franklin Lakes, NJ, USA) with polycarbonate membrane insert was used for cell migration and invasion analyses. For migration analysis, 1×10⁵ IMR-32 and SK-N-SH cells in serum-free medium were placed into the upper chambers; for invasion analysis, the chamber was precoated with Matrigel (Solarbio), and 5×10⁵ IMR-32 and SK-N-SH cells in medium without serum were added into the upper chambers. The low chambers were filled with 500 μL DMEM plus 10% serum. After 24 h, cells were dyed with 0.2% crystal violet. The migrated or invasive cells were observed under a microscope (magnification ×100) with 4 random fields. The relative migrated or invasive ability was normalized to the control group (100%). This experiment was conducted 3 times.
Glucose Uptake and Lactate Production Analyses
Glycolysis was analyzed via glucose uptake and lactate production with the specific glucose or lactate assay kit (Abcam, Cambridge, MA, USA). 2×10⁶ IMR-32 and SK-N-SH cells were collected and homogenized in the assay buffer. Next, the lysates were used for detection of the amounts of glucose and lactate according to the procedures of th manufacturer. The relative glucose uptake and lactate production levels were normalized to total protein and control group (100%). 4 replicates were prepared and this experiment was repeated 3 times.
Dual-Luciferase Reporter Analysis and RNA Immunoprecipitation (RIP)
The relationship of miR-338-3p and LINC00839 or GLUT1 was predicted via starBase (http://starbase.sysu.edu.cn/).22 The luciferase reporter vectors containing wild-type binding sequence of miR-338-3p (WT LINC00839 and GLUT1 3ʹUTR) or mutant sequence (MUT LINC00839 and GLUT1 3ʹUTR) were generated via cloning the corresponding sequence of LINC00839 or GLUT1 3ʹUTR into the pMIR-REPORT vectors (Thermo Fisher). IMR-32 and SK-N-SH cells were transfected with these constructs, control vectors and miR-338-3p mimic or miR-NC. The luciferase activity was examined via dual-luciferase analysis system (Thermo Fisher) after 24 h post-transfection.
RIP analysis was performed using a Magna RIP kit (Millipore, Billerica, MA, USA). 1×10⁷ IMR-32 and SK-N-SH cells were lysed, and the lysates were incubated with magnetic beads conjugated via anti-Ago2 or IgG. IgG served as a negative control. LINC00839, miR-338-3p and GLUT1 levels enriched via the beads were measured via qRT-PCR.
Animal Experiment
BALB/c athymic mice (male, 5-week-old) were provided via Charles River (Beijing, China). 2×10⁶ SK-N-SH cells stably transfected with sh-NC or sh-LINC00839-1 were subcutaneously injected into the right flank of mice, respectively (n=7/group). The tumor volume was examined every 3 days from 7 days after cell injection using length × width2/2. After 28 days, mice were euthanized using 5% isoflurane. Tumor tissues were weighed, and harvested for detection of lactate production, LINC00839, miR-338-3p and GLUT1 levels. For survival analysis, mice were subcutaneously injected with 2×10⁶ SK-N-SH cells stably transfected with sh-NC or sh-LINC00839-1 (n=10/group). The survival time of mice was monitored in each group. Animal experiment was approved via the Laboratory Animal Care and Use Committee of the First People’s Hospital of Jingmen Affiliated to Hubei Minzu University and performed according to the Guide for the Care and Use of Laboratory Animals.
Statistical Analysis
The results were presented as mean ± SD from 3 repeats. Statistical analysis was processed via GraphPad Prism 7 (GraphPad Inc., La Jolla, CA, USA). The linear correlation between LINC00839 and GLUT1 abundance in neuroblastoma tissues was analyzed via Pearson correlation test. The survival curve of patients or mice was tested via Kaplan–Meier’s method and the log-rank test. The difference was analyzed via Student’s t-test or ANOVA followed via Tukey test. P<0.05 indicated the significant difference.
Results
LINC00839 and GLUT1 Levels are Enhanced in Neuroblastoma Tissues and Cells
To explore whether LINC00839 and GLUT1 were relevant to neuroblastoma development, their expression was detected in neuroblastoma tissues. Comparing to the normal samples, LINC00839 and GLUT1 abundances were evidently up-regulated in tumor tissues (n = 48) (Figure 1A and B). Moreover, the patients were divided into high or low expression of LINC00839 or GLUT1 group according to the median value. As shown in Figure 1C and D, high expression of LINC00839 and GLUT1 indicated the lower overall survival of patients (P<0.01). GLUT1 mRNA expression was positively related with LINC00839 level (r=0.45, P<0.01) (Figure 1E). In addition, GLUT1 protein level was obviously enhanced in neuroblastoma tissues in comparison to normal samples (Figure 1F). Furthermore, LINC00839 and GLUT1 levels were detected in neuroblastoma cell lines. As displayed in Figure 1G and H, LINC00839 and GLUT1 abundances were markedly elevated in IMR-32 and SK-N-SH cells when compared to HEK293 cells. These results suggested that the increased LINC00839 and GLUT1 might be involved in neuroblastoma development.
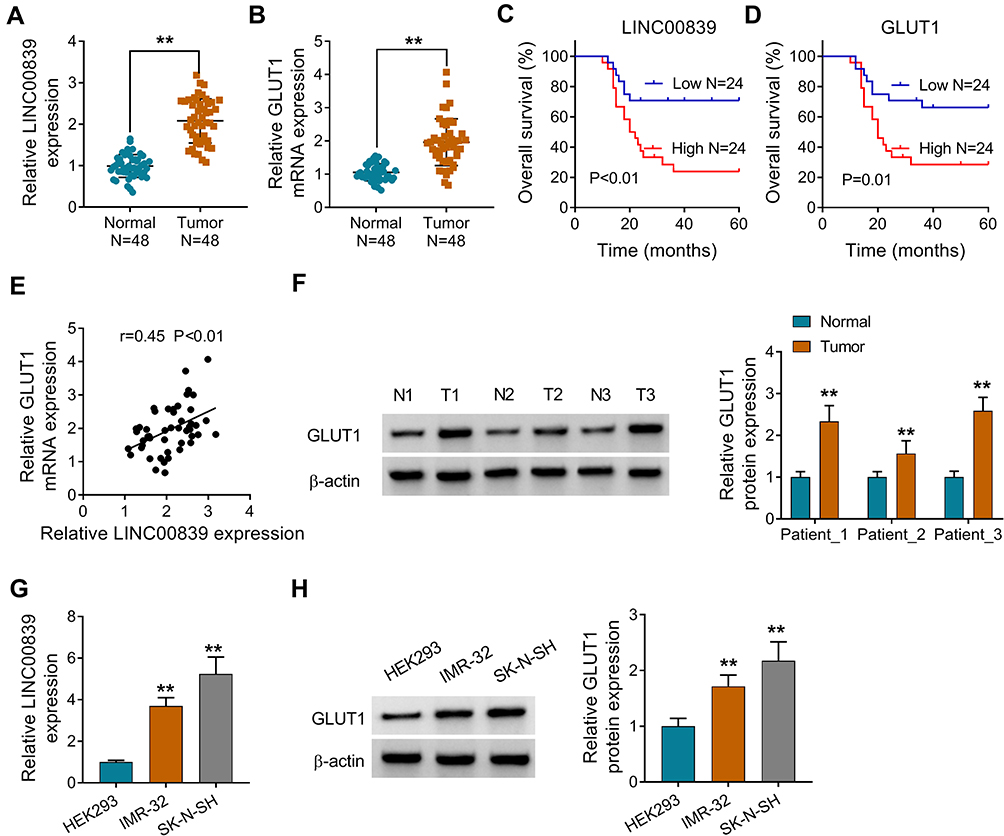 |
Figure 1 LINC00839 and GLUT1 expression in neuroblastoma tissues and cells. (A and B) LINC00839 and GLUT1 abundances were measured via qRT-PCR in neuroblastoma and adjacent noncancerous tissues (n=48). Difference was tested via Student’s t-test. (C and D) The overall survival of neuroblastoma patients was analyzed in low or high expression of LINC00839 or GLUT1 group. The survival curve was tested via Kaplan–Meier’s method and the log-rank test. (E) LINC00839 and GLUT1 expression correlation in neuroblastoma tissues. The correlation was analyzed via Pearson correlation test. (F) GLUT1 protein abundance was examined via Western blot in neuroblastoma and adjacent noncancerous tissues. Difference was tested via Student’s t-test. (G and H) LINC00839 and GLUT1 levels were detected via qRT-PCR and Western blot in neuroblastoma cell lines (IMR-32 and SK-N-SH) and HEK293 cells. Difference was tested via ANOVA followed via Tukey test. The data were displayed as mean ± SD. **P<0.01. |
LINC00839 Knockdown Inhibits Cell Proliferation, Migration, Invasion and Glycolysis and Promotes Apoptosis in Neuroblastoma Cells
To analyze the function of LINC00839 on neuroblastoma development in vitro, IMR-32 and SK-N-SH cells were transfected with sh-LINC00839-1, sh-LINC00839-2 or sh-NC. The transfection of sh-LINC00839-1 and sh-LINC00839-2 effectively reduced LINC00839 abundance in the two cell lines (Figure 2A). Functional analysis showed that LINC00839 knockdown evidently decreased cell proliferation, revealed via the reduced cell viability and colony ability (Figure 2B-D). Moreover, flow cytometry analysis displayed that LINC00839 silence markedly promoted cell apoptosis of IMR-32 and SK-N-SH cells (Figure 2E). In addition, the data of wound healing and transwell analyses exhibited that LINC00839 interference significantly repressed cell migration and invasion (Figure 3A-C). Besides, the influence of LINC00839 on glycolysis in neuroblastoma cells was assessed. As shown in Figure 4A and B, LINC00839 knockdown evidently declined the abundance of GLUT1, a major glucose transporter driving the glucose uptake. Furthermore, LINC00839 down-regulation obviously declined glucose uptake and lactate production in IMR-32 and SK-N-SH cells (Figure 4C and D). These data indicated that LINC00839 knockdown repressed neuroblastoma development in vitro. sh-LINC00839-1 with relative higher effect was chosen for further experiments.
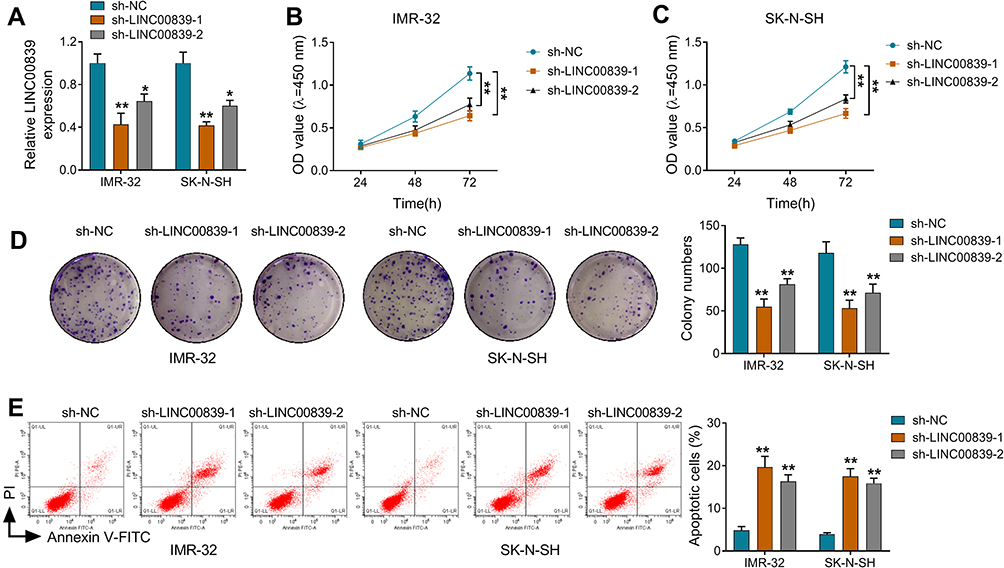 |
Figure 2 The influence of LINC00839 on cell proliferation and apoptosis in neuroblastoma cells. IMR-32 and SK-N-SH cells were transfected with sh-NC, sh-LINC00839-1 or sh-LINC00839-2. (A) LINC00839 expression was measured via qRT-PCR in cells with the indicated transfection. (B and C) Cell viability was detected via CCK-8 at 24, 48 or 72 h. (D) Colony formation was analyzed in cells with the indicated transfection. (E) Cell apoptosis was examined via flow cytometry in cells with the indicated transfection. Difference was tested via ANOVA followed via Tukey test. The data were displayed as mean ± SD. *P<0.05, **P<0.01. |
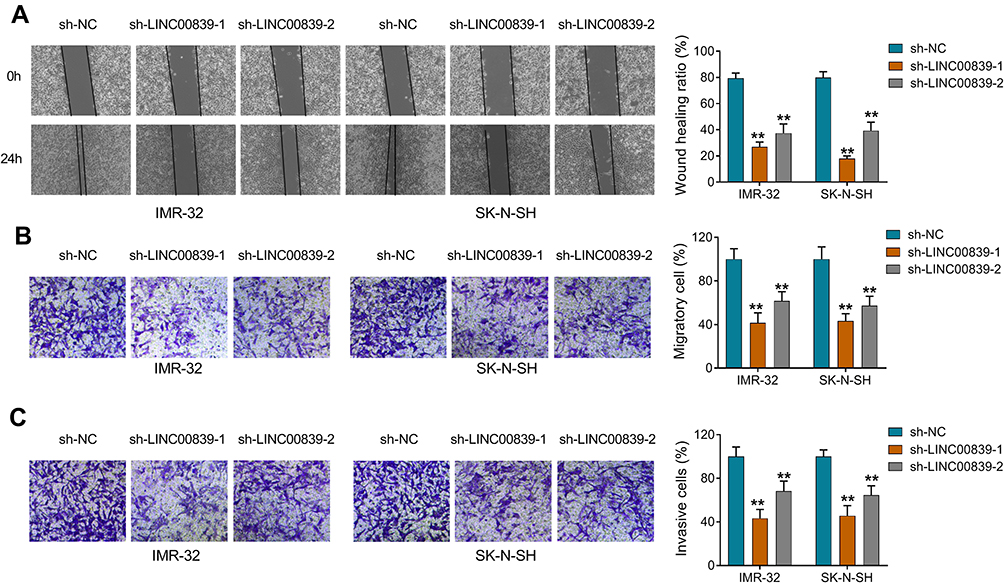 |
Figure 3 The influence of LINC00839 on cell migration and invasion in neuroblastoma cells. IMR-32 and SK-N-SH cells were transfected with sh-NC, sh-LINC00839-1 or sh-LINC00839-2. (A and B) The migrated ability was detected via wound healing and transwell analyses in cells with the indicated transfection. (C) The invasive ability was analyzed via transwell analysis in cells with the indicated transfection. Difference was tested via ANOVA followed via Tukey test. The data were displayed as mean ± SD. **P<0.01. |
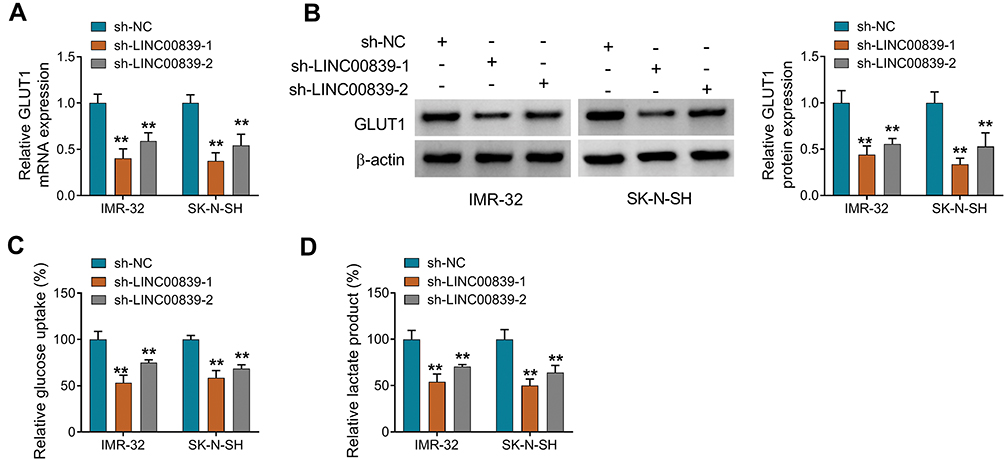 |
Figure 4 The influence of LINC00839 on GLUT1 expression and glycolysis in neuroblastoma cells. IMR-32 and SK-N-SH cells were transfected with sh-NC, sh-LINC00839-1 or sh-LINC00839-2. (A and B) GLUT1 expression was examined via qRT-PCR and Western blot in cells with the indicated transfection. (C and D) Glucose uptake and lactate production were examined in cells with the indicated transfection. Difference was tested via ANOVA followed via Tukey test. The data were displayed as mean ± SD. **P<0.01. |
GLUT1 Overexpression Reverses the Influence of LINC00839 Silence on Cell Proliferation, Apoptosis, Migration, Invasion and Glycolysis in Neuroblastoma Cells
To analyze whether GLUT1 was implicated in LINC00839-mediated neuroblastoma development in vitro, IMR-32 and SK-N-SH cells were transfected with sh-NC, sh-LINC00839-1, sh-LINC00839-1 + Vector or oe-GLUT1. The transfection efficacy of oe-GLUT1 is identified in Figure 5A and B. Also, we confirmed that LINC00839 knockdown markedly reduced GLUT1 expression, and this effect could be reversed by GLUT1 overexpression vector (Supplementary Figure 1). Furthermore, GLUT1 overexpression mitigated silence of LINC00839-mediated proliferation reduction via restoring cell viability and colony ability (Figure 5C-E and Supplementary Figure 2A). Additionally, GLUT1 up-regulation weakened knockdown of LINC00839-induced apoptosis (Figure 5F and Supplementary Figure 2B). Moreover, GLUT1 overexpression attenuated silence of LINC00839-mediated inhibition of migration and invasion (Figure 5G-I and Supplementary Figure 2C-E). Besides, GLUT1 overexpression alleviated knockdown of LINC00839-mediated suppression of glucose uptake and lactate production (Figure 5J and K). These results suggested that LINC00839 might modulate neuroblastoma development in vitro via GLUT1.
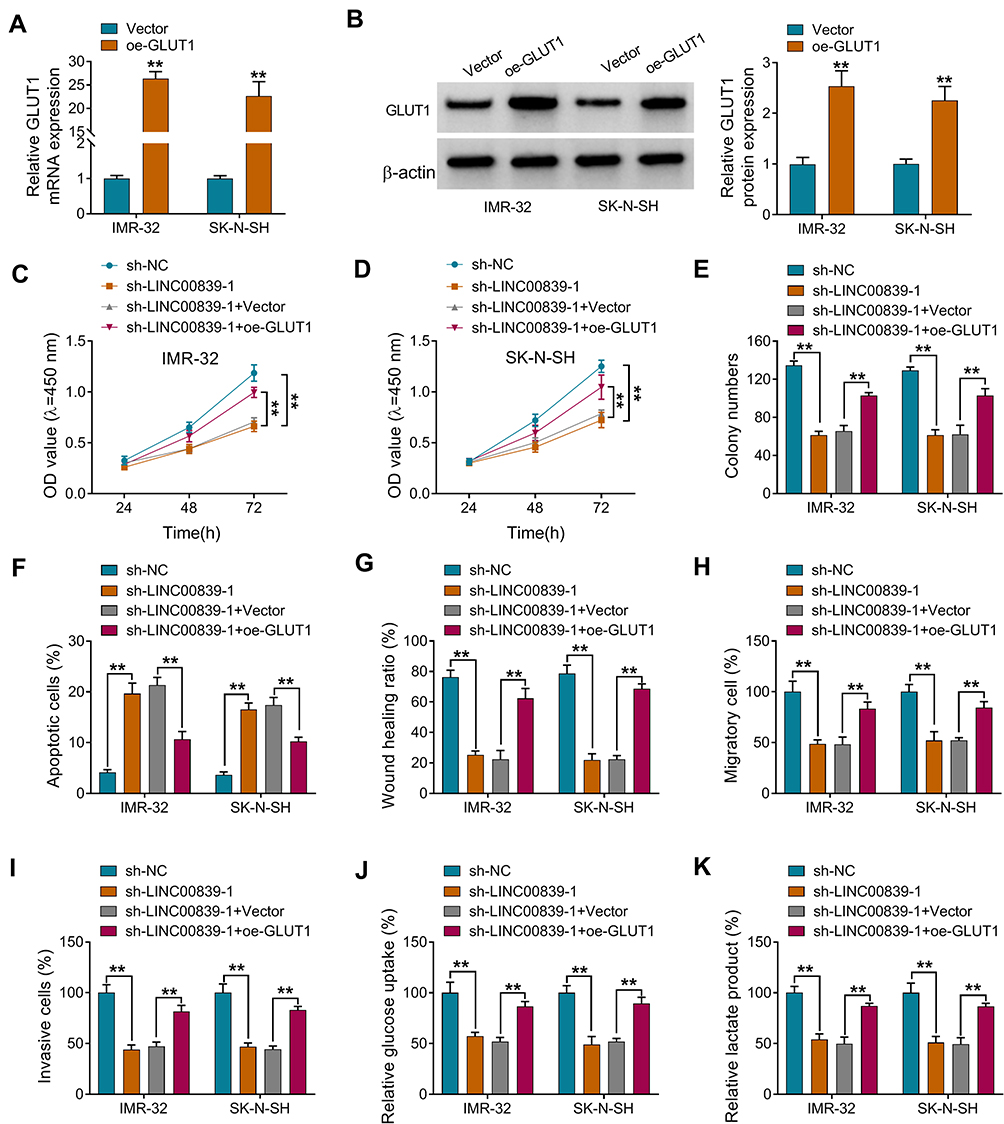 |
Figure 5 The influence of GLUT1 on LINC00839-mediated processes in neuroblastoma cells. IMR-32 and SK-N-SH cells were transfected with Vector or oe-GLUT1. (A and B) GLUT1 abundance was examined via qRT-PCR and Western blot. Difference was tested via Student’s t-test. IMR-32 and SK-N-SH cells were transfected with sh-NC, sh-LINC00839-1, sh-LINC00839-1 + Vector or oe-GLUT1. Cell viability (C and D), colony formation (E), apoptosis (F), migration and invasion (G-I), glucose uptake and lactate production (J and K) were examined in cells with the indicated transfection. Difference was analyzed via ANOVA followed via Tukey test. The data were displayed as mean ± SD. **P<0.01. |
LINC00839 Targets GLUT1 via Sponging miR-338-3p
To analyze how LINC00839 modulated GLUT1, the expression distribution of LINC00839 was detected. As shown in Figure 6A and B, LINC00839 was mainly located in cytoplasm, with 18S rRNA or U6 as reference for cytoplasm or nucleus. Moreover, starBase online predicted that LINC00839 and GLUT1 had the similar binding sites (UGCUGG) of miR-338-3p (Figure 6C). To identify the target relationship between miR-338-3p and LINC00839 or GLUT1, the WT and MUT luciferase reporter vectors were constructed. As displayed in Figure 6D-G, miR-338-3p overexpression evidently declined the luciferase activity of WT LINC00839 and GLUT1 3ʹUTR vectors, but it had little influence on the luciferase activity of MUT LINC00839 and GLUT1 3ʹUTR vectors. Furthermore, there were amounts of LINC00839, miR-338-3p and GLUT1 enriched via Ago2 RIP (Figure 6H and I). In addition, miR-338-3p abundance was evidently declined via LINC00839 silence (Figure 6J), and GLUT1 abundance was markedly reduced via miR-338-3p overexpression (Figure 6K and L). Besides, whether LINC00839 could regulate GLUT1 via miR-338-3p was analyzed in IMR-32 and SK-N-SH cells with transfection of sh-NC, sh-LINC00839-1, sh-LINC00839-1 + anti-NC or anti-miR-338-3p. The transfection efficacy of anti-miR-338-3p is confirmed in Figure 6M. GLUT1 abundance was evidently decreased via LINC00839 silence, which was restored via miR-338-3p knockdown (Figure 6N and O). These data indicated that LINC00839 could modulate GLUT1 expression via binding with miR-338-3p.
 |
Figure 6 The interaction among LINC00839, miR-338-3p and GLUT1 in neuroblastoma cells. (A and B) LINC00839 expression in cytoplasm and nucleus was detected via qRT-PCR with 18S rRNA or U6 as control. (C) The targeted sequence of miR-338-3p and LINC00839 or GLUT1 predicted via starBase. (D-G) Luciferase activity was detected in IMR-32 and SK-N-SH cells with transfection of miR-338-3p mimic or miR-NC and WT or MUT luciferase reporter vectors. (H and I) LINC00839, miR-338-3p and GLUT1 levels were measured after RIP. (J) miR-338-3p abundance was examined in IMR-32 and SK-N-SH cells with transfection of sh-NC or sh-LINC00839-1. (K and L) GLUT1 expression was examined in IMR-32 and SK-N-SH cells with transfection of miR-338-3p mimic or miR-NC. (M) miR-338-3p level was measured in IMR-32 and SK-N-SH cells with transfection of anti-miR-338-3p or anti-NC. (N and O) GLUT1 abundance was detected in IMR-32 and SK-N-SH cells with transfection of sh-NC, sh-LINC00839-1, sh-LINC00839-1 + anti-NC or anti-miR-338-3p. Difference was analyzed via ANOVA followed via Tukey test. The data were displayed as mean ± SD. **P<0.01. |
miR-338-3p Knockdown Mitigates the Influence of LINC00839 Silence on Cell Proliferation, Apoptosis, Migration, Invasion and Glycolysis in Neuroblastoma Cells
To test whether miR-338-3p was required for LINC00839-mediated neuroblastoma development in vitro, IMR-32 and SK-N-SH cells were transfected with sh-NC, sh-LINC00839-1, sh-LINC00839-1 + anti-NC or anti-miR-338-3p. miR-338-3p knockdown attenuated silence of LINC00839-mediated proliferation reduction via increasing cell viability and colony ability (Figure 7A-C and Supplementary Figure 3A). Moreover, miR-338-3p down-regulation mitigated knockdown of LINC00839-caused apoptosis (Figure 7D and Supplementary Figure 3B). In addition, miR-338-3p abrogation abolished the inhibitive influence of LINC00839 silence on migration and invasion (Figure 7E-G and Supplementary Figure 3C-E). Furthermore, miR-338-3p knockdown reversed the inhibitive effect of LINC00839 silence on glucose uptake and lactate production (Figure 7H and I). These results showed that LINC00839 might regulate neuroblastoma development in vitro via miR-338-3p.
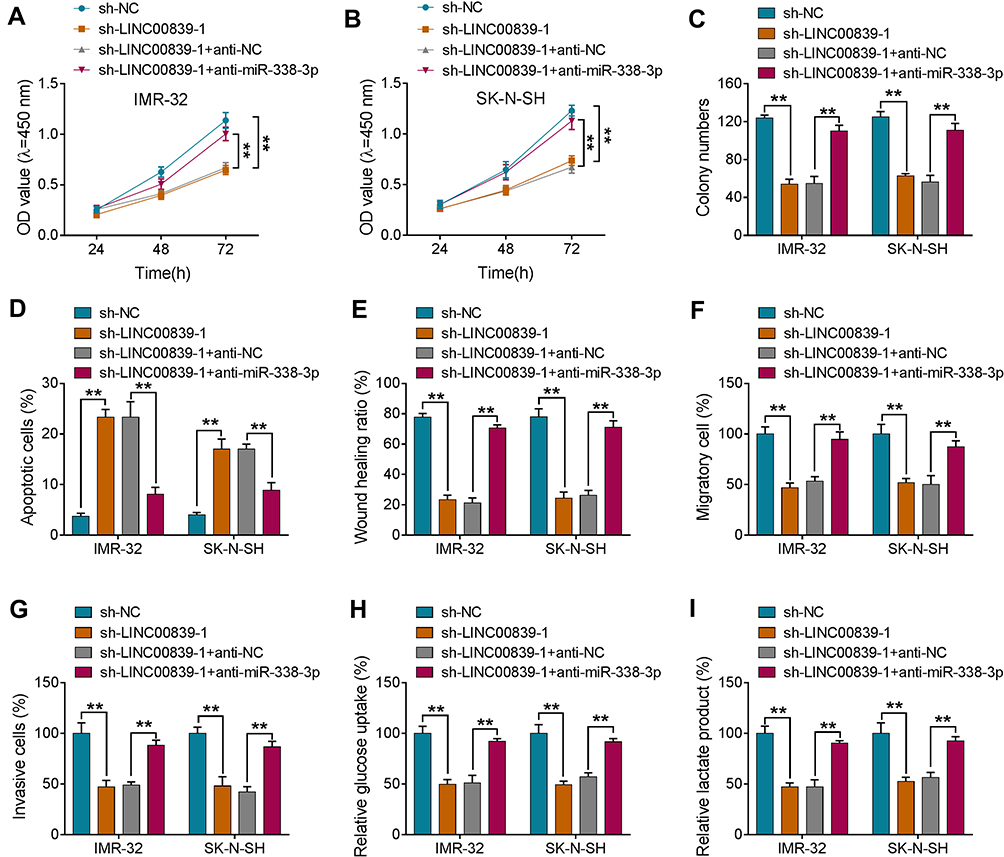 |
Figure 7 The influence of miR-338-3p on LINC00839-mediated processes in neuroblastoma cells. IMR-32 and SK-N-SH cells were transfected with sh-NC, sh-LINC00839-1, sh-LINC00839-1 + anti-NC or anti-miR-338-3p. Cell viability (A and B), colony formation (C), apoptosis (D), migration and invasion (E-G), glucose uptake and lactate production (H and I) were detected in cells with the indicated transfection. Difference was analyzed via ANOVA followed by Tukey test. The data were displayed as mean ± SD. **P<0.01. |
LINC00839 Knockdown Reduces Neuroblastoma Cell Growth in Xenograft Model
To test the function of LINC00839 on regulate neuroblastoma development in vivo, SK-N-SH cells with transfection of sh-NC or sh-LINC00839-1 were applied to establish the xenograft model. Tumor volume and weight were evidently declined in sh-LINC00839-1 group in comparison to sh-NC group (Figure 8A and B). Moreover, the lactate production was markedly inhibited in sh-LINC00839-1 group in comparison to sh-NC group (Figure 8C). Additionally, LINC00839 and GLUT1 abundances were evidently decreased in sh-LINC00839-1 group, while miR-338-3p expression was elevated (Figure 8D-G). Besides, the mice in sh-LINC00839-1 group had the longer survival time than those in sh-NC group (Figure 8H). These data suggested that LINC00839 silence inhibited neuroblastoma development in vivo.
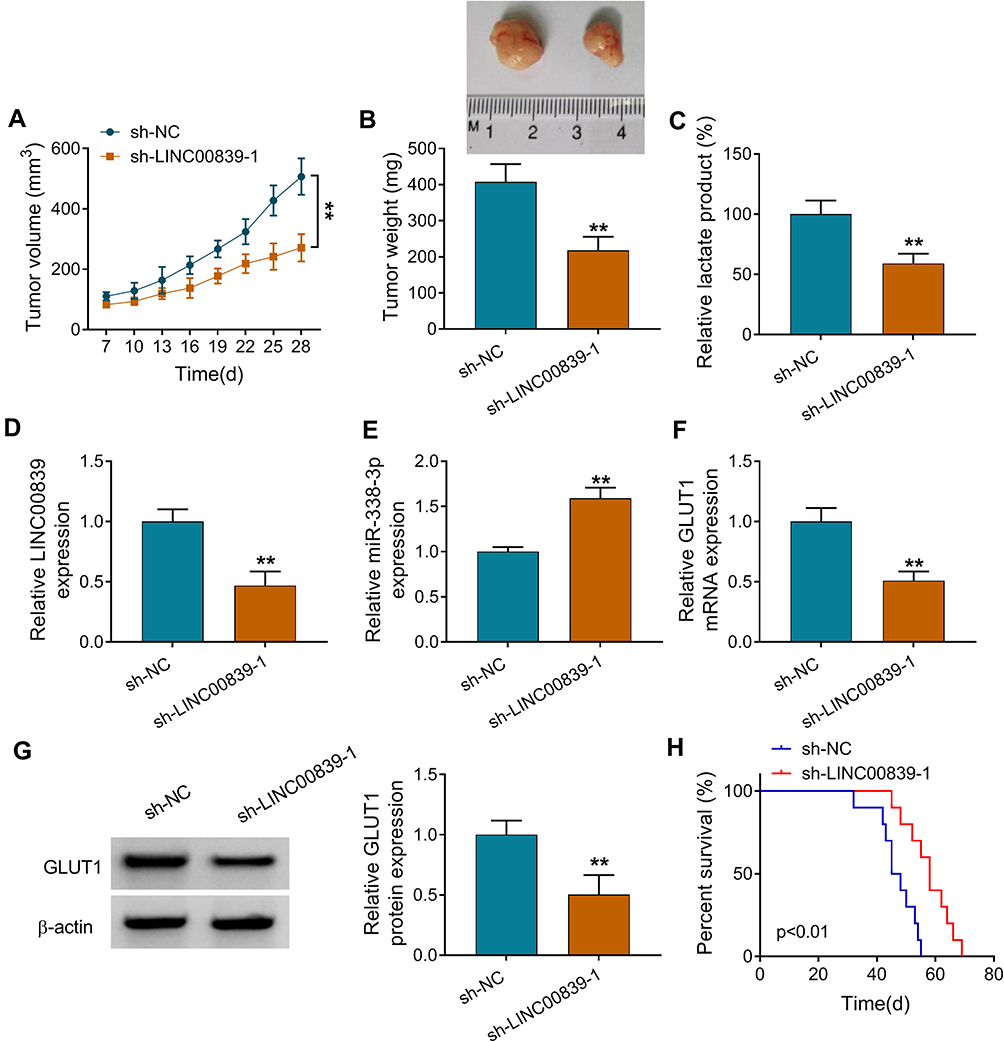 |
Figure 8 The influence of LINC00839 on neuroblastoma cell growth in vivo. SK-N-SH cells with transfection of sh-NC or sh-LINC00839-1 were subcutaneously injected into mice to induce xenograft model. (A) Tumor volume was measured every 3 days from 7 days after cell injection. (B) Tumor weight was detected. (C) Lactate production was analyzed in each group. (D-G) LINC00839, miR-338-3p and GLUT1 abundances were examined in each group. (H) Survival rate of mice in each group was analyzed. Survival curve was tested via Kaplan–Meier’s method and the log-rank test. Difference was tested via Student’s t-test. The data were displayed as mean ± SD. **P<0.01. |
Discussion
Neuroblastoma is a malignant solid tumor with poor prognosis in pediatrics.23 Lots of lncRNAs are relevant to neuroblastoma development.24 Our study aimed to explore the function and mechanism of LINC00839 in neuroblastoma development in vitro and in vivo. The schematic diagram of our study is shown in Figure 9. LINC00839 could target miR-338-3p/GLUT1 axis to promote neuroblastoma cell proliferation, migration, invasion and glycolysis and inhibit apoptosis.
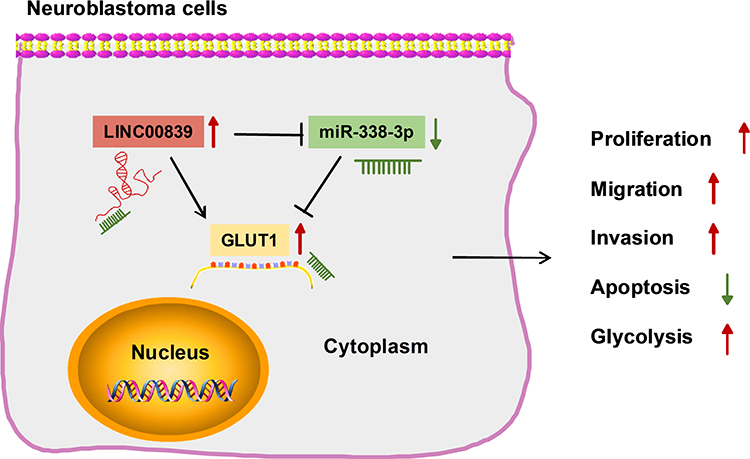 |
Figure 9 Schematic diagram of the mechanism underlying LINC00839/miR-338-3p/GLUT1 axis in neuroblastoma tumorigenesis. LINC00839 could target miR-338-3p/GLUT1 to promote neuroblastoma cell proliferation, migration, invasion and glycolysis, while inhibit apoptosis. |
Sahu et al and Meng et al reported that LINC00839 was highly expressed and associated with poor survival of neuroblastoma patients.8,25 Similarly, we also found LINC00839 expression was enhanced in neuroblastoma, and high expression of LINC00839 indicated the lower overall survival, implying the increased LINC00839 might be associated the malignancy of neuroblastoma. Here, we mainly assessed the function of LINC00839 in vitro. In this research, we found that LINC00839 level was elevated in neuroblastoma cells, and then we performed the loss-of-function experiments. The proliferation, migration and invasion are the main malignancies of neuroblastoma.26 Here we found that LINC00839 silence repressed neuroblastoma cell proliferation, migration and invasion. Glycolysis is a key type of energy metabolism in support of cancer cell proliferation and metastasis, and glucose and lactate are two key metabolic drivers in cancer cell glycolysis.27,28 By detecting glucose uptake and lactate production, we found that LINC00839 silence inhibited glycolysis in neuroblastoma. Besides, we confirmed the anti-growth function of LINC00839 silence in neuroblastoma using a xenograft model. Collectively, LINC00839 inhibition might play an anti-neuroblastoma role.
GLUT1 is a key protein modulating glucose uptake in cancers.29 Previous study suggested that GLUT1 expression was enhanced in neuroblastoma, and associated with the worse outcome of patients.19 Similarly, our study also confirmed these findings. Moreover, inhibition of GLUT1 via inhibitor promoted neuroblastoma cell apoptosis and inhibited cell proliferation.30,31 These indicated the oncogenic role of GLUT1 in neuroblastoma. In our study, GLUT1 overexpression reversed knockdown of LINC00839-mediated inhibition of neuroblastoma development via restoring cell proliferation, migration, invasion and glycolysis, which was consistent with that in many cancers, such as colorectal cancer, bladder cancer, breast cancer and oral squamous cell carcinoma.17,18,32,33 These results suggested that LINC00839 could target GLUT1 to regulate neuroblastoma development.
Next, we explored how LINC00839 would target GLUT1. miRNAs could act as a cross talk between lncRNAs and mRNAs.34 Here we were the first to identify LINC00839 could sponge miR-338-3p to target GLUT1. Previous studies reported that miR-338-3p repressed cell proliferation, migration and invasion in neuroblastoma via targeting PREX2a or polo-like kinase 4 (PLK4), suggesting the anti-cancer role of miR-338-3p in neuroblastoma.13,35 In our study, miR-338-3p knockdown mitigated the anti-cancer role of LINC00839 silence in neuroblastoma. Thus, we concluded that LINC00839 could target GLUT1 via miR-338-3p to participate in neuroblastoma development.
In conclusion, LINC00839 knockdown restrained cell proliferation, migration, invasion and glycolysis and increased apoptosis in neuroblastoma, possibly via regulating miR-338-3p/GLUT1 axis. This study provided a new insight into the development of neuroblastoma.
Funding
Project of Science and Technology Plan of Jingmen City in 2018 (No. 2018YDKY027) .
Disclosure
The authors declare that they have no conflicts of interest.
References
1. Louis CU, Shohet JM. Neuroblastoma: molecular pathogenesis and therapy. Annu Rev Med. 2015;66(1):49–63. doi:10.1146/annurev-med-011514-023121
2. Pastor ER, Mousa SA. Current management of neuroblastoma and future direction. Crit Rev Oncol Hematol. 2019;138:38–43.
3. Pinto NR, Applebaum MA, Volchenboum SL, et al. Advances in risk classification and treatment strategies for neuroblastoma. J Clin Oncol. 2015;33(27):3008–3017.
4. Chi Y, Wang D, Wang J, Yu W, Yang J. Long Non-Coding RNA in the pathogenesis of cancers. Cells. 2019;8:9.
5. Pandey GK, Kanduri C. Long noncoding RNAs and neuroblastoma. Oncotarget. 2015;6(21):18265–18275.
6. Zhang HY, Xing MQ, Guo J, et al. Long noncoding RNA DLX6-AS1 promotes neuroblastoma progression by regulating miR-107/BDNF pathway. Cancer Cell Int. 2019;19:313.
7. Ye M, Ma J, Liu B, Liu X, Ma D, Dong K. Linc01105 acts as an oncogene in the development of neuroblastoma. Oncol Rep. 2019;42(4):1527–1538.
8. Sahu D, Ho SY, Juan HF, Huang HC. High-risk, expression-based prognostic long noncoding RNA signature in neuroblastoma. JNCI Cancer Spectr. 2018;2(2):pky015.
9. Salomao KB, Pezuk JA, de Souza GR, et al. MicroRNA dysregulation interplay with childhood abdominal tumors. Cancer Metastasis Rev. 2019;38(4):783–811.
10. Galardi A, Colletti M, Businaro P, Quintarelli C, Locatelli F, Di Giannatale A. MicroRNAs in neuroblastoma: biomarkers with therapeutic potential. Curr Med Chem. 2018;25(5):584–600. doi:10.2174/0929867324666171003120335
11. Li Q, Pan X, Zhu D, Deng Z, Jiang R, Wang X. Circular RNA MAT2B promotes glycolysis and malignancy of hepatocellular carcinoma through the miR-338-3p/PKM2 axis under hypoxic stress. Hepatology. 2019;70(4):1298–1316.
12. Liu X, Zhu Q, Guo Y, Xiao Z, Hu L, Xu Q. LncRNA LINC00689 promotes the growth, metastasis and glycolysis of glioma cells by targeting miR-338-3p/PKM2 axis. Biomed Pharmacother. 2019;117:109069.
13. Chen X, Pan M, Han L, Lu H, Hao X, Dong Q. miR-338-3p suppresses neuroblastoma proliferation, invasion and migration through targeting PREX2a. FEBS Lett. 2013;587(22):3729–3737.
14. Ganapathy-Kanniappan S, Geschwind JF. Tumor glycolysis as a target for cancer therapy: progress and prospects. Mol Cancer. 2013;12:152.
15. Aminzadeh S, Vidali S, Sperl W, Kofler B, Feichtinger RG. Energy metabolism in neuroblastoma and Wilms tumor. Transl Pediatr. 2015;4(1):20–32.
16. Meng Y, Xu X, Luan H, et al. The progress and development of GLUT1 inhibitors targeting cancer energy metabolism. Future Med Chem. 2019;11(17):2333–2352.
17. Zhang ZJ, Zhang YH, Qin XJ, Wang YX, Fu J. Circular RNA circDENND4C facilitates proliferation, migration and glycolysis of colorectal cancer cells through miR-760/GLUT1 axis. Eur Rev Med Pharmacol Sci. 2020;24(5):2387–2400.
18. Chen X, Yu J, Tian H, et al. Circle RNA hsa_circRNA_100290 serves as a ceRNA for miR-378a to regulate oral squamous cell carcinoma cells growth via Glucose transporter-1 (GLUT1) and glycolysis. J Cell Physiol. 2019;234(11):19130–19140.
19. Ramani P, Headford A, May MT. GLUT1 protein expression correlates with unfavourable histologic category and high risk in patients with neuroblastic tumours. Virchows Arch. 2013;462(2):203–209.
20. Chomczynski P, Sacchi N. The single-step method of RNA isolation by acid guanidinium thiocyanate-phenol-chloroform extraction: twenty-something years on. Nat Protoc. 2006;1(2):581–585.
21. Livak KJ, Schmittgen TD. Analysis of relative gene expression data using real-time quantitative PCR and the 2(-Delta Delta C(T)) Method. Methods. 2001;25(4):402–408.
22. Li JH, Liu S, Zhou H, Qu LH, Yang JH. starBase v2.0: decoding miRNA-ceRNA, miRNA-ncRNA and protein-RNA interaction networks from large-scale CLIP-Seq data. Nucleic Acids Res. 2014;42(Database issue):D92–97.
23. Matthay KK, Maris JM, Schleiermacher G, et al. Neuroblastoma. Nat Rev Dis Primers. 2016;2:16078.
24. Prajapati B, Fatma M, Fatima M, Khan MT, Sinha S, Seth PK. Identification of lncRNAs associated with neuroblastoma in cross-sectional databases: potential biomarkers. Front Mol Neurosci. 2019;12:293.
25. Meng X, Fang E, Zhao X, Feng J. Identification of prognostic long noncoding RNAs associated with spontaneous regression of neuroblastoma. Cancer Med. 2020;9(11):3800–3815.
26. Aygun N. Biological and genetic features of neuroblastoma and their clinical importance. Curr Pediatr Rev. 2018;14(2):73–90.
27. Abdel-Wahab AF, Mahmoud W, Al-Harizy RM. Targeting glucose metabolism to suppress cancer progression: prospective of anti-glycolytic cancer therapy. Pharmacol Res. 2019;150:104511.
28. Ippolito L, Morandi A, Giannoni E, Chiarugi P. Lactate: a metabolic driver in the tumour landscape. Trends Biochem Sci. 2019;44(2):153–166.
29. Ancey PB, Contat C, Meylan E. Glucose transporters in cancer - from tumor cells to the tumor microenvironment. FEBS J. 2018;285(16):2926–2943.
30. Peng Y, Xing SN, Tang HY, et al. Influence of glucose transporter 1 activity inhibition on neuroblastoma in vitro. Gene. 2019;689:11–17.
31. Matsushita K, Uchida K, Saigusa S, et al. Glycolysis inhibitors as a potential therapeutic option to treat aggressive neuroblastoma expressing GLUT1. J Pediatr Surg. 2012;47(7):1323–1330.
32. Chen J, Cao L, Li Z, Li Y. SIRT1 promotes GLUT1 expression and bladder cancer progression via regulation of glucose uptake. Hum Cell. 2019;32(2):193–201.
33. He Y, Deng F, Zhao S, et al. Analysis of miRNA-mRNA network reveals miR-140-5p as a suppressor of breast cancer glycolysis via targeting GLUT1. Epigenomics. 2019;11(9):1021–1036.
34. Ergun S, Oztuzcu S. Oncocers: ceRNA-mediated cross-talk by sponging miRNAs in oncogenic pathways. Tumour Biol. 2015;36(5):3129–3136.
35. Zhang N, Liu FL, Ma TS, Zhang ZZJ. LncRNA SNHG1 contributes to tumorigenesis and mechanism by targeting miR-338-3p to regulate PLK4 in human neuroblastoma. Eur Rev Med Pharmacol Sci. 2019;23(20):8971–8983.
 © 2021 The Author(s). This work is published and licensed by Dove Medical Press Limited. The full terms of this license are available at https://www.dovepress.com/terms.php and incorporate the Creative Commons Attribution - Non Commercial (unported, v3.0) License.
By accessing the work you hereby accept the Terms. Non-commercial uses of the work are permitted without any further permission from Dove Medical Press Limited, provided the work is properly attributed. For permission for commercial use of this work, please see paragraphs 4.2 and 5 of our Terms.
© 2021 The Author(s). This work is published and licensed by Dove Medical Press Limited. The full terms of this license are available at https://www.dovepress.com/terms.php and incorporate the Creative Commons Attribution - Non Commercial (unported, v3.0) License.
By accessing the work you hereby accept the Terms. Non-commercial uses of the work are permitted without any further permission from Dove Medical Press Limited, provided the work is properly attributed. For permission for commercial use of this work, please see paragraphs 4.2 and 5 of our Terms.