")
Back to Journals » Cancer Management and Research » Volume 10
LIMD1 is a survival prognostic marker of gastric cancer and hinders tumor progression by suppressing activation of YAP1
Authors Zhang D, Li S, Yu W, Chen C, Liu T, Sun Y, Zhao Z, Liu L
Received 24 May 2018
Accepted for publication 8 August 2018
Published 9 October 2018 Volume 2018:10 Pages 4349—4361
DOI https://doi.org/10.2147/CMAR.S174856
Checked for plagiarism Yes
Review by Single anonymous peer review
Peer reviewer comments 2
Editor who approved publication: Dr Antonella D'Anneo
Di Zhang,1,* Song Li,1,* Wenbin Yu,2,* Cheng Chen,2 Teng Liu,2 Yiting Sun,1 Zeyi Zhao,1 Lian Liu1
1Department of Chemotherapy, Cancer Center, Qilu Hospital of Shandong University, Jinan, Shandong, China; 2Department of General Surgery, Qilu Hospital of Shandong University, Jinan, Shandong, China
*These authors contributed equally to this work
Purpose: The purpose of this study was to investigate the clinical significance of LIMD1 and its biological roles in gastric cancer (GC).
Materials and methods: The prognostic value of LIMD1 in GC patients was determined by the online tool Kaplan–Meier Plotter. The biological functions of LIMD1 in GC were examined by in vitro assays, including proliferation, anchorage-independent growth, migration, invasion, and epithelial to mesenchymal transition (EMT) assays. The levels of downstream YAP1 regulated by LIMD1 were measured by Western blot analysis, and the sub-localization of YAP1 in GC cells was visualized by immunofluorescence staining. Differential expression levels and copy number levels of LIMD1 between GC and normal tissues were compared using the Oncomine database. A correlation of LIMD1 mRNA level and the copy number level was depicted by cBioPortal. We also evaluated the methylation status around the LIMD1 genes by Wanderer.
Results: The expression level of LIMD1 positively correlated with the prognosis of GC patients regardless of tumor stage, size, lymph node, metastasis, Lauren’s classification, differentiation, gender, treatment, and ERBB2 amplification status. Overexpression of LIMD1 impeded the tumor growth, cell motility, invasiveness, and metastasis, and knockdown of LIMD1 promoted these phenotypes in GC cells. Mechanistically, YAP1 was one of the downstream effectors of LIMD1; LIMD1 suppressed the expression of YAP1 as well as its intracellular translocation. Furthermore, we found that LIMD1 expression was reduced in some of the GC profiling datasets. Gene deletion, instead of DNA methylation, contributed to the reduced expression of LIMD1 in GC.
Conclusion: Our results identified LIMD1 as a convincing prognostic marker as well as a potentially therapeutic target for GC.
Keywords: gastric cancer, prognostic marker, oncosuppressor, LIMD1, YAP1
Introduction
Gastric cancer (GC) is an aggressive disease that has substantial impact on global health. Despite a gradual decline in GC incidence in the developed countries recently, it still has been the fifth most common cancer but the third leading cause of cancer-related death worldwide.1,2 The diagnosis of GC is frequently made when the disease is unresectable, due to the lack of specific symptoms and sensitive screening methods at the early stages.3 Besides, tumor recurrence occurs in approximately 60% of the patients who received curative resection.4,5 Patients with advanced disease have a dismal outcome, with the 5-year survival rate of about 20% and a median OS (mOS) of <1 year.3,6–8
Palliative therapy is the only operable treatment for advanced GC.5 Due to the elusive heterogeneity of GC tissues, patients received limited benefit from chemotherapy with low efficiency and drug resistance.9 Targeted therapy has poor efficacy due to the lack of powerful targets.10 Trastuzumab (anti-HER2 monoclonal antibody [mAb]), in combination with chemotherapy, is accepted to improve disease-free survival (DFS) and OS in patients in Phase III randomized ToGA trial, but its usage is confined to the small proportion of patients with HER2 overexpression, which only accounts to 7.3–20.2%.11 Apatinib, a small molecule tyrosine kinase inhibitor that blocks VEGFR-2, can significantly prolong OS and progression-free survival (PFS) in GC patients.12 However, its usage is limited in patients experiencing progression after two or more lines of chemotherapy.12 In contrast, several targeting agents that had promising effects in other types of cancers failed in Phase III randomized trials of GC. For example, the addition of cetuximab (anti-EGFR mAb) provided no extra benefit to chemotherapy alone in the first-line treatment of advanced GC.13 The AVAGAST study, in which the efficacy of bevacizumab (anti-VEGF-A mAb) was evaluated in the first-line treatment of advanced GC, did not reach a significantly prolonged OS.14 Besides, the mTOR inhibitor, everolimus, did not improve OS for advanced GC that progressed after one or two lines of previous systemic chemotherapy, either.15
The invasion and metastasis of GC are complex processes, including lowered cell adhesion, extracellular matrix degradation, cell migration, secondary colonization, angiogenesis, and the corresponding changes in tumor microenvironments. The underlying mechanisms involve multiple signal transduction pathways controlled by various proteins such as adhesion molecules, matrix protease, and cytokines.16 Nevertheless, these mechanisms have not been fully elucidated so far. Therefore, further understanding of the molecular mechanisms of GC carcinogenesis and progression is critical for identifying valuable prognostic markers and candidate intervention targets to provide novel strategies for early diagnosis and treatment of GC and ultimately improve the prognosis of GC patients.
LIMD1 is a member of the Ajuba family of the LIM domain-containing proteins.17,18 It is encoded at chromosome 3p21.3, a region frequently deleted in many solid malignancies and the so-called the common eliminated region 1 (C3CER1).17 This region contains multiple tumor suppressor genes involved in the oncogenesis of lung cancer,19 breast cancer,20 cervical carcinoma,21 bladder cancer,22 and renal cancer.23 LIMD1 acts as a protein–protein scaffold to facilitate signaling transductions from the cytoplasm into the nucleus and has functional redundancy with other Ajuba LIM proteins.24–26 Its interaction partners include pRB,27 p62/TRAF6/a-PKC complex,24 eIF4E,25 LATS/Warts,28 WW45/Sav,28 and Snail/Slug.26 These proteins play indispensable roles in regulating a range of cellular functions, such as cell fate determination, cytoskeletal organization, osteoclast development, cell–cell adhesion, cell differentiation, proliferation, and migration. As a tumor suppressor gene, LIMD1 is downregulated in non-small-cell lung cancers and leads to misregulation of pRB and cell cycles.27,29 Delocalization of LIMD1 from the nucleus may contribute to breast cancer metastasis due to the fact that nuclear LIMD1 acts as a Snail corepressor of E-cadherin expression.26,30 LIMD1 also interacts with BRCA2 to suppress abnormal cell divisions in esophageal cancer cells.31 Despite the role of LIMD1 in mediating these physiological and oncogenic processes, the biological significance of LIMD1 in GC has remained unclear.
Hippo signaling pathway is a conserved regulator of cell growth, homeostasis, apoptosis, commitment, differentiation, and senescence.32 The key components consist of a set of kinase cascade, including WW45, MST1/2, and LATS 1/2, in mammals.33 When this pathway was suppressed, the final effector, YAP1, was dephosphorylated and translocated from the cytoplasm into the nucleus to regulate multiple transcriptional outcomes.34,35 In the stomach, multiple researches on clinical samples and cell lines indicate that YAP1 acts as a potent oncogene.36–39 In a recent study, LIMD1 was reported to inhibit phosphorylation of Yki (homolog of YAP1) by interacting with Warts (homolog of LATS) and Sav (homolog of WW45).28
In the present study, we investigated the expression pattern and possible tumor suppressor role of LIMD1 and its clinical significance in GC. We also explored its downstream effectors as well as the defective regulatory mechanisms of LIMD1 expression in GC.
Materials and methods
Cell culture
The human GC cell lines, including BGC823, SCC7901, MKN45, and MKN28, were purchased from the Cell Bank, Chinese Academy of Science (Shanghai, China). All cell incubations were maintained in the incubator at 37°C, with a relative humidity of 90% and 5% CO2. Cells were passaged when the confluence reached 80–90%. Exponentially growing cells were used for all experiments.
Transfection
The siRNA targeting LIMD1 (Santa Cruz Biotechnology Inc., Dallas, TX, USA) was used for knockdown experiments, with a scramble siRNA (Santa Cruz Biotechnology Inc.) as negative control. LIMD1 overexpression plasmid was a generous gift from Dr Jixin Dong from the University of Nebraska Medical Center, Omaha, NE, USA. The transfection processes were conducted according to the manufacturer’s instructions. In brief, a volume of 10 µL siRNA or 4 µg plasmid was mixed with 5 µL Lipofectamine 2000 (Thermo Fisher Scientific, Waltham, MA, USA) and 500 µL of OPTI-MEM (Thermo Fisher Scientific). Then, the mixture was added to the cells with 1.5 mL Roswell Park Memorial Institute (RPMI)-1640 (Thermo Fisher Scientific), and the supernatant was replaced with normal medium after 6-hour incubation.
Western blotting
Samples containing 30 µg proteins were separated using 10% SDS-PAGE and transferred to polyvinylidene difluoride (PVDF) membranes (Thermo Fisher Scientific). The rabbit antihuman LIMD1 mAb, mouse antihuman E-cadherin mAb, rabbit antihuman N-cadherin mAb, and rabbit antihuman YAP1 mAb were purchased from Cell Signaling Technology (Danvers, MA, USA). The rabbit antihuman Vimentin mAb was obtained from Abcam (Cambridge, UK). The mouse antihuman β-actin mAb was obtained from Sigma-Aldrich Co. (St Louis, MO, USA). The immunoreactive bands were visualized using the MiniBIS Pro gel imaging system (DNR Bio Imaging Systems, Jerusalem, Israel).
Proliferation assay
Cells were seeded into 96-well plates at approximately 1×10⁴ cells/well. After culturing for 0, 24, 48, 72, 96, and 120 hours at 37°C, the medium was replaced with 100 µL fresh medium and 10 µL cell counting kit-8 (CCK-8; BestBio, Shanghai, China) solution and incubated for 2 hours. The OD values of the solutions were determined at 450 nm with an absorbance reader (Thermo Fisher Scientific). Each point was replicated three times independently.
Colony formation assay
Cells were digested into single cell suspensions, and 1,000 of them were seeded in each well of six-well plates. Two weeks later, cells were fixed with methanol and stained with crystal violet. The colony-forming efficiency was defined as the number of colonies obtained divided by the number of cells seeded.
Invasion and migration assays
Invasion and migration assays were performed using a Transwell system (8 µm pore size; Corning Incorporated, Corning, NY, USA) according to the manufacturer’s instructions. The upper chamber was coated with Matrigel (BD Biosciences, San Jose, CA, USA) for invasion assay. Serum-free RPMI-1640 (Thermo Fisher Scientific) containing 6×10⁴ (for migration assay) and 8×10⁴ cells (for invasion assay) was seeded in the upper chamber. The lower chamber contained RPMI-1640 medium with 10% FBS (Sciencell, San Diego, CA, USA). After 48 hours of incubation, the invasive and migratory cells were fixed with methanol, stained with crystal violet (Beyotime, Shanghai, China), and photographed under microscopy.
Cell immunofluorescence staining
BGC823 cells were fixed with 4% paraformaldehyde and permeabilized with 0.5% Triton X-100 (Sigma-Aldrich Co.). The cells were incubated overnight at 4°C with the rabbit antihuman E-cadherin, N-cadherin, and Vimentin mAb for epithelial to mesenchymal transition (EMT) assay or YAP1 mAb for YAP translocation study. Then, the Alexa Fluor 594-conjugated anti-rabbit IgG was added. The stained cells were fixed and observed under an inverted fluorescence microscope (Olympus Corporation, Tokyo, Japan) in the presence of DAPI.
In silico analysis
The survival data were performed by the online tool Kaplan–Meier (KM) Plotter40 (http://kmplot.com/). KM survival plots, patient number, HRs and 95% CIs, and log-rank P-values were extracted from the webpage. The data of expression and copy number variations in GC cohorts were extracted from the Oncomine database. The correlation between mRNA and copy number levels was depicted by cBioPortal (http://www.cbioportal.org/). The methylation status around LIMD1 gene and the difference between GC and normal tissues were calculated by Wanderer (http://maplab.imppc.org/wanderer).
Statistical analyses
GraphPad Prism 6 and Microsoft Excel were used for graphs and statistics. The methylation status was generated from the online tool Wanderer. Unpaired t-test was used to evaluate statistical significance of the mean values. Log-rank test was used to compare the survival data. A P-value <0.05 was considered to indicate statistical significance.
Results
The mRNA level of LIMD1 positively correlates with prognosis in patients with GC
To define the biological significance of LIMD1 in GC, we first explored its prognostic value using an online tool KM Plotter.40 This database contains expression profile and survival data of a total of 631 GC patients, thus providing considerable reliable evidence. We chose the Affymetrix probe 222762_x_at, the only best and the most recommended probe set according to the website. The survival analysis that included all patients showed an mOS of 80.0 months in the LIMD1 high expression group vs 28.8 months in the LIMD1 low expression group, with a significant survival extension of >50 months. The HR for death in the LIMD1 high expression group was 0.57 (95% CI: 0.46–0.71, P<0.0001), which statistically decreased by 43% compared with the LIMD1 low expression group (Figure 1A). Similarly, the LIMD1 high expression group also showed a longer median PFS (mPFS) than the LIMD1 low expression group (50.0 vs 18.9 months, P<0.0001; HR: 0.56; 95% CI: 0.44–0.73), with the recurrence risk decreased by 44% (Figure 1B).
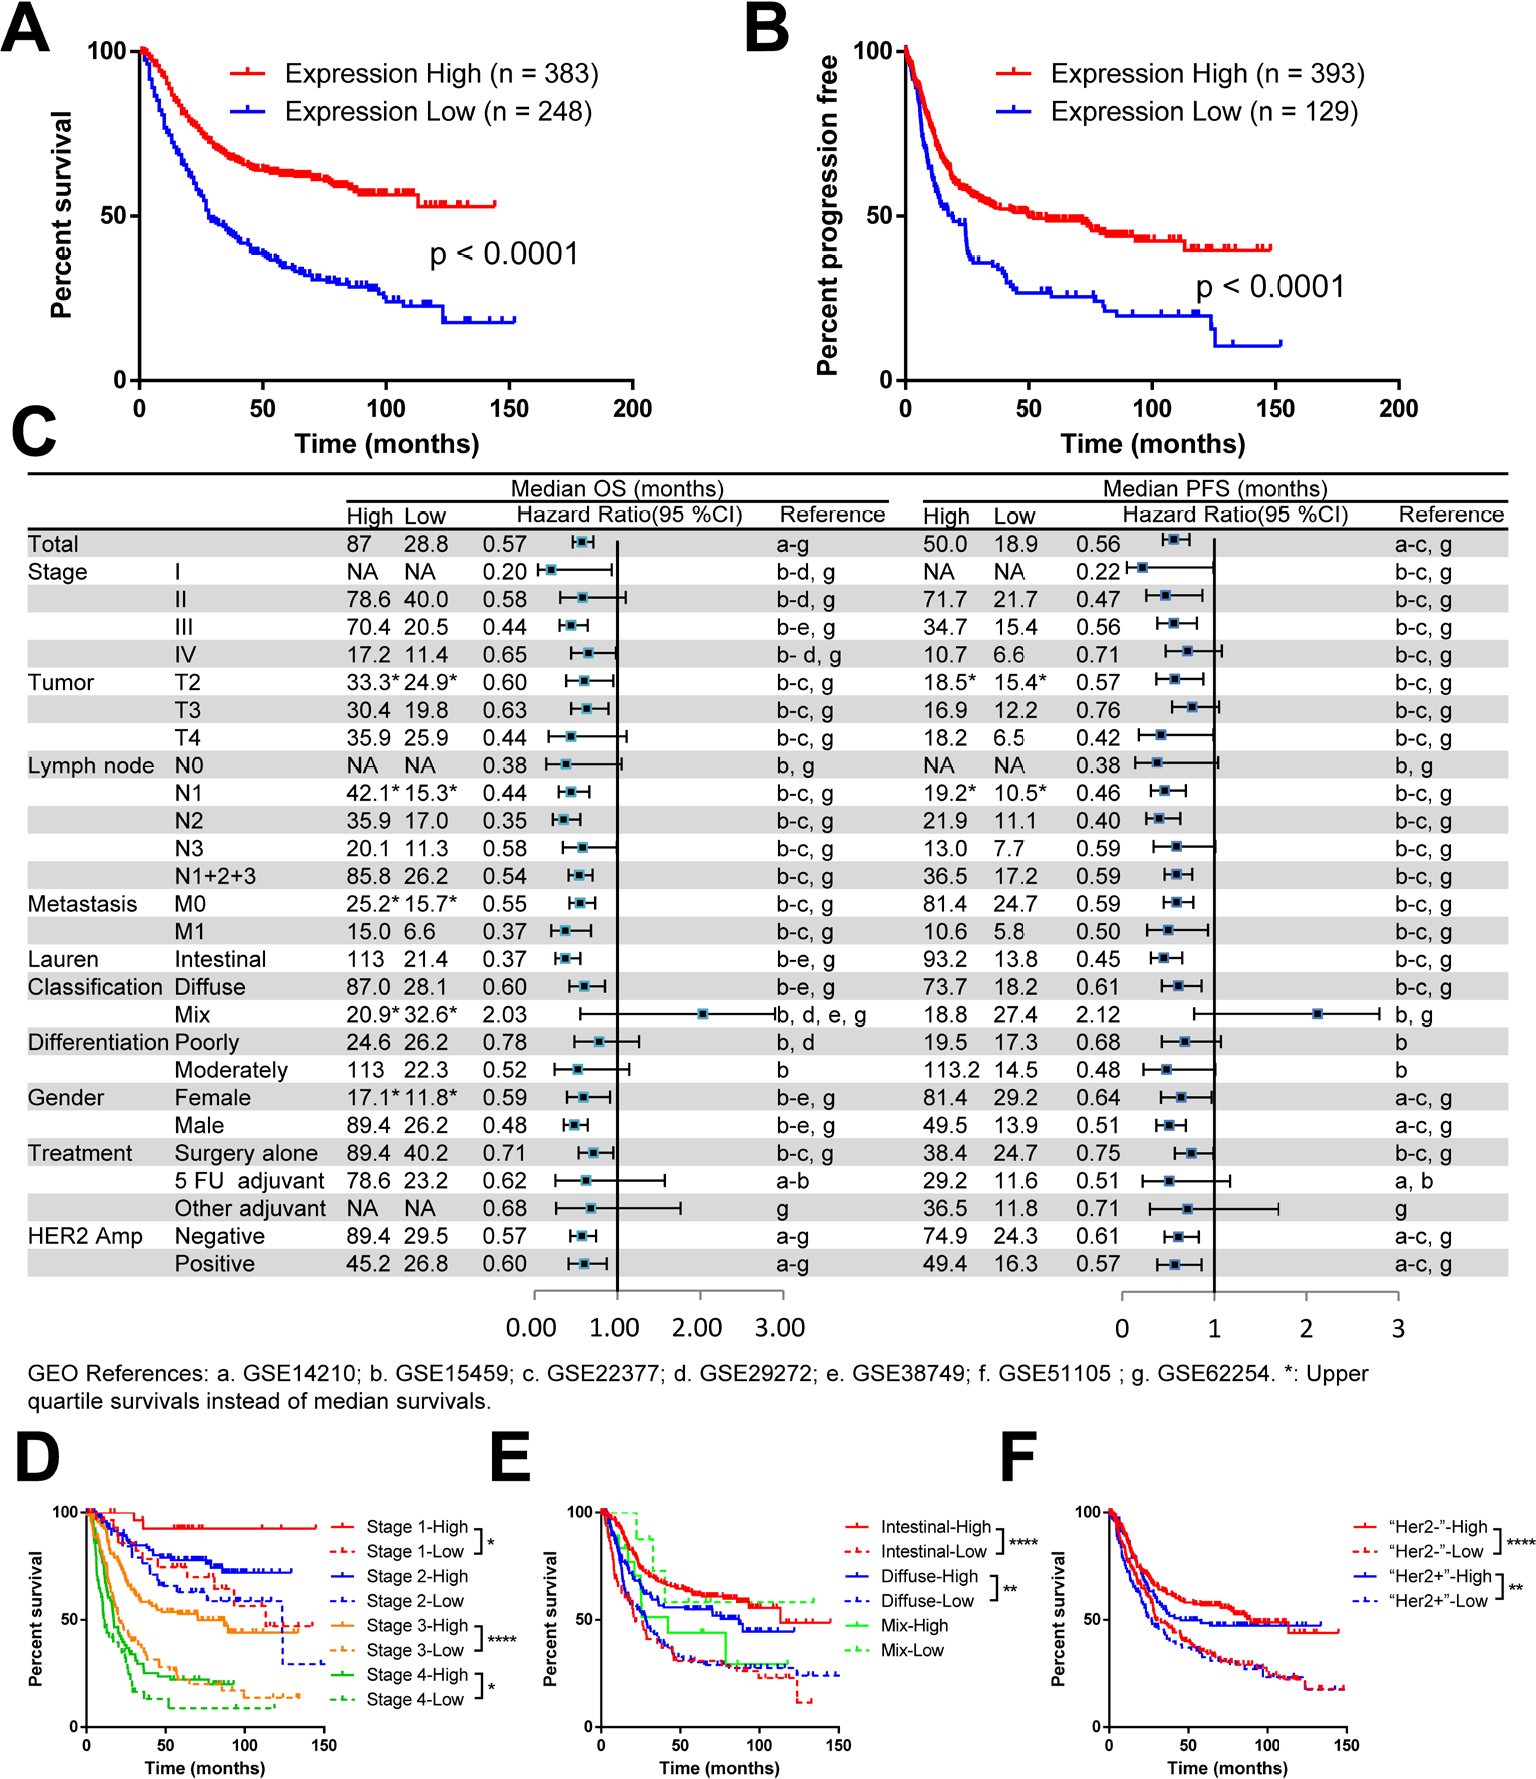 | Figure 1 The mRNA level of LIMD1 correlates with prognosis in patients with GC. Notes: (A) KM plots of PFS and LIMD1 expression are shown. (B) KM plots of OS and LIMD1 expression are shown. The expression data were interrogated from the GEO datasets including GSE14210, GSE15459, GSE22377, GSE29272, GSE38749, GSE51105, and GSE62254, and the results were downloaded from KM Plotter (http://kmplot.com/). (C) The HRs for OS and PFS in LIMD1 high-expressing and low-expressing patients are compared in the forest plot. The mOS, mPFS, HRs, and 95% CI are listed for each subgroup. (D–F) KM plots of OS and LIMD1 expression for patients in the subgroups of different stages (D), Lauren’s classification (E), and HER2 amplifications (F) are shown. *P<0.05; **P<0.01; ****P<0.0001. Abbreviations: GC, gastric cancer; KM, Kaplan–Meier; mOS, median OS; mPFS, median PFS; PFS, progression-free survival; GEO, gene expression omnibus. |
The consistency of the prognostic value across the dataset is summarized in the forest plot for subgroup analysis (Figure 1C). The mOS and mPFS in the LIMD1 high expression group were generally prolonged in contrast to the LIMD1 low expression group, with a significant statistical survival extension in groups of stage III, T2 and T3, intestinal and diffuse type, surgery alone, all N stage, all M stage, all gender, and all HER2 amplification status (Figure 1C). The survival differences between the LIMD1 high and low expression groups were especially prominent in subgroups of stage III (mOS: 70.4 vs 20.5 months, HR: 0.44; mPFS: 34.7 vs 15.4 months, HR: 0.56), N2 (mOS: 35.9 vs 17.0 months, HR: 0.35; mPFS: 21.9 vs 11.1 months, HR: 0.40), M0 (mPFS: 34.7 vs 15.4 months, HR: 0.56), Lauren’s intestinal-type (mOS: 113.0 vs 21.4 months, HR: 0.37; mPFS: 81.4 vs 24.7 months, HR: 0.59), male (mOS: 89.4 vs 26.2 months, HR: 0.48; mPFS: 49.5 vs 13.9 months, HR: 0.51), and HER2 non-amplification (mOS: 89.4 vs 29.5 months, HR: 0.57; mPFS: 74.9 vs 24.3 months, HR: 0.61) groups (Figure 1C).
The combination of LIMD1 expression and other prognostic markers showed a better prediction effect. For example, groups of both LIMD1 high expression and stage II (mOS: 78.6 months), Lauren’s intestinal type (mOS: 113.0 months), male (mOS: 89.4 months), or HER2 non-amplification (mOS: 89.4 months) showed a rather optimistic prognosis (Figure 1D–F). At the same time, LIMD1 itself showed a stronger prognostic prediction effect than those well-known survival factors mentioned earlier. Surprisingly, the patients in the stage III, LIMD1 low subgroup exhibited a similar survival as short as the stage IV, LIMD1 high patients, while the stage IV patients have been considered to have much worse prognosis than stage III patients due to distant metastases (Figure 1D). Similarly, there was no significant survival difference between the intestinal subtype and the diffuse subtype in the LIMD1 low expression group (Figure 1E). Furthermore, regardless of the HER2 amplification status, patients with low expression of LIMD1 also indicated a shorter mOS than those with high expression of LIMD1 (Figure 1F).
LIMD1 impedes tumor growth in GC cells
To investigate the role of LIMD1 in tumor growth, we examined the levels of LIMD1 in four GC cell lines, including BGC823, SGC7901, MKN45, and MKN28. The former three cells expressed LIMD1 at different levels, while the expression of LIMD1 in MKN28 was barely probed (Figure 2A).
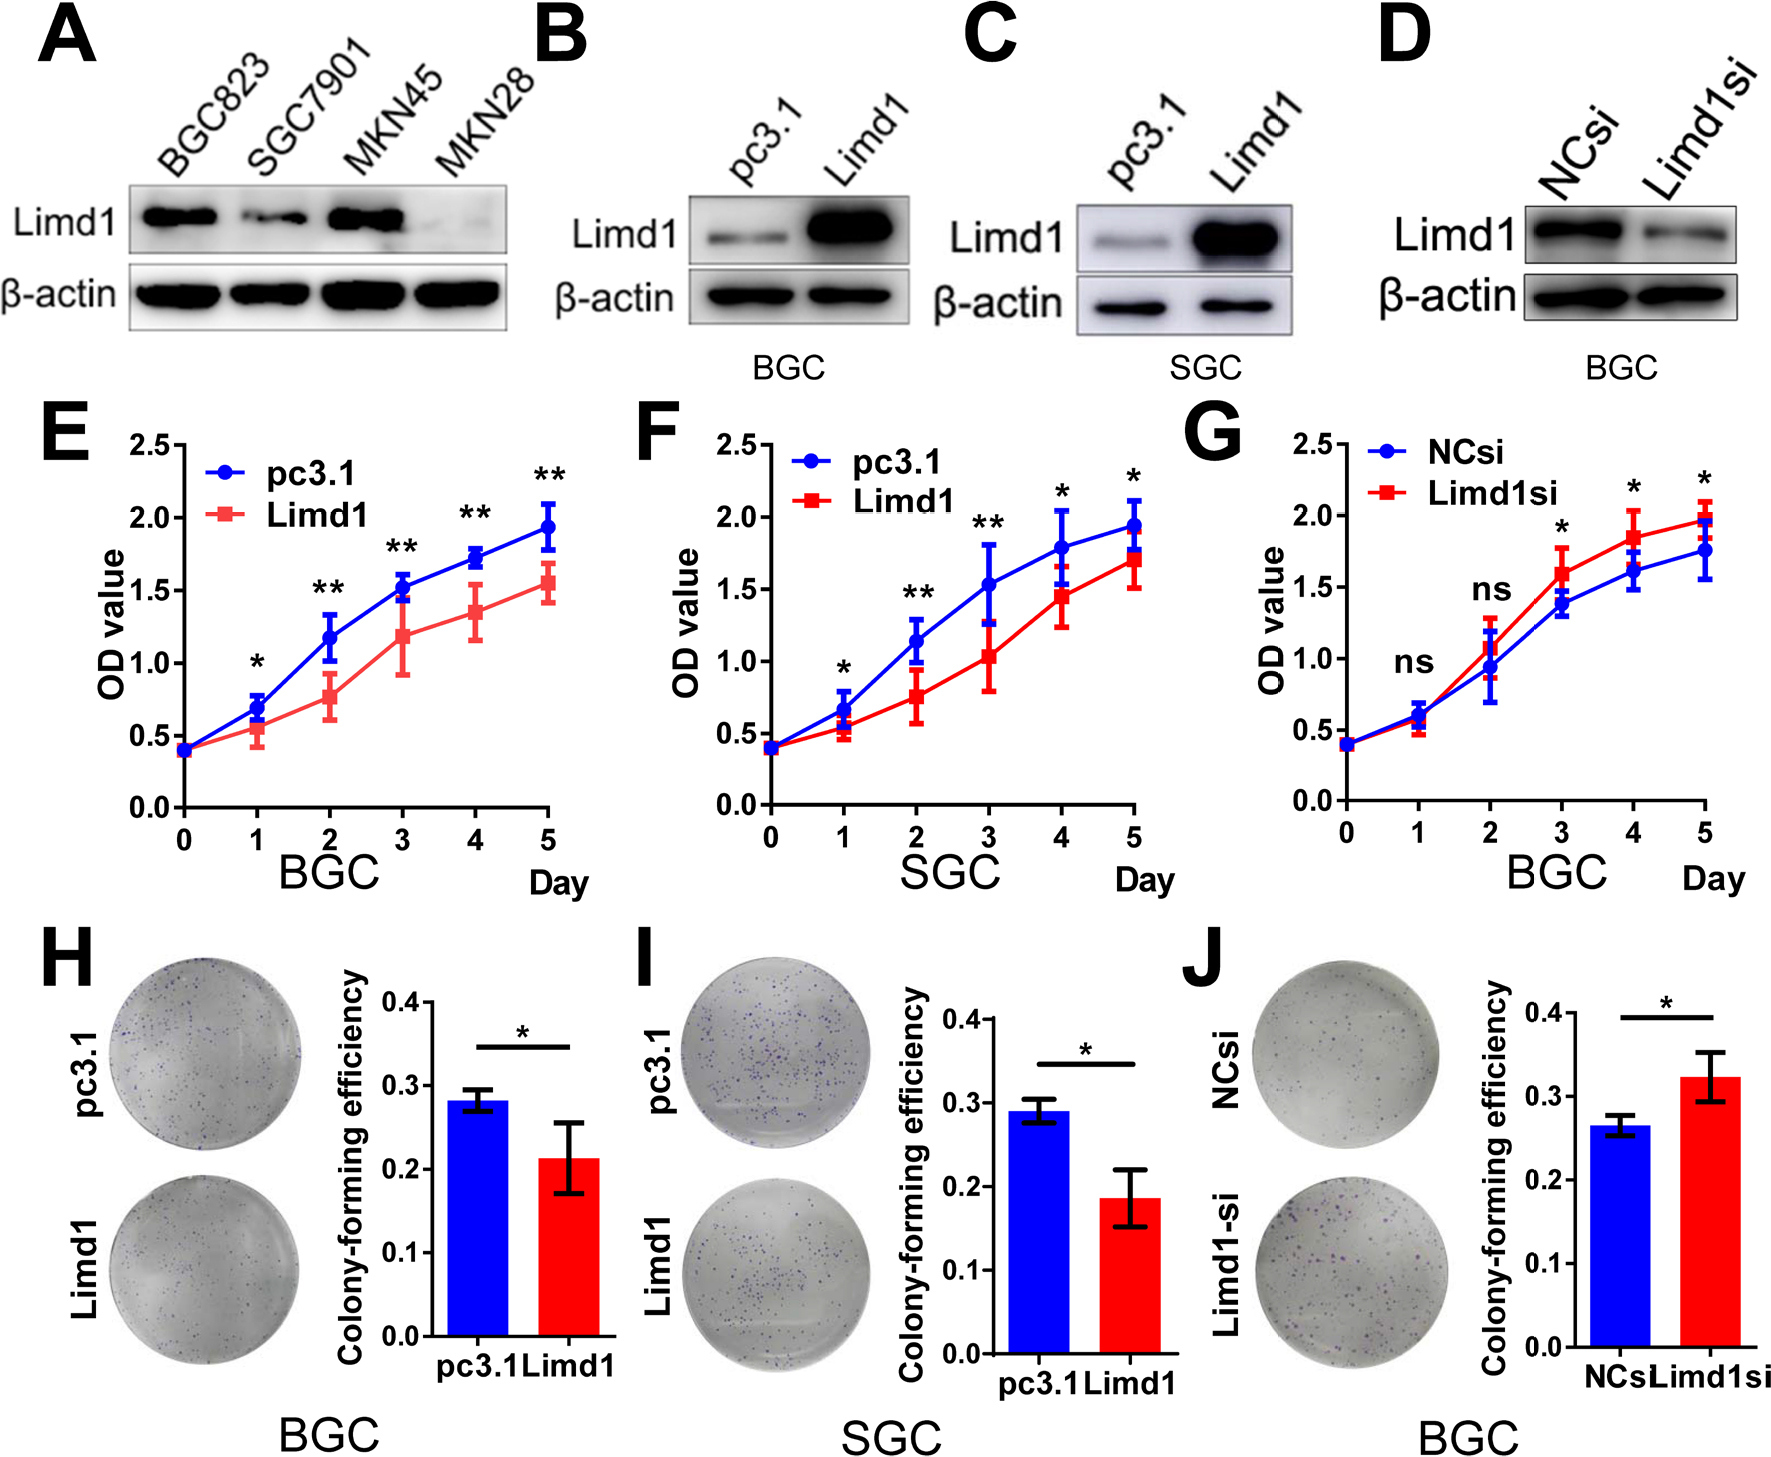 | Figure 2 LIMD1 impedes tumor growth in GC cell lines. Notes: (A) Western blot shows the expression level of LIMD1 in four GC cell lines, including BGC823, SGC7901, MKN45, and MKN28, (B, C) Western blot shows the LIMD1 expression levels in BGC823 and SGC7901 cells transfected with LIMD1 overexpression vector and empty vector. (D) LIMD1 expression levels in BGC823 cells transfected with LIMD1si and NCsi. (E–G). Proliferation curves of BGC823 and SGC7901 cells transfected with LIMD1 overexpression vector (E and F) and LIMD1-siRNA (G). (H–J). Colony formation assay of BGC823 and SGC7901 cells transfected with LIMD1 overexpression vector (H and I) and LIMD1-siRNA (J). The representing plates are shown on the left, and the quantification bars are shown on the right. Each panel represents at least three independent experiments. *P<0.05; **P<0.01. LIMD1, LIMD1 overexpression vector; pc3.1, empty vector. Abbreviations: GC, gastric cancer; LIMD1si, LIMD1-siRNA; NCsi, negative control siRNA; NS, no significance. |
Cell models of LIMD1 overexpression and downregulation were successfully established based on BGC823 and SGC7901 cells (Figure 2B–D). As expected, LIMD1 overexpression impeded cell proliferation in both cell lines (P<0.05; Figure 2E and F). In contrast, the downregulation of LIMD1 by siRNA significantly stimulated the proliferation of BGC823 cells (P<0.05 from the third day; Figure 2G). We further performed proliferation assay on MKN45 and MKN28 cell lines (Figure S1A and B), and the results also indicated that LIMD1 impeded cell proliferation in these cell lines (Figure S1C and D).
Anchorage-independent growth was evaluated by colony formation assays. The LIMD1-overexpressing cells lost partial anchorage-independent growth ability, with fewer numbers of colonies than the wild type in both cell lines (Figure 2H and I). LIMD1 overexpression significantly reduced their colony-forming efficiencies from 31.9% (empty vector group) to 21.3% (LIMD1 knocked-in group) in BGC823 cells (P=0.0317) and from 31.5% to 18.6% (P=0.0033) in SGC7901 cells, respectively (Figure 2H and I). Again, the LIMD1-downexpressing BGC823 cells showed a superior ability in colony formation (P=0.0229; Figure 2J). The anti-growth effect of LIMD1 was also confirmed in MKN45 and MKN28 cell lines (Figure S1E and F). Taken together, these data strongly suggested that LIMD1 impeded tumor growth and proliferation in GC cells.
LIMD1 inhibits cell motility and invasiveness of GC cells
Migration and invasion are essential steps for tumor metastasis. Therefore, we examined the role of LIMD1 in cell motility of GC. In BGC823 cells, the overexpression of LIMD1 significantly reduced the number of migrating and invading cells in migration (P<0.0001) and invasion assay (P=0.002), compared with the cells transfected with empty vectors (Figure 3A and D). The upregulation of LIMD1 led to similar results in SGC7901 cell line, with inferior ability to migrate (P=0.0045) and invade (P=0.0013) in the respective assays (Figure 3B and E). In accordance, the downregulation of LIMD1 by siRNA resulted in a significant increase in the number of invading and migrating cells in BGC823 cells (P=0.0342 and 0.0097, respectively; Figure 3C and F). We also observed the same effect of LIMD1 in MKN45 and MKN28 cell lines (Figure S1G–J). These data indicated that LIMD1 tended to inhibit the metastasis of GC cells.
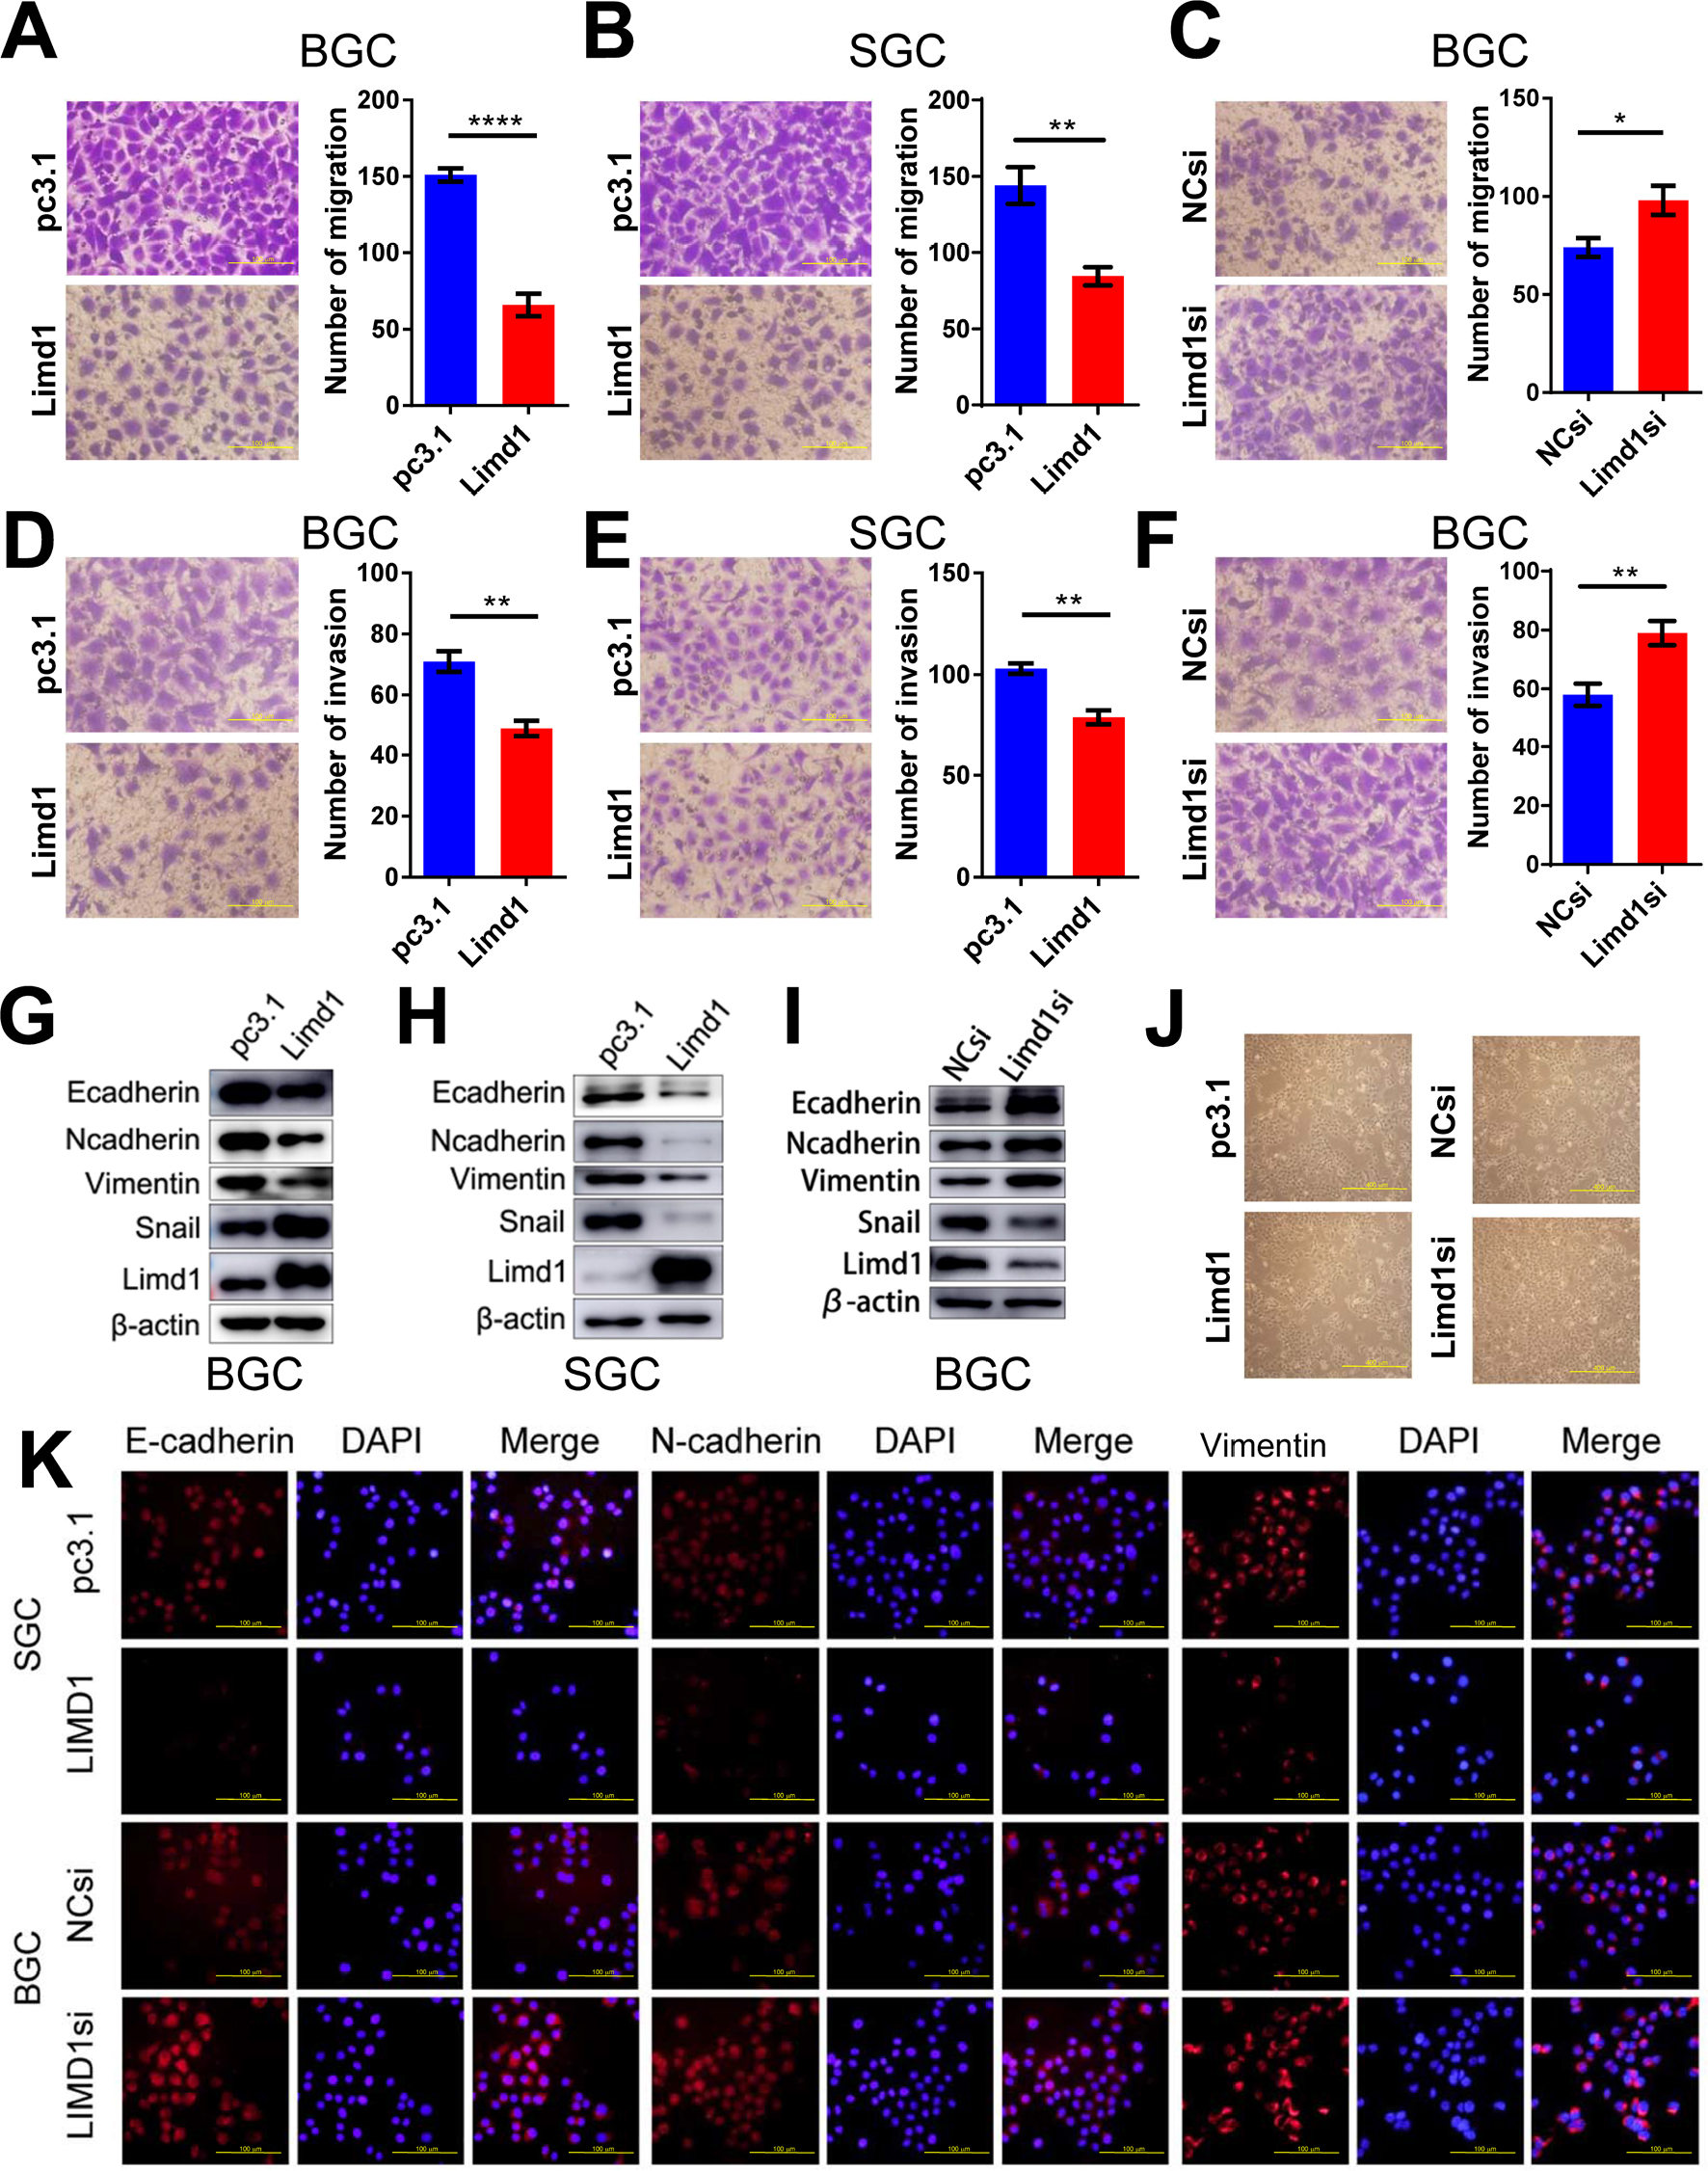 | Figure 3 LIMD1 inhibits cell migration and invasion in GC cells. Notes: (A–C). Cell migration assays of BGC823 and SGC7901 cells transfected with LIMD1 overexpression vector (A and B) and LIMD1si (C) are shown (40×). (D–F) Cell invasion assays of BGC823 and SGC7901 cells transfected with LIMD1 overexpression vector (D and E) and LIMD1si (F) are shown (40×). (G–I) LIMD1 alters EMT markers. Western blot analysis with the indicated antibodies in LIMD1-overexpressing (G and H) and LIMD1-downexpressing (I) GC cells is depicted. Cell morphology of BGC823 cells with altered LIMD1 is depicted in (J) (10×). Immunofluorescence assay of EMT markers, including E-cadherin, N-cadherin, and Vimentin, is shown in (K) (40×). *P<0.05; **P<0.01; ****P<0.0001. LIMD1, LIMD1 overexpression vector; pc3.1, empty vector. Abbreviations: EMT, epithelial to mesenchymal transition; GC, gastric cancer; LIMD1si, LIMD1-siRNA; NCsi, negative control siRNA. |
We further investigated the impact of LIMD1 on EMT by probing the related markers. We found that the epithelial marker E-cadherin was both downregulated in LIMD1-expressing GC cell lines and upregulated in the siRNA-treated BGC823 cells (Figure 3G–I). Surprisingly, the mesenchymal markers, N-cadherin and Vimentin, were also reduced by LIMD1 in both cell lines (Figure 3G–I). The regulatory effect of LIMD1 on Snail was not consistent in two cell lines; expression of Snail was enhanced in BGC823 cells (Figure 3G and I) but reduced in SGC7901 cells (Figure 3H). Alternation of LIMD1 did not lead to significant morphological change of BGC823 cells (Figure 3J). The changes of EMT markers on BGC823 cells caused by LIMD1 alternation were also confirmed by immunofluorescence assay (Figure 3K). Taken together, there is no sufficient evidence presently to demonstrate that LIMD1 inhibits GC cell metastasis through EMT.
LIMD1 suppresses YAP1 expression and its translocation from the cytoplasm into the nucleus
YAP1 is the major final effector of the Hippo signaling pathway: a tumor suppression pathway that is involved in oncogenesis of many types of cancers, including GC. When dephosphorylated and activated, YAP1 translocated from the cytoplasm into the nucleus and, in combination with p73, activated the oncogenic genes. Therefore, we tested whether LIMD1 exerted its biological significance in GC by regulating the Hippo-YAP1 pathway. Western blot analysis showed that LIMD1 negatively regulated total YAP1 expression in BGC823 and SGC7901 cells; the LIMD1-overexpressing cells had a decreased level of YAP1 (Figure 4A and B), and the cells with siRNA treatment showed an upregulated YAP1 (Figure 4C). To determine whether LIMD1 regulates Hippo signaling pathway, BGC823 cells transfected with LIMD1 siRNA and scramble siRNA were used to examine the subcellular localization of YAP1. The siRNA-treated cells had prominent nucleus translocation of YAP1 compared with the control group (Figure 4D). These results indicated that LIMD1 performed its tumor-suppressing function, at least partially, by regulating the Hippo pathway in GC cells.
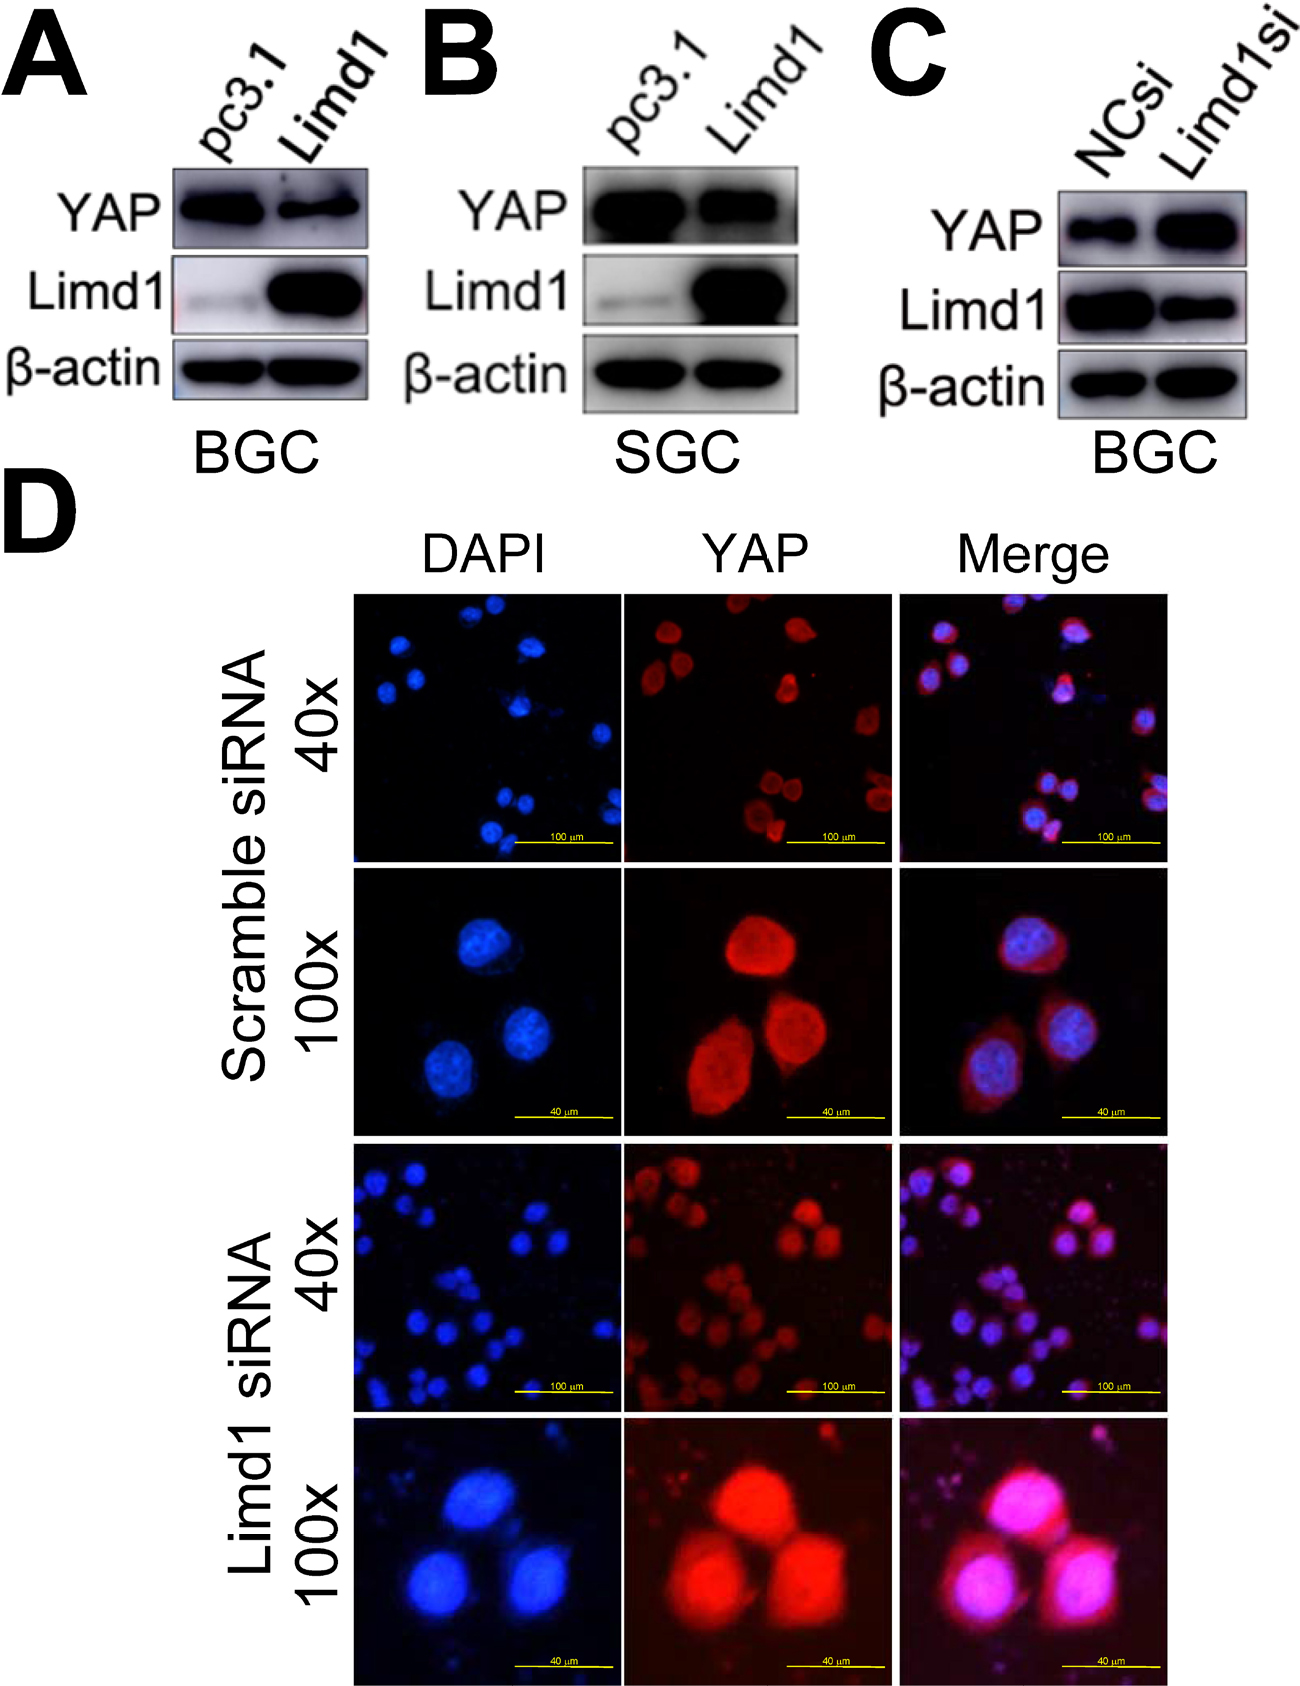 | Figure 4 LIMD1 suppresses YAP1 expression and translocation from the cytoplasm into the nucleus. Notes: (A–C) YAP1 expression in LIMD1-overexpressing (A and B) and LIMD1-downexpressing (C) GC cells is shown. The names of the cell lines are indicated below the panels. (D) Localization of YAP1 in BGC823 cells transfected with scramble siRNA and LIMD1 siRNA is shown by immunostaining of YAP1. Each panel represents at least three independent experiments. LIMD1, LIMD1 overexpression vector; pc3.1, empty vector. Abbreviations: GC, gastric cancer; LIMD1si, LIMD1-siRNA; mAb, monoclonal antibody; NCsi, negative control siRNA. |
The reduced expression of LIMD1 in GC was a result of gene deletion rather than DNA methylation
We analyzed the mRNA microarray data that were generated from 346 tissues and deposited in four datasets in Oncomine tool (www.oncomine.org; Figure 5A). The expression of LIMD1 was significantly downregulated in GC tissues compared to normal tissues in two of the four datasets (DErrico’s and Wang’s; Figure 5A). However, there was no significant difference between cancer and normal tissues in the other two datasets (Cho’s and Cui’s; Figure 5A).
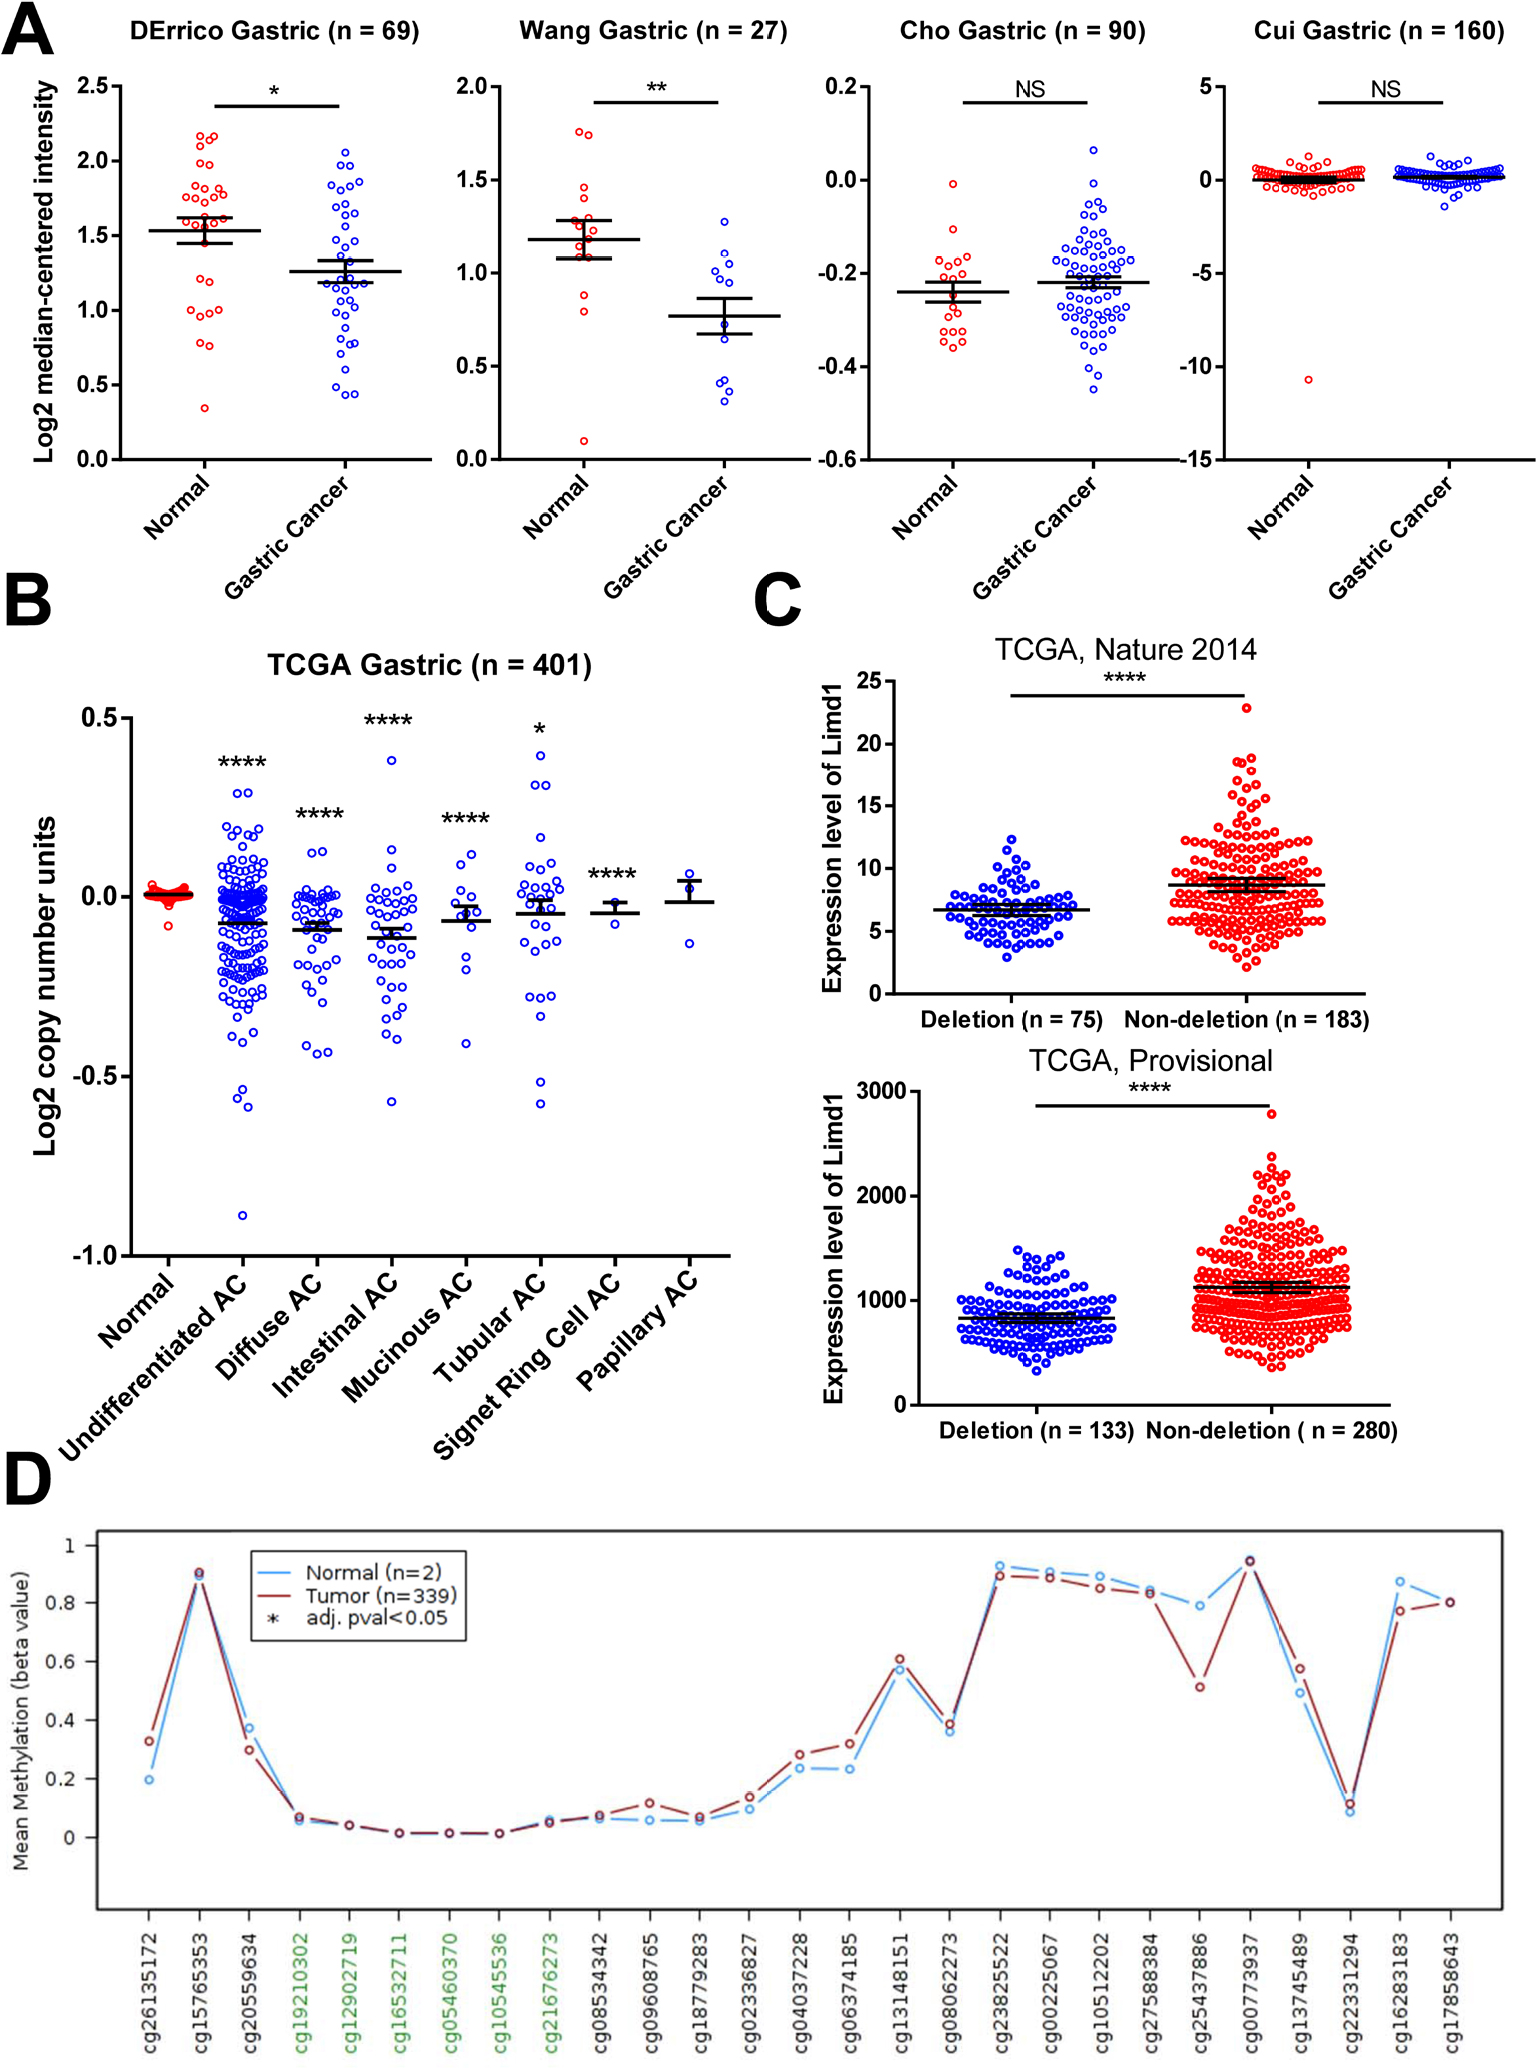 | Figure 5 Gene deletion contributes to the reduced expression of LIMD1. Notes: (A) LIMD1 expressions in mRNA profile datasets are shown. The names of the datasets are on the top of the figures. All the datasets were extracted from the Oncomine database. (B) Copy number variations in normal tissues and GC tissues with different pathological types are shown. The data were taken from TCGA database and extracted from Oncomine database. (C) LIMD1 levels between GC patients with and without LIMD1 deletions in tow cohorts are compared. The data were taken from TCGA database and extracted from cBioPortal database. *P<0.05; **P<0.01; ****P<0.0001. (D) Methylation levels throughout the region around LIMD1 gene between normal tissues and GC tumors are compared. Green probes indicate GpC islands. Abbreviations: AC, adenocarcinoma; GC, gastric cancer; NS, no significance; TCGA, The Cancer Genome Atlas. |
To explore the mechanism of reduction in LIMD1 in some GC cohorts, we investigated the copy number variation of LIMD1 gene, with respect to its location within the C3CER1 region. We analyzed the public TCGA data using the Oncomine tool and found that almost all pathological types of gastric adenocarcinoma, including undifferentiated, diffuse, intestinal, mucinous, tubular, and signet ring cell type, carried significantly fewer copy numbers of LIMD1 than the normal tissues (Figure 5B). Analyzed by the cBioPortal tool (http://www.cbioportal.org/), the patients with the deletion of LIMD1 gene showed significantly lower expression level compared with those with no deletion in two TCGA datasets (Figure 5C). DNA methylation is another major cause of decreased expression of LIMD1 in some other cancers. Therefore, we also analyzed the methylation status of LIMD1 gene from TCGA database using the online tool Wanderer (http://maplab.imppc.org/wanderer).41 No significances were detected in the LIMD1 region with 27 probes, including six for the CpG islands, between GC and normal tissues (Figure 5D). These data indicated that the deletion of LIMD1 gene, rather than DNA methylation, may contribute to the low expression of LIMD1 in patients with GC.
Discussion
GC is a common malignant tumor, with relatively high rates of morbidity, metastasis, and mortality as well as low rates of early diagnosis, radical resection, and 5-year survival.1,2 Due to the lack of specific symptoms and the tendency to metastasize early with obscure mechanism, the diagnosis is frequently made at an advanced stage, and the patients lose the chance of radical treatment. In addition, the prevalence of heterogeneity in GC tissues resulted in limited value of many common prognostic predictors. LIMD1 is a tumor suppressor that has been found recently to inhibit tumor metastasis and is downregulated in many human tumors. The mechanism is mainly based on genetic changes such as promoter methylation, gene deletion, gene mutation, and gene silencing. It is closely related to the poor prognosis in breast cancer30 and head and neck squamous cell carcinoma (HNSCC).42 However, studies of LIMD1 in GC have not been reported.
In this study, the LIMD1 upregulation correlated with a superior prognosis, with respect to both OS and PFS in GC. The prognostic role of LIMD1 was significant regardless of the stage, tumor size, lymph node, metastasis, Lauren’s classification (except for the mixed type), differentiation, gender, treatment, and ERBB2 amplification status. Particularly, LIMD1 shows a significant predictive efficacy over previous indicators. In addition, the combination of LIMD1 expression and commonly used pathological parameters can screen out predominant populations with better prognosis of GC. These results show that LIMD1 has a superior prognostic power for GC and may exceed most of the biomarkers known to date.
Invasion and metastasis are the basic features of malignant tumors, and they are also a major cause of poor prognosis and high mortality in GC patients.3 In this study, LIMD1 reduced the aggressiveness of GC cells by the inhibition of cell proliferation, anchorage-independent growth, and cell migration and invasion. The tumor-suppressing role in regulating GC cell phenotypes was similar as in previous studies in lung and breast cancers.26,27,29,30 This highly suggested that LIMD1 may play a strong inhibitory role in the occurrence and development of GC.
In breast cancer, LIMD1 hinders the tumor’s invasiveness by repressing Snail and inhibiting E-cadherin expression within the nucleus.26,30 Delocalization of LIMD1 from the nucleus releases this repression and contributes to breast cancer metastasis.26,30 Our results confirmed that LIMD1 inhibited the invasion and migration of GC cells in vitro, so we first examined whether LIMD1 acts through EMT pathway. Although LIMD1 could downregulate E-cadherin expression, expressions of N-cadherin and Vimentin were also suppressed. Therefore, we speculated that LIMD1 inhibited the tumor cell metastasis not through EMT. In fact, LIMD1 may exert its antitumor function through different mechanisms in oncogenesis and progression. In lung cancers, LIMD1 inhibits tumor development by interacting with pRB to repress E2F-responsive transcriptions. Loss of LIMD1 leads to misregulation of this pathway and, as a consequence, acceleration of the cell cycle.27 This mechanism has been validated in the mouse carrying genotypes with LIMD1 knockout and K-Ras mutation.29
In the present study, we identified another pathway, the Hippo signaling pathway, which is involved in tumor-suppressing role of LIMD1 and different from those in lung cancer and breast cancer.26,27,29,30 YAP1 activation may lead to opposite outcomes depending on transcription genes, either onco-promoting or onco-suppressing. In the stomach, YAP1 silencing suppresses proliferation, colony formation, and mobility of GC cells in vitro and in vivo.36,37 Moreover, YAP1 overexpression was found in GC patients and correlated with metastasis and shortened OS.38,39 Therefore, the activated YAP1, both in expression level and nuclear translocation level, should account for the greater aggressive behavior in LIMD1 low-expression GC cells. The mechanisms underlying how LIMD1 regulates YAP1 are yet elusive. We may draw lessons from one study in Drosophila in which Ajuba LIMD1 and other LIM proteins interact with Warts (homolog of LATS) and Sav (homolog of WW45) to inhibit phosphorylation of Yki (homolog of YAP1).28 This regulating role of LIMD1 in Hippo pathway needs to be further validated in mammal cells.
Despite the obvious onco-promoting property of LIMD1 silencing, variation was found in the differential expression profiles of LIMD1 between GC patients and normal controls. LIMD1 mRNA levels were reduced in GC tissues compared with normal tissues in only two of four datasets. In another study of breast cancer, the expression level of LIMD1 was also found to be unchanged in tumors compared with controls.43 This variation may be explained by the divergence among cohorts or detection methods, and thus larger cohorts with reliable testing approaches are required for accurate conclusions. The unchanged LIMD1 mRNA expression is probably the result of a negative feedback. LIMD1 is regulated by tension at focal adhesions, and thus the tension alteration among GC cells might induce LIMD1 expression through certain pathways.44 Besides, we only analyzed the online data at mRNA level, and the LIMD1 expression at the protein level needs to be further examined for investigating the translation and posttranslational fates of LIMD1.
Regardless of the variation between GC and normal tissues, an inter-tumor difference of LIMD1 expression exists. According to previous studies, genetic deletion is responsible for the reduced LIMD1 expression in lung cancer and HNSCC.29,42 This is theoretically reasonable due to its location within the C3CER1 region.17 C3CER1 is known to harbor multiple tumor suppressor genes, and deletions in this region are common in solid malignancies, including lung, breast, gastric, colorectal, and ovarian cancers.45 We identified a similar trend in GC, and the copy number variation indeed correlated positively with LIMD1 expression. As an alternative, epigenetic inactivation via promoter hypermethylation on LIMD1 gene was also reported in lung cancer and HNSCC.29,42 However, we did not find hypermethylation around the region of LIMD1 gene in GC tissues.
Conclusion
LIMD1 is a positive prognostic marker in GC, and its underexpression might be a molecular abnormality linked to the oncogenesis and metastasis of GC. Genetic deletion of LIMD1 may be responsible for LIMD1 downregulation, the subsequent YAP1 activation, and tumor progression in GC. LIMD1 and the downstream proteins could also be used as potential predictive marker and therapeutic target to improve the prognosis of GC patients. These conclusions are yet to be studied and confirmed in animal models and clinical trials.
Acknowledgments
This study was supported by the National Natural Science Foundation of China (NSFC 81172487 to Lian Liu and 81500092 to Song Li) and Natural Science Foundation of Shandong Province, China (ZR201702180008 to Lian Liu). We appreciated Dr Jixin Dong from the University of Nebraska Medical Center for his generous gift of the LIMD1 overexpression plasmid.
Author contributions
Study design: Song Li, Wenbin Yu, and Lian Liu. Acquisition of data: Di Zhang, Cheng Chen, Zeyi Zhao, and Yiting Sun. Analysis and interpretation of data: Di Zhang, Song Li, Wenbin Yu, and Lian Liu. Manuscript preparation: Di Zhang, Song Li, Wenbin Yu, and Lian Liu. Statistical analysis: Di Zhang, Song Li, Wenbin Yu, and Lian Liu. All authors contributed toward data analysis, drafting and critically revising the paper and agree to be accountable for all aspects of the work.
Disclosure
The authors report no conflicts of interest in this work.
References
Ferlay J, Soerjomataram I, Dikshit R, et al. Cancer incidence and mortality worldwide: sources, methods and major patterns in GLOBOCAN 2012. Int J Cancer. 2015;136(5):E359–E386. | ||
Fitzmaurice C, Allen C, et alGlobal Burden of Disease Cancer Collaboration, et al. Global, Regional, and National Cancer Incidence, Mortality, Years of Life Lost, Years Lived With Disability, and Disability-Adjusted Life-years for 32 Cancer Groups, 1990 to 2015: A Systematic Analysis for the Global Burden of Disease Study. JAMA Oncol. 2017;3(4):524–548. | ||
van Cutsem E, Sagaert X, Topal B, Haustermans K, Prenen H. Gastric cancer. Lancet. 2016;388(10060):2654–2664. | ||
Kong F, Qi Y, Liu H, et al. Surgery combined with chemotherapy for recurrent gastric cancer achieves better long-term prognosis. Clin Transl Oncol. 2015;17(11):917–924. | ||
Cidón EU. Gastric cancer and the search for a good prognostic classification: a challenge. Clin Exp Gastroenterol. 2010;3:113–116. | ||
Cruz-Reyes C, Gamboa-Dominguez A. HER2 amplification in gastric cancer is a rare event restricted to the intestinal phenotype. Int J Surg Pathol. 2013;21(3):240–246. | ||
Zhang Y, Wu S. Novel therapy for advanced gastric cancer. World J Gastrointest Oncol. 2015;7(11):263–270. | ||
Digklia A, Wagner AD. Advanced gastric cancer: Current treatment landscape and future perspectives. World J Gastroenterol. 2016;22(8):2403–2414. | ||
Hartgrink HH, Jansen EP, van Grieken NC, van de Velde CJ. Gastric cancer. Lancet. 2009;374(9688):477–490. | ||
Jomrich G, Schoppmann SF. Targeted therapy in gastric cancer. Eur Surg. 2016;48(5):278–284. | ||
Bang YJ, Van Cutsem E, ToGA Trial Investigators, et al. Trastuzumab in combination with chemotherapy versus chemotherapy alone for treatment of HER2-positive advanced gastric or gastro-oesophageal junction cancer (ToGA): a phase 3, open-label, randomised controlled trial. Lancet. 2010;376(9742):687–697. | ||
Li J, Qin S, Xu J, et al. Randomized, Double-Blind, Placebo-Controlled Phase III Trial of Apatinib in Patients With Chemotherapy-Refractory Advanced or Metastatic Adenocarcinoma of the Stomach or Gastroesophageal Junction. J Clin Oncol. 2016;34(13):1448–1454. | ||
Lordick F, Kang YK, et alArbeitsgemeinschaft Internistische Onkologie and EXPAND Investigators, et al. Capecitabine and cisplatin with or without cetuximab for patients with previously untreated advanced gastric cancer (EXPAND): a randomised, open-label phase 3 trial. Lancet Oncol. 2013;14(6):490–499. | ||
Ohtsu A, Shah MA, van Cutsem E, et al. Bevacizumab in combination with chemotherapy as first-line therapy in advanced gastric cancer: a randomized, double-blind, placebo-controlled phase III study. J Clin Oncol. 2011;29(30):3968–3976. | ||
Ohtsu A, Ajani JA, Bai YX, et al. Everolimus for previously treated advanced gastric cancer: results of the randomized, double-blind, phase III GRANITE-1 study. J Clin Oncol. 2013;31(31):3935–3943. | ||
Oue N, Hamai Y, Mitani Y, et al. Gene expression profile of gastric carcinoma: identification of genes and tags potentially involved in invasion, metastasis, and carcinogenesis by serial analysis of gene expression. Cancer Res. 2004;64(7):2397–2405. | ||
Kiss H, Kedra D, Yang Y, et al. A novel gene containing LIM domains (LIMD1) is located within the common eliminated region 1 (C3CER1) in 3p21.3. Hum Genet. 1999;105(6):552–559. | ||
Bach I. The LIM domain: regulation by association. Mech Dev. 2000;91(1-2):5–17. | ||
Zabarovsky ER, Lerman MI, Minna JD. Tumor suppressor genes on chromosome 3p involved in the pathogenesis of lung and other cancers. Oncogene. 2002;21(45):6915–6935. | ||
Yang Q, Yoshimura G, Mori I, Sakurai T, Kakudo K. Chromosome 3p and breast cancer. J Hum Genet. 2002;47(9):453–459. | ||
Senchenko V, Liu J, Braga E, et al. Deletion mapping using quantitative real-time PCR identifies two distinct 3p21.3 regions affected in most cervical carcinomas. Oncogene. 2003;22(19):2984–2992. | ||
Reznikoff CA, Belair CD, Yeager TR, et al. A molecular genetic model of human bladder cancer pathogenesis. Semin Oncol. 1996;23(5):571–584. | ||
Velickovic M, Delahunt B, Störkel S, Grebem SK. VHL and FHIT locus loss of heterozygosity is common in all renal cancer morphotypes but differs in pattern and prognostic significance. Cancer Res. 2001;61(12):4815–4819. | ||
Feng Y, Longmore GD. The LIM protein Ajuba influences interleukin-1-induced NF-kappaB activation by affecting the assembly and activity of the protein kinase Czeta/p62/TRAF6 signaling complex. Mol Cell Biol. 2005;25(10):4010–4022. | ||
James V, Zhang Y, Foxler DE, et al. LIM-domain proteins, LIMD1, Ajuba, and WTIP are required for microRNA-mediated gene silencing. Proc Natl Acad Sci U S A. 2010;107(28):12499–12504. | ||
Langer EM, Feng Y, Zhaoyuan H, Rauscher FJ, Kroll KL, Longmore GD. Ajuba LIM proteins are snail/slug corepressors required for neural crest development in Xenopus. Dev Cell. 2008;14(3):424–436. | ||
Sharp TV, Munoz F, Bourboulia D, et al. LIM domains-containing protein 1 (LIMD1), a tumor suppressor encoded at chromosome 3p21.3, binds pRB and represses E2F-driven transcription. Proc Natl Acad Sci U S A. 2004;101(47):16531–16536. | ||
das Thakur M, Feng Y, Jagannathan R, Seppa MJ, Skeath JB, Longmore GD. Ajuba LIM proteins are negative regulators of the Hippo signaling pathway. Curr Biol. 2010;20(7):657–662. | ||
Sharp TV, Al-Attar A, Foxler DE, et al. The chromosome 3p21.3-encoded gene, LIMD1, is a critical tumor suppressor involved in human lung cancer development. Proc Natl Acad Sci U S A. 2008;105(50):19932–19937. | ||
Spendlove I, Al-Attar A, Watherstone O, et al. Differential subcellular localisation of the tumour suppressor protein LIMD1 in breast cancer correlates with patient survival. Int J Cancer. 2008;123(10):2247–2253. | ||
Hou X, Li T, Ren Z, Liu Y. Novel BRCA2-Interacting Protein, LIMD1, Is Essential for the Centrosome Localization of BRCA2 in Esophageal Cancer Cell. Oncol Res. 2016;24(4):247–253. | ||
Pan D. The hippo signaling pathway in development and cancer. Dev Cell. 2010;19(4):491–505. | ||
Yu FX, Zhao B, Panupinthu N, et al. Regulation of the Hippo-YAP pathway by G-protein-coupled receptor signaling. Cell. 2012;150(4):780–791. | ||
Beyer TA, Weiss A, Khomchuk Y, et al. Switch enhancers interpret TGF-β and Hippo signaling to control cell fate in human embryonic stem cells. Cell Rep. 2013;5(6):1611–1624. | ||
Slattery M, Voutev R, Ma L, Nègre N, White KP, Mann RS. Divergent transcriptional regulatory logic at the intersection of tissue growth and developmental patterning. PLoS Genet. 2013;9(9):e1003753. | ||
Kang W, Tong JH, Chan AW, et al. Yes-associated protein 1 exhibits oncogenic property in gastric cancer and its nuclear accumulation associates with poor prognosis. Clin Cancer Res. 2011;17(8):2130–2139. | ||
Zhou Z, Zhu JS, Gao CP, et al. siRNA targeting YAP gene inhibits gastric carcinoma growth and tumor metastasis in SCID mice. Oncol Lett. 2016;11(4):2806–2814. | ||
Song M, Cheong JH, Kim H, Noh SH, Kim H. Nuclear expression of Yes-associated protein 1 correlates with poor prognosis in intestinal type gastric cancer. Anticancer Res. 2012;32(9):3827–3834. | ||
da CL, Xin Y, Zhao J, Luo XD. Significance and relationship between Yes-associated protein and survivin expression in gastric carcinoma and precancerous lesions. World J Gastroenterol. 2009;15(32):4055–4061. | ||
Szász AM, Lánczky A, Nagy Á, et al. Cross-validation of survival associated biomarkers in gastric cancer using transcriptomic data of 1,065 patients. Oncotarget. 2016;7(31):49322–49333. | ||
Díez-Villanueva A, Mallona I, Peinado MA. Wanderer, an interactive viewer to explore DNA methylation and gene expression data in human cancer. Epigenetics Chromatin. 2015;8:22. | ||
Ghosh S, Ghosh A, Maiti GP, et al. Alterations of 3p21.31 tumor suppressor genes in head and neck squamous cell carcinoma: Correlation with progression and prognosis. Int J Cancer. 2008;123(11):2594–2604. | ||
Huggins CJ, Andrulis IL. Cell cycle regulated phosphorylation of LIMD1 in cell lines and expression in human breast cancers. Cancer Lett. 2008;267(1):55–66. | ||
Ibar C, Kirichenko E, Keepers B, Enners E, Fleisch K, Irvine KD. Tension-dependent regulation of mammalian Hippo signaling through LIMD1. J Cell Sci. 2018;131(5):jcs214700. | ||
Petursdottir TE, Thorsteinsdottir U, Jonasson JG, et al. Interstitial deletions including chromosome 3 common eliminated region 1 (C3CER1) prevail in human solid tumors from 10 different tissues. Genes Chromosomes Cancer. 2004;41(3):232–242. |
Supplementary material
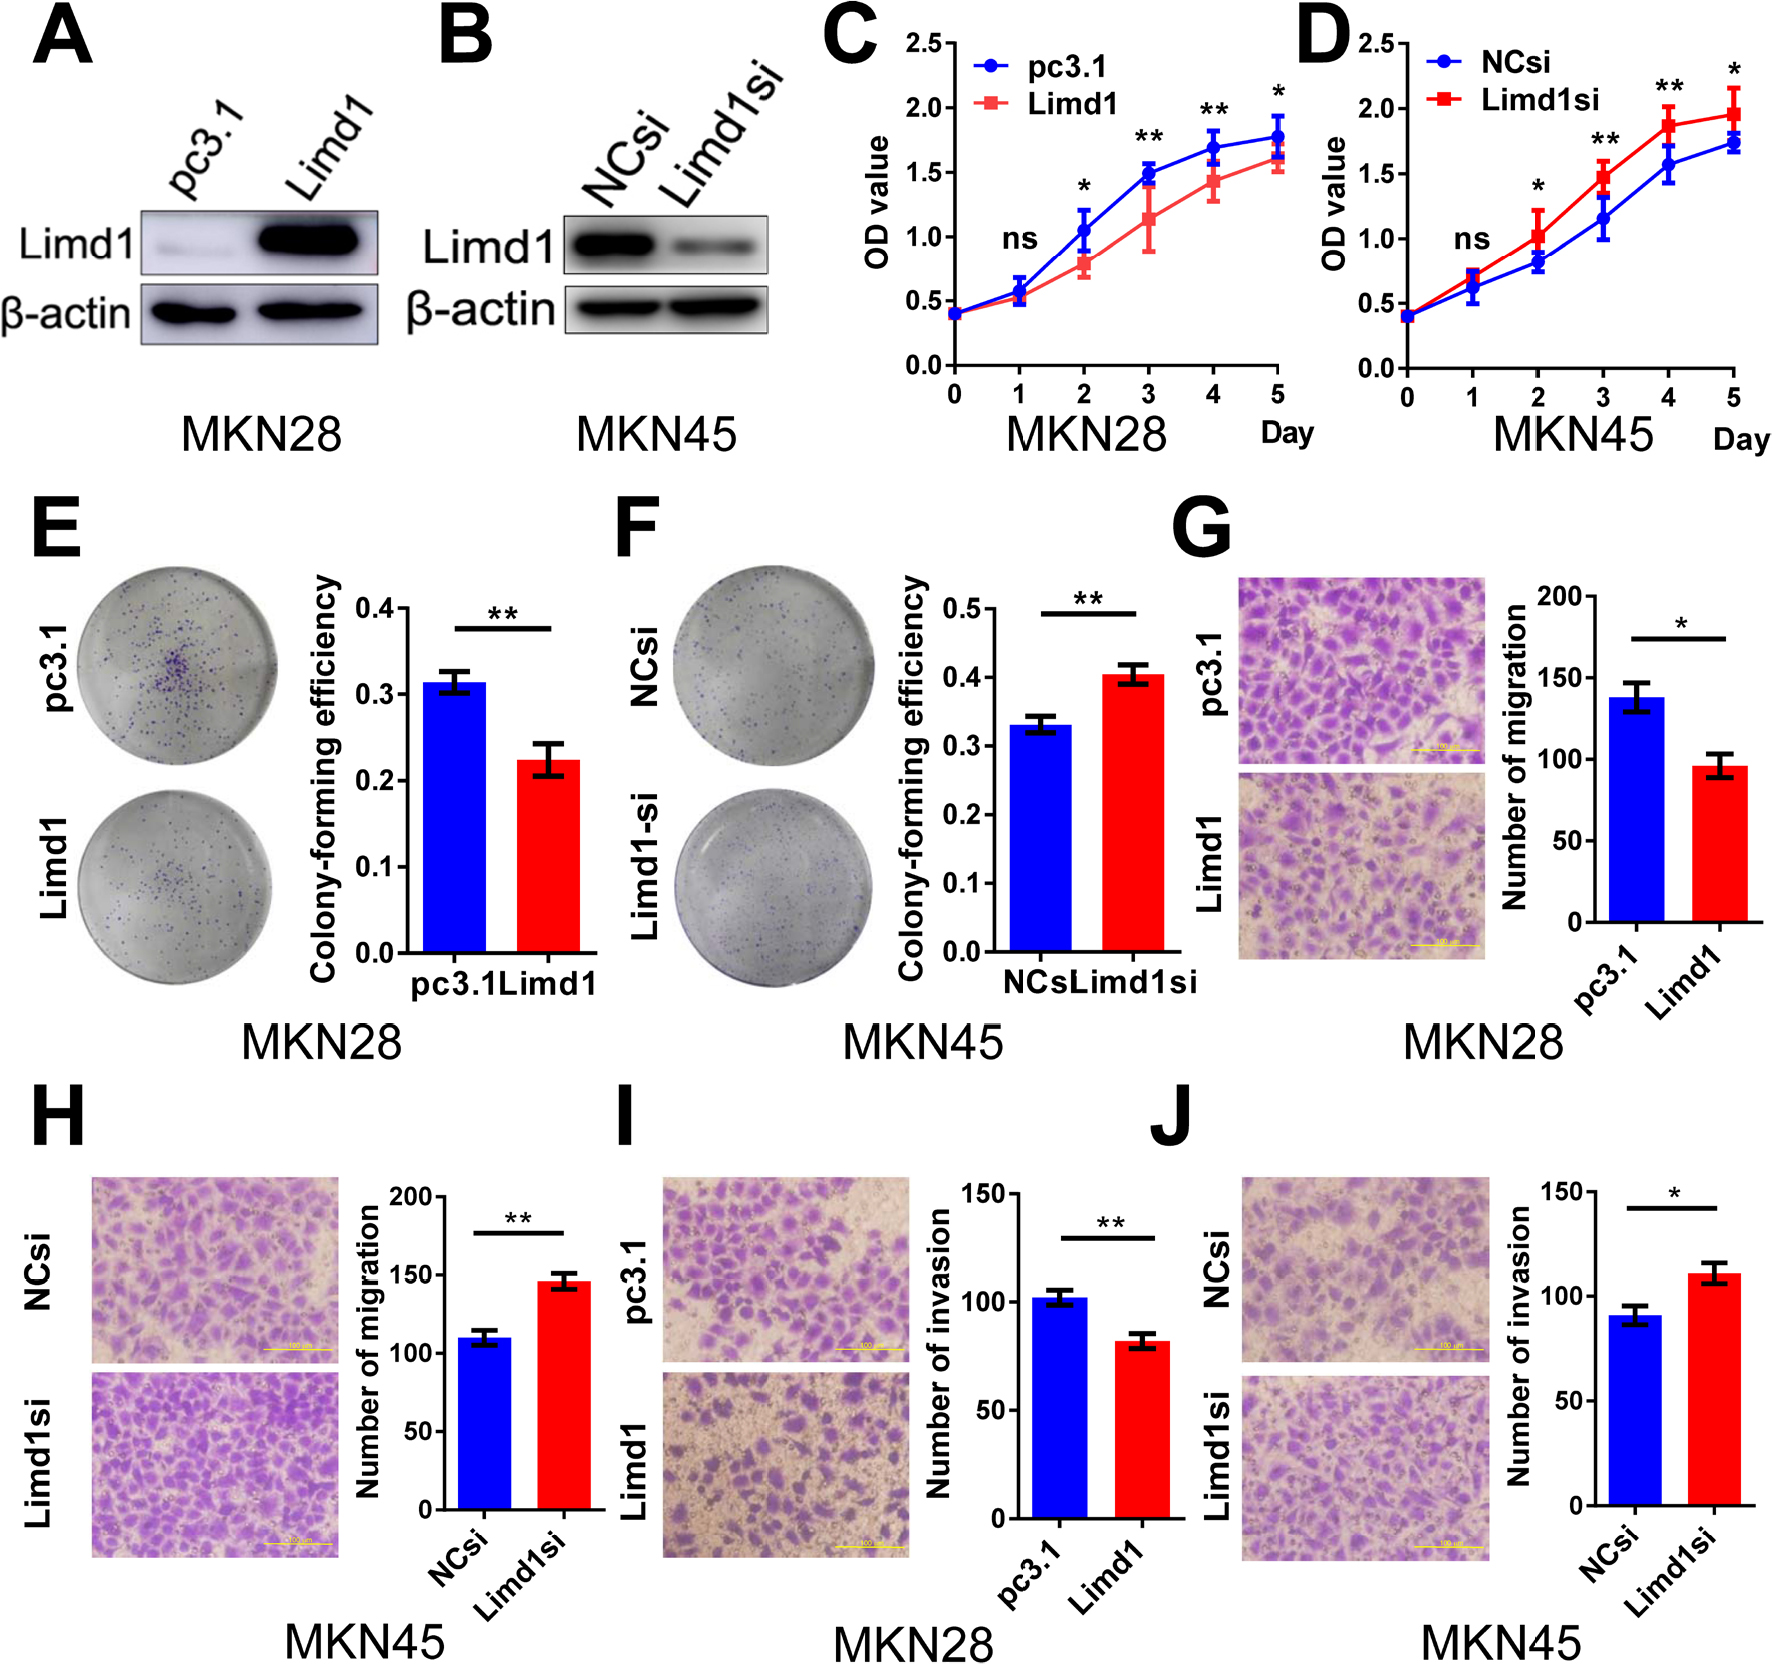 | Figure S1 LIMD1 impedes tumor growth in GC cell lines. Notes: (A, B) Western blot shows that the LIMD1 expression levels in MKN28 cells transfected with LIMD1 overexpression vector (A) and MKN45 cells transfected with LIMD1-siRNA (B). (C, D) Proliferation curves of MKN28 cells transfected with LJMD1 overexpression vector (C) and MKN45 cells transfected with LIMD1-siRNA (D). (E, F) Colony formation assay of MKN28 cells transfected with LIMD1 overexpression vector (E) and MKN45 cells transfected with LIMD1-siRNA (F). (G, H) Cell migration assays of MKN28 cells transfected with LIMD1 overexpression vector (G) and MKN45 cells transfected with LIMD1-siRNA (H). (l, J) Cell invasion assays of MKN28 cells transfected with LIMD1 overexpression vector (I) and MKN45 cells transfected with LIMD1-siRNA (J). The representing plates are shown on the left, and the quantification bars are shown on the right in (E–J). All the microscopy assays were pictured under 40×. Each panel represents at least three independent experiments. *P<0.05; **P<0.01. LIMD1, LIMD1 overexpression vector; pc3.1, empty vector. Abbreviations: GC, gastric cancer; LIMD1si, LIMD1-siRNA; NCsi, negative control siRNA; NS, no significance. |
 © 2018 The Author(s). This work is published and licensed by Dove Medical Press Limited. The full terms of this license are available at https://www.dovepress.com/terms.php and incorporate the Creative Commons Attribution - Non Commercial (unported, v3.0) License.
By accessing the work you hereby accept the Terms. Non-commercial uses of the work are permitted without any further permission from Dove Medical Press Limited, provided the work is properly attributed. For permission for commercial use of this work, please see paragraphs 4.2 and 5 of our Terms.
© 2018 The Author(s). This work is published and licensed by Dove Medical Press Limited. The full terms of this license are available at https://www.dovepress.com/terms.php and incorporate the Creative Commons Attribution - Non Commercial (unported, v3.0) License.
By accessing the work you hereby accept the Terms. Non-commercial uses of the work are permitted without any further permission from Dove Medical Press Limited, provided the work is properly attributed. For permission for commercial use of this work, please see paragraphs 4.2 and 5 of our Terms.